Precise temporal control of neuroblast migration through combined regulation and feedback of a Wnt receptor
- Hubrecht Institute, Royal Netherlands Academy of Arts and Sciences and University Medical Center Utrecht, Netherlands
- Department of Physics and Astronomy, Purdue University, United States
- Institut de Biologie de l'Ecole Normale Supérieure, CNRS, INSERM, France
- Department of Physics and Astronomy, University of Pittsburgh, United States
- Institute of Biodynamics and Biocomplexity, Department of Biology, Utrecht University, Netherlands
Figures
Figure 1 with 1 supplement
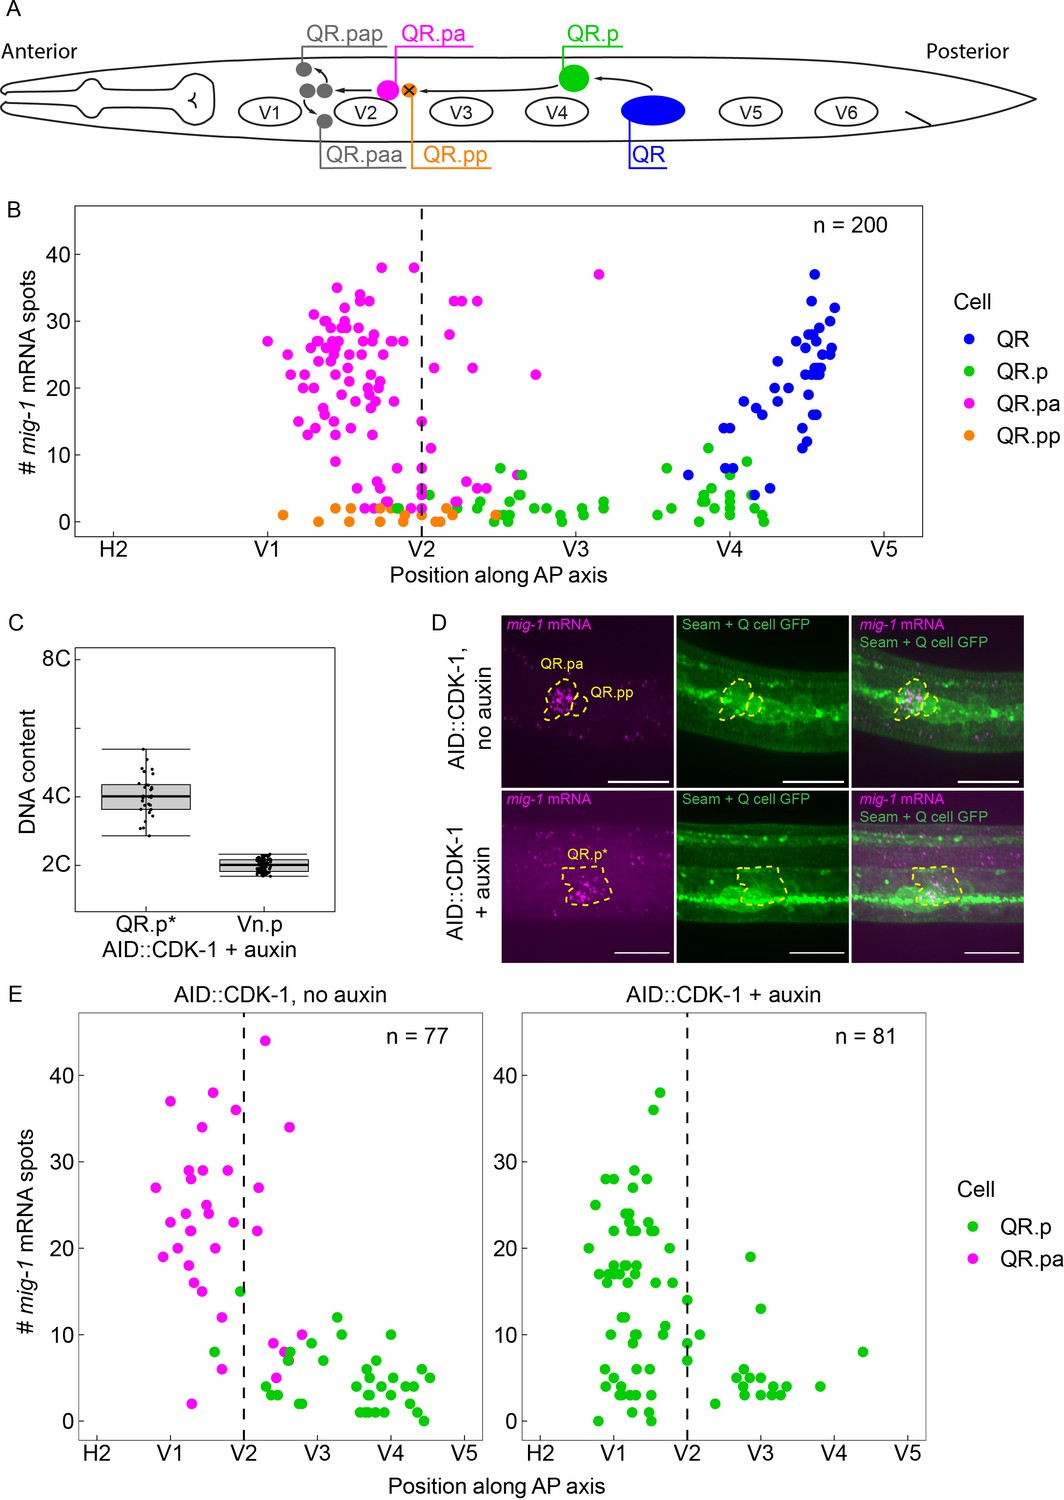
The time-dependent expression of mig-1 is independent of QR.p division.
(A) Schematic representation of the QR lineage and the migration of the QR descendants. V1–V6 are seam cells, used as landmarks to determine the position of QR and its descendants. For clarity, the QR.a branch of the QR lineage is not represented. (B) Single-molecule FISH (smFISH) quantification of mig-1 expression in QR and its descendants relative to the position of the seam cells H2 to V5. n=200 from 11 independent experiments, with three replicates each. (C) DNA content in division-blocked QR.p (QR.p*), relative to 2C (Vn.p) seam cells. The DNA content of QR.p* does not significantly deviate from 4C (p=0.31, n=32, from five independent experiments, with three replicates each), indicating the cells do not undergo an additional S-phase after the division is blocked. Whiskers represent 1.5x interquartile range. (D) Representative images of mig-1 smFISH spots in cdk-1(hu277[AID::cdk-1]). Top: control without auxin and bottom: QR.p division is blocked in the presence of auxin. Scale bar is 10 µm. Green Fluorescent Protein (GFP) is expressed in the seam cells and the Q neuroblast descendants (heIs63; Wildwater et al., 2011). (E) smFISH quantification of mig-1 expression in QR and its descendants relative to the position of the seam cells H2 to V5 in cdk-1(hu277[AID::cdk-1]) in the absence (left) and presence (right) of auxin. Data are from seven independent experiments, with three replicates each.
Figure 1—figure supplement 1
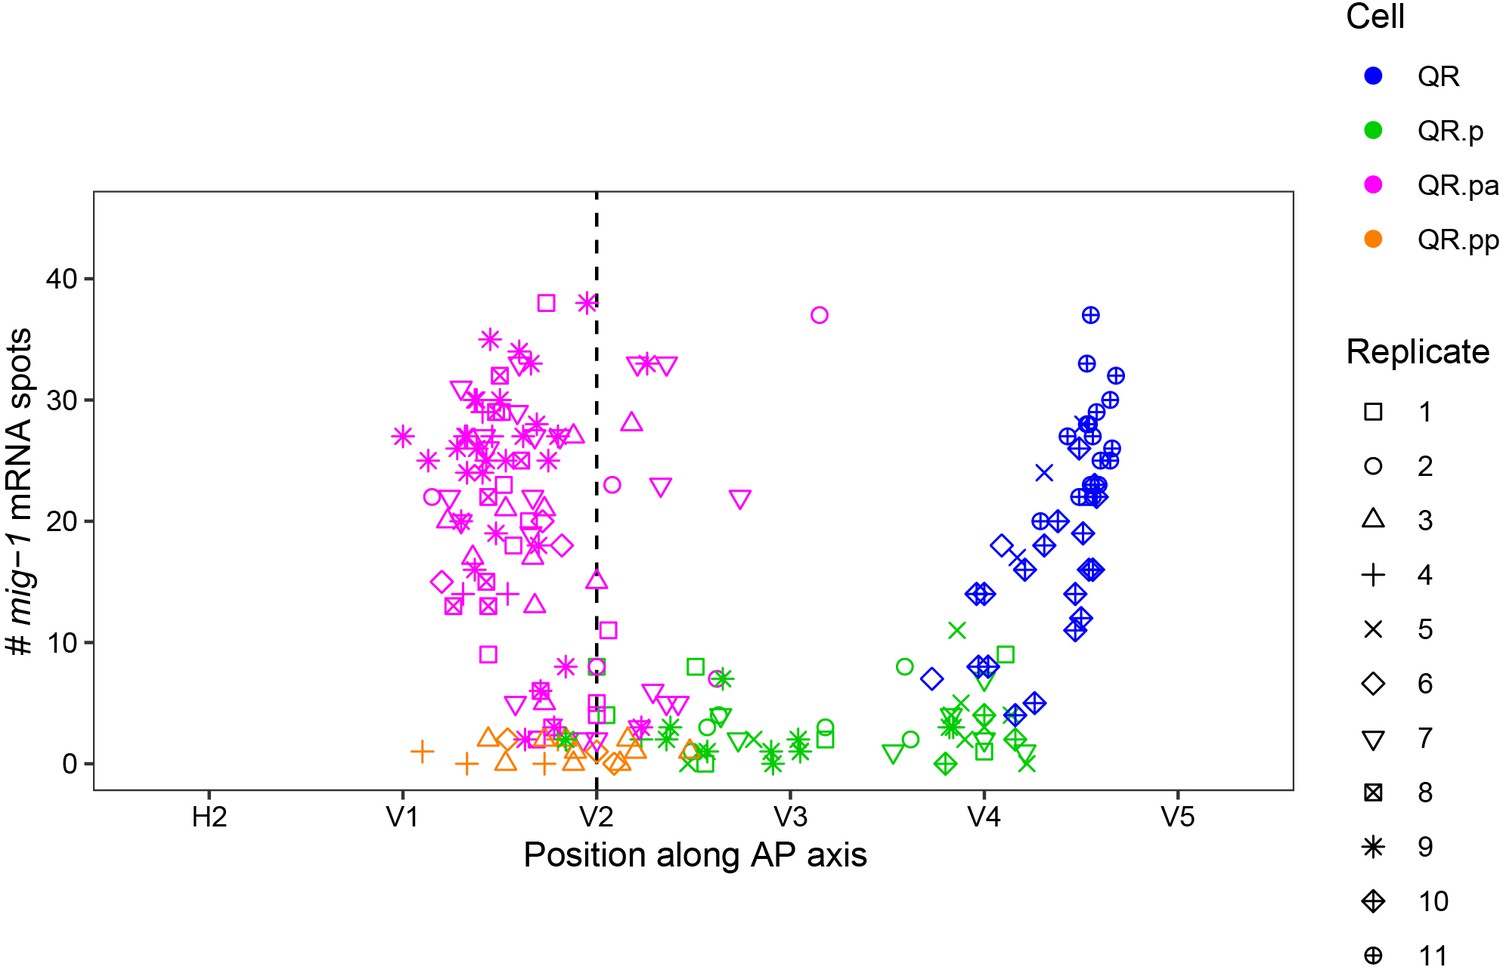
mig-1 single-molecule FISH (smFISH) spot counts from Figure 1B in the different replicate experiments.
Figure 2 with 3 supplements
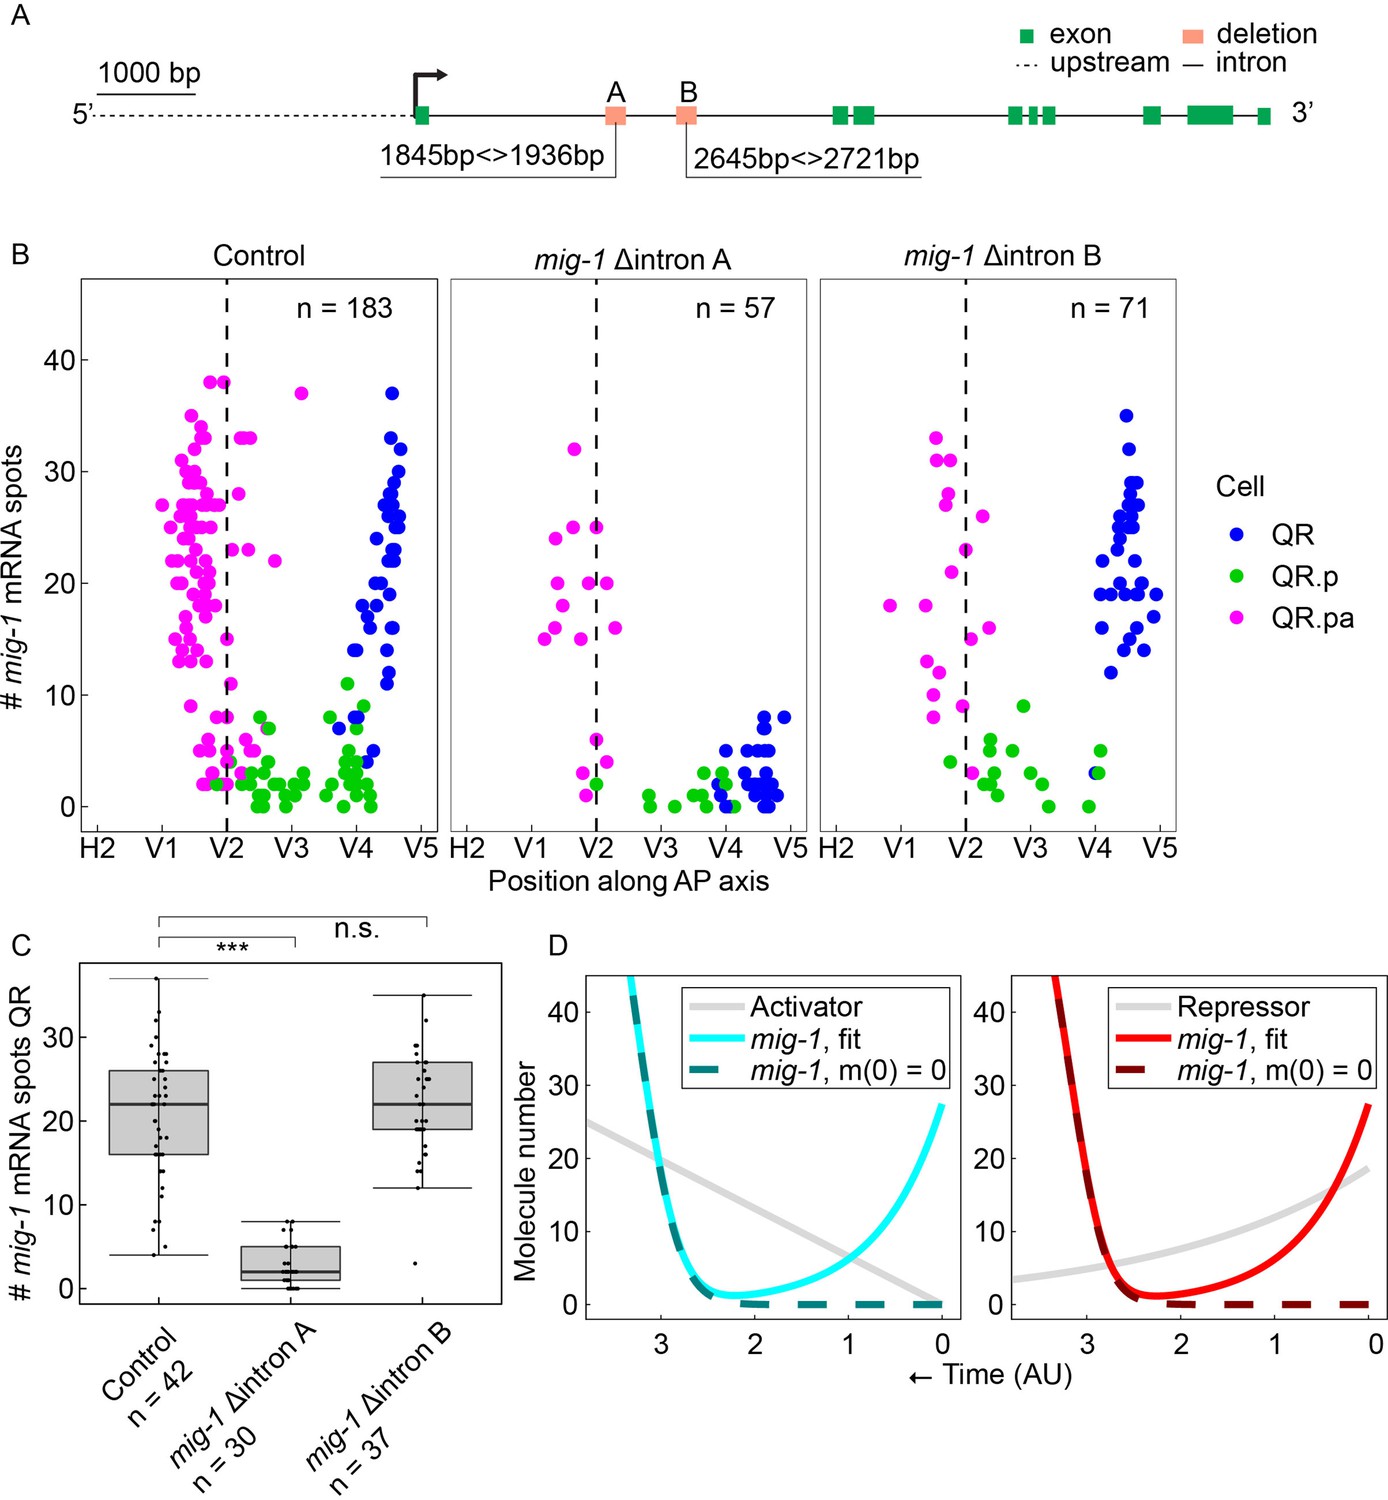
A conserved region in the first intron of mig-1 controls the early but not the late phase of mig-1 expression.
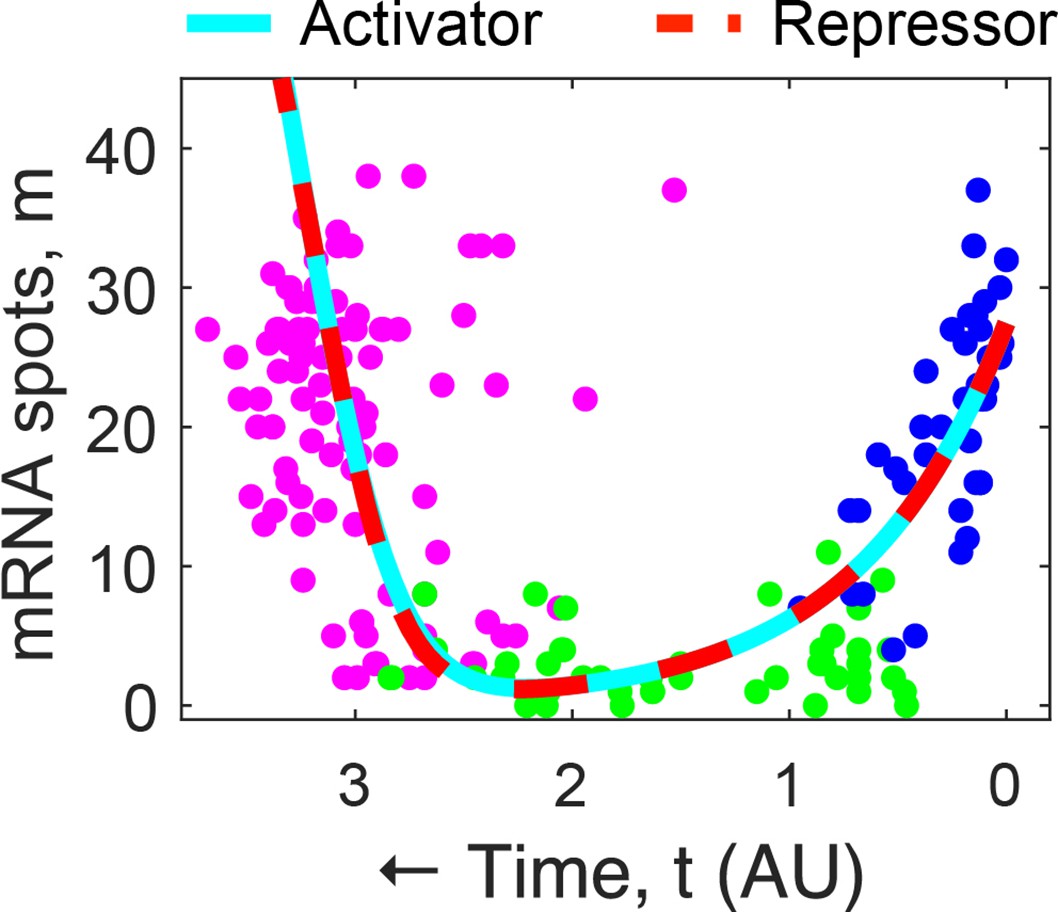
(A) Schematic representation of the two conserved intron regions that were deleted from the mig-1 locus. Green rectangles are exons, the gray dashed line is the upstream region, and black solid lines are introns. The orange rectangles represent the deleted regions that contain intron motif pair A (Δintron A) and intron motif pair B (Δintron B). Data are from three independent experiments, with three replicates each. (B) Single-molecule FISH (smFISH) quantification of mig-1 expression in QR and its descendants relative to the position of the seam cells H2 to V5 in control and the intron deletion mutants hu295 (intron deletion A) and hu299 (intron deletion B). AP, anteroposterior. (C) Quantification of mig-1 smFISH spots in QR (***p<0.0001, n=30, Welch’s t-test). Whiskers represent 1.5x interquartile range. (D) Mathematical model for the mig-1 dynamics regulated by an increasing activator (left) or decreasing repressor (right), fit to the control data (see Materials and methods and Figure 2-figure supplement 3). The sequences of the intron motifs in 23 different Caenorhabditis species are in Figure 2—figure supplement 1. Figure 2—figure supplement 2 shows that deletion of the intron motif pairs does not significantly change the final position of QR.pap.
Figure 2—figure supplement 1
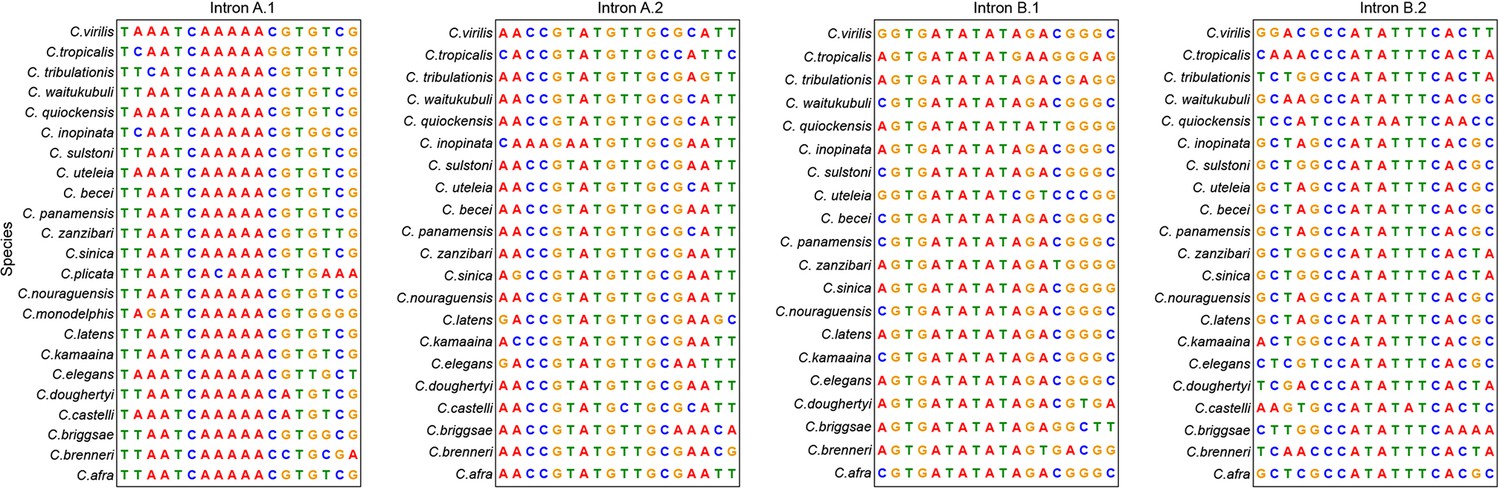
Conserved motifs in the first intron of mig-1 in 23 different Caenorhabditis species.
Intron motifs A.1 and A.2 are in intron motif pair A and motifs B.1 and B.2 in intron motif pair B.
Figure 2—figure supplement 2
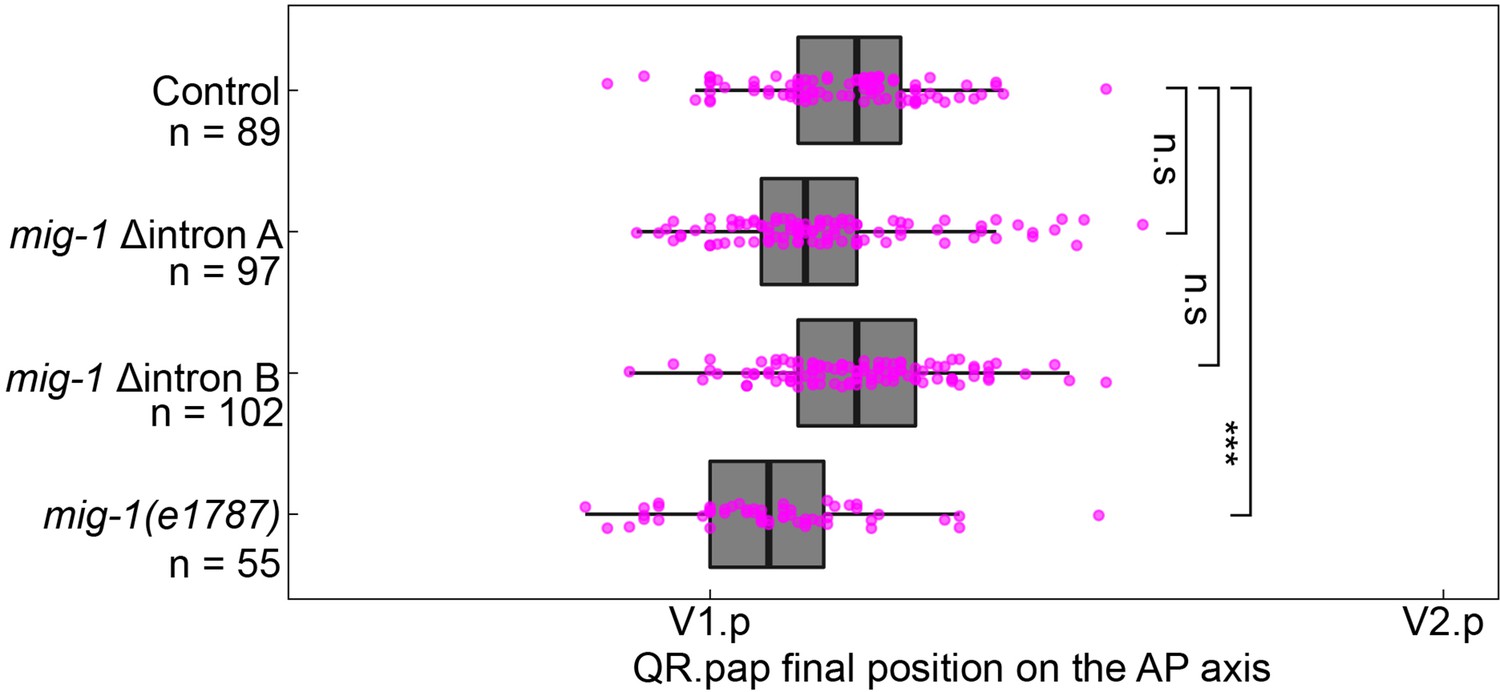
Deletion of intron motif pair A and B does not significantly change the final position of QR.pap.
The position of QR.pap relative to the seam cells V1.p and V2.p in control, the two mig-1 intron deletions, and the mig-1(e1787) loss-of-function allele. AP, anteroposterior. mig-1(e1787), p<0.0001, n=55. Welch’s t-test, data are from three independent experiments with three replicates each. Whiskers represent 1.5x interquartile range.
Figure 2—figure supplement 3
Overlay of fits from Figure 2D on mig-1 single-molecule FISH (smFISH) data from Figure 2B.
Figure 3 with 2 supplements
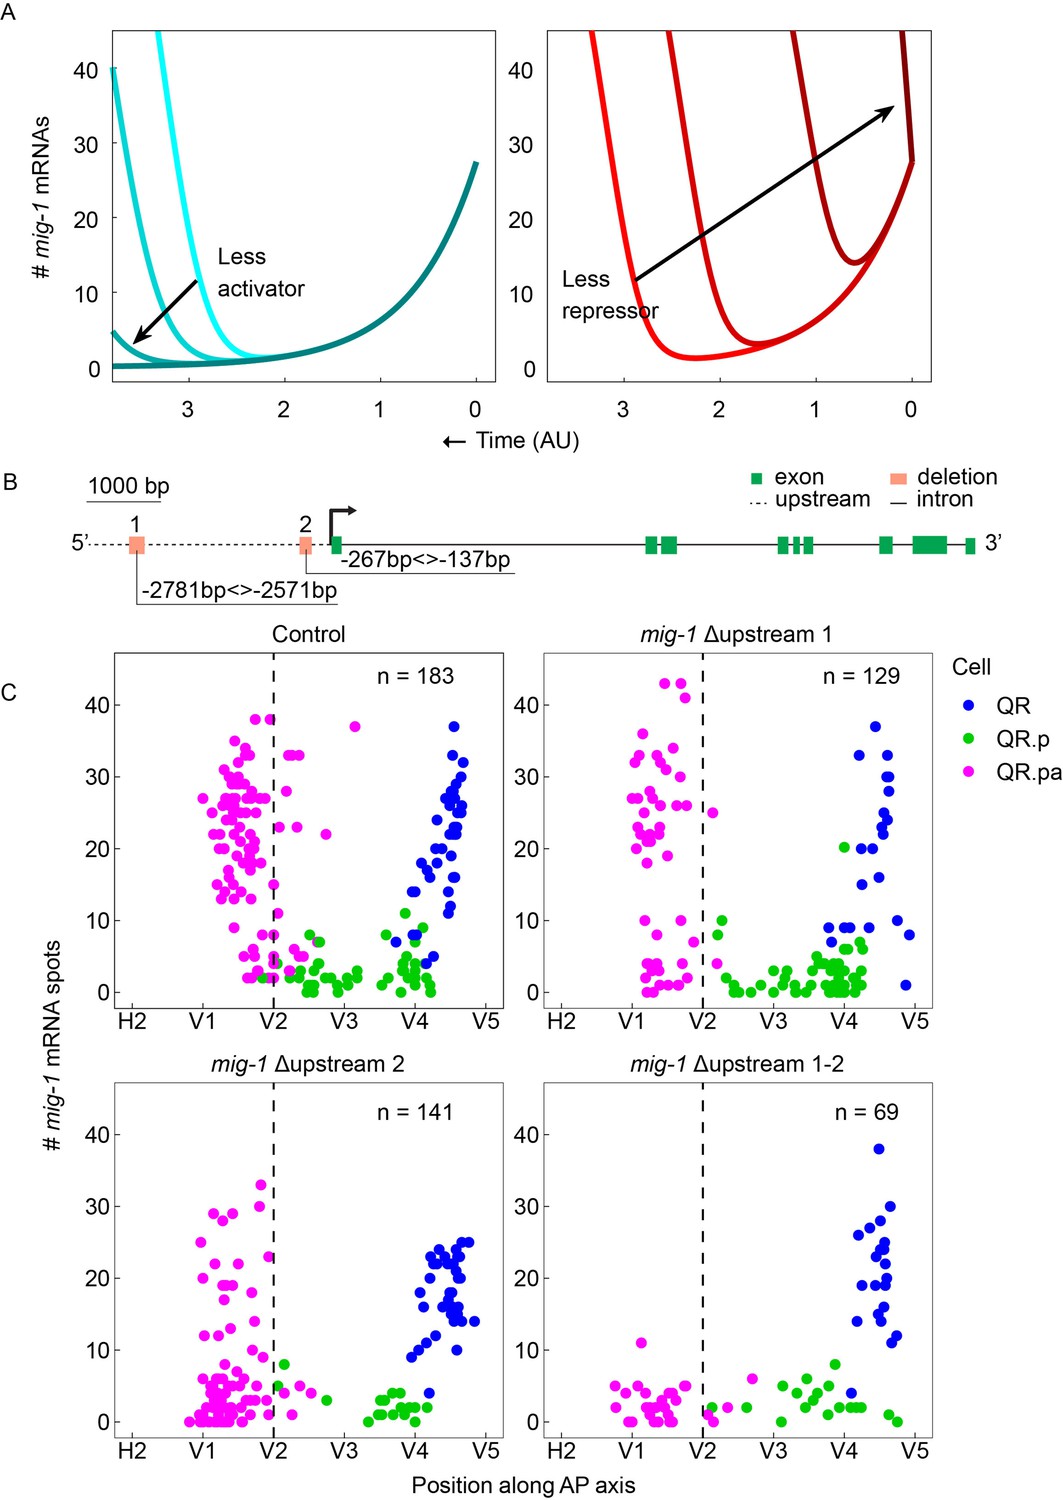
Two conserved regions upstream of mig-1 control the late but not the early phase of mig-1 expression.
(A) Mathematical model with decreasing activator production rates (left) or decreasing initial repressor numbers (right). (B) Schematic representation of the two conserved regions in the mig-1 upstream sequence. Green rectangles are exons, the gray dashed line is the upstream region, and black solid lines are introns. The orange rectangles represent the deleted regions that contain upstream motif pair #1 (Δupstream 1) and upstream motif pair #2 (Δupstream 2). (C) Single-molecule FISH (smFISH) quantification of mig-1 expression in QR and its descendants relative to the position of the seam cells H2 to V5 in control and deletion mutants of the two regions upstream of mig-1. None of the deletions affect the early phase of mig-1 expression in the QR neuroblast (hu314 Δupstream 1), p=0.59, n=22; hu315 (Δupstream 2), p=0.07, n=40; hu335 (Δupstream 1–2), p=0.89, n=22, Welch’s t-test. The upregulation of mig-1 expression in QR.pa is not significantly changed in Δupstream 1 (p=0.44, n=51) but is significantly reduced in Δupstream 2 (p<0.0001, n=83) and abolished in the double Δupstream 1–2 deletion (p<0.0001, n=29). Data are from eight independent experiments with three replicates for Δupstream 1 and 2 and three independent experiments with three replicates for the double Δupstream 1–2 deletion. The sequences of the upstream motifs in 23 different Caenorhabditis species are in Figure 3—figure supplement 1. Figure 3—figure supplement 2 shows the effect of the upstream motif pair deletions on the final position of QR.pap.
Figure 3—figure supplement 1
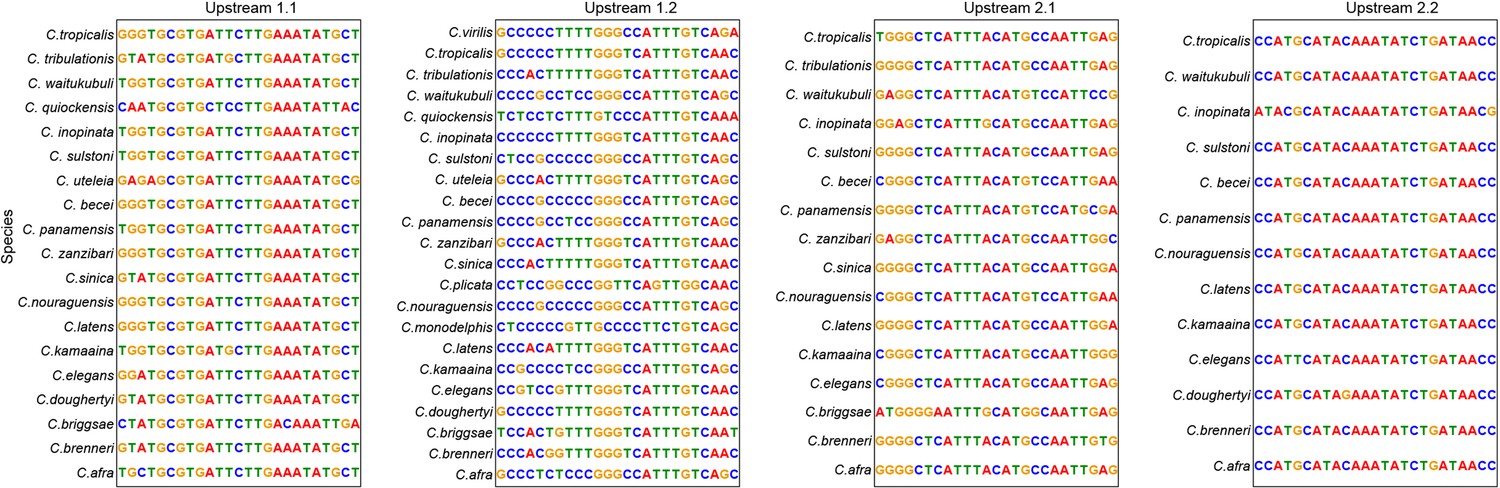
Conserved motifs in the upstream region of mig-1 in 23 different Caenorhabditis species.
Upstream motifs 1.1 and 1.2 are in upstream pair #1 and motifs 2.1 and 2.2 in upstream pair #2.
Figure 3—figure supplement 2
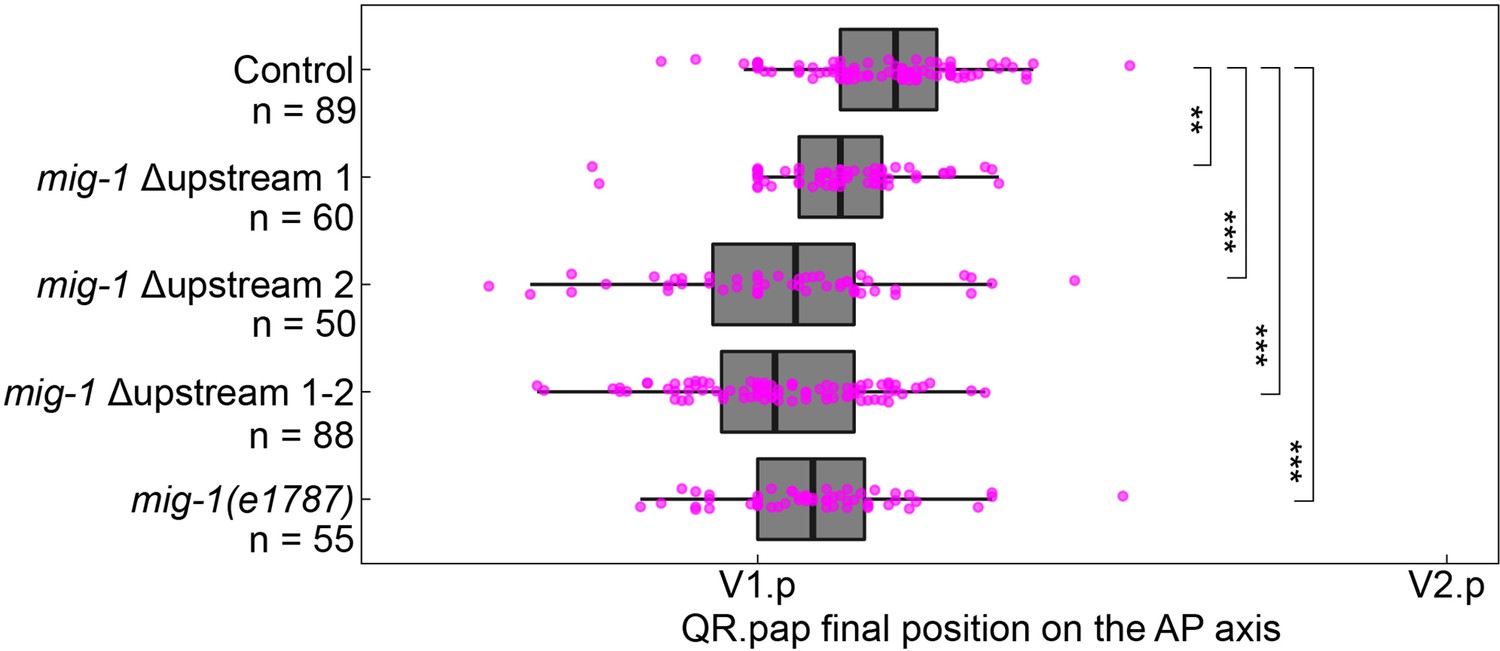
Deletion of upstream motif pair 1 and 2 induces significant overmigration of QR.pap.
The position of QR.pap relative to the seam cells V1.p and V2.p of control, the single and double deletions of the mig-1 upstream motif pairs, and the mig-1(e1787) loss-of-function allele. All upstream motif pair deletion mutants showed significant overmigration of QR.pap hu314 (upstream motif pair 1): p=0.0017, n=60; hu315 (upstream motif pair 2): p<0.0001, n=50; hu335 (upstream motif pair 1–2 double mutant): p<0.0001, n=88, Welch’s t-test. Data are from three independent experiments with three replicates each. Whiskers represent 1.5x interquartile range.
Figure 4 with 1 supplement
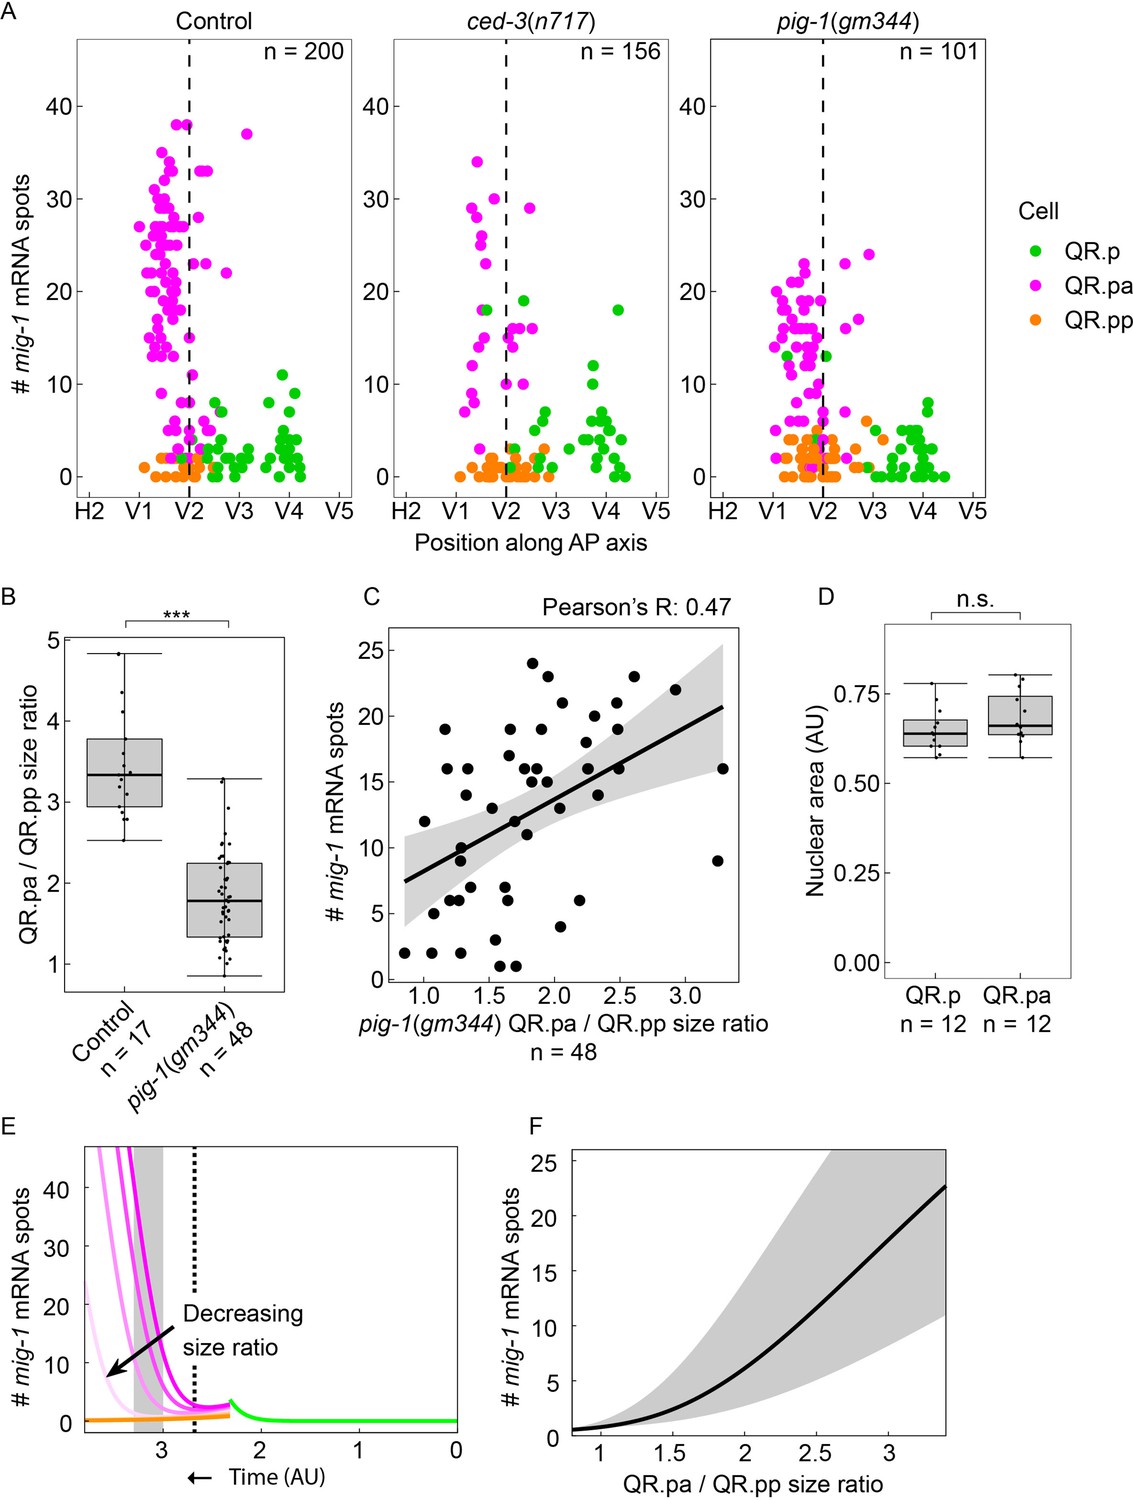
QR.p division asymmetry influences mig-1 expression dynamics in QR.pa.
(A) Single-molecule FISH (smFISH) quantification of mig-1 expression in QR and its descendants relative to the position of the seam cells H2 to V5 in control, ced-3(n717), and pig-1(gm344) mutants. mig-1 expression in QR.pa is not significantly different between control and ced-3 mutants (p=0.36, n=34, Welch’s t-test) but is significantly reduced in pig-1 mutants (p<0.0001, n=56). Data are from four independent experiments with three replicates each. (B) The size ratio of QR.pa and QR.pp in control (heIs63) and pig-1(gm344) mutants (***p<0.0001, n=48, from three independent experiments with three replicates each). Whiskers represent 1.5x interquartile range. (C) The QR.pa/QR.pp size ratio and mig-1 expression show a moderately positive correlation in pig-1(gm344) mutants (Pearson correlation, R=0.47, n=48). (D) Nuclear size is not significantly different in QR.p and its daughter QR.pa in wild type control animals (p=0.22, n=12, Welch’s t-test). Whiskers represent 1.5x interquartile range. (E) Mathematical model incorporating cell division, fit to control data (see Materials and methods and Figure 4—figure supplement 1) with wild type QR.pa/QR.pp size ratio (dark colors) and for lowered size ratios (light colors). Dashed line: time corresponding to moment in QR lineage migration that seam cell V2 is reached. Gray box: time window corresponding to gray region in F. (F) Plot of mig-1 molecule number in QR.pa vs. QR.pa/QR.pp size ratio in model at times between and (gray region) and at the midpoint time (black line).
Figure 4—figure supplement 1
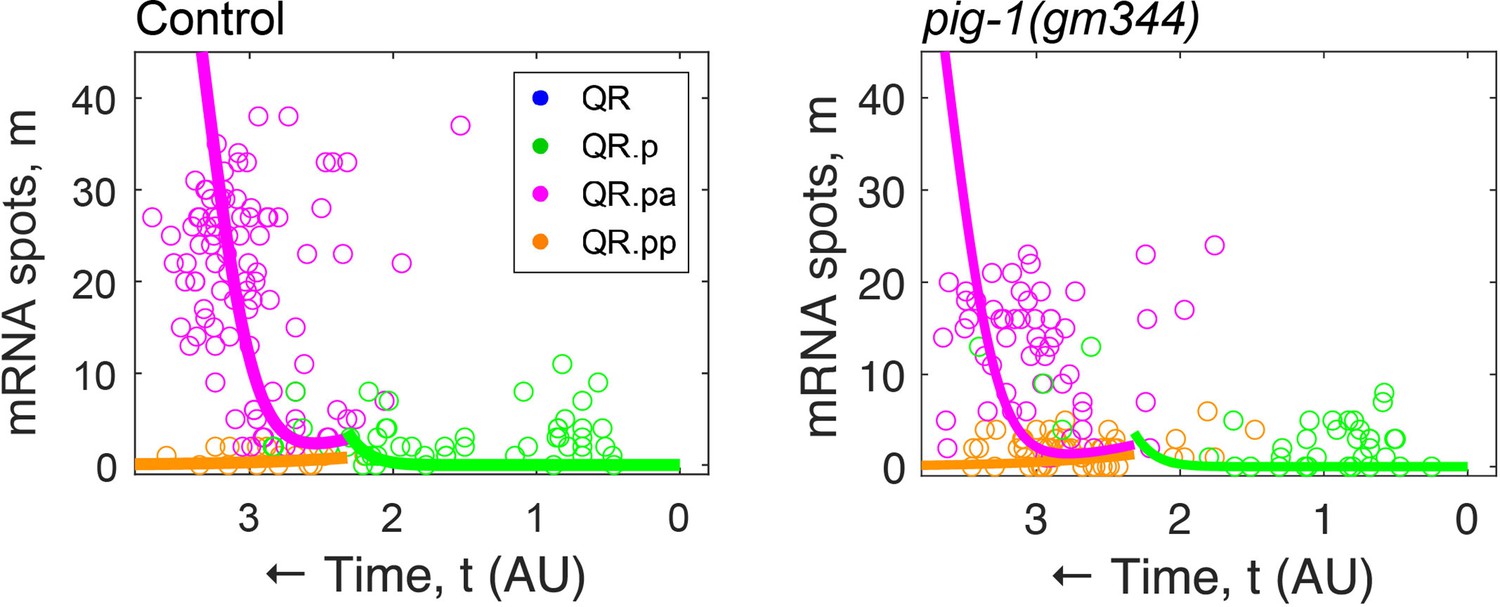
Overlay of fits from Figure 4E on mig-1 single-molecule FISH (smFISH) data from Figure 4A.
For the fits, the QR.pa/QR.pp size ratios from Figure 4B were used (3.48 for control and 1.83 for pig-1[gm344], respectively).
Figure 5 with 2 supplements
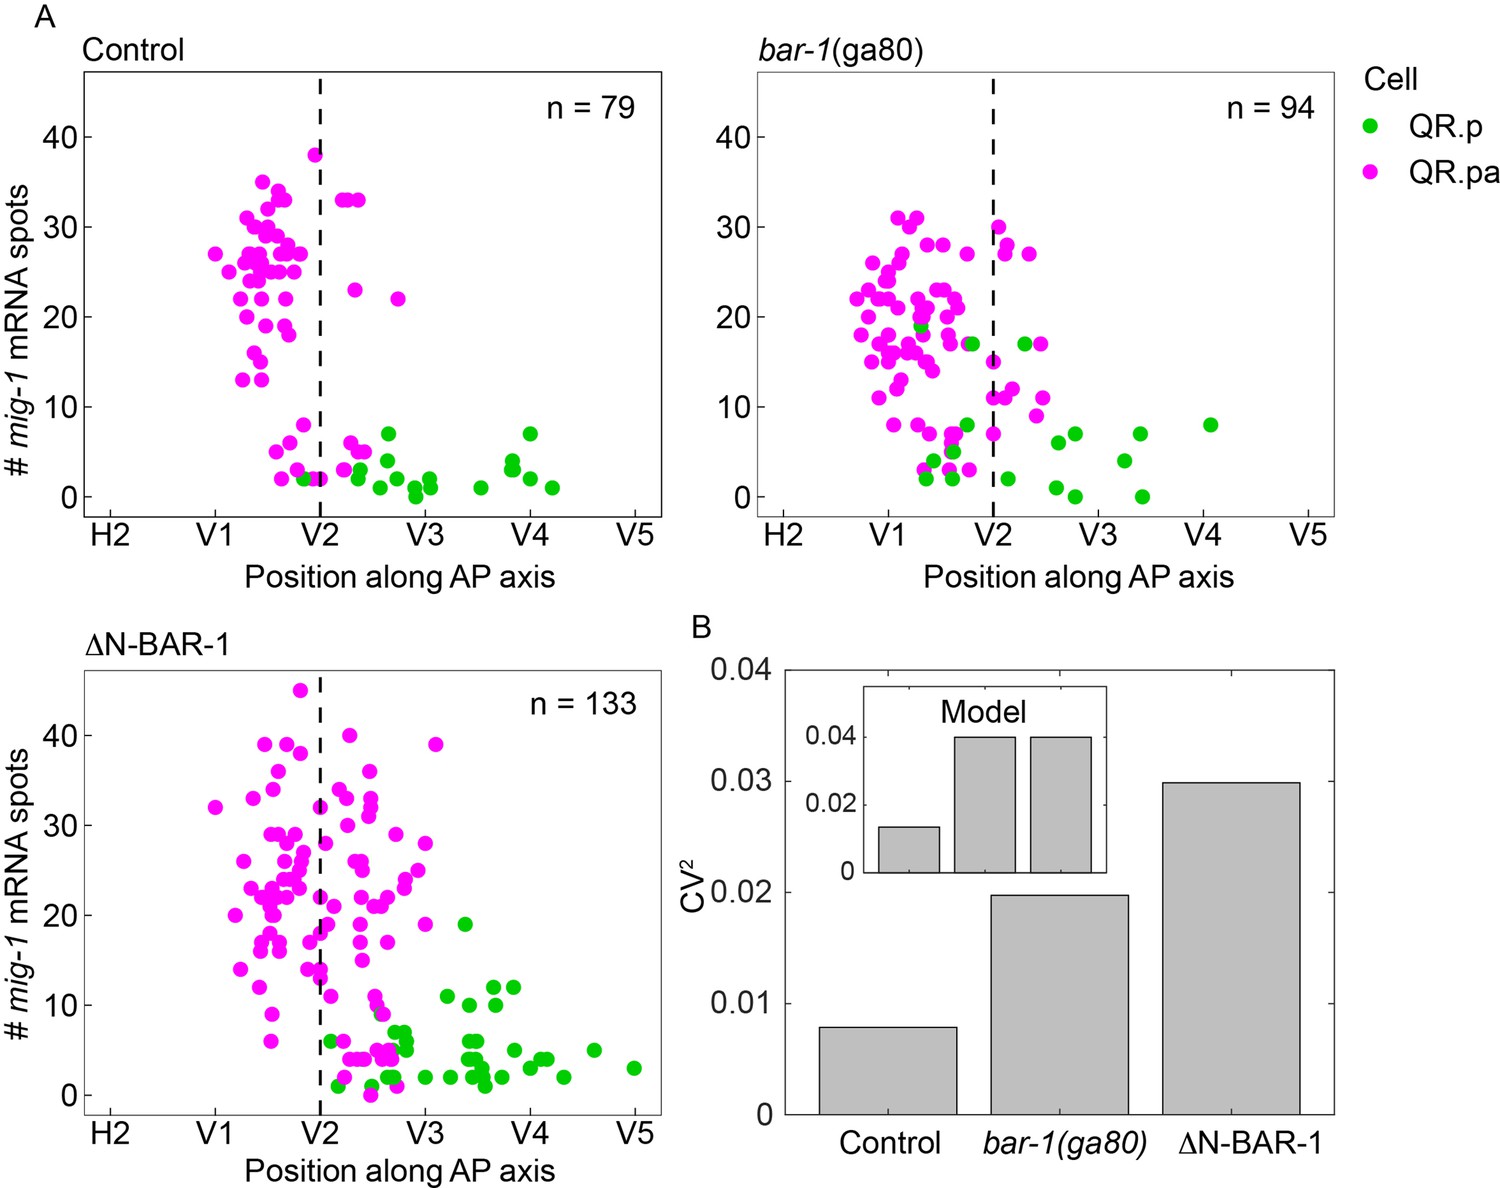
BAR-1/β-catenin dependent autoregulation of mig-1 expression contributes to timing precision.
(A) Single-molecule FISH (smFISH) quantification of mig-1 expression in QR.p and QR.pa relative to the position of the seam cells H2 to V5 in control, bar-1(ga80) null mutants and animals expressing a constitutively active, N-terminally truncated version of BAR-1 (ΔN-BAR-1) in a mab-5(gk670) mutant background. Data are from four independent experiments with three replicates each. (B) Coefficient of variation (CV) squared of the position of QR.pa cells with ≥25 mig-1 smFISH spots. Brown–Forsythe test for thresholds of 10–25 transcripts gives p=0.07–0.9 for control vs. bar-1(ga80), and 3×10⁻⁶ to 0.008 for control vs. ΔN-BAR-1. Inset: CV2 in the model in which positive feedback acts on mig-1 both through the activator and independently of the activator (see Figure 5—figure supplement 2, purple).
Figure 5—figure supplement 1
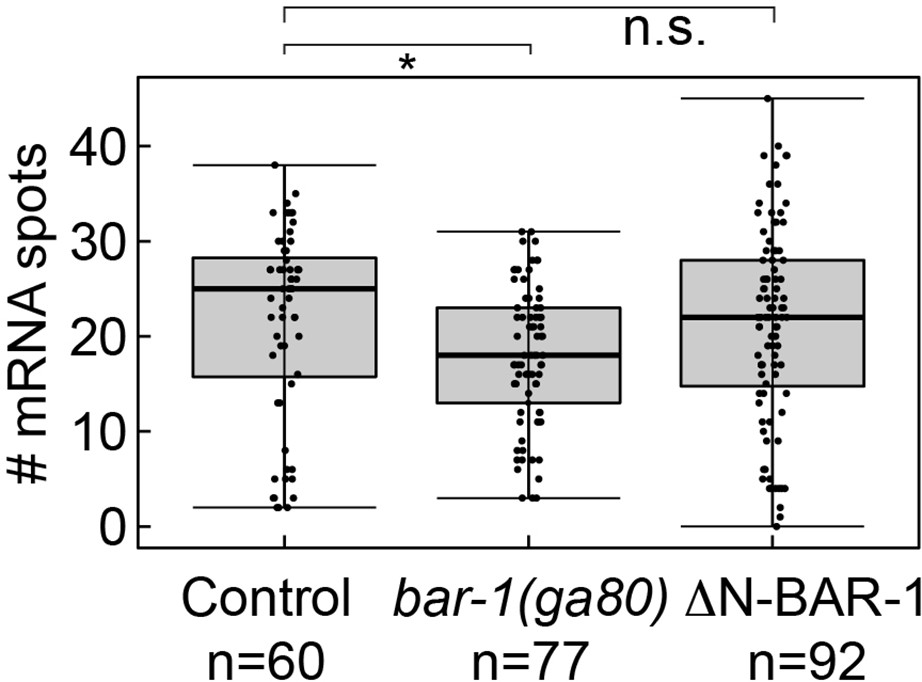
mig-1 expression in QR.pa is reduced in bar-1/β-catenin null mutants.
Number of mig-1 mRNA spots in QR.pa in control, bar-1(ga80) null mutants and ΔN-BAR-1 expressing animals. Significantly lower mig-1 expression (p=0.018, n=77, Welch’s t-test) was observed in the bar-1(ga80) null mutant. Data are from four independent experiments, with three replicates each. Whiskers represent 1.5x interquartile range.
Figure 5—figure supplement 2
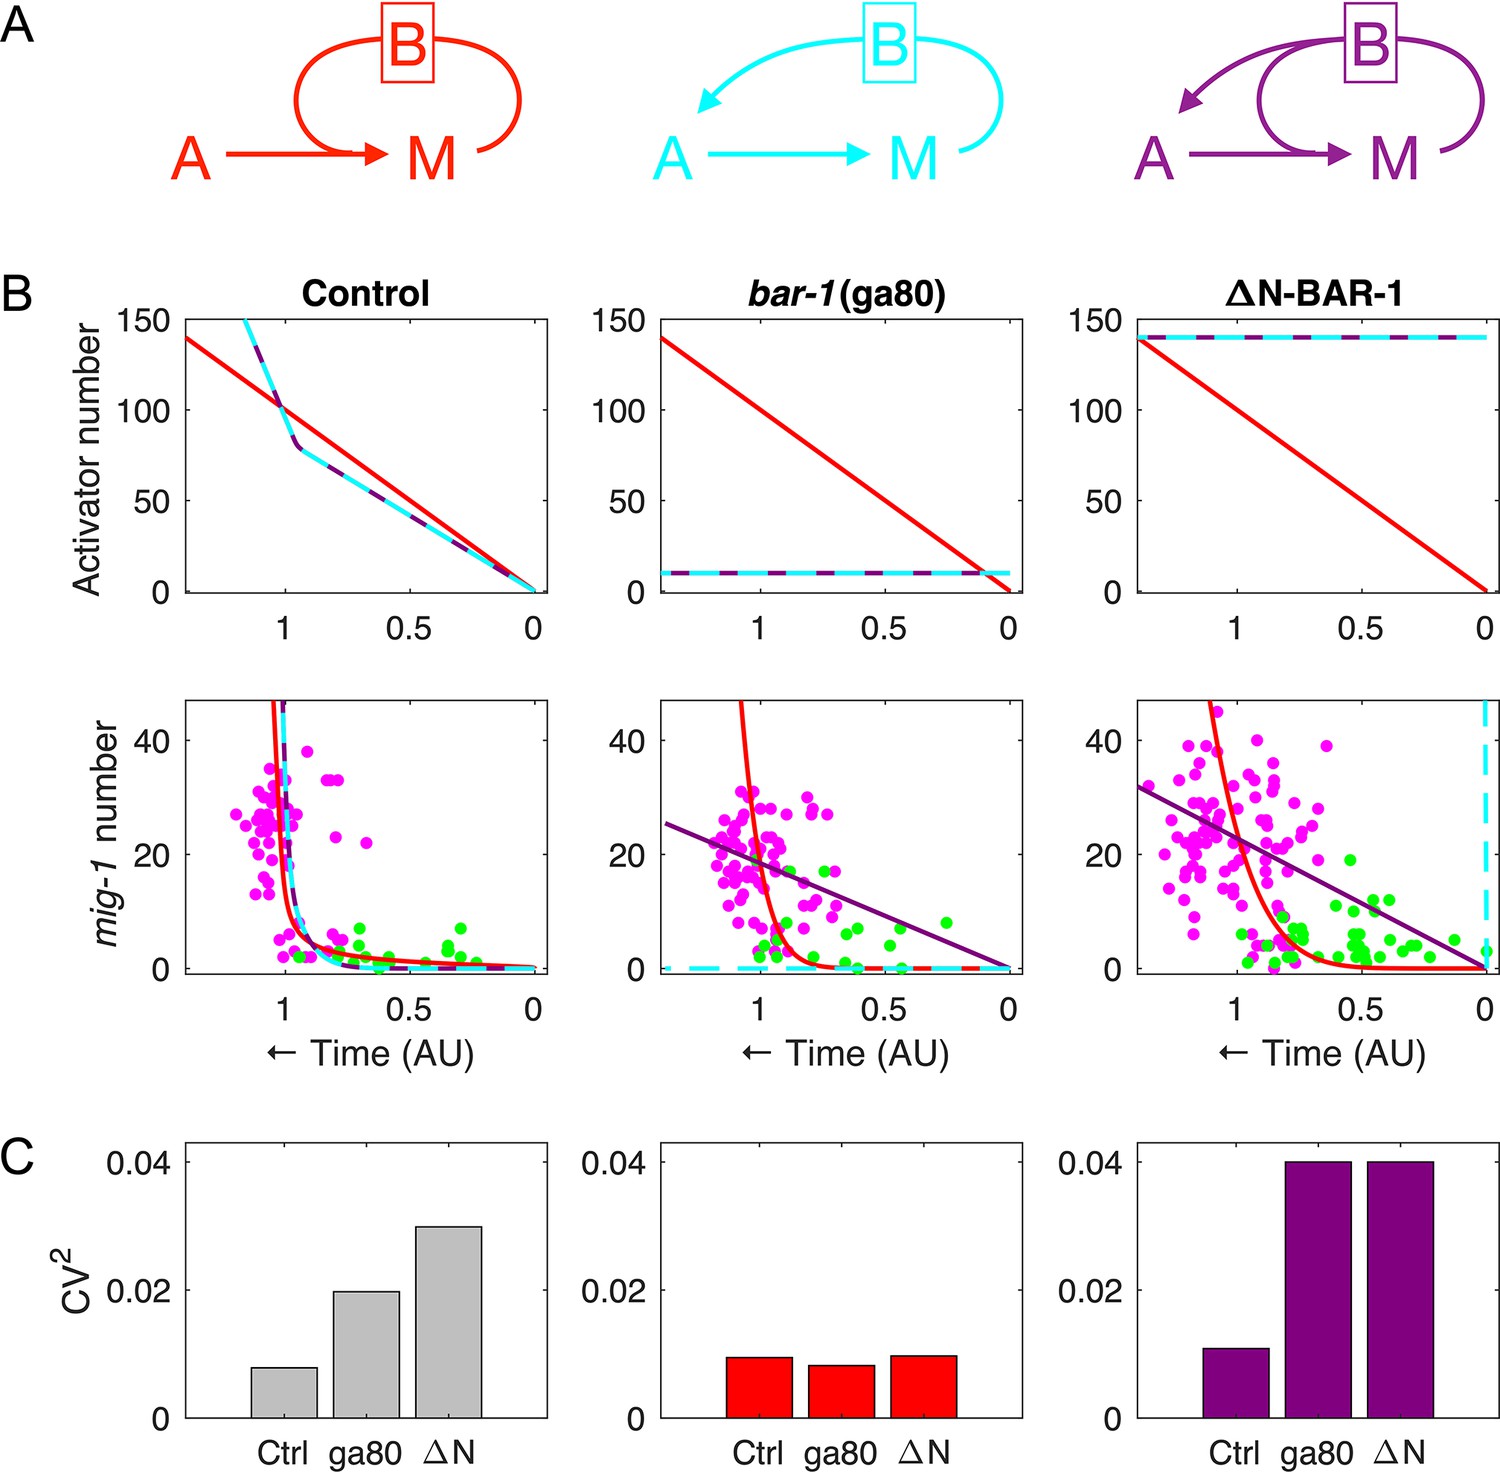
Modeling the effect of positive feedback on timing precision.
(A) The three possibilities considered for modeling feedback mediated by bar-1 (denoted B): (1) left, the feedback acts on mig-1 (M) independently of the activator A; (2) middle, the feedback acts on mig-1 through the activator; (3) both. (B) The activator dynamics (top row) and mig-1 dynamics (bottom row) for possibilities 1, 2, and 3 (red, cyan, and purple, respectively), fit to the control data (left), bar-1(ga80) null data (middle), and ΔN-BAR-1 data (right). See Materials and methods for fitting procedures and parameter values. (C) Coefficient of variation (CV) values (squared) for the data (left, from Figure 5B), possibility 1 (middle), and possibility 3 (right) for mig-1 threshold .
Tables
Key resources table
| Reagent type (species) or resource | Designation | Source or reference | Identifiers | Additional information |
|---|---|---|---|---|
| Gene (Caenorhabditis elegans) | mig-1 | Wormbase | Wormbase ID: WBGene00003238 | |
| Gene (C. elegans) | cdk-1 | Wormbase | Wormbase ID: WBGene00000405 | |
| Gene (C. elegans) | ced-3 | Wormbase | Wormbase ID: WBGene00000417 | |
| Gene (C. elegans) | pig-1 | Wormbase | Wormbase ID: WBGene00021012 | |
| Gene (C. elegans) | bar-1 | Wormbase | Wormbase ID: WBGene00000238 | |
| Strain and strain background (C. elegans) | For strains used in this study, see Supplementary file 1b | This paper | Strains are available upon request. | |
| Recombinant DNA reagent | Pegl-17::tir1::TagBFP::unc-54 3’ UTR in pDESTR4-R3 | This paper | pKN618 | See Materials and methods. Plasmid is available upon request. |
| Sequence-based reagent | For sgRNA and ssODN sequences used for CRISPR/Cas9-based gene editing, see Supplementary file 1c | This paper | ||
| Chemical compound and drug | Auxin (natural indole-3-acetic acid) | Alfa Aesar | #A10556 | |
| Software and algorithm | R Studio | https://www.r-project.org/ | ||
| Software and algorithm | MATLAB | https://www.mathworks.com/ |
Additional files
-
Supplementary file 1
Details on gene edits, strains and sequence based reagents.
a. CRISPR/Cas9-mediated gene edits of mig-1 and cdk-1. b. C. elegans strains used in this study. c. Single guide RNA (sgRNA) and single-stranded oligodeoxynucleotide (ssODN) sequences used for CRISPR/Cas9-mediated gene editing.
- https://cdn.elifesciences.org/articles/82675/elife-82675-supp1-v2.docx
-
MDAR checklist
- https://cdn.elifesciences.org/articles/82675/elife-82675-mdarchecklist1-v2.pdf
Download links
A two-part list of links to download the article, or parts of the article, in various formats.
Downloads (link to download the article as PDF)
Open citations (links to open the citations from this article in various online reference manager services)
Cite this article (links to download the citations from this article in formats compatible with various reference manager tools)
Precise temporal control of neuroblast migration through combined regulation and feedback of a Wnt receptor
eLife 12:e82675.
https://doi.org/10.7554/eLife.82675


