MHC class I and MHC class II reporter mice enable analysis of immune oligodendroglia in mouse models of multiple sclerosis
- Department of Neurology, Johns Hopkins University School of Medicine, United States
- The Solomon H. Snyder Department of Neuroscience, Johns Hopkins University School of Medicine, United States
- Department of Neurology, The Ohio State University College of Medicine, United States
- The Kavli Neuroscience Discovery Institute, Johns Hopkins University, United States
Figures
Figure 1 with 2 supplements
Major histocompatibility complex (MHC) reporter mice validation.
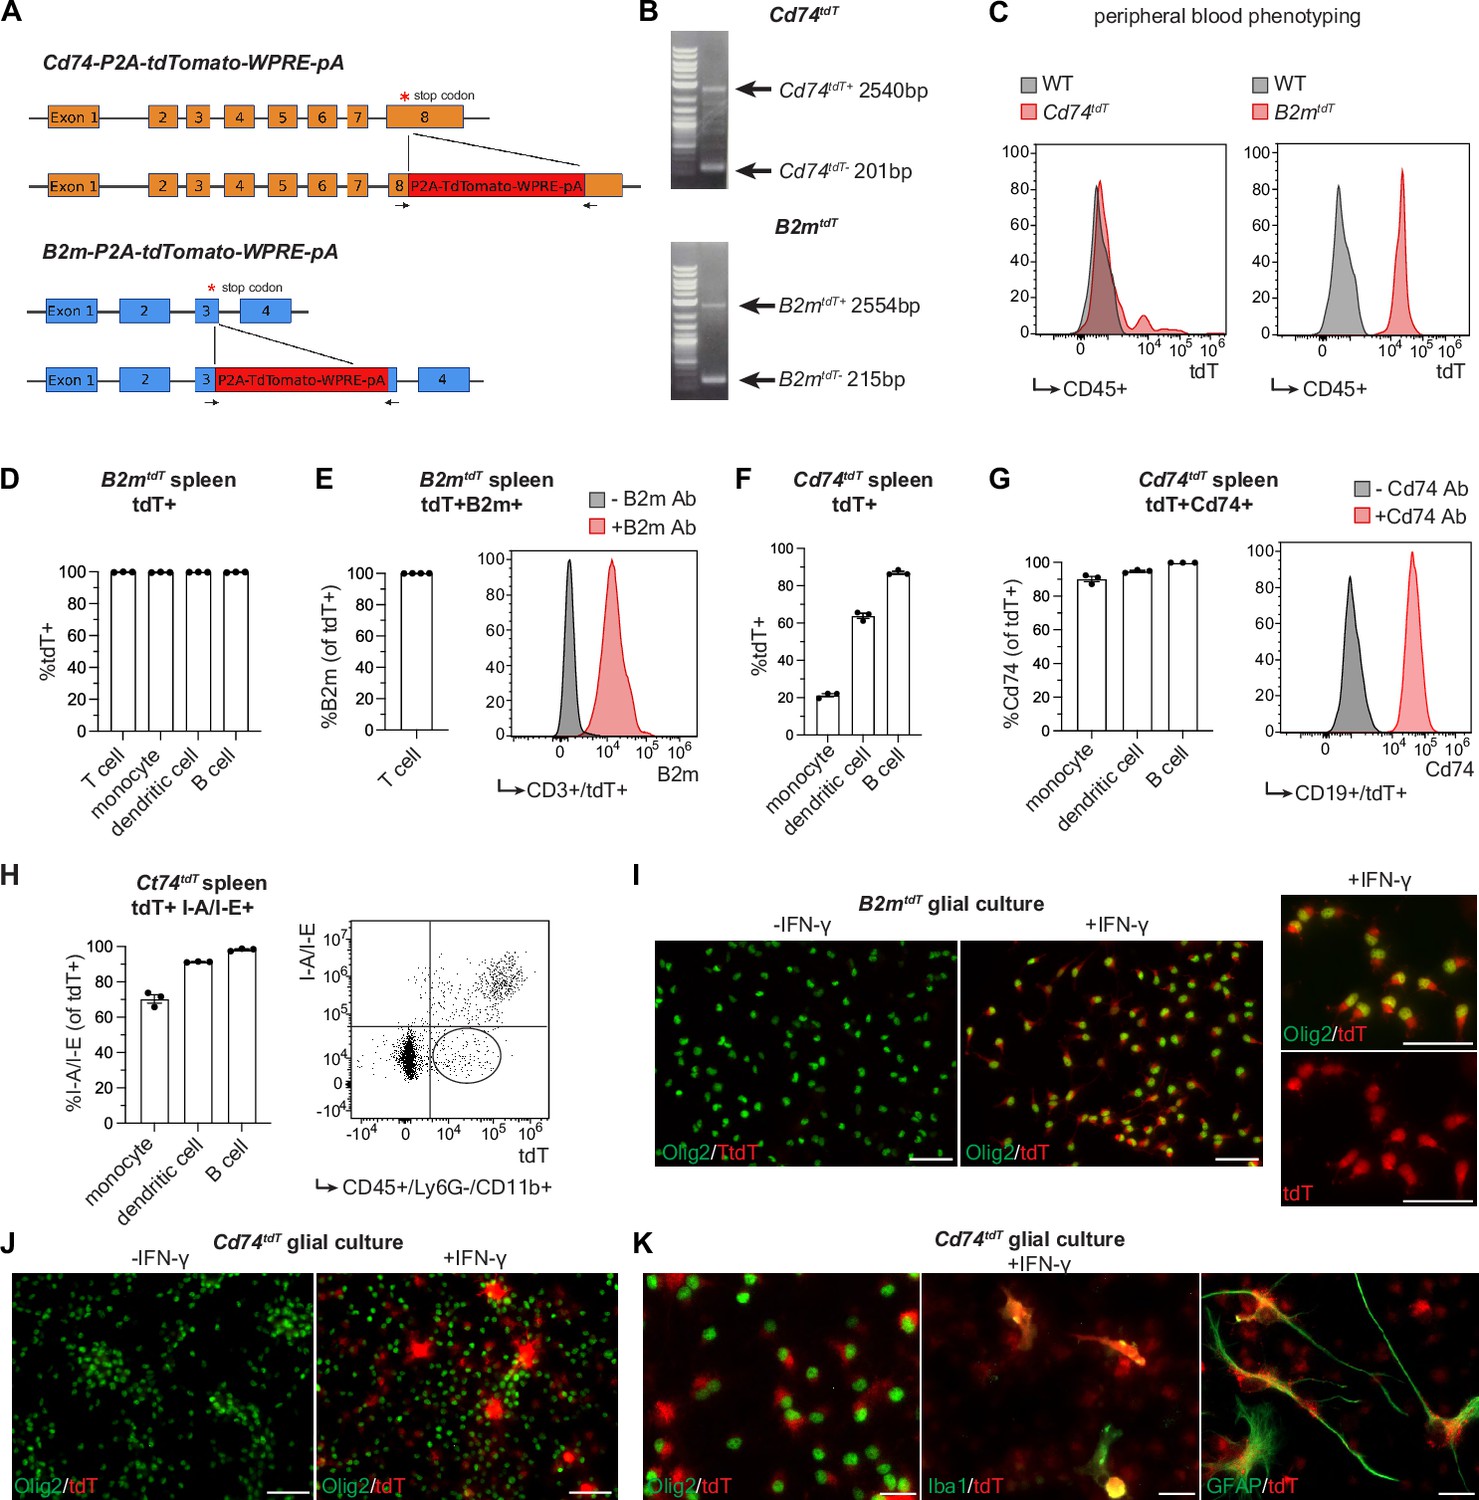
(A) Stop codons of Cd74 and B2m are replaced by P2A-TdTomato-WPRE-pA construct to generate Cd74tdT and B2mtdT reporter mice, respectively. Figure made in https://www.biorender.com/. (B) Genotyping of reporter mice with primers (indicated by arrows in panel A) spanning reporter construct insertion site. (C) Representative histogram of flow cytometry of endogenous tdT expression in peripheral blood CD45+ cells for phenotyping reporter and wild-type mice. (D) Quantification of flow cytometry percentage of endogenous tdT expression in B2mtdT splenic cell populations. n=3 mice. (E) Quantification of flow cytometry percentage of B2m co-expression in tdT-positive CD3+ T cells in B2mtdT spleen with representative histogram of B2m expression with and without B2m antibody. n=3 mice. (F) Quantification of flow cytometry percentage of endogenous tdT expression in Cd74tdT splenic cell populations. n=3 mice. (G) Quantification of flow cytometry percentage of Cd74 co-expression in tdT-positive splenic cell populations in Cd74tdT spleen with representative histogram of tdT-positive CD19+ B cells stained with and without CD74. n=3 mice. (H) Quantification of flow cytometry percentage of I/A-I/E co-expression with tdT-positive splenic cell populations in Cd74tdT spleen with representative histogram of tdT and I-A/I-E expression in monocytes with tdT-intermediate I-A/I-E-negative population outlined. n=3 mice. (I) Immunopanned B2mtdT post-natal pup glial culture with representative images of tdT expression in Olig2+ oligodendroglia with and without interferon-γ (IFN-γ) treatment. Scale bars, 50 µm. (J) Immunopanned Cd74tdT post-natal pup glial culture with representative images of tdT expression in Olig2+ oligodendroglia with and without IFN-γ treatment. Scale bars, 50 µm. (K) Representative images of tdT expression in Olig2+ oligodendroglia, GFAP+ astrocytes, and Iba1+ microglia in Cd74tdT glial culture with IFN-γ treatment. Scale bars, 20 µm. Data represented are means ± s.e.m.
-
Figure 1—source data 1
Generation of Cd74tdT and B2mtdT reporter animals.
Cd74-P2A-TdTomato-WPRE-pA and B2m-P2A-TdTomato-WPRE-pA construct sequences with 500 bp homology arms (uppercase sequence) used for generating reporter animals. Primers for genotyping B2mtdT and Cd74tdT reporter animals.
- https://cdn.elifesciences.org/articles/82938/elife-82938-fig1-data1-v2.xlsx
-
Figure 1—source data 2
Data from analysis of flow cytometry, sheets are labeled with letter corresponding to data panels in Figure 1.
- https://cdn.elifesciences.org/articles/82938/elife-82938-fig1-data2-v2.xlsx
-
Figure 1—source data 3
Representative gating strategy from flow cytometry depicted in Figure 1.
- https://cdn.elifesciences.org/articles/82938/elife-82938-fig1-data3-v2.pdf
-
Figure 1—source data 4
Original gel image files of PCR genotyping for transgenic reporter founder animals for Figure 1B.
- https://cdn.elifesciences.org/articles/82938/elife-82938-fig1-data4-v2.zip
Figure 1—figure supplement 1

Western blots of B2mtdT and Cd74tdT reporter and wild-type animals.
(A) Cd74tdT and WT spleen, lymph node, brain, and spinal cord tissue probed with Cd74 antibody. Expected p31/p41 Cd74 isoforms and an additional 90 kDa Cd74tdT fusion protein are present in spleen and lymph nodes. Brain and spinal cord demonstrate single Cd74 isoform above p41 isoform. (B) Cd74tdT fusion protein (90 kDa) in Cd74tdT spleen probed for Cd74 antibody. (C) Quantification of total Cd74 protein (combined 31, 41, 90 kDa bands) intensity in WT and Cd74tdT spleen (from panel B). n=4 mice/group. Data represented are means ± s.e.m. Unpaired t-test. (D) Quantification of percentage of 90 kDa Cd74tdT fusion protein in Cd74tdT spleen (from panel B). n=4 mice. Data represented are means ± s.e.m.(E) Cd74tdT and WT spleen, lymph node, brain, and spinal cord tissue probed with tdT antibody. tdT protein (54 kDa) and Cd74tdT fusion protein (90 kDa) present in Cd74tdT spleen and lymph nodes. (F) Cd74tdT fusion protein (90 kDa) present in Cd74tdT spleen probed for tdT antibody. (G) Quantification of percentage of 90 kDa Cd74tdT fusion protein in Cd74tdT spleen (from panel F). n=4 mice. Data represented are means ± s.e.m. (H) B2mtdT and WT spleen, lymph node, brain, and spinal cord tissue probed with B2m antibody with expected 11 kDa B2m isoform protein band in spleen and lymph nodes without B2mtdT fusion protein detected. (I) WT and B2mtdT spleen probed with B2m antibody. (J) Quantification of total B2m protein band intensity in WT and B2mtdT spleen (from panel I). n=4 mice/group. Data represented are means ± s.e.m. Unpaired t-test. (K) B2mtdT and WT spleen, lymph node, brain, and spinal cord tissue probed with tdT antibody with expected 54 kDa tdT band in B2mtdT reporter tissue without B2mtdT fusion protein detected. (L) B2mtdT and WT spleen probed for B2m antibody with single 54 kDa TdT band in B2mtdT spleen. 20 µg protein loaded per lane, each lane is an individual animal and 4 animals/group were evaluated for each tissue type. B - brain; LN - lymph node; SP - spleen; SC - spinal cord; WT - wild-type.
-
Figure 1—figure supplement 1—source data 1
Original western blot images.
Blots are labeled with antibody probe, samples and upper left letter corresponds to panel depicted in Figure 1—figure supplement 1.
- https://cdn.elifesciences.org/articles/82938/elife-82938-fig1-figsupp1-data1-v2.zip
-
Figure 1—figure supplement 1—source data 2
Data from analysis of western blot band intensities.
Sheets are labeled with letter corresponding to data panels in Figure 1—figure supplement 1.
- https://cdn.elifesciences.org/articles/82938/elife-82938-fig1-figsupp1-data2-v2.xlsx
Figure 1—figure supplement 2
Cd74tdT splenocyte and OT-II CD4 T cell co-culture.
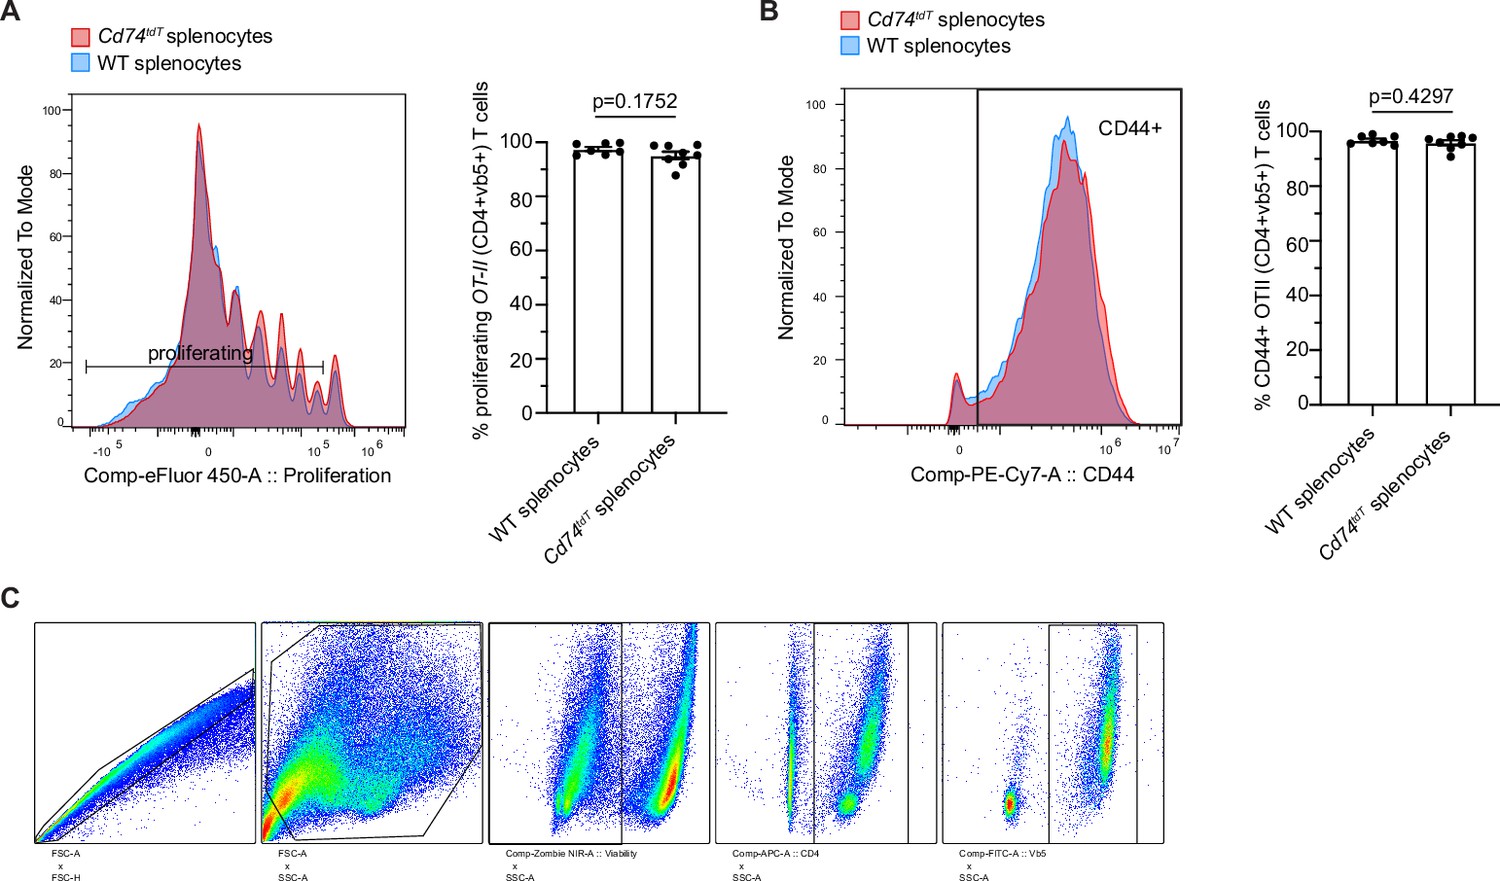
(A) Representative histogram and quantification of proliferation of ovalbumin-specific OT-II CD4 T cells co-cultured with wild-type or Cd74tdT splenocytes for 72 hr. n=6 mice/group. Unpaired t-test. Data represented are means ± s.e.m. (B) Representative histogram and quantification of activated CD44+ OT II CD4 T cells co-cultured with wild-type or Cd74tdT splenocytes for 72 hr. n=6 mice/group. Unpaired t-test. Data represented are means ± s.e.m. (C) Representative gating for OT-II CD4 T cells gated on singlets/cells/viable/CD4+/vb5+. WT - wild-type.
-
Figure 1—figure supplement 2—source data 1
Data from analysis of flow cytometry.
- https://cdn.elifesciences.org/articles/82938/elife-82938-fig1-figsupp2-data1-v2.xlsx
Figure 2

Cd74tdT reporter adult baseline central nervous system (CNS) tdT expression.
(A) Representative images of Cd74tdT endogenous tdT reporter expression in adult spinal cord stained for I-A/I-E. Scale bars, 200 µm. (B) Representative images of Cd74tdT endogenous tdT reporter expression in adult brain stained for I-A/I-E. Scale bars, 1 mm. (C) Confocal images of adult brain choroid plexus endogenous tdT stained with Cd74 and I-A/I-E antibodies. Scale bars, 20 µm. (D) Confocal images of choroid plexus endogenous tdT on CD11c+ dendritic cells. Scale bars, 20 µm. (E) tdT expression on subset of Iba1+ microglia in ventral pallidum (magnification of box in B). Scale bars, 50 µm. Cd74tdT adult CNS reporter expression n=6 adult mice.
Figure 3
B2mtdT reporter baseline central nervous system (CNS) TdT expression.
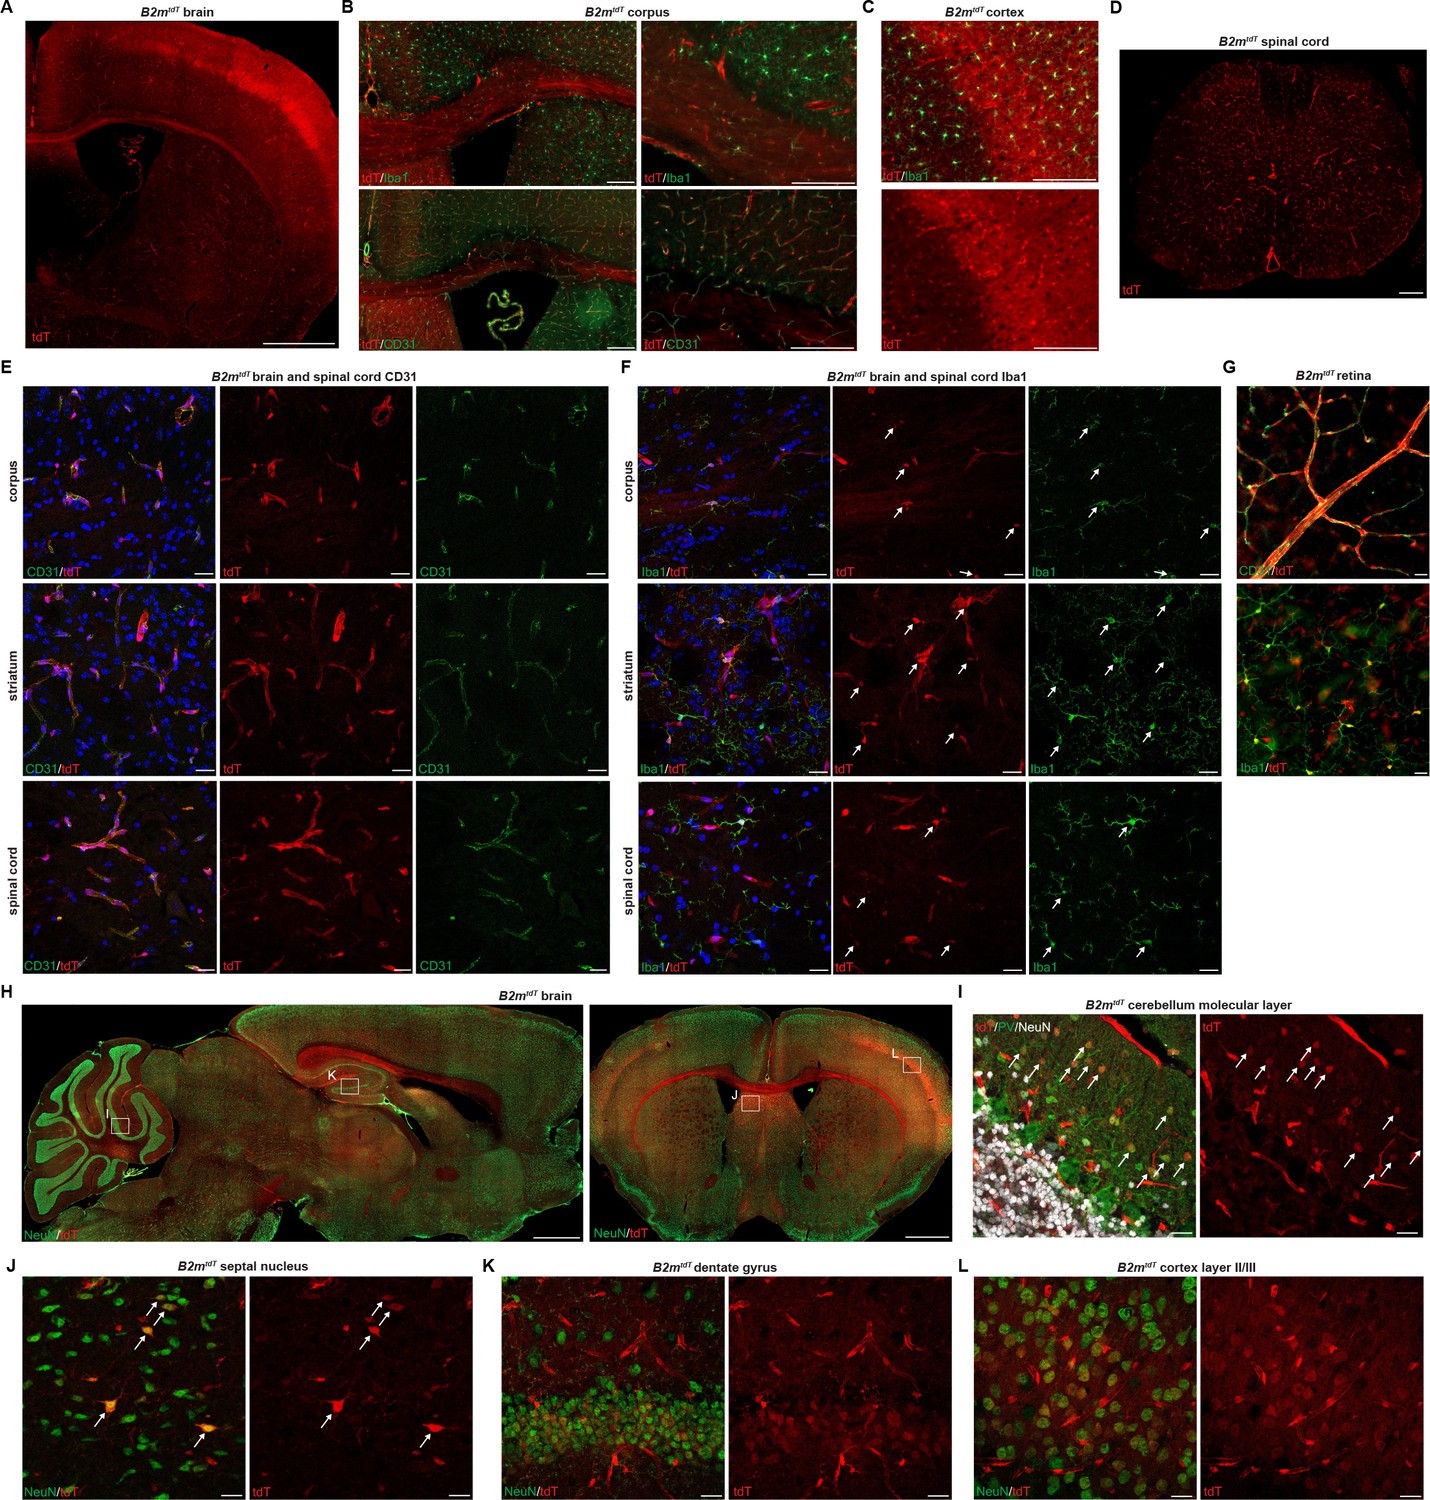
(A) Representative images of B2mtdT endogenous tdT reporter adult expression in adult brain. Scale bar, 1 mm. (B) Co-localization of tdT in B2mtdT corpus callosum with Iba1+ microglia and CD31+ endothelial cells. Scale bars, 200 µm. (C) Co-localization of tdT with Iba1 in B2mtdT cortex. Scale bar, 200 um. (D) B2mtdT endogenous tdT reporter expression in adult spinal cord. Scale bar, 200 µm. (E) Confocal imaging of corpus callosum, striatum, and spinal cord endogenous tdT expression on CD31+ endothelial cells. Scale bars, 20 µm. (F) Confocal imaging of corpus callosum, striatum, and spinal cord endogenous tdT expression on Iba1+ microglia with tdT+Iba1+ cell bodies indicated with arrows. Scale bars, 20 µm. (G) Flat mount adult B2mtdT retina with TdT expression on CD31+ endothelial cells and Iba1+ microglia. Scale bars, 20 µm. (H) B2mtdT endogenous tdT reporter expression in sagittal brain and coronal brain stained with NeuN (boxes indicate regions of interest confocal imaging in panels I–L). Scale bars, 1 mm. (I) Confocal imaging of endogenous tdT+ parvalbumin PV+ neurons, indicated by arrows, in cerebellar molecular layer. Scale bars, 20 µm. (J) Confocal imaging of septal nucleus with scattered tdT+NeuN+ neurons indicated by arrows. Scale bars, 20 µm. (K) Confocal imaging of hippocampal dentate gyrus tdT+NeuN+ neurons. Scale bars, 20 µm. (L) Confocal imaging of cortex layer II/III tdT+NeuN+ neurons. Scale bars, 20 µm. B2mtdT adult CNS reporter expression n=6 adult mice.
Figure 4
B2mtdT and Cd74tdT reporter expression in MOG35-55 peptide immunized experimental autoimmune encephalitis (EAE) spinal cord.
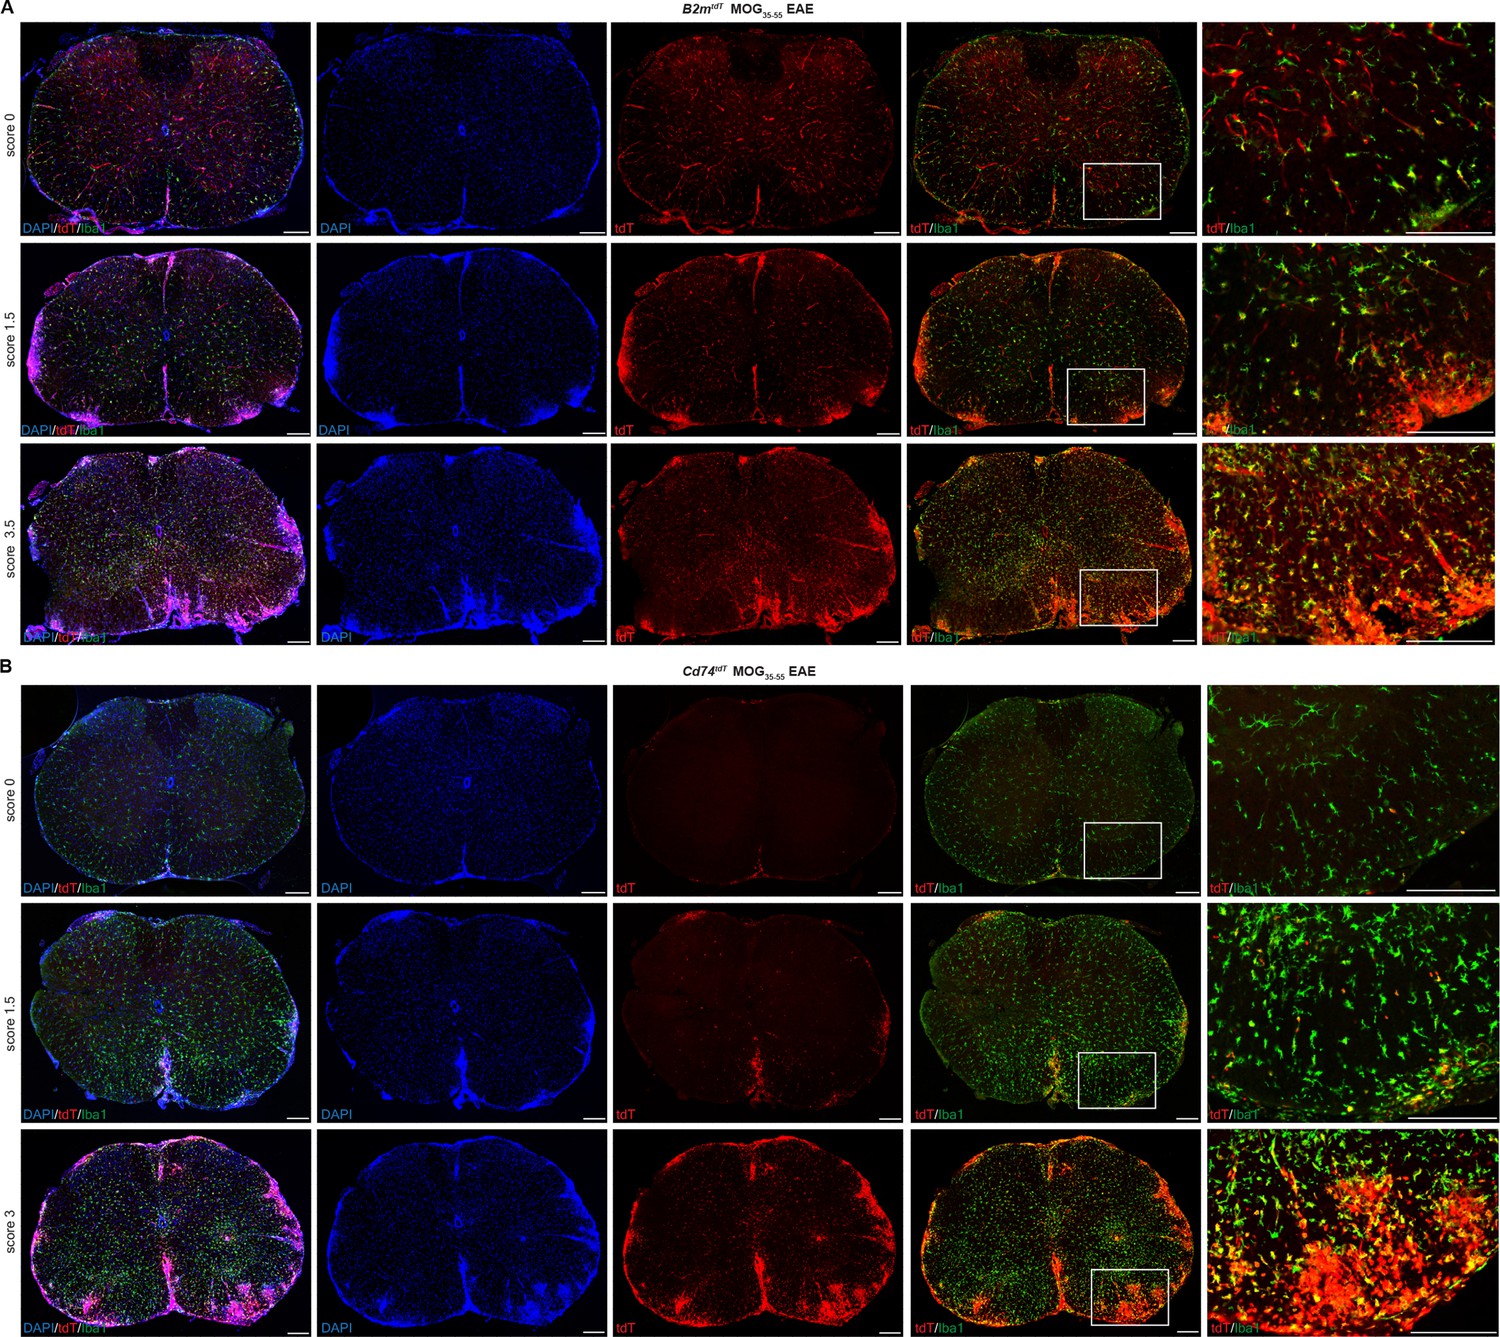
(A) B2mtdT reporter MOG35-55 EAE spinal cord stained with Iba1. tdT expression is present in the vasculature and Iba1+ microglia in pre-clinical score 0 animals and more notable parenchymal expression within EAE lesions indicated by DAPI hypercellularity and Iba1 cell clusters. Scale bars, 200 µm. (B) Cd74tdT reporter MOG35-55 EAE spinal cord stained with Iba1. tdT expression is restricted to the meninges in pre-clinical score 0 mice and with increasing EAE clinical score is prominent within EAE lesions. Scale bars, 200 µm.
Figure 5
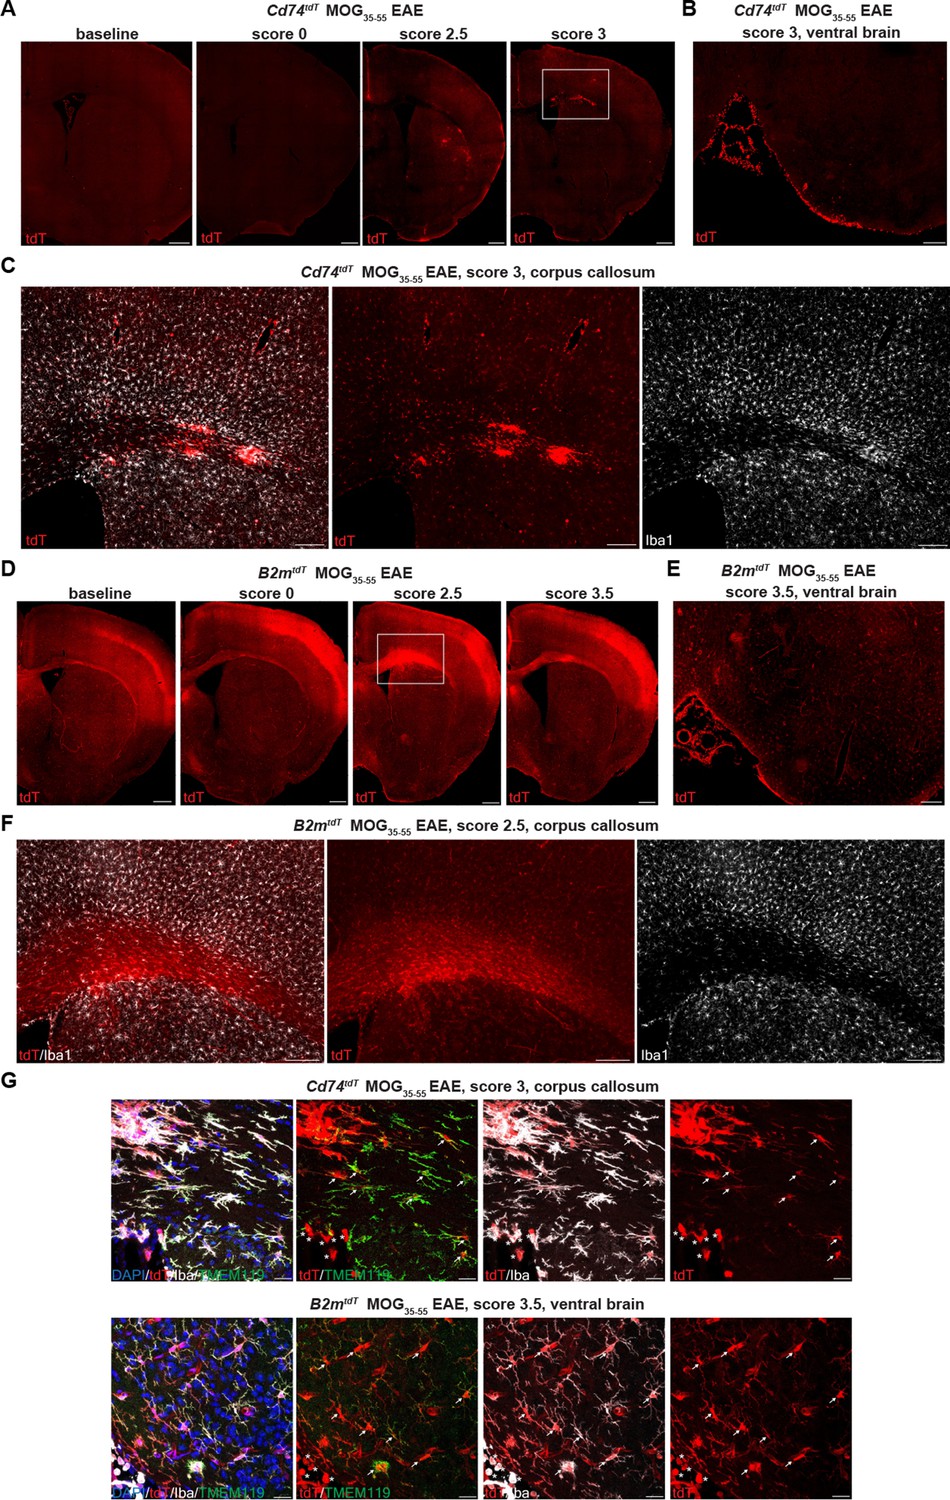
B2mtdT and Cd74tdT reporter expression in MOG35-55 peptide immunized experimental autoimmune encephalitis (EAE) brain.
(A) Representative images of Cd74tdT MOG35-55 EAE brain with clinical scores >2 demonstrating parenchymal and meningeal tdT expression. Scale bars, 500 µm. (B) Cd74tdT EAE ventral brain meningeal cluster of tdT-positive cells. Scale bar, 200 µm. (C) Cd74tdT EAE corpus callosum with notable tdT+ infiltrate and tdT parenchymal expression. (D) Representative images of B2mtdT MOG35-55 EAE brain with meningeal tdT expression and corpus callosum tdT expression. Scale bars, 500 µm. (E) B2mtdT EAE ventral brain meningeal cluster of tdT-positive cells. Scale bar, 200 µm. (F) B2mtdT EAE corpus callosum with notable tdT+ infiltrate. (G) Cd74tdT and B2mtdT EAE brain with tdT+ microglia (Iba1+TMEM119+ indicated by arrows) and tdT+ infiltrating myeloid cells (Iba1+TMEM119- indicated by asterisks). Scale bars 20 µm.
Figure 6
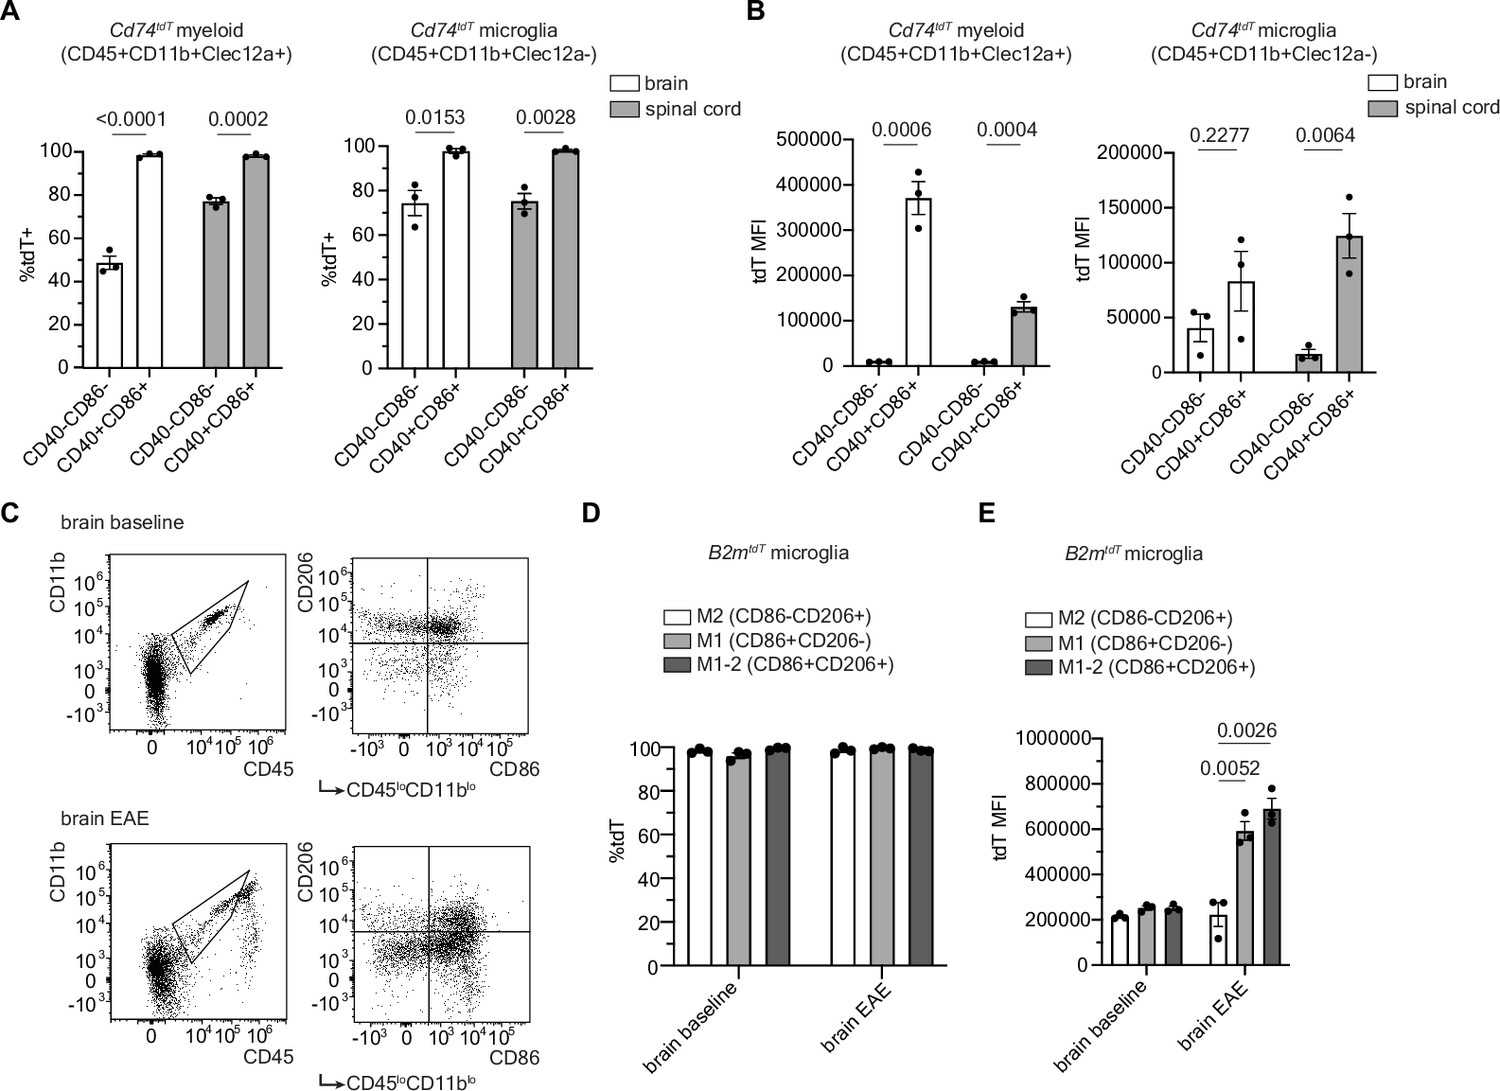
Co-stimulatory molecule expression in myeloid and microglial cells in MOG35-55 peak experimental autoimmune encephalitis (EAE).
(A) Quantification of percentage of tdT expression in co-stimulatory molecule positive (CD40+CD86+) compared to co-stimulatory molecule negative (CD40-CD86-) infiltrating myeloid cells (CD45+CD11b+Clec12a+) and microglia (CD45+CD11b+Clec12a-) in Cd74tdT MOG35-55 EAE by flow cytometry. n=3 mice/group. Unpaired t-test. Data represented are means ± s.e.m. (B) Quantification of tdT mean fluorescence intensity (MFI) in tdT+ co-stimulatory positive and negative infiltrating myeloid cells and microglia in Cd74tdT MOG35-55 EAE by flow cytometry. n=3 mice/group. Unpaired t-test. Data represented are means ± s.e.m. (C) Representative gating strategy for M2 (CD86-CD206+), M1 (CD86+CD206-), and M1-2 microglia (CD86+CD206+). (D) Quantification of percentage of tdT expression in M1, M2, and M1-2 microglia in B2mtdT baseline and EAE brain by flow cytometry. n=3 mice/group. Data represented are means ± s.e.m. (E) Quantification of tdT MFI of M1, M2, and M1-2 microglia in B2mtdT baseline and EAE brain. n=3, mice/group. Unpaired t-test. Data represented are means ± s.e.m.
-
Figure 6—source data 1
Data from analysis of flow cytometry, sheets are labeled with letter corresponding to data panels in Figure 6.
- https://cdn.elifesciences.org/articles/82938/elife-82938-fig6-data1-v2.xlsx
-
Figure 6—source data 2
Representative gating strategy from flow cytometry depicted in Figure 6.
- https://cdn.elifesciences.org/articles/82938/elife-82938-fig6-data2-v2.pdf
Figure 7 with 2 supplements
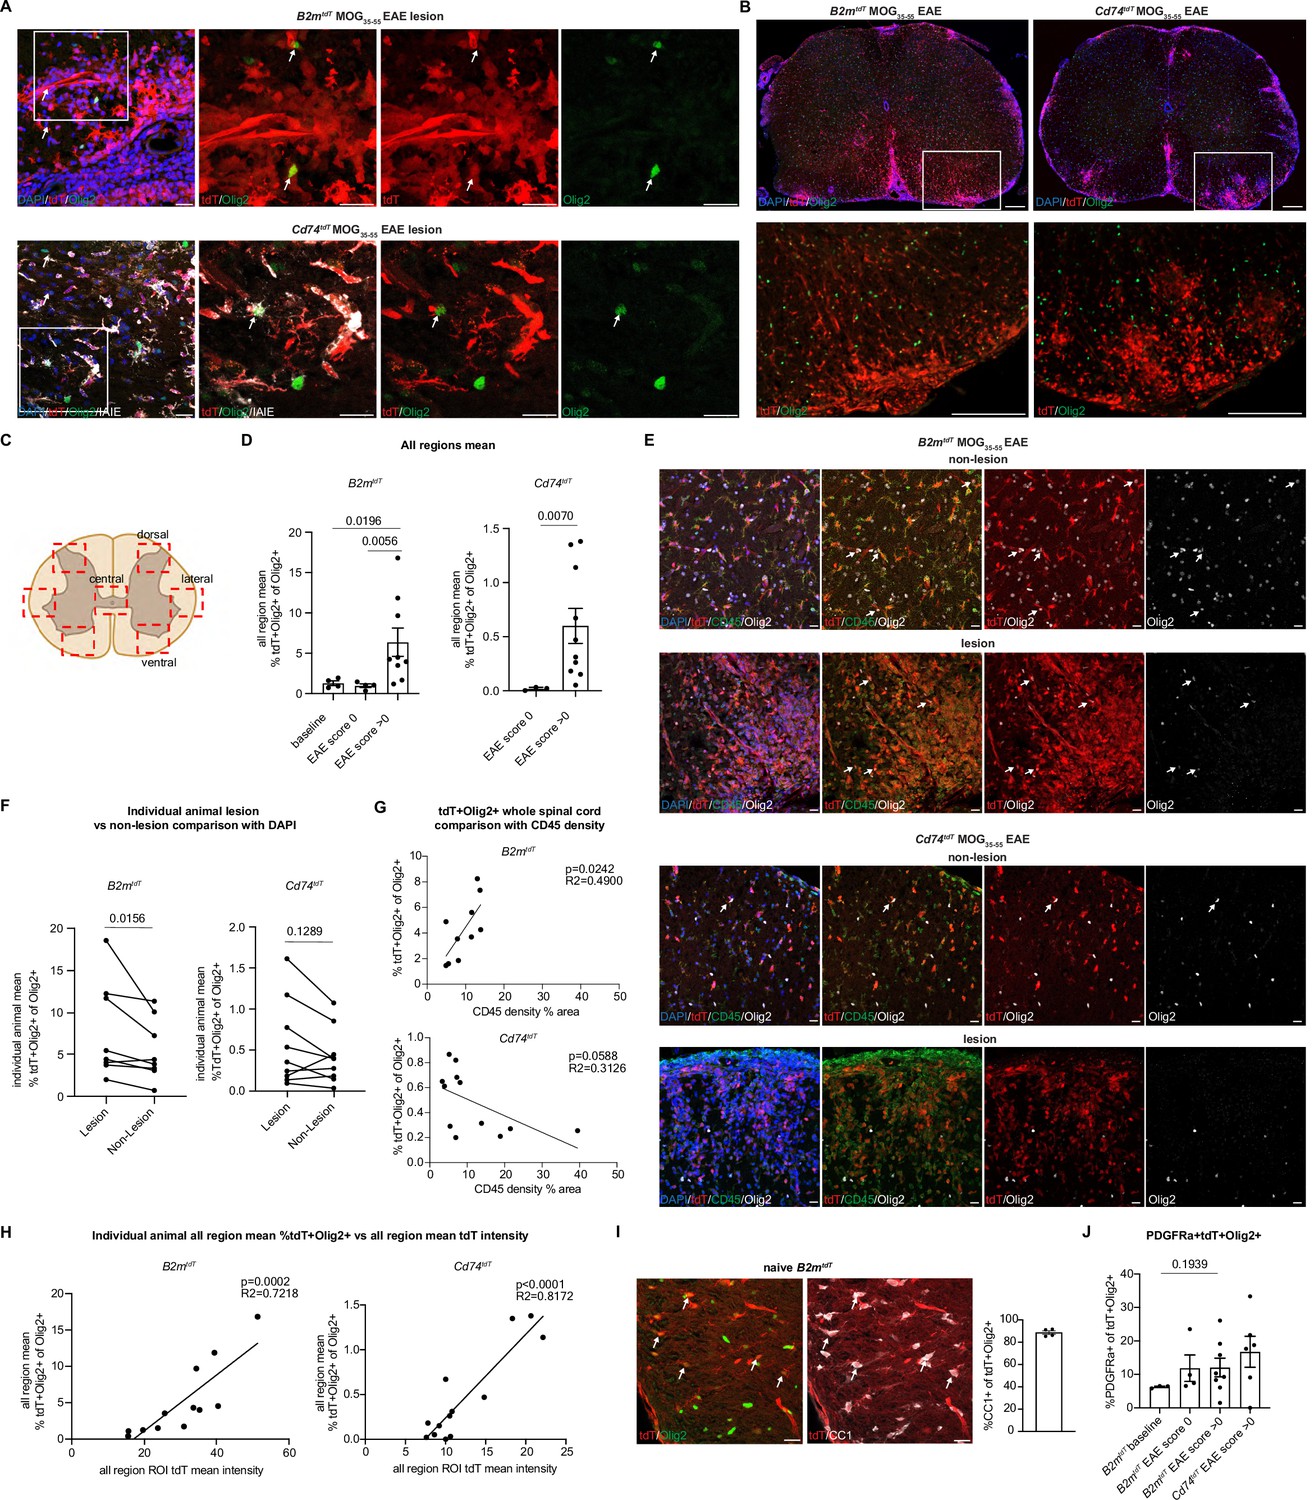
Oligodendroglial major histocompatibility complex (MHC) reporter expression in MOG35-55 experimental autoimmune encephalitis (EAE) spinal cord.
(A) Representative confocal imaging of tdT-positive oligodendroglia in MOG35-55 EAE B2mtdT and Cd74tdT spinal cord lesions. Endogenous tdT-positive oligodendroglia indicated by arrows. Scale bars, 20 µm. (B) Representative images of B2mtdT and Cd74tdT MOG35-55 spinal cord whole cord and outlined region of interest (ROI) used for analysis of tdT+ oligodendroglia. Scale bars, 200 µm. (C) Diagram of seven ROIs imaged in lumbar spinal cord sections from baseline and EAE spinal cord. Figure made in https://www.biorender.com/. (D) Quantification of percentage of tdT+Olig2+ oligodendroglia in B2mtdT and Cd74tdT spinal cord. Data points are an individual animal mean across all regions analyzed. n=3–4 mice baseline and score 0, n=9–10 EAE score >0. Unpaired Mann-Whitney t-test. Data represented are means ± s.e.m. (E) Representative confocal imaging of lesion and non-lesion ROIs from the same reporter EAE animal with tdT+Olig2+ oligodendroglia indicated by arrows. Scale bars, 20 µm. (F) Quantification of percentage of tdT+Olig2+ oligodendroglia in lesion compared to non-lesion areas in MOG35-55 EAE spinal cord. Data points are an individual animal mean across ROIs with lesions determined by DAPI hypercellularity compared to ROIs without lesions. n=8–9 mice/reporter, paired Wilcoxon t-test. (G) Linear regression of CD45 density on whole spinal cord section compared to percentage of tdT+Olig2+ oligodendroglia in whole spinal cord section in MOG35-55 EAE spinal cord. Data points are an individual spinal cord sections. n=3–4 sections/mouse, 3 mice/reporter. (H) Linear regression of all region mean percentage of tdT+Olig2+ oligodendroglia compared to all region mean tdT mean fluorescent intensity in MOG35-55 EAE spinal cord. n=13 mice/reporter. Data points are individual animals. (I) Representative confocal imaging of adult B2mtdT spinal cord at baseline with endogenous tdT co-localization with Olig2+CC1+ mature oligodendroglia (arrows). Quantification of percentage of CC1+tdT+ Olig2+ oligodendrocytes in B2mtdT baseline adult spinal cord. n=4 mice. Scale bars, 20 µm. Data represented are means ± s.e.m. (J) Quantification of percentage of PDGFRa+tdT+ oligodendroglia in MOG35-55 EAE spinal cord. Data points are an individual animal mean across all regions. n=3–4 mice baseline and score 0, n=6–8 mice EAE score >0. Unpaired Mann-Whitney t-test. Data represented are means ± s.e.m.
-
Figure 7—source data 1
Immunohistochemistry quantification, sheets are labeled with letter corresponding to data panels in Figure 7.
- https://cdn.elifesciences.org/articles/82938/elife-82938-fig7-data1-v2.xlsx
Figure 7—figure supplement 1
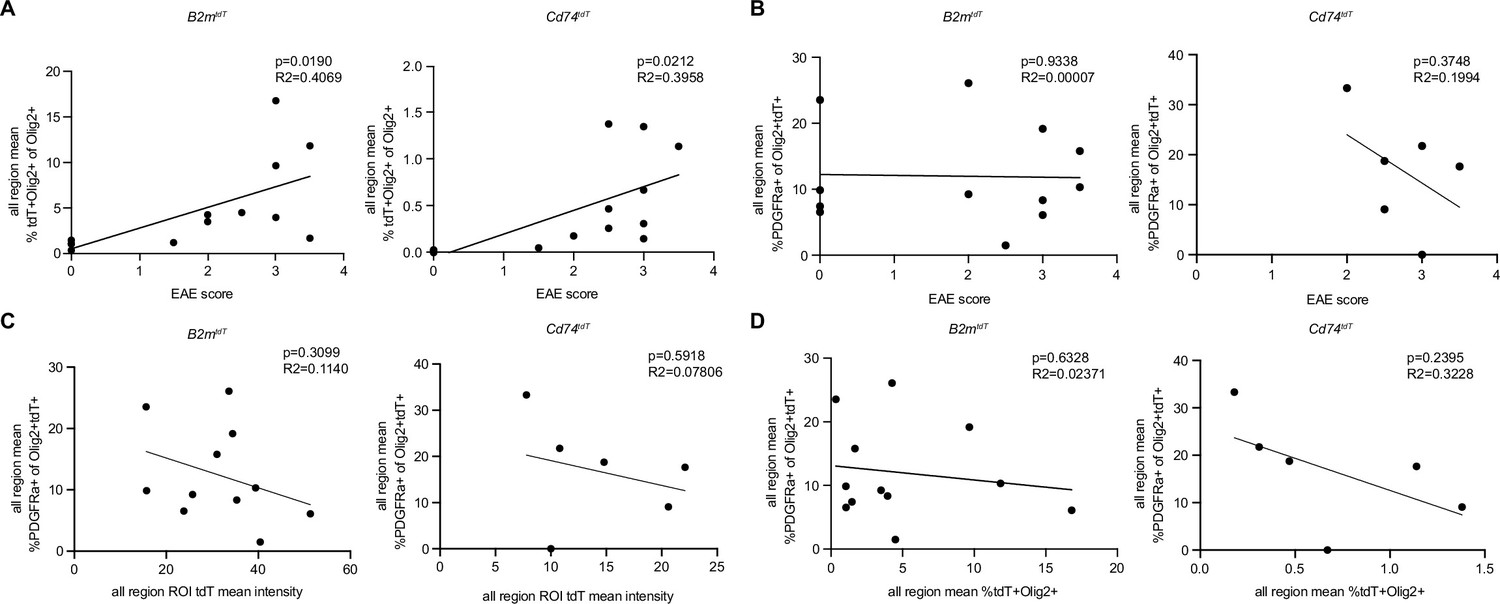
Correlation of experimental autoimmune encephalitis (EAE) score with tdT+ oligodendroglia and PDGFRa+tdT+ oligodendroglia in EAE spinal cord.
(A) Linear regression of all region mean percentage of tdT+Olig2+ oligodendroglia compared to EAE clinical score in MOG35-55 EAE spinal cord. n=13 mice/reporter. (B) Linear regression of all region mean percentage of PDGFRa+tdT+Olig2+ oligodendroglia compared to EAE clinical score. n=12 mice/ B2mtdT and 6 mice/Cd74tdT reporters. (C) Linear regression of all region mean percentage of PDGFRa+tdT+Olig2+ oligodendroglia compared to all region region of interest (ROI) tdT mean intensity. n=12 mice/B2mtdT and 6 mice/ Cd74tdT reporters. (D) Linear regression of all region mean percentage of PDGFRa+tdT+Olig2+ oligodendroglia compared to all region mean percentage of tdT+Olig2+ oligodendroglia. n=12 mice/B2mtdT and 6 mice/Cd74tdT reporters.
-
Figure 7—figure supplement 1—source data 1
Immunohistochemistry quantification, sheets are labeled with letter corresponding to data panels in Figure 7—figure supplement 1.
- https://cdn.elifesciences.org/articles/82938/elife-82938-fig7-figsupp1-data1-v2.xlsx
Figure 7—figure supplement 2
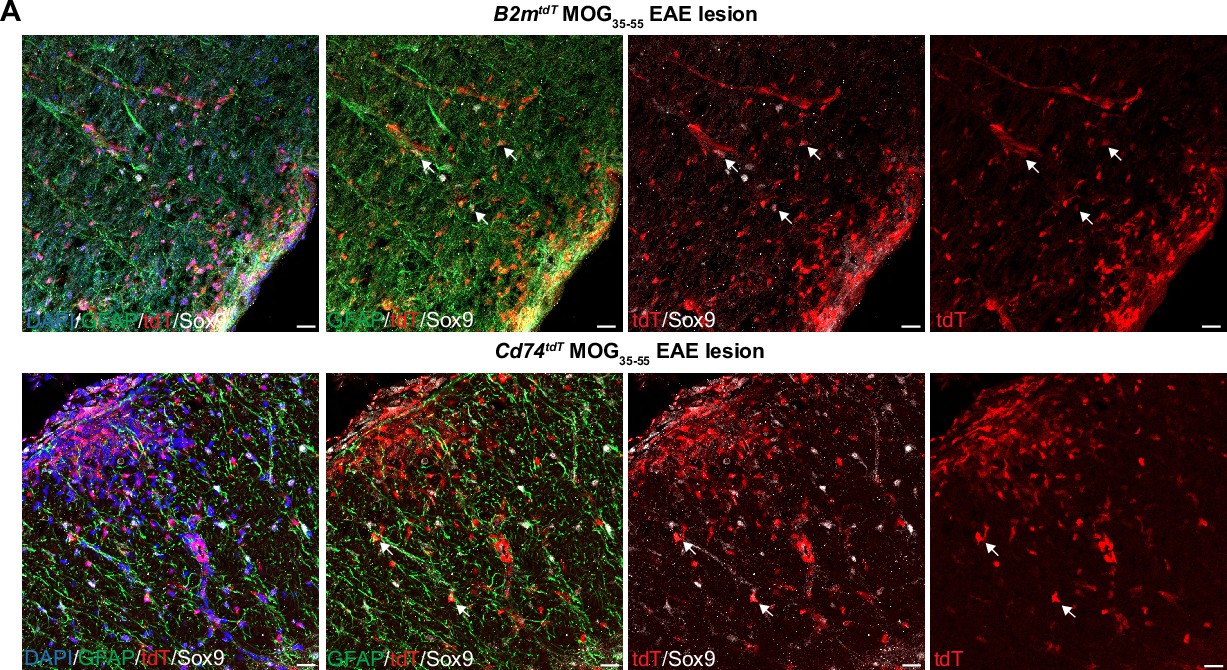
Major histocompatibility complex (MHC) reporter expression in astrocytes in MOG35-55 experimental autoimmune encephalitis (EAE) spinal cord lesions.
(A) Representative confocal imaging of tdT+Sox9+ astrocytes in B2mtdT and Cd74tdT EAE spinal cord lesion indicated by arrows. Scale bars, 20 µm.
Figure 8 with 2 supplements
Oligodendroglial major histocompatibility complex (MHC) reporter expression in the brain of central nervous system (CNS) inflammatory models.
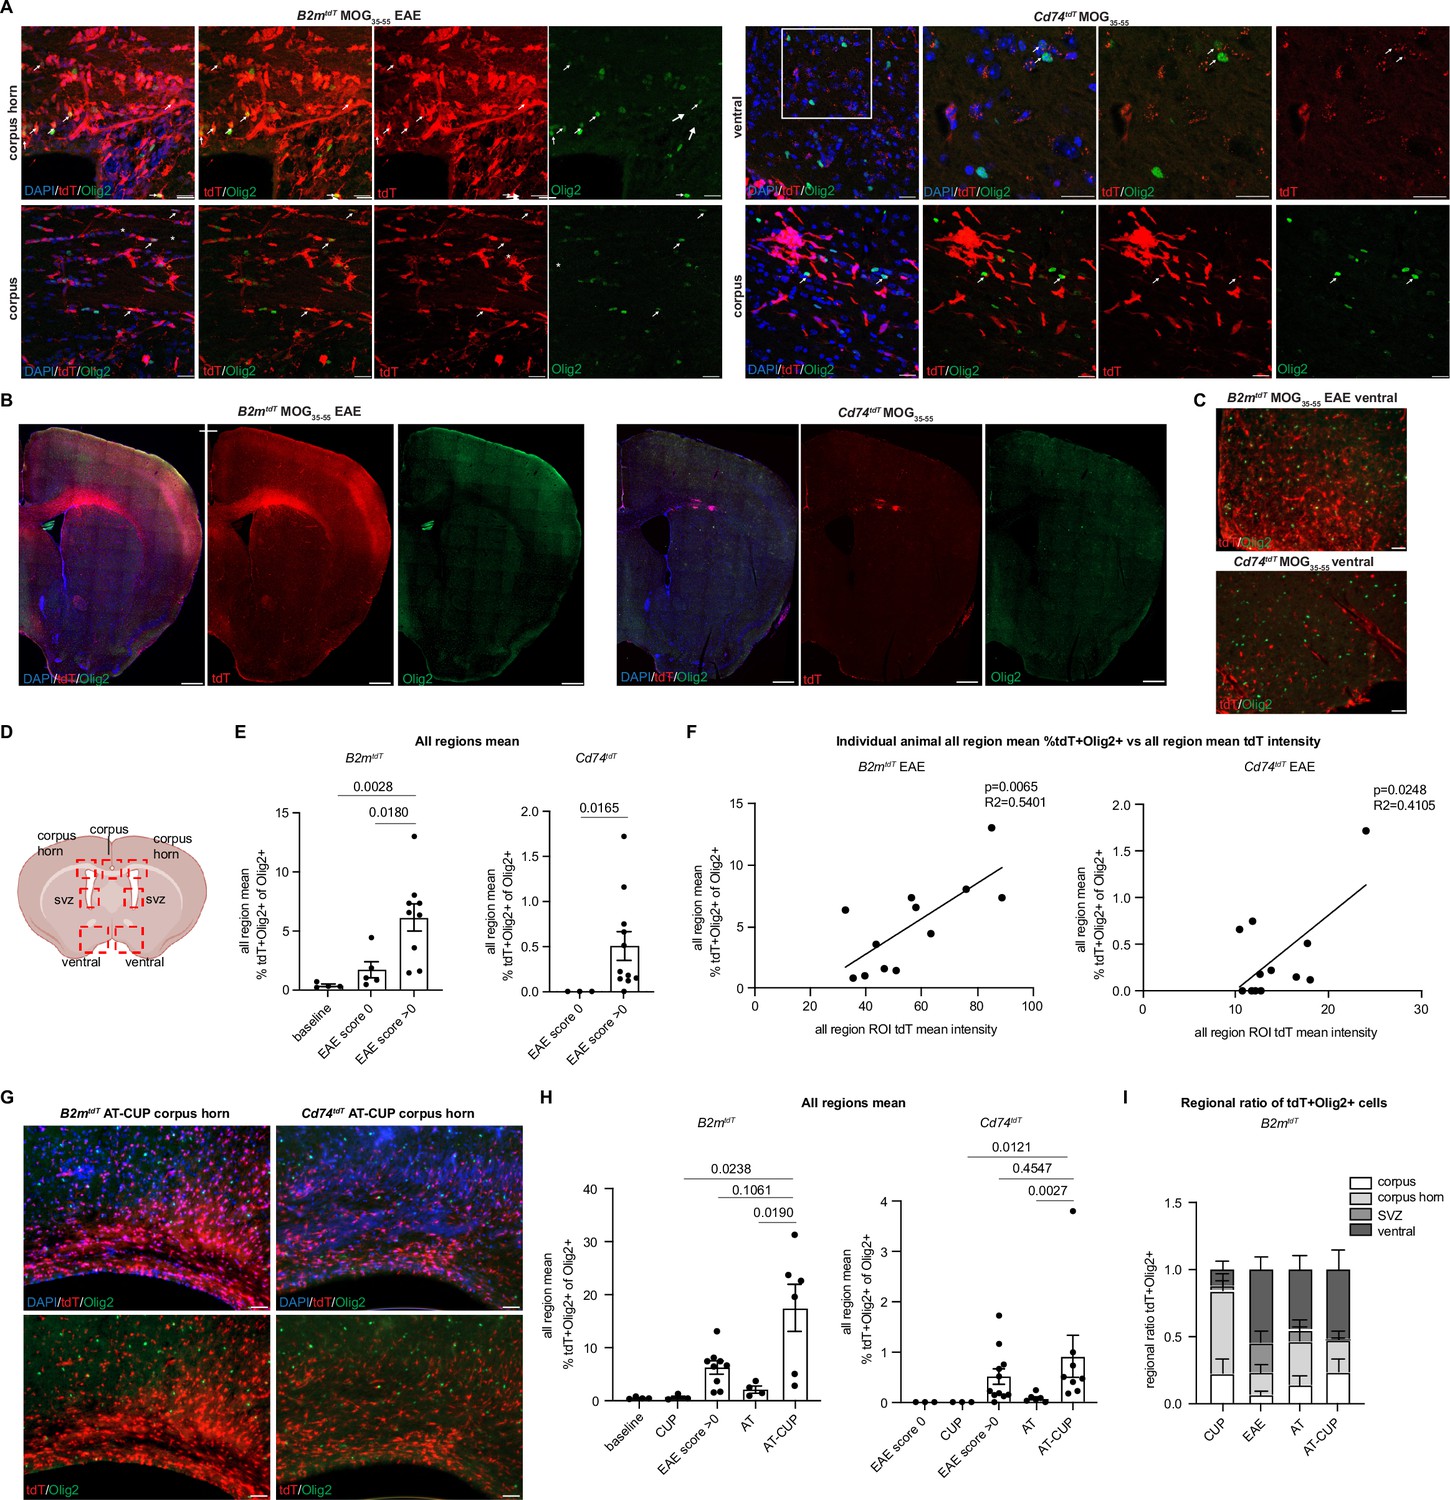
(A) Confocal imaging of tdT reporter-positive oligodendroglia in MOG35-55 experimental autoimmune encephalitis (EAE) B2mtdT and Cd74tdT brain. Endogenous tdT reporter-positive oligodendroglia indicated by arrows. Scale bars, 20 µm. (B) Representative images of MOG35-55 EAE B2mtdT and Cd74tdT brain with corpus callosum TdT-positive infiltrate. Scale bars, 500 µm. (C) Representative images of B2mtdT and Cd74tdT MOG35-55 ventral brain used for region of interest (ROI) analysis of tdT+ oligodendroglia. Scale bars, 50 µm. (D) Diagram of seven ROIs imaged in brain sections. Figure made in https://www.biorender.com/. (E) Quantification of percentage of tdT+Olig2+ oligodendroglia in B2mtdT and Cd74tdT brain. Data points are an individual animal mean across all regions analyzed. n=3–5 mice baseline and score 0, n=9–11 EAE score >0. Unpaired Mann-Whitney t-test. Data represented are means ± s.e.m. (F) Linear regression of all region mean percentage of tdT+Olig2+ oligodendroglia compared to all region mean tdT mean fluorescent intensity in MOG35-55 EAE brain. n=12 mice/reporter. Data points are individual animals. (G) Representative images of B2mtdT and Cd74tdT AT-CUP corpus callosum used for ROI analysis of tdT+ oligodendroglia. Scale bars, 50 µm. (H) Quantification of percentage of tdT+Olig2+ oligodendroglia in B2mtdT and Cd74tdT brain of CNS inflammatory models. Data points are an individual animal mean across all regions analyzed. n=3–9 mice/group. Unpaired Mann-Whitney t-test. Data represented are means ± s.e.m. (I) Regional ratio of tdT+Olig2+ oligodendroglia in four regions analyzed in B2mtdT brain. For each individual animal total tdT+Olig2+ cells in each region taken as a proportion of all tdT+Olig2+ oligodendroglia across all brain regions for that animal. n=3–9 mice/group. Data represented are means ± s.e.m. AT - adoptive transfer, AT-CUP - adoptive transfer cuprizone, CUP - cuprizone, ROI - region of interest.
-
Figure 8—source data 1
Images from confocal Z-stack from Imaris reconstruction of Figure 8—video 1.
- https://cdn.elifesciences.org/articles/82938/elife-82938-fig8-data1-v2.zip
-
Figure 8—source data 2
Immunohistochemistry quantification, sheets are labeled with letter corresponding to data panels in Figure 8.
- https://cdn.elifesciences.org/articles/82938/elife-82938-fig8-data2-v2.xlsx
Figure 8—figure supplement 1
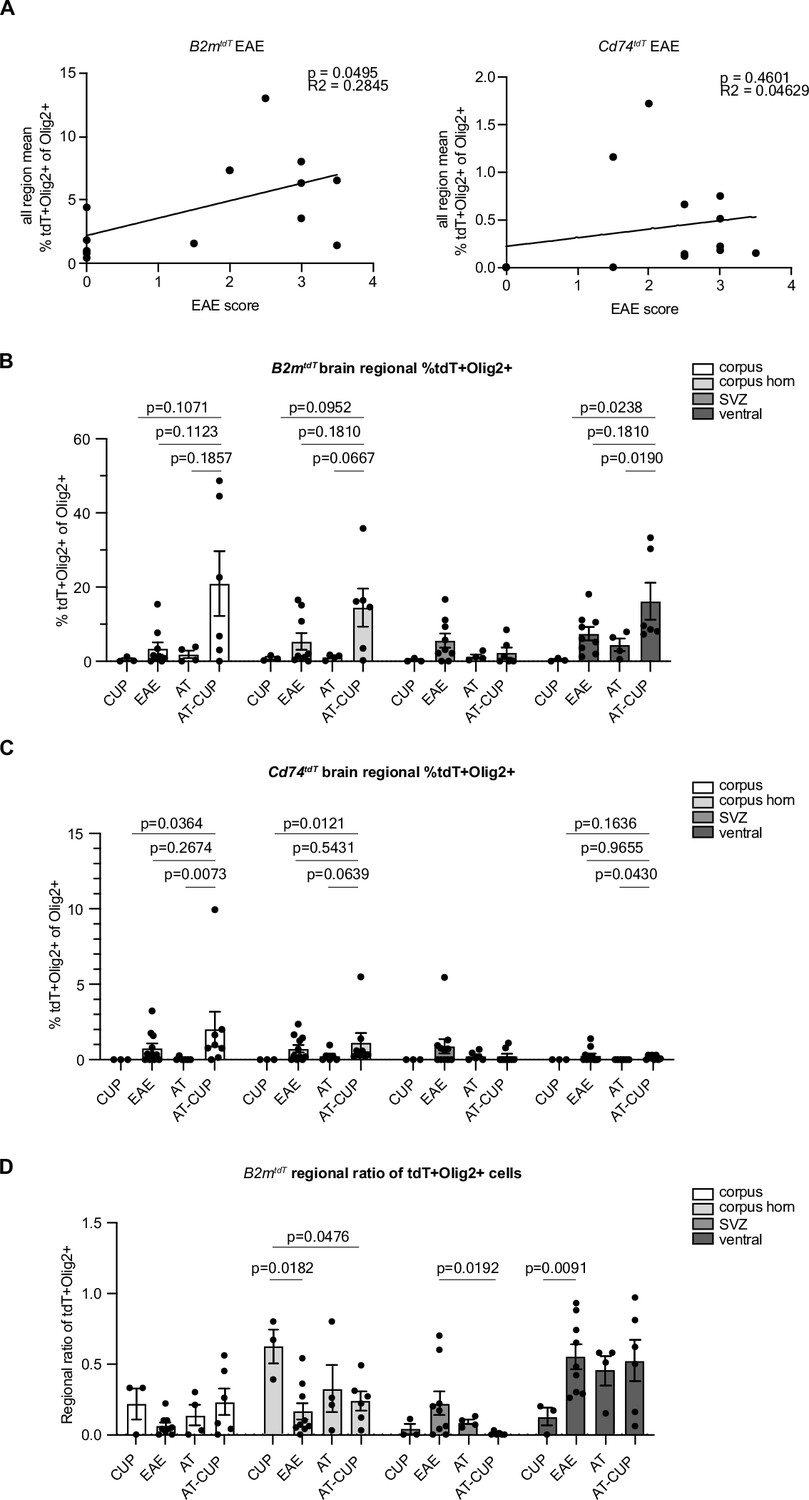
Correlation of experimental autoimmune encephalitis (EAE) score with tdT+ oligodendroglia in EAE brain and regional ratio of tdT+ oligodendroglia across brain regions of central nervous system (CNS) inflammatory models.
(A) Linear regression of all region mean percentage of tdT+Olig2+ oligodendroglia compared to EAE clinical score in MOG35-55 EAE brain. n=14 mice/reporter. (B) Quantification of mean tdT+Olig2+ oligodendrogliaby brain region of different CNS inflammatory models of B2mtdT reporter mice. n=3–9 mice/group. Unpaired Mann-Whitney t-test. Data represented are means ± s.e.m. (C) Quantification of mean tdT+Olig2+ oligodendroglia by brain region of different CNS inflammatory models of Cd74tdT reporter mice. n=3–11 mice/group. Unpaired Mann-Whitney t-test. Data represented are means ± s.e.m. (D) Regional ratio of tdT+Olig2+ oligodendroglia in four regions analyzed in B2mtdT brain of different animal models. For each individual animal total tdT+Olig2+ cells in each region taken as a proportion of all tdT+Olig2+ oligodendroglia across all brain regions for that animal. n=3–9 mice/group. Unpaired Mann-Whitney t-test. Data represented are means ± s.e.m. AT - adoptive transfer, AT-CUP - adoptive transfer cuprizone, CUP - cuprizone.
-
Figure 8—figure supplement 1—source data 1
Immunohistochemistry quantification, sheets are labeled with letter corresponding to data panels in Figure 8—figure supplement 1.
- https://cdn.elifesciences.org/articles/82938/elife-82938-fig8-figsupp1-data1-v2.xlsx
Figure 8—video 1
Imaris 3D reconstruction of Cd74tdT MOG35-55 experimental autoimmune encephalitis (EAE) ventral brain confocal Z-stack.
Cd74tdT endogenous expression (red) found within two Olig2-positive (green) oligodendroglia with DAPI counterstain (blue).
Figure 9 with 2 supplements
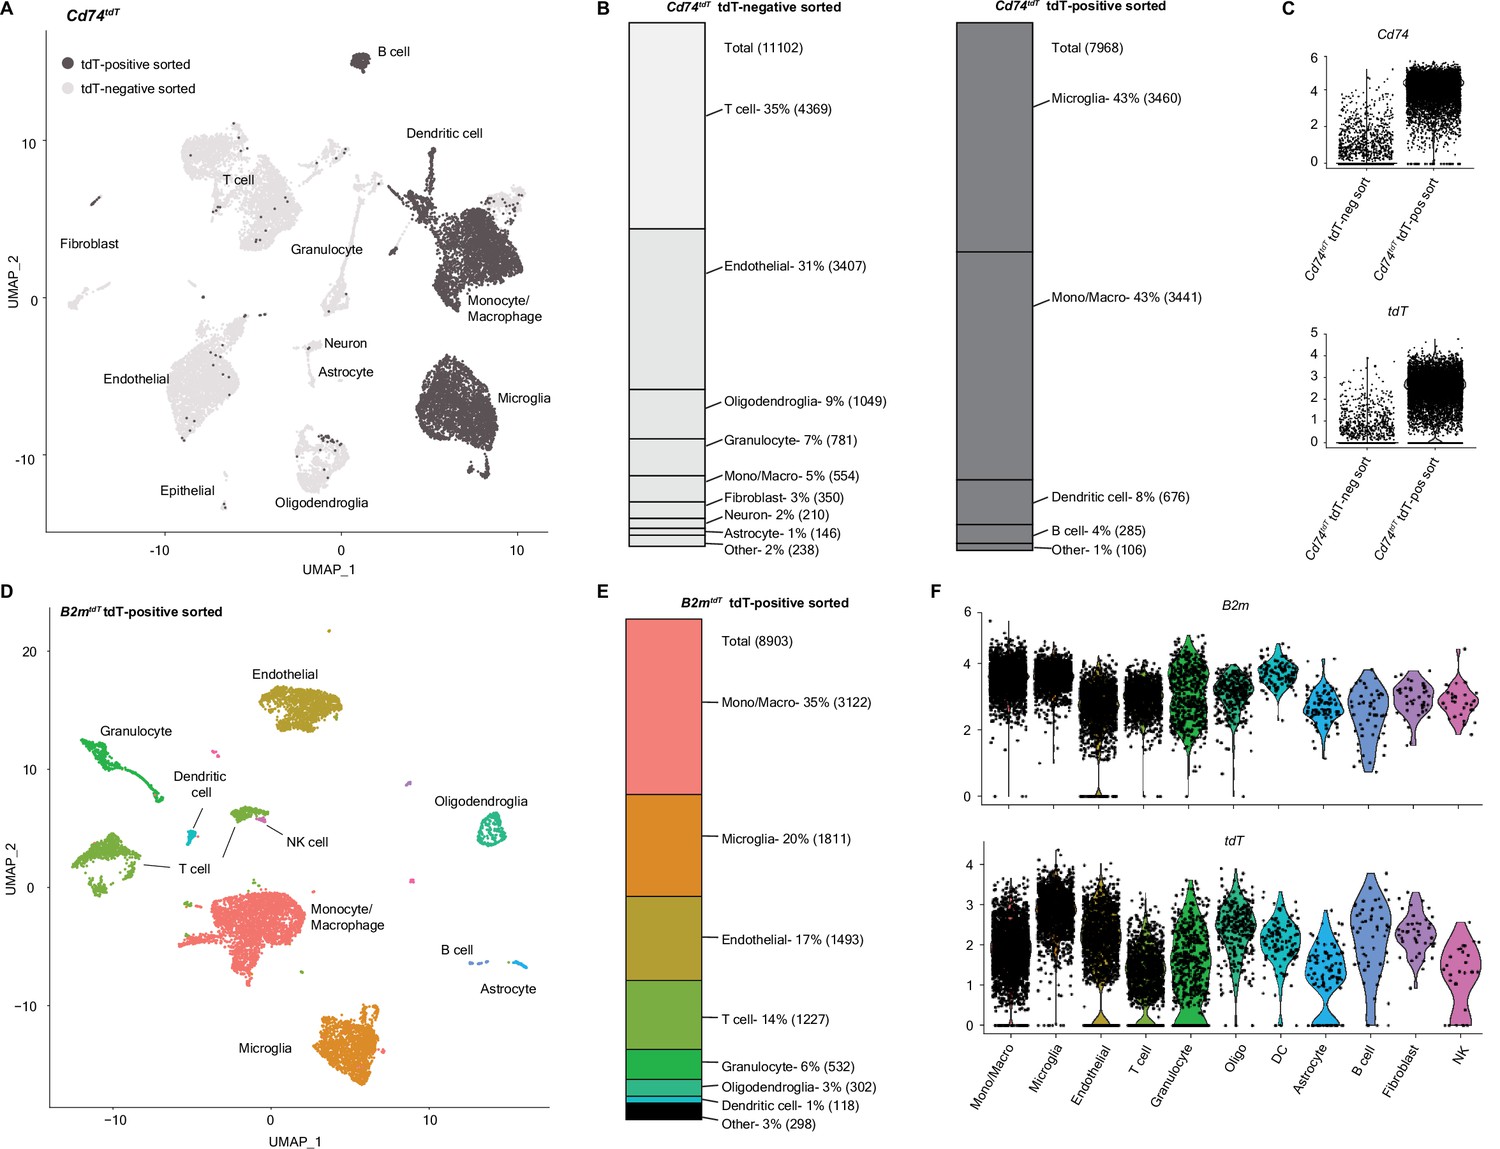
Single-cell RNA sequencing (scRNA-seq) of Cd74tdT and B2mtdT MOG35-55 experimental autoimmune encephalitis (EAE) brain.
(A) Uniform Manifold Approximation and Projection (UMAP) Cd74tdT MOG35-55 EAE brain scRNA-seq tdT-positive sorted cells (dark gray) and tdT-negative sorted cells (light gray). n=3 pooled Cd74tdT EAE animals. (B) Cell identity percentages in Cd74tdT tdT-positive and tdT-negative sorted cells, total cell count in parentheses. (C) Violin plots of log normalized expression levels of Cd74 and tdT transcripts in tdT-positive and tdT-negative sorted samples. (D) UMAP B2mtdT MOG35-55 EAE brain scRNA-seq TdT-positive sorted cells. n=3 pooled B2mtdT EAE animals. (E) Cell identity percentages in B2mtdT tdT-positive sorted cells, cell count in parentheses. (F) Violin plots of log normalized expression levels of B2m and tdT transcripts in B2mtdT tdT-positive sorted cell clusters. DC - dendritic cells; Mono/Macro - monocyte/macrophage; NK - natural killer.
-
Figure 9—source data 1
QC metrics for single-cell RNA sequencing data.
- https://cdn.elifesciences.org/articles/82938/elife-82938-fig9-data1-v2.xlsx
Figure 9—figure supplement 1

Single-cell RNA sequencing (scRNA-seq) gating strategy and validation of clusters.
(A) Gating strategy for Cd74tdT MOG35-55 experimental autoimmune encephalitis (EAE) brains sorted for tdT-positive and tdT-negative cells. (B) Gating strategy for B2mtdT MOG35-55 EAE brains sorted for tdT-positive and tdT-negative cells. (C) Expression level of cell type-specific transcripts to confirm cluster identities in Cd74tdT MOG35-55 EAE.
Figure 9—figure supplement 2
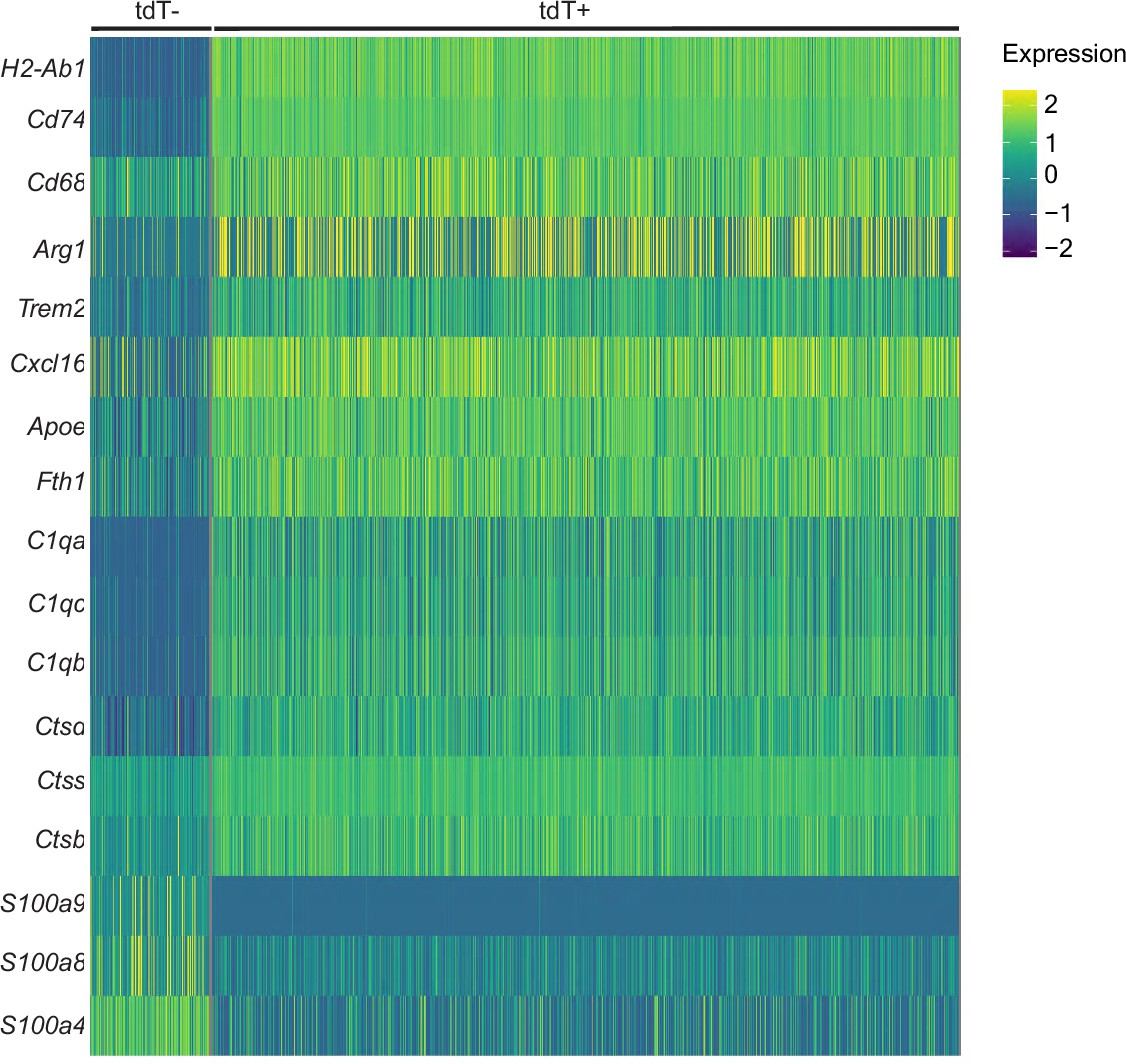
Cd74tdT MOG35-55 experimental autoimmune encephalitis (EAE) brain single-cell RNA sequencing (scRNA-seq) monocyte/macrophage cluster differential transcript expression levels.
Heatmap of scaled expression levels in tdT-negative and tdT-positive sorted myeloid/macrophage cluster for major histocompatibility complex (MHC) class II (H2-Ab1, CD74), M2 activation (CD68, Arg1), inflammatory signaling receptor (Trem2), M2 macrophage infiltration chemokine (Cxcl16), lipid metabolism (Apoe), ferritin light chain (Fth1), complement (C1qa, C1qb, C1qc), lysosomal proteases (Ctsd, Ctss, Ctsb), and calcium sensing transcripts (s100a4, c100a8, s100a9).
-
Figure 9—figure supplement 2—source data 1
Differential gene analysis data from myeloid/macrophage tdT-positive and tdT-negative clusters.
- https://cdn.elifesciences.org/articles/82938/elife-82938-fig9-figsupp2-data1-v2.xlsx
Figure 10 with 1 supplement
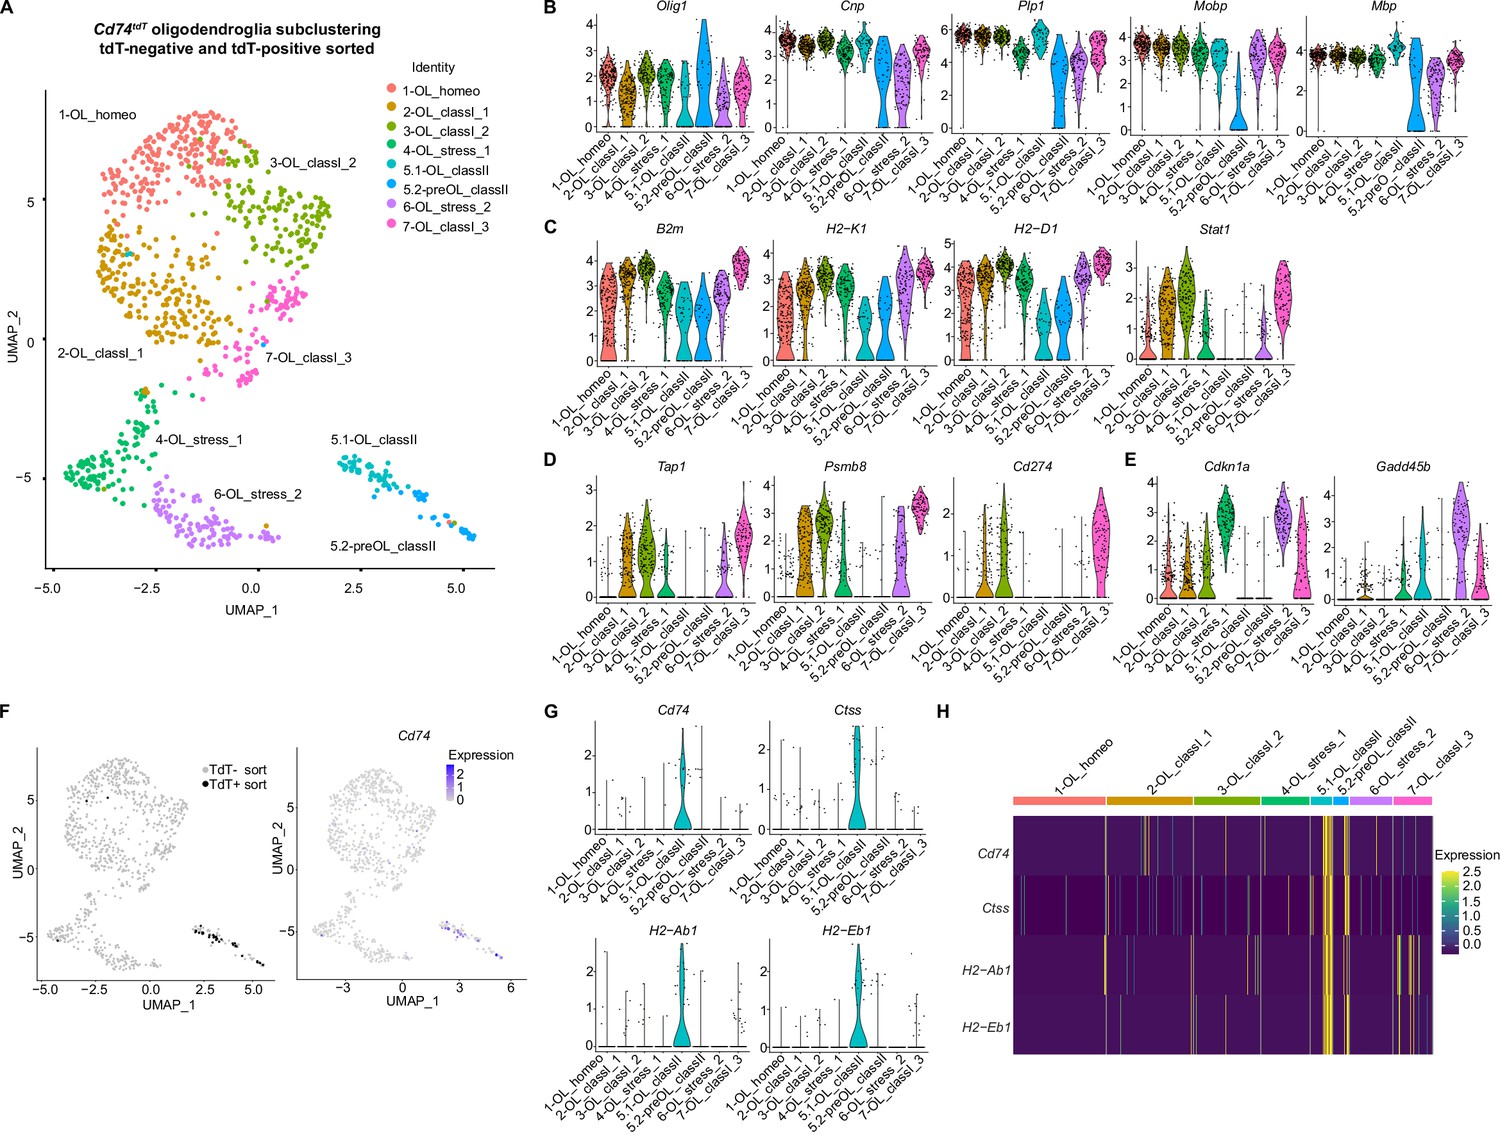
Oligodendroglial subclustering of single-cell RNA sequencing of Cd74tdT MOG35-55 experimental autoimmune encephalitis (EAE) brain.
(A) Uniform Manifold Approximation and Projection (UMAP) Cd74tdT MOG35-55 EAE brain tdT-positive and tdT-negative sorted cells with eight oligodendroglial subclusters. (B) Violin plots of oligodendroglial markers Olig1, Cnp, Plp, Mobp, and Mbp transcript levels in oligodendroglial subclusters. (C) Violin plots of major histocompatibility complex (MHC) class I (B2m, H2-K1, H2-D1), and Stat1 transcript levels. (D) Violin plots of antigen transport (Tap1), immunoproteasome (Psmb8), and Cd274/PD-L1 transcript levels. (E) Violin plots of cell cycle arrest Cdkn1a and Gadd45b. (F) UMAP indicating tdT-positive and tdT-negative sorted cells and Cd74 transcript expression levels. (G) Violin plots of MHC class II transcripts (Cd74, Ctss, H2-Ab1, H2-Eb1). (H) Heatmap of MHC class II (Cd74, H2-Ab1, H2-Aa, H2-Eb1) expression levels in oligodendroglial subclusters.
-
Figure 10—source data 1
Differential gene analysis data of oligodendroglial subclusters depicted in Figure 10.
- https://cdn.elifesciences.org/articles/82938/elife-82938-fig10-data1-v2.xlsx
Figure 10—figure supplement 1
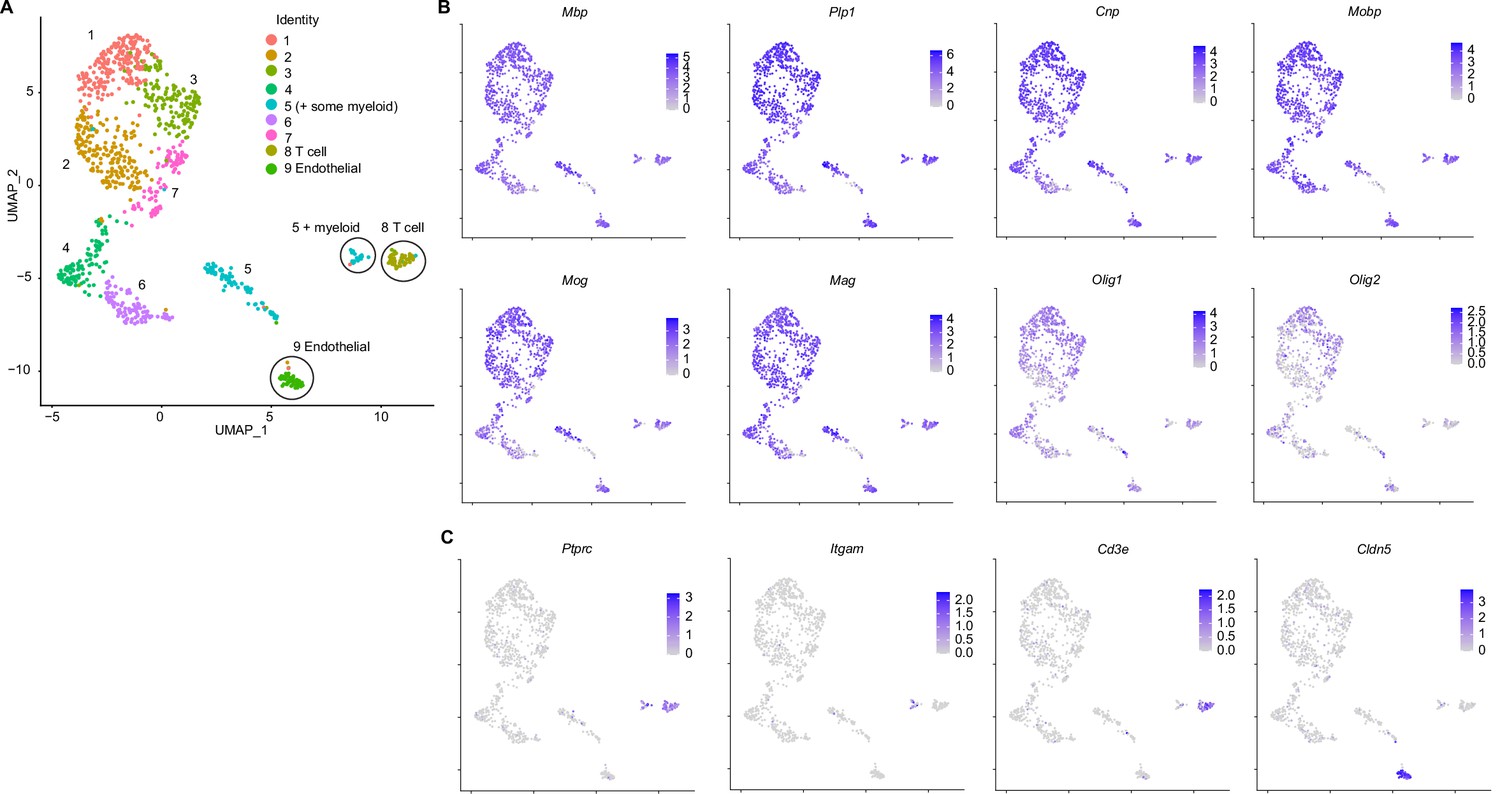
Oligodendroglial subclustering with contaminating clusters.
(A) Uniform Manifold Approximation and Projection (UMAP) of oligodendroglial subclusters with nine clusters identified and contaminating clusters circled (subset of 5, 8, and 9). (B) UMAP of myelin transcript (Mbp, Plp1, Cnp, Mobp, Mog, Mag) and pan-oligodendroglial transcript (Olig1 and Olig2) expression in oligodendroglial and contaminating clusters. (C) UMAP of contaminating cluster transcripts - Ptprc in myeloid and T cell clusters, Itgam in myeloid cluster, Cd3e in T cell cluster, and Cldn5 in endothelial cluster.
-
Figure 10—figure supplement 1—source data 1
Differential gene analysis of each contaminating cluster compared to other oligodendroglial subclusters depicted in Figure 10—figure supplement 1.
- https://cdn.elifesciences.org/articles/82938/elife-82938-fig10-figsupp1-data1-v2.xlsx
Figure 11 with 1 supplement
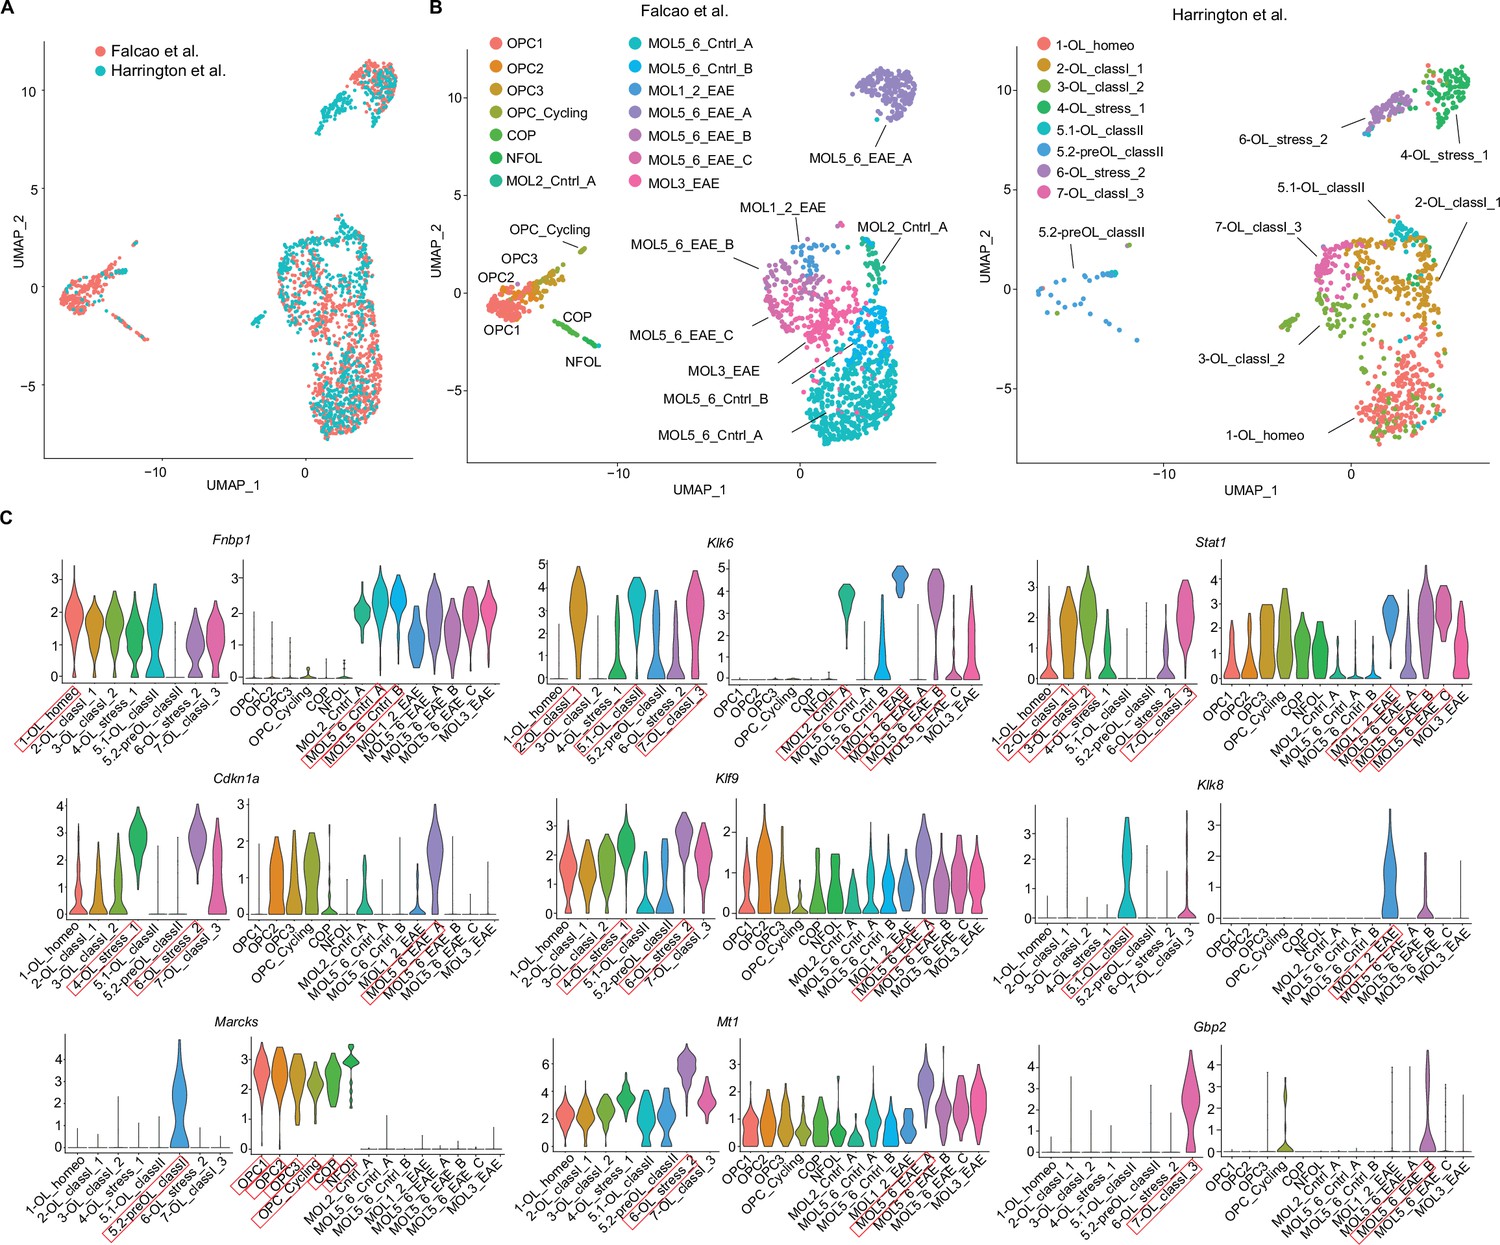
Integration of single-cell RNA sequencing experimental autoimmune encephalitis (EAE) oligodendroglial cluster dataset with previously published Falcao et al. EAE oligodendroglial cluster dataset.
(A) Uniform Manifold Approximation and Projection (UMAP) of subclustering of combined datasets of Cd74tdT oligodendroglial subclusters from EAE brain and Falcao et al. OPC reporter line oligodendroglial subclusters from EAE spinal cord. (B) UMAP of oligodendroglial subclustering with Falcao et al. dataset on left with labels of subclusters as previously published, and our dataset on right with corresponding Figure 10 labels. (C) Violin plots of differentially expressed transcripts from each of our subclusters and corresponding transcript expression in Falcao et al. dataset. Red boxes indicate subcluster with highest expression and corresponding subcluster in Falcao et al. dataset based on UMAP location in panel B.
Figure 11—figure supplement 1
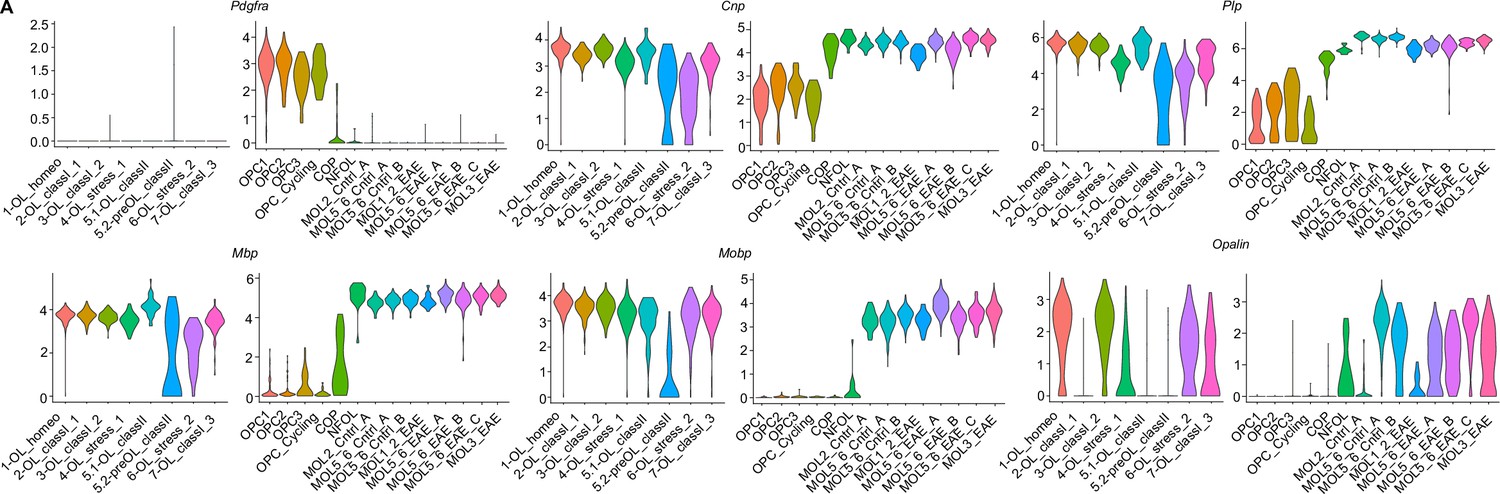
Differential expression of oligodendroglial transcripts in our experimental autoimmune encephalitis (EAE) oligodendroglial subclusters and Falcao et al. oligodendroglial subclusters.
(A) Violin plots of OPC transcript (Pdgfra) and myelin transcripts (Cnp, Plp, Mbp, Mobp) and myelin paranodal protein Opalin.
Additional files
-
Transparent reporting form
- https://cdn.elifesciences.org/articles/82938/elife-82938-transrepform1-v2.pdf
-
Source code 1
Code used to analyze single cell datasets.
- https://cdn.elifesciences.org/articles/82938/elife-82938-code1-v2.zip
Download links
A two-part list of links to download the article, or parts of the article, in various formats.
Downloads (link to download the article as PDF)
Open citations (links to open the citations from this article in various online reference manager services)
Cite this article (links to download the citations from this article in formats compatible with various reference manager tools)
MHC class I and MHC class II reporter mice enable analysis of immune oligodendroglia in mouse models of multiple sclerosis
eLife 12:e82938.
https://doi.org/10.7554/eLife.82938


