Transiently heritable fates and quorum sensing drive early IFN-I response dynamics
- Laboratory of Immunoengineering, Department of Biomedical Engineering, Eindhoven University of Technology, Netherlands
- Institute for Complex Molecular Systems (ICMS), Eindhoven University of Technology, Netherlands
- Department of Biomedical Engineering, Eindhoven University of Technology, Netherlands
- Department of Electrical and Computer Engineering, University of Delaware, United States
Figures
Figure 1 with 2 supplements
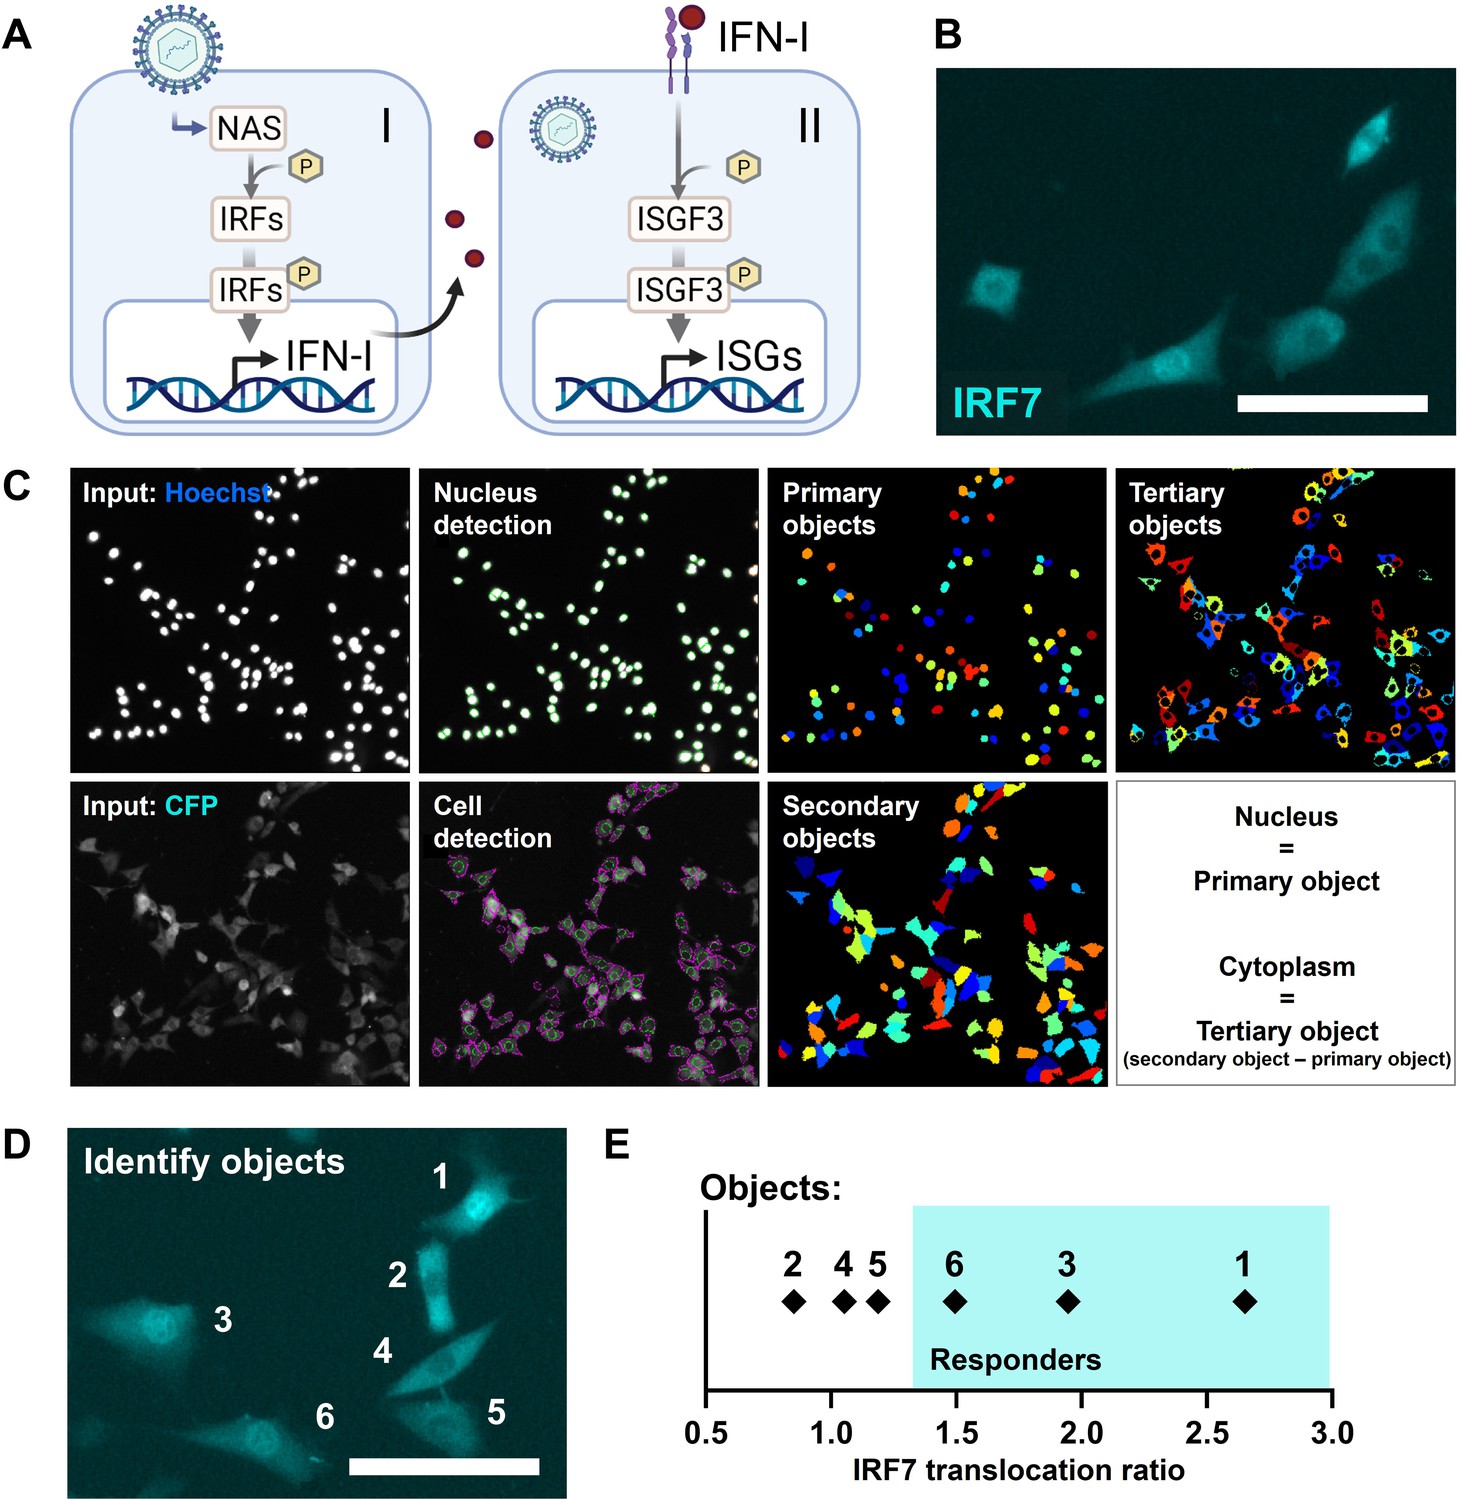
Reporter cell model to study early type I interferon (IFN-I) responses.
(A) Schematic overview of the early (I) and later (II) phase IFN-I responses. The early phase is characterized by the detection of nucleic acids by nucleic acid receptors (NAS), followed by the phosphorylation (p) and translocation of interferon regulatory factors (IRFs) and subsequent induction of IFN-Is. Upon paracrine signaling, IFN-Is bind to IFN-I receptors (IFNARs), leading to the phosphorylation and translocation of interferon-stimulated gene factor 3 (ISGF3), consisting of STAT1, STAT2, and IRF9, respectively, inducing the production of interferon-simulated genes (ISGs). (B) Microscopy image of NIH3T3 cells stably expressing the fusion protein IRF7-CFP. Scale bar equals 100 μm. (C) Image processing and analysis steps in CellProfiler script for the detection of fluorescent signal in the nuclei and cytoplasms. (D) Example image with six identified objects. Scale bar equals 100 μm. (E) IRF7 translocation ratios of example objects plotted.
Figure 1—figure supplement 1
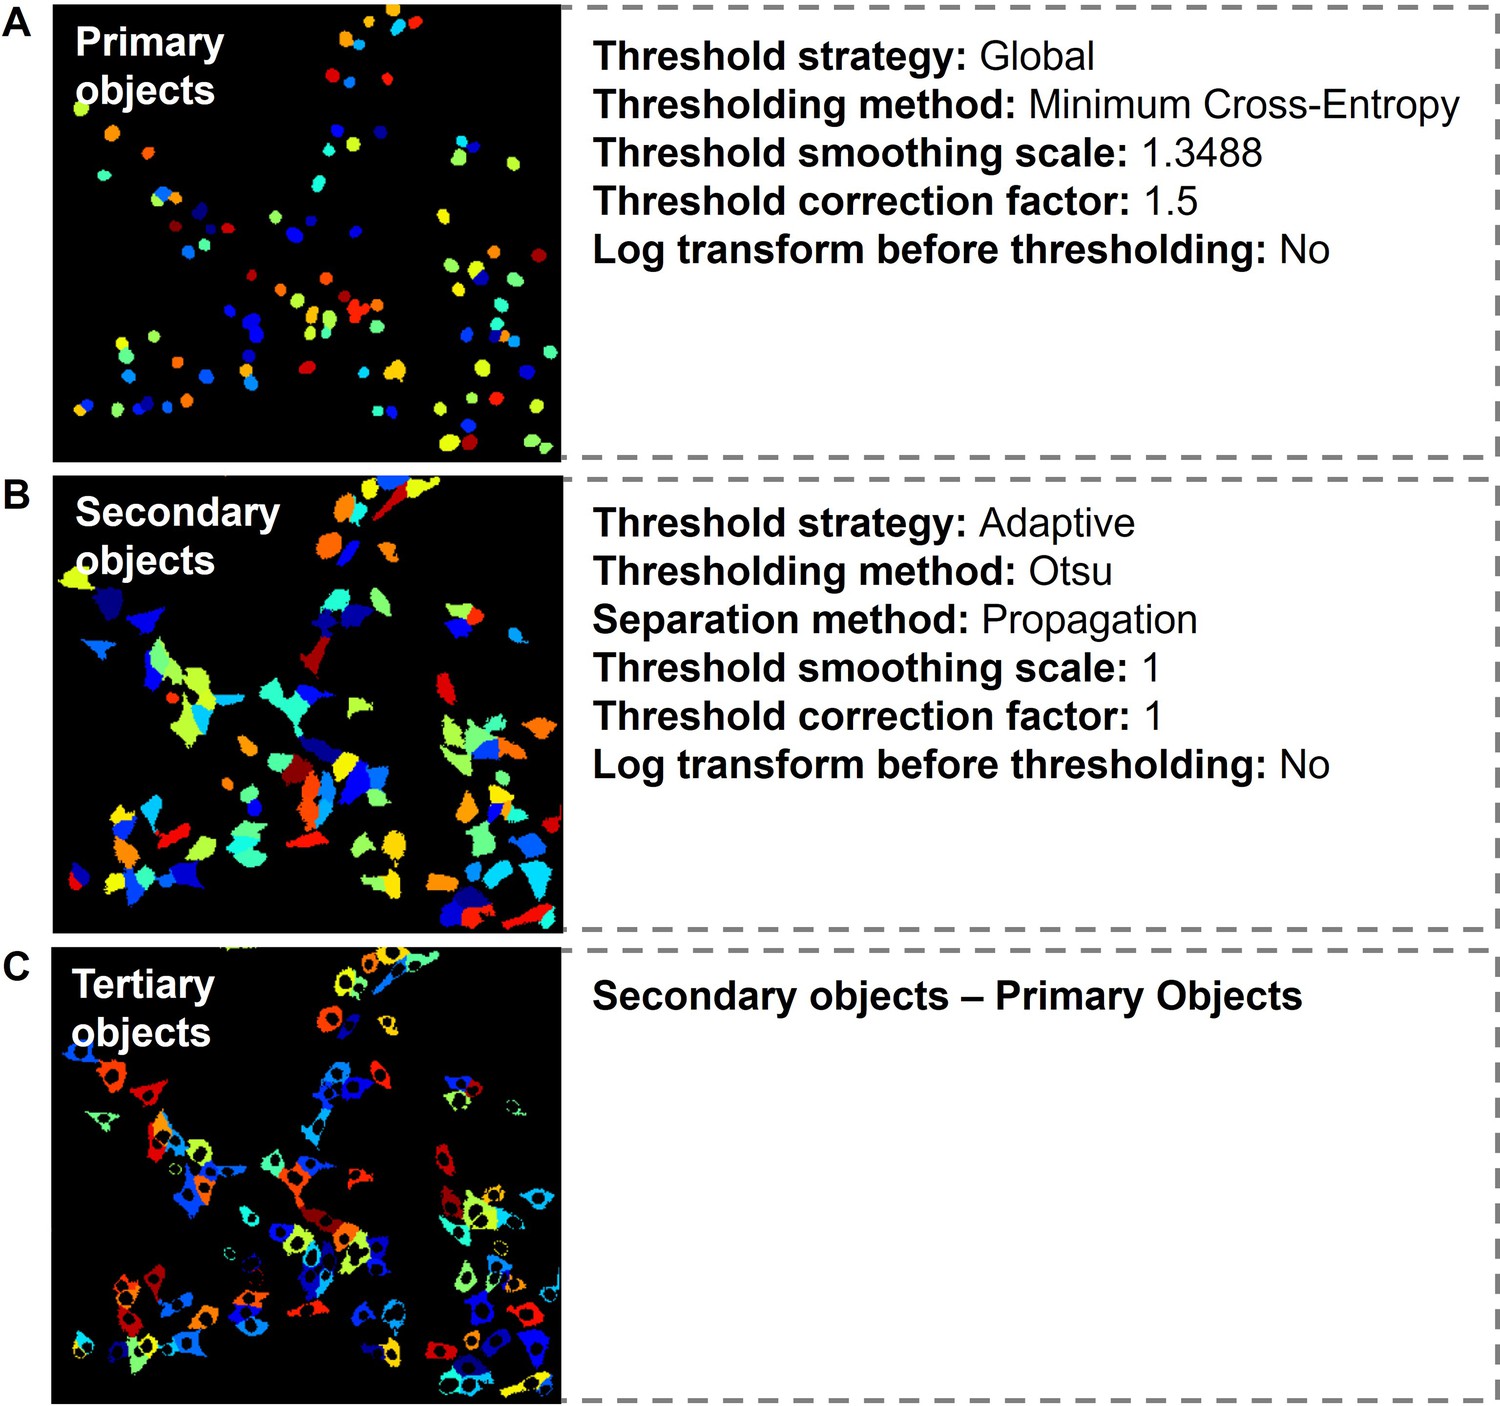
Details on automated script in CellProfiler software.
(A–C) Identification of primary, secondary, and tertiary objects.
Figure 1—figure supplement 2
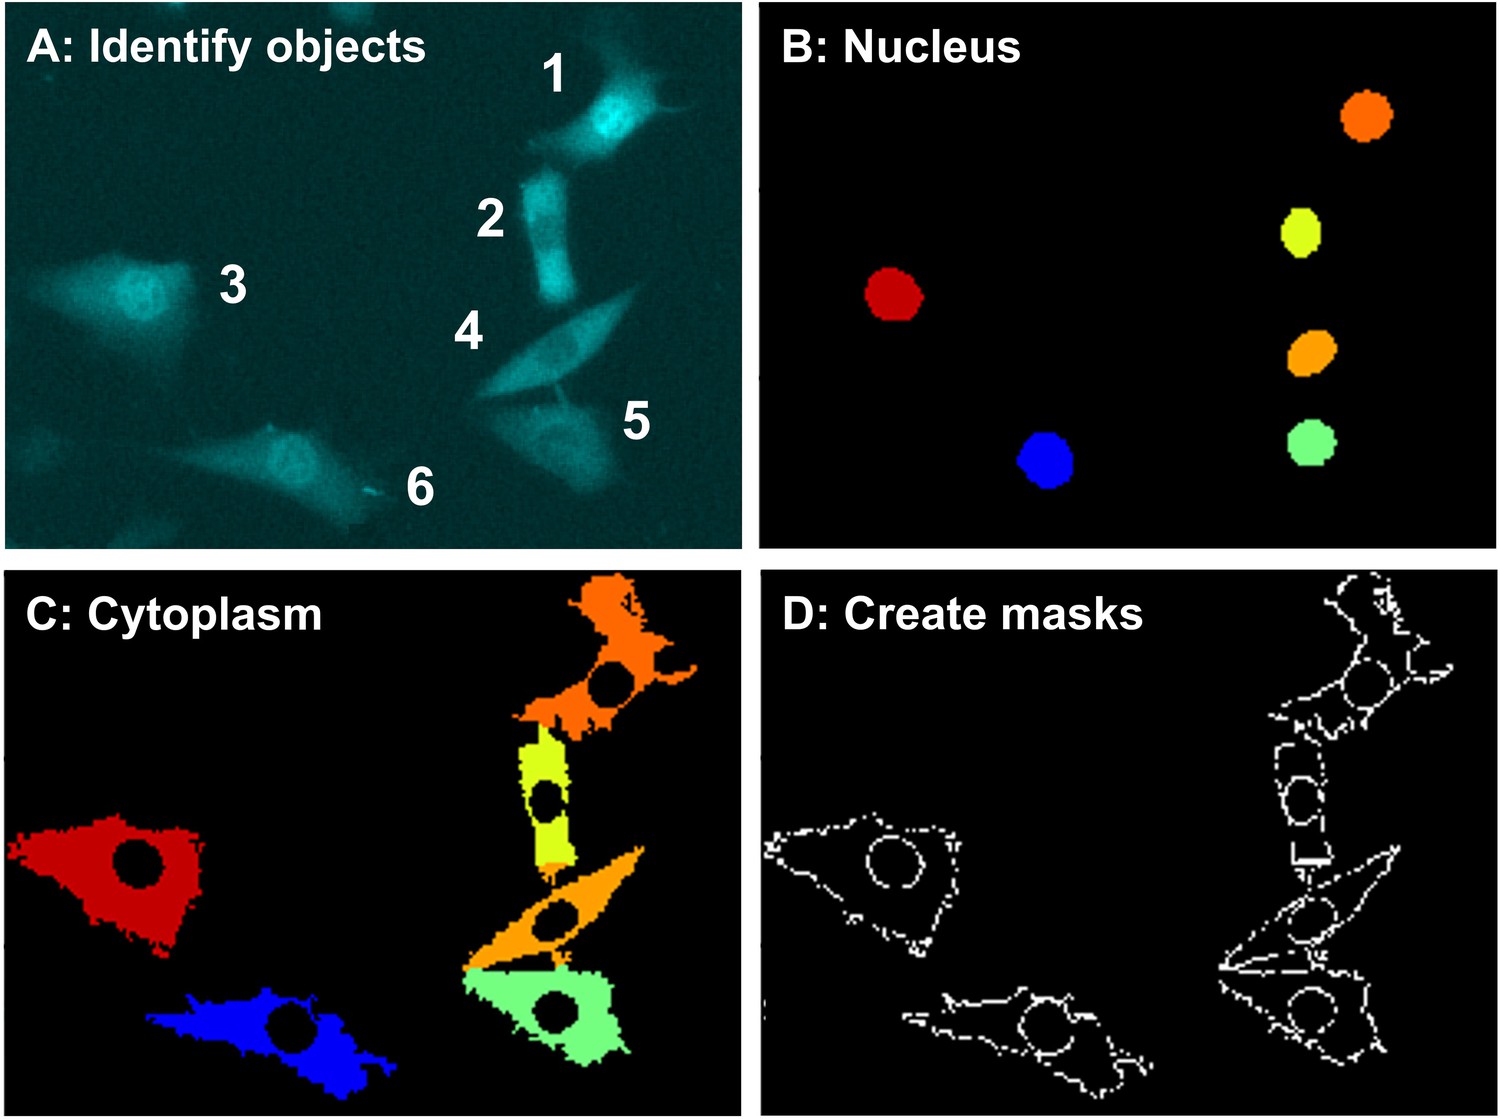
Detailed automated script analysis performance.
(A) Identification and indexing of objects. (B) Detection of nuclei. (C) Detection of cytoplasm. (D) Creation of masks aligning the nuclei and cytoplasm.
Figure 2 with 1 supplement
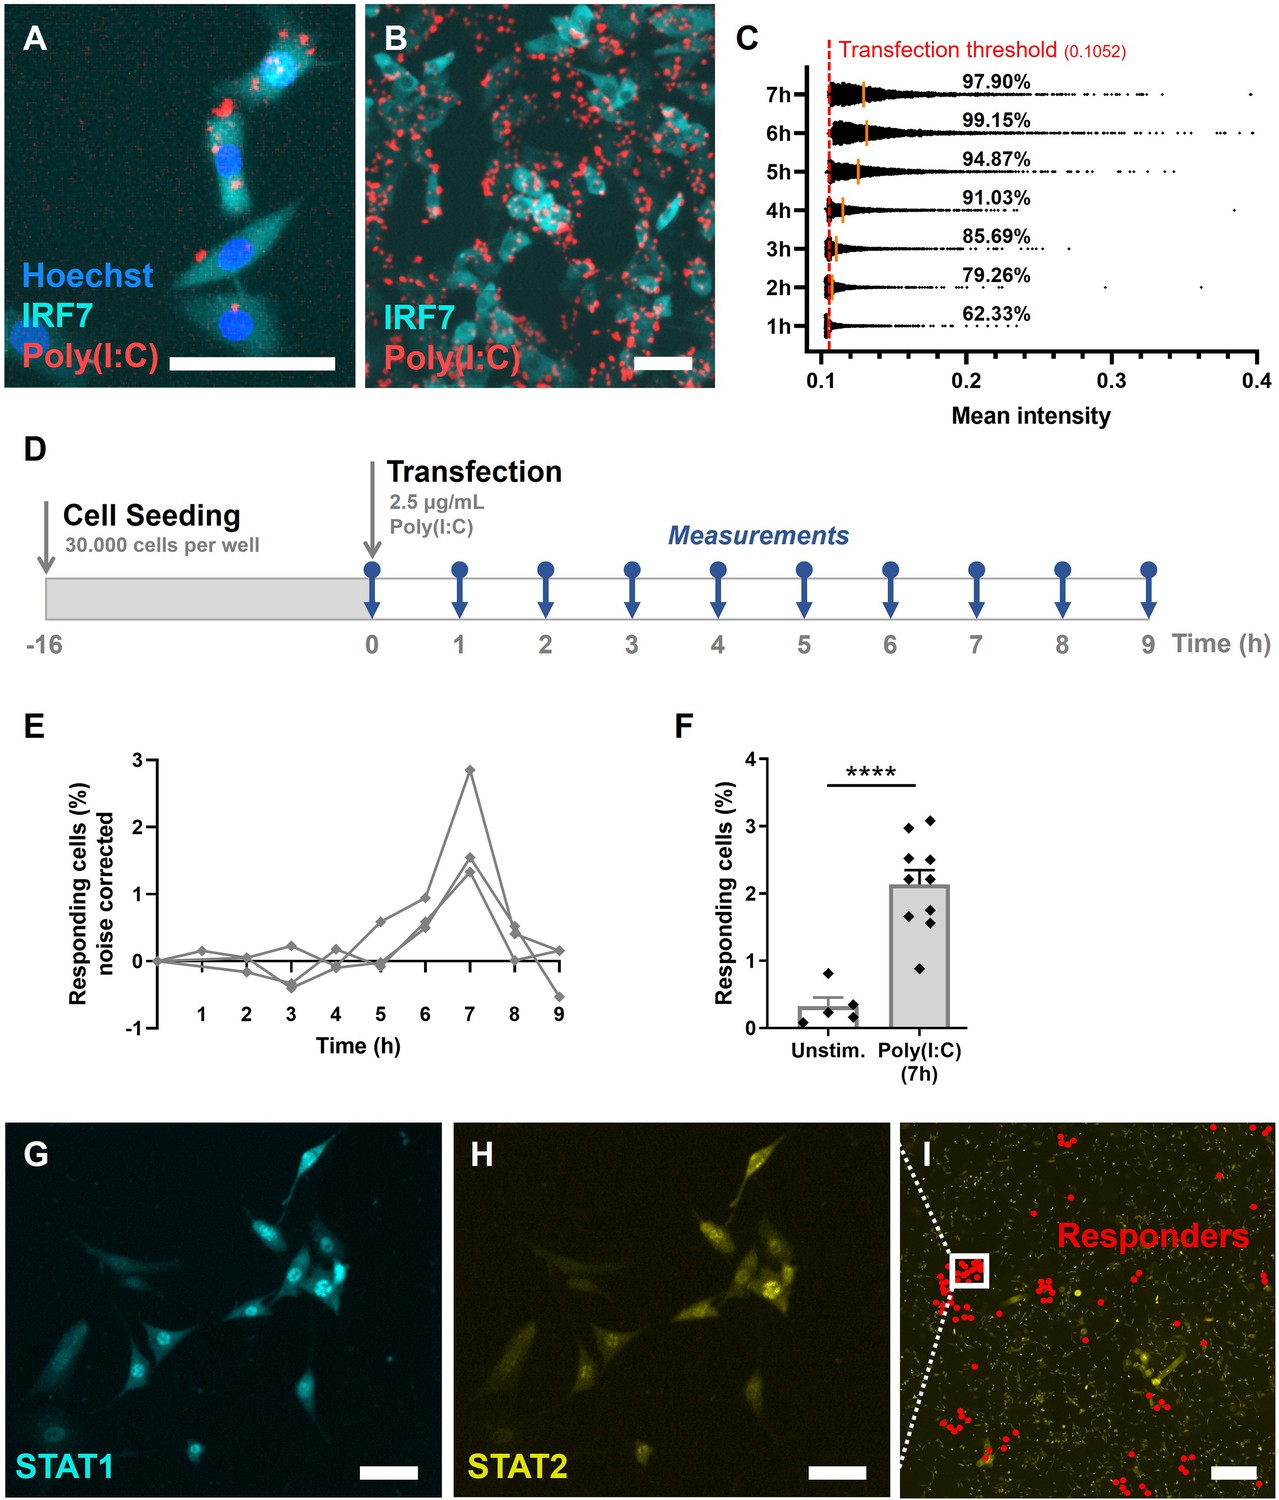
Validation of first responders in reporter cell model.
(A) Microscopy picture of NIH3T3: IRF7-CFP, stained with Hoechst nuclear stain, transfected with rhodamine-labeled Poly(I:C). Scale bar equals 100 μm. (B) Overview of transfected cells. Scale bar equals 100 μm. (C) Transfection efficiency quantification over time, based on rhodamine mean intensity detected in cells. The red dotted line represents the transfection threshold. The orange lines represent the mean values. (D) Experimental design of first responder validation in NIH3T3: IRF7-CFP cells. (E) Percentages of noise corrected responding cells. Cells were seeded on coverslips 16 hr prior to transfection with 2.5 μg/ml Poly(I:C). Over the first 9 hr, the percentages of translocated cells were determined (n = 3 experimental replicates). (F) Percentages of responding cells after 7 hr of Poly(I:C) transfection, compared to unstimulated cells (n = 10; p = 0.0003); data are represented as mean ± standard error of the mean (SEM). ****p ≤ 0.001 (Student’s t-test). (G) Microscopy image of NIH3T3: STAT1-CFP; STAT2-YFP, for additional first responder validation. Cells were seeded and transfected as described before. Translocation of STAT1 was assessed after 7-hr post transfection. Scale bar equals 100 μm. (H) Corresponding image of STAT2-YFP signal. Scale bar equals 100 μm. (I) Corresponding overview image of population of NIH3T3: STAT1-CFP; STAT2-YFP, with responding (translocated) cells indicated with red dots. Scale bar equals 1 mm.
Figure 2—figure supplement 1
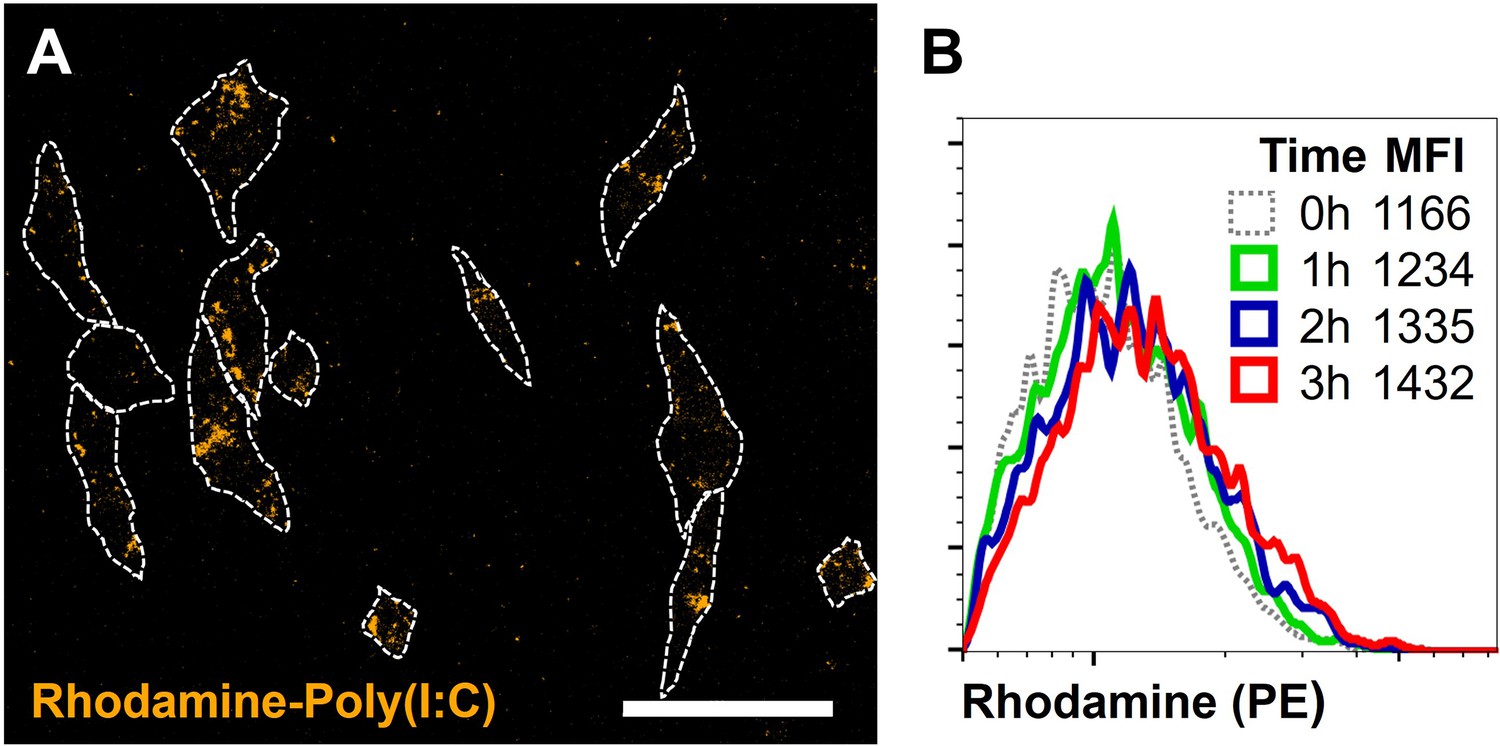
Confocal microscopy and flow cytometry analysis of transfection efficiency.
(A) Fibroblasts were transfected as described previously. After 3 hr, cells were washed, fixed, and analyzed using confocal microscopy. Scale bar equals 100 μm. (B) Fibroblasts were transfected, incubated, trypsinized, thoroughly washed, and measured using flow cytometry. Depicted are the total fibroblast events, for unstimulated (0 hr), and for the first 3 hr after transfection, and their corresponding fluorescent mean fluorescent intensity (MFI) values for PE-Rhodamine.
Figure 3
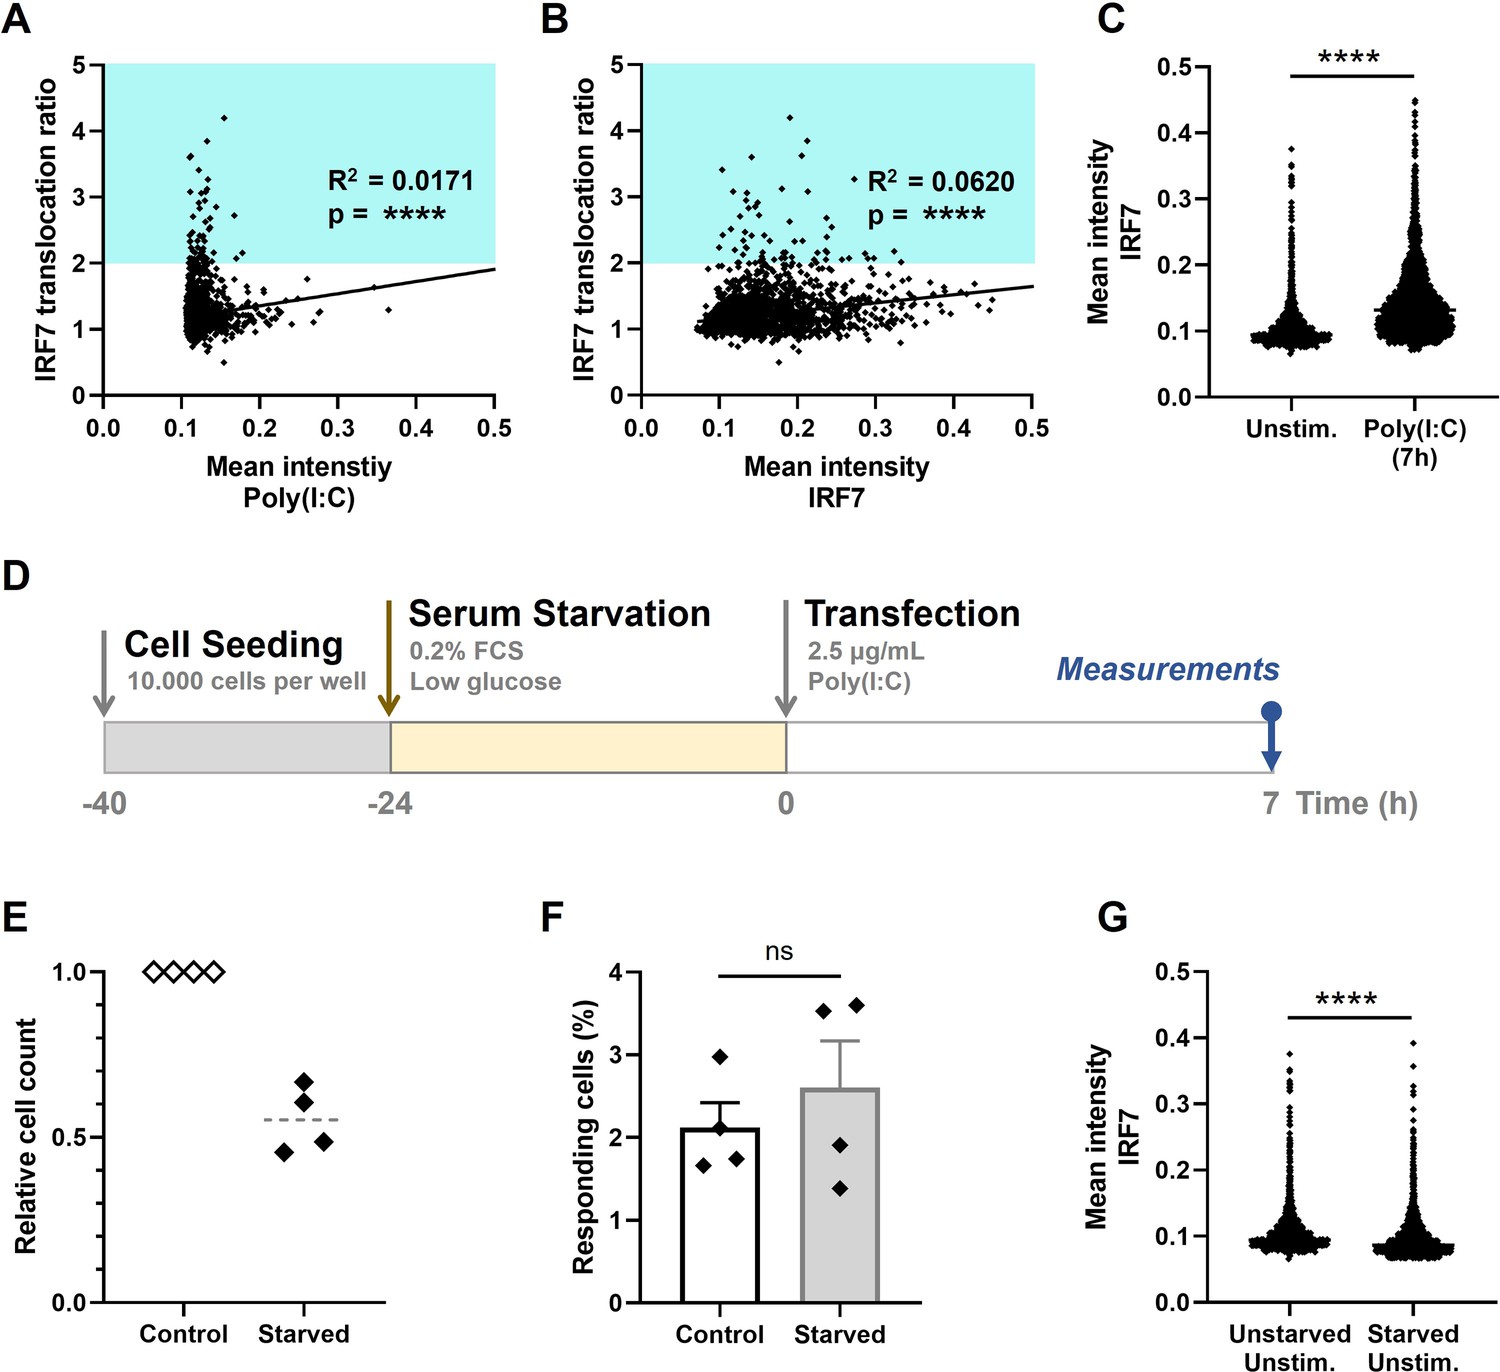
Extrinsic and intrinsic stochasticity dictating early type I interferon (IFN-I) responses.
(A) NIH3T3: IRF7-CFP cells were seeded and transfected as described before. At 7-hr post transfection, images were analyzed using an automated image analysis script to measure rhodamine-labeled Poly(I:C) intensities, and the IRF7 translocation ratios. Plotted are the mean intensities of Poly(I:C) against the IRF7 translocation ratios (R2 = 0.0171). Cyan box indicates IRF7 translocation ratio range accounting for responders. (B) As in panel (A), the mean intensities of total IRF7 were measured. Plotted are the background levels of IRF7 against the IRF7 translocation ratios (R2 = 0.0620). (C) Scatter plot depicting the IRF7 levels of unstimulated cells versus Poly(I:C)-stimulated cells after 7 hr (p < 0.0001). (D) Experimental design of serum starvation experiments in NIH3T3: IRF7-CFP cells. Cells were seeded 40 hr prior to the start of the experiment. 24 hr prior to transfection, cells were serum and glucose deprived. Next, cells were transfected with 2.5 μg/ml Poly(I:C) and assessed for nuclear translocation of IRF7 after 7 hr. (E) Validation of cell cycle arrest induced by serum starvation by relative cell counts of the control (unstarved) conditions, compared to the corresponding starved conditions (n = 4). (F) Comparison of the percentages of responding cells of the control conditions, compared to the starved conditions (nonsignificant = ns); data are represented as mean ± standard error of the mean (SEM). ****p ≤ 0.0001 (Mann–Whitney test). (G) Scatter plot of a representative biological replicate comparing the IRF7 levels of unstimulated cells, as in (C), versus starved, unstimulated conditions (p < 0.0001; Mann–Whitney test, two-tailed).
Figure 4 with 2 supplements
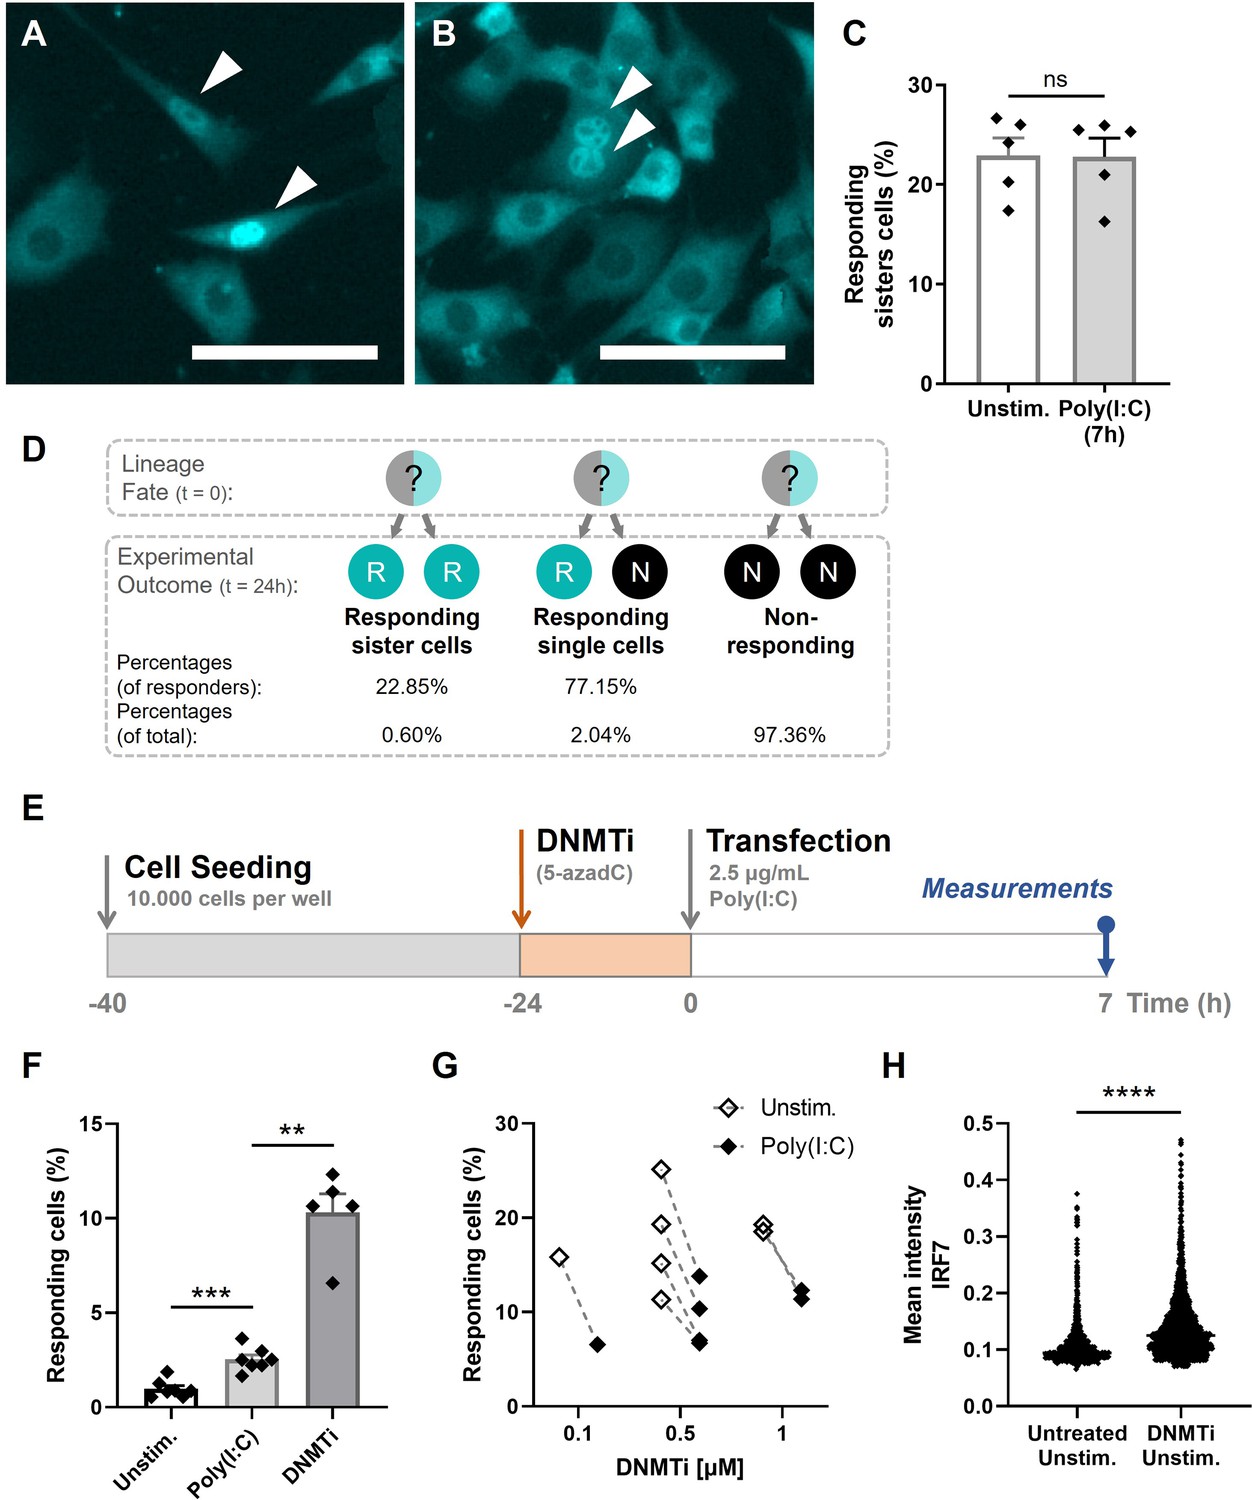
Epigenetic regulation dictating early type I interferon (IFN-I) responses.
(A) NIH3T3: IRF7-CFP cells were seeded on coverslips and transfected with 2.5 μg/ml Poly(I:C) for 7 hr. Microscopy image of two responding, neighboring cells, referred to as responding sister cells, displaying different background levels of IRF7. Scale bar equals 100 μm. (B) Microscopy image of two responding sister cells, displaying similar background levels of IRF7. Scale bar equals 100 μm. (C) Data on percentages of responding sister cells for unstimulated conditions (background translocation) versus stimulated conditions, transfected with Poly(I:C) after 7 hr; data are represented as mean ± standard error of the mean (SEM). **p ≤ 0.01, ***p ≤ 0.001, ****p ≤ 0.0001 (Mann–Whitney test). (D) Schematic of theoretical lineage fates and subsequent experimental outcomes (depicted as percentages of responders and of total population) upon cellular division. (E) Experimental design of epigenetics experiments in NIH3T3: IRF7-CFP cells. Cells were seeded 40 hr prior to the start of the experiment. 24-hr post transfection, cells were treated with DNMTi to induce hypomethylation. Next, cells were transfected with 2.5 μg/ml Poly(I:C) and assessed for nuclear translocation of IRF7 after 7 hr. (F) Percentages of responding cells for unstimulated, stimulated (Poly(I:C)), and DNMTi (1 μM) treated + stimulated conditions; data are represented as mean ± SEM. **p ≤ 0.01, ***p ≤ 0.001, ****p ≤ 0.0001 (Mann–Whitney test). (G) Data on paired percentages of responding cells (unstimulated versus stimulated) for different concentrations of DNMTi. (H) Scatter plot of a representative biological replicate comparing the IRF7 mean intensity of individual cells of untreated, unstimulated conditions, versus DNMTi treated, unstimulated conditions. **p ≤ 0.01, ***p ≤ 0.001, ****p ≤ 0.0001.
Figure 4—figure supplement 1
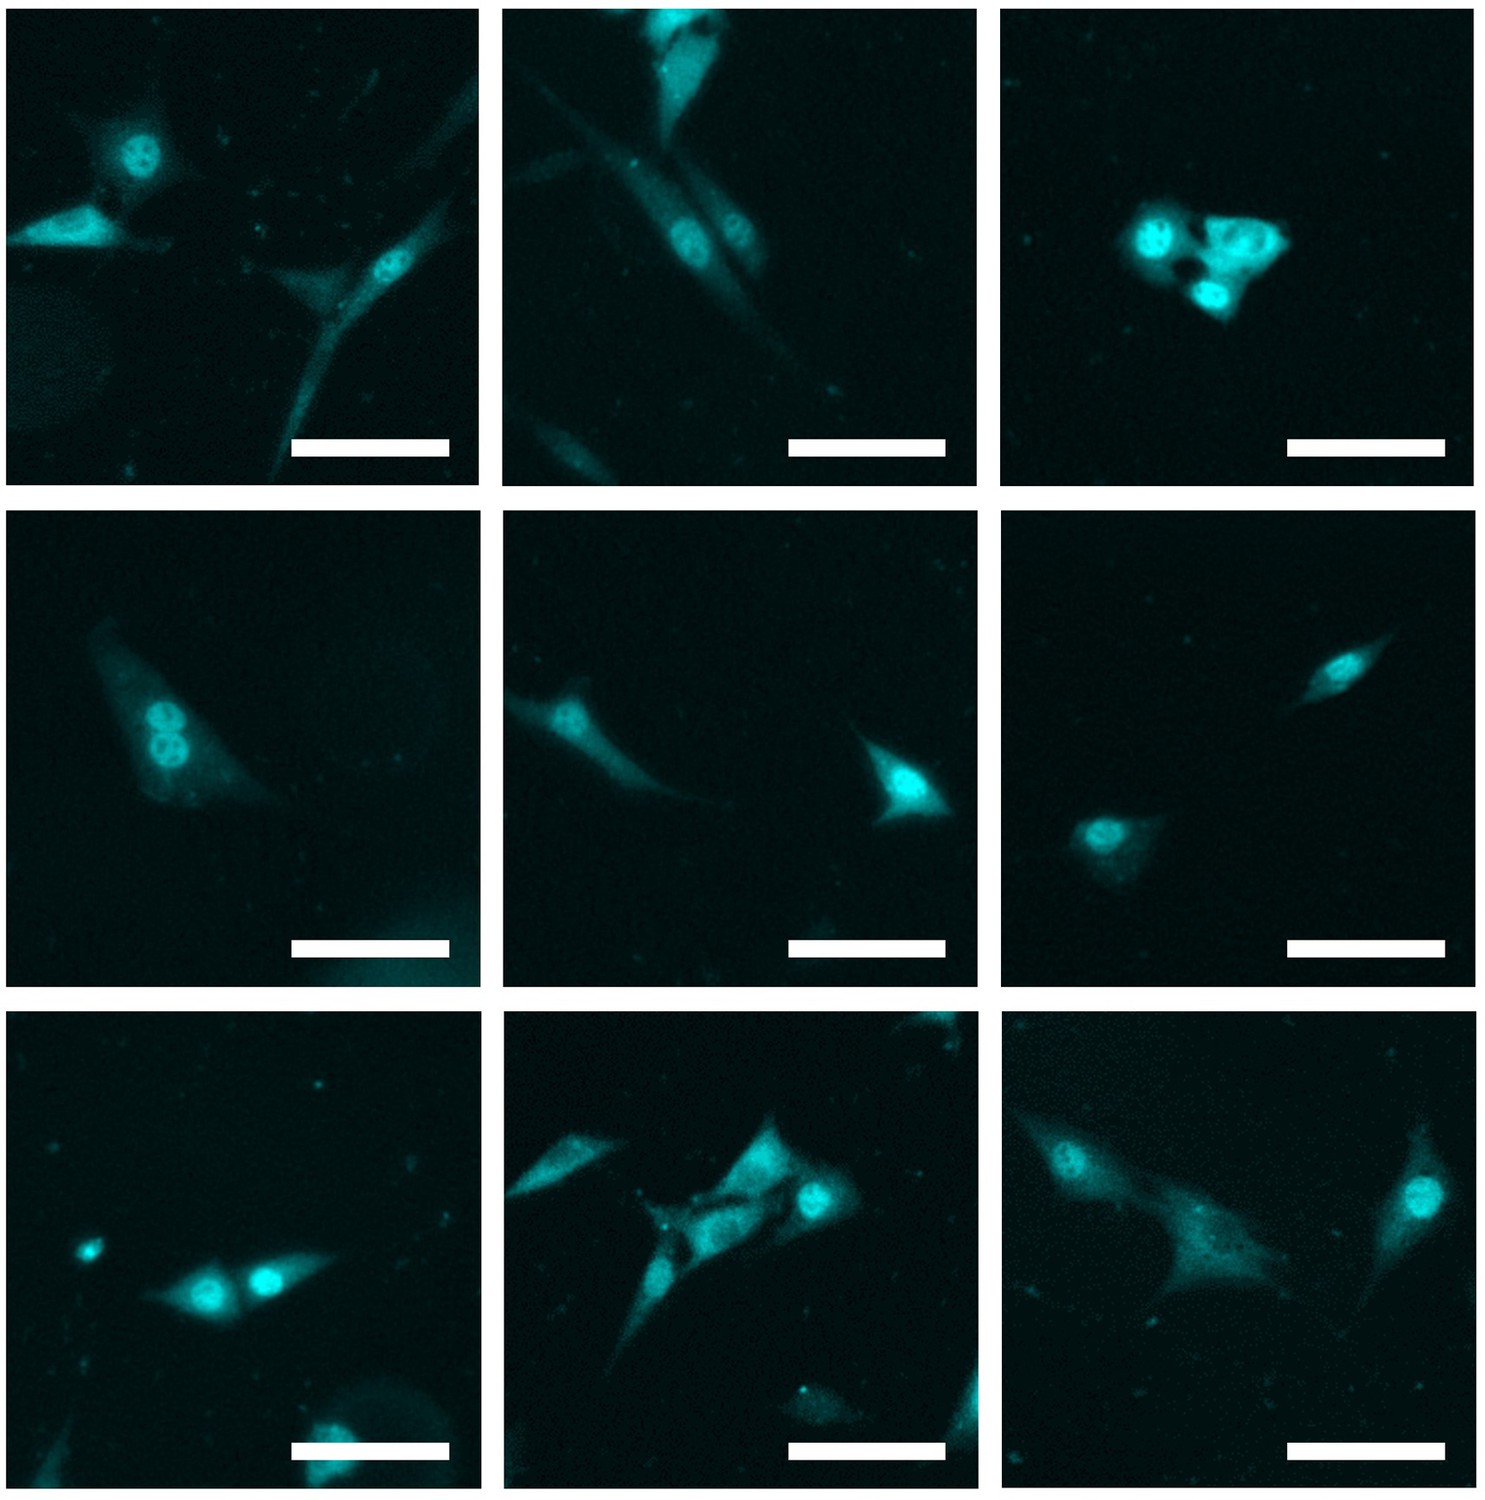
Microscopy images of numerous neighboring cells showing translocation.
Several examples of neighboring cells showing translocation, transfected with 2.5 μg/ml Poly(I:C) for 7 hr, imaged and analyzed for IRF7 translocation. +20% brightness and +20% contrast were applied for visualization purposes. Scale bar, 100 μm.
Figure 4—figure supplement 2
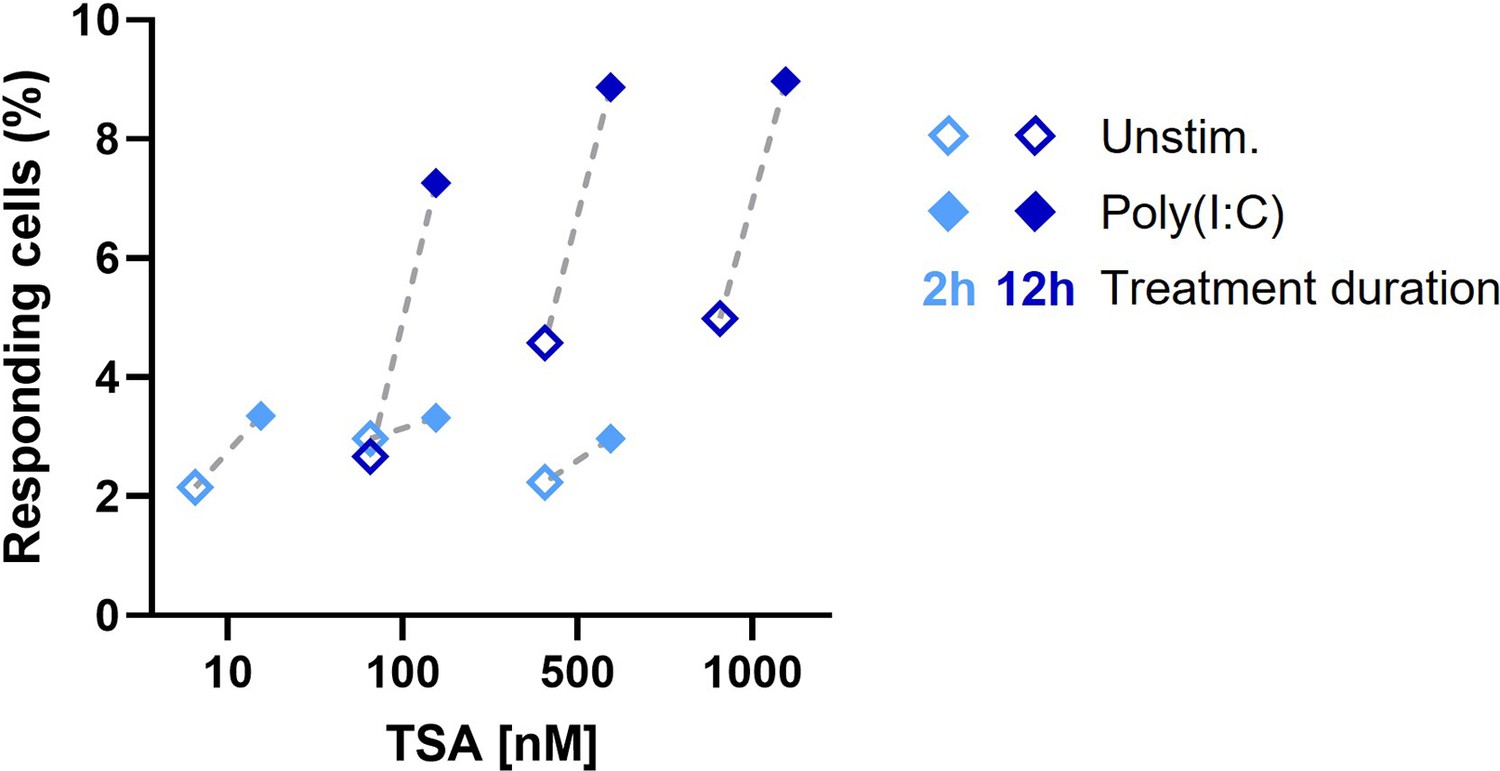
Percentages of responding cells upon treatment with varying concentration of HDACi TSA, for varying durations.
Figure 5 with 4 supplements
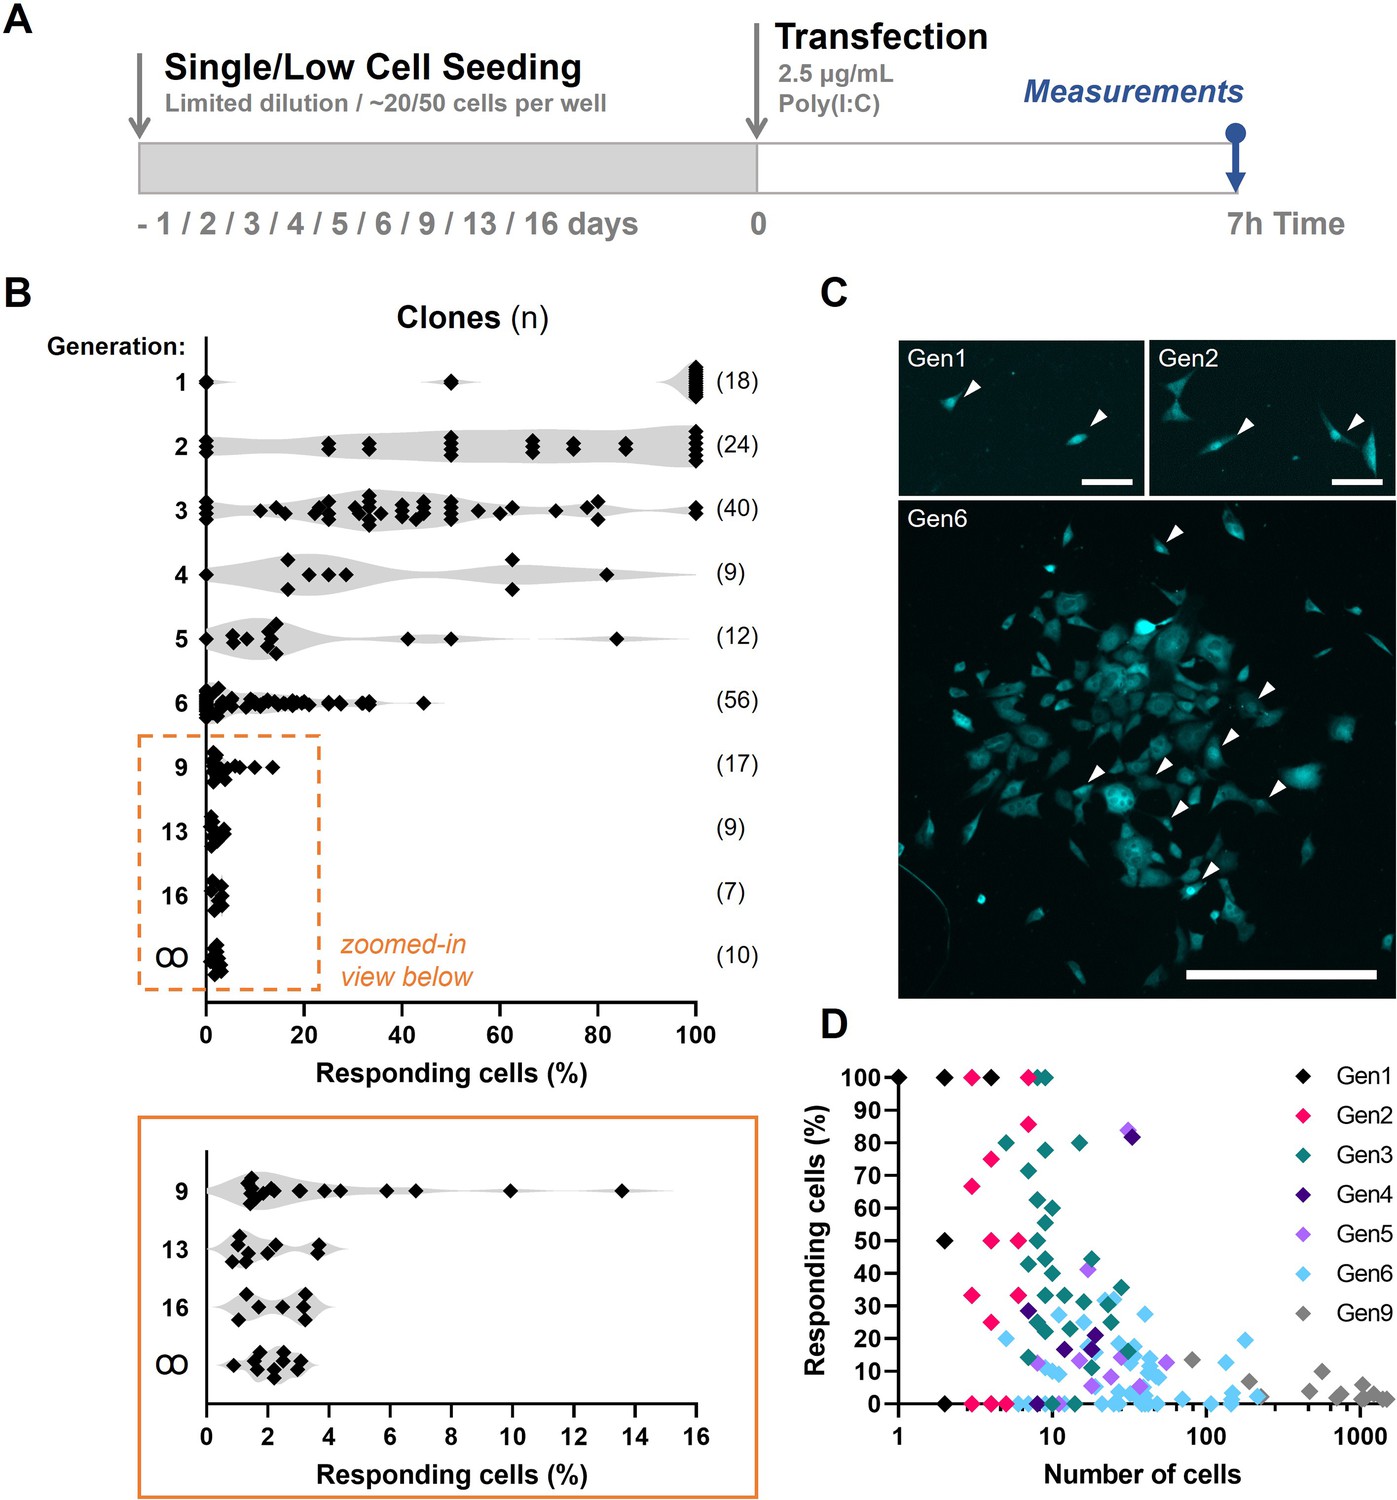
Fluctuation analysis on first responders.
(A) Experimental design of fluctuation experiments in NIH3T3: IRF7-CFP cells. Cells were either seeded following limited dilution or at only ~50 cells per 24-well, depending on the generation number. Next, cells were transfected with 2.5 μg/ml Poly(I:C) and assessed for nuclear translocation of IRF7 after 7 hr. (B) Fluctuation plots on percentages of responding cell of clones of different generations. Generation ∞ equal regular cultures. (C) Microscopy images of clone of generations 1 (gen1), 2 (gen2), and 6 (gen6) displaying varying percentages of translocated cells, some of which are indicated with white arrows. (D) Scatter plot on data obtained from clones of generation 1 through 9.
Figure 5—figure supplement 1
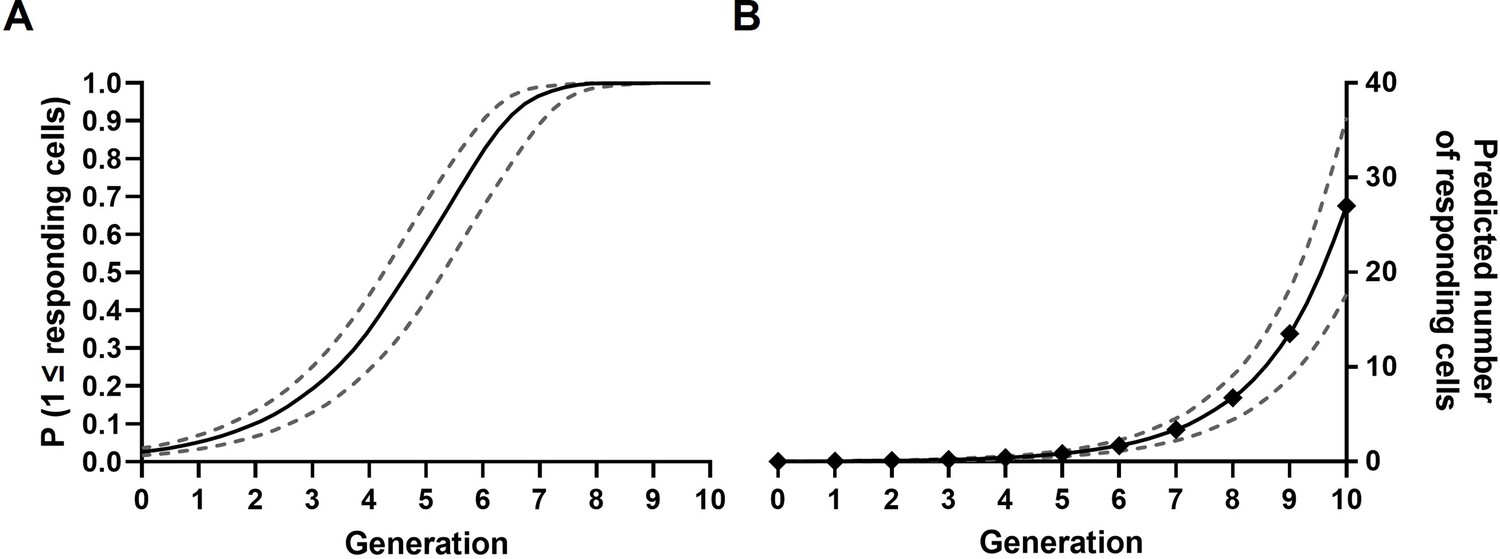
Probability calculations.
(A) Probability curves for the presence of at least one first responder per clone over the first 10 generations, assuming stochasticity. Solid line represents the probability based on the mean percentage of first responders in regular cultures; dashed lines represent the mean plus and minus the standard deviation (SD). (B) Curves on predicted numbers of first responders present over the first 10 generations, based on the mean percentages obtained from regular cultures (solid line), and the mean ± SD (dashed line).
Figure 5—figure supplement 2
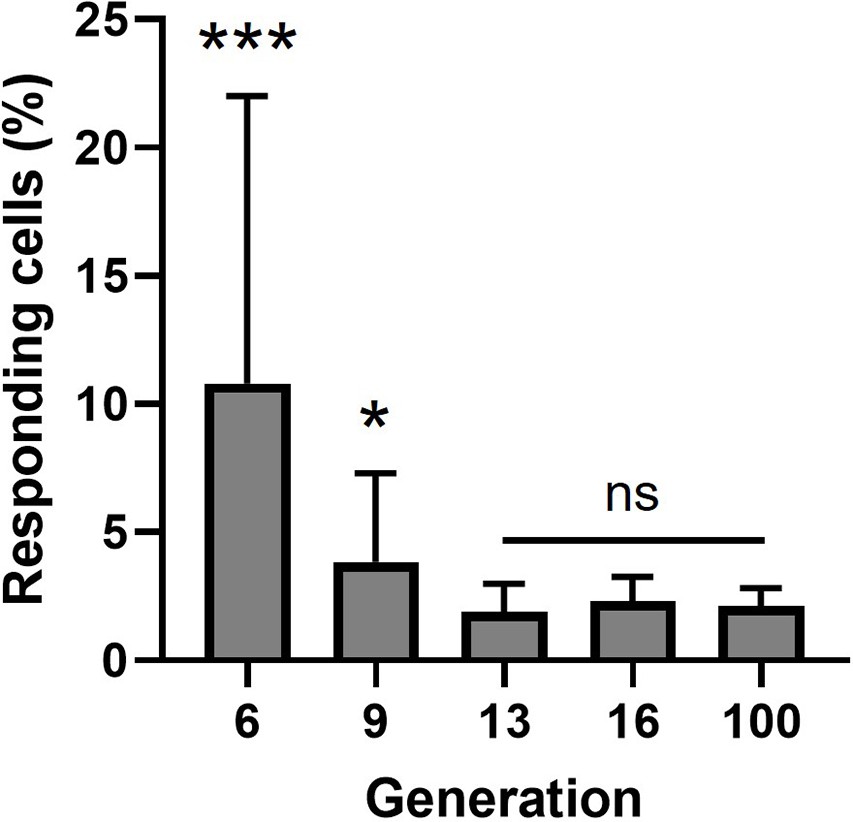
Statistical analysis on fluctuation data.
Percentages of responding cells of clones of different generations. Data are represented as mean ± standard deviation (SD); Welch’s t-test, two-tailed; ***p < 0.001; *p = 0.0446.
Figure 5—figure supplement 3
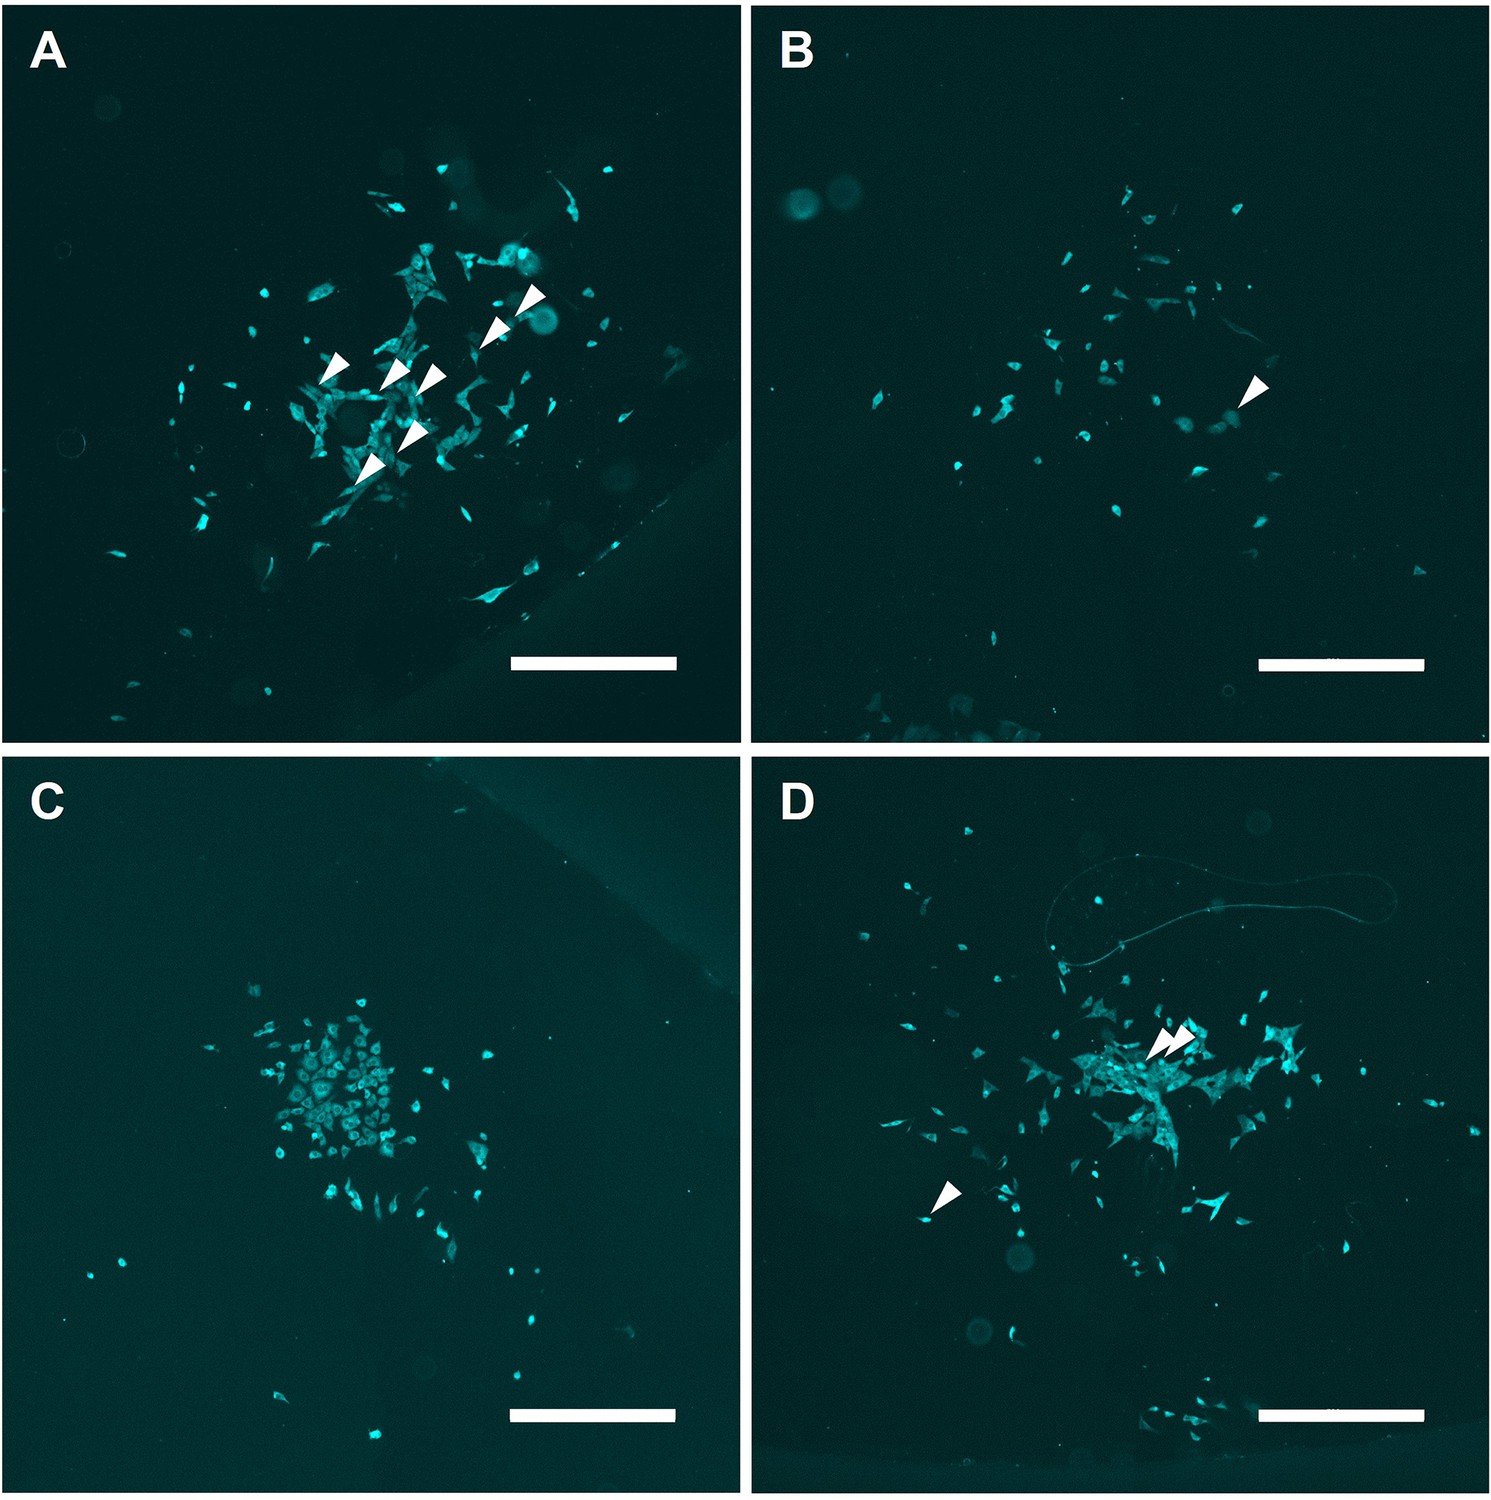
Microscopy images of clones of generation 6.
(A–D) Several examples of clones of generation 6, transfected with 2.5 μg/ml Poly(I:C) for 7 hr, imaged and analyzed for IRF7 translocation, displaying numerous translocated cells, some of which are indicated with white arrows. +20% brightness and +20% contrast were applied for visualization purposes. Scale bar equals 500 μm.
Figure 5—figure supplement 4
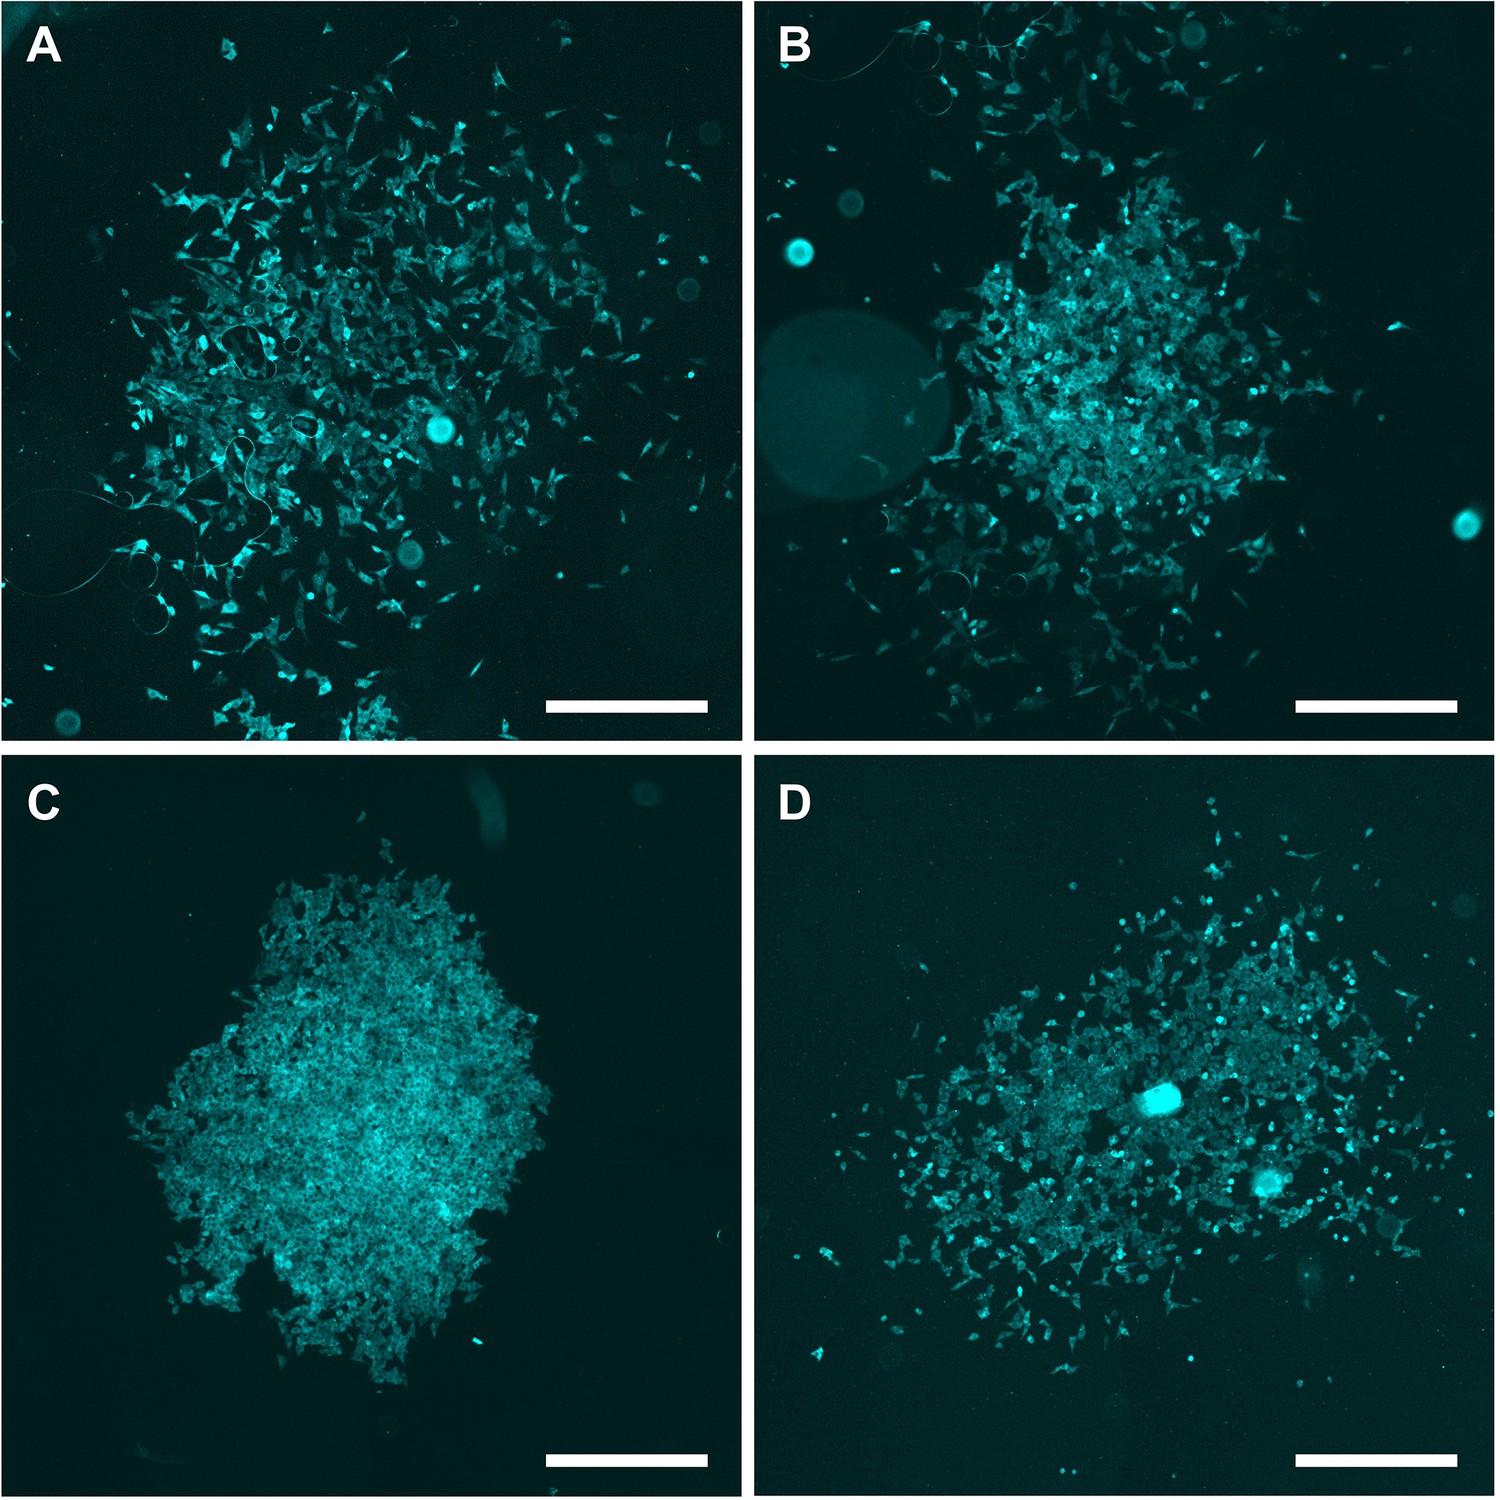
Microscopy images of clones of generation 9.
(A–D) Several examples of clones of generation 9, transfected with 2.5 μg/ml Poly(I:C) for 7 hr, imaged and analyzed for IRF7 translocation. +20% brightness and +20% contrast were applied for visualization purposes. Scale bar equals 500 μm.
Figure 6
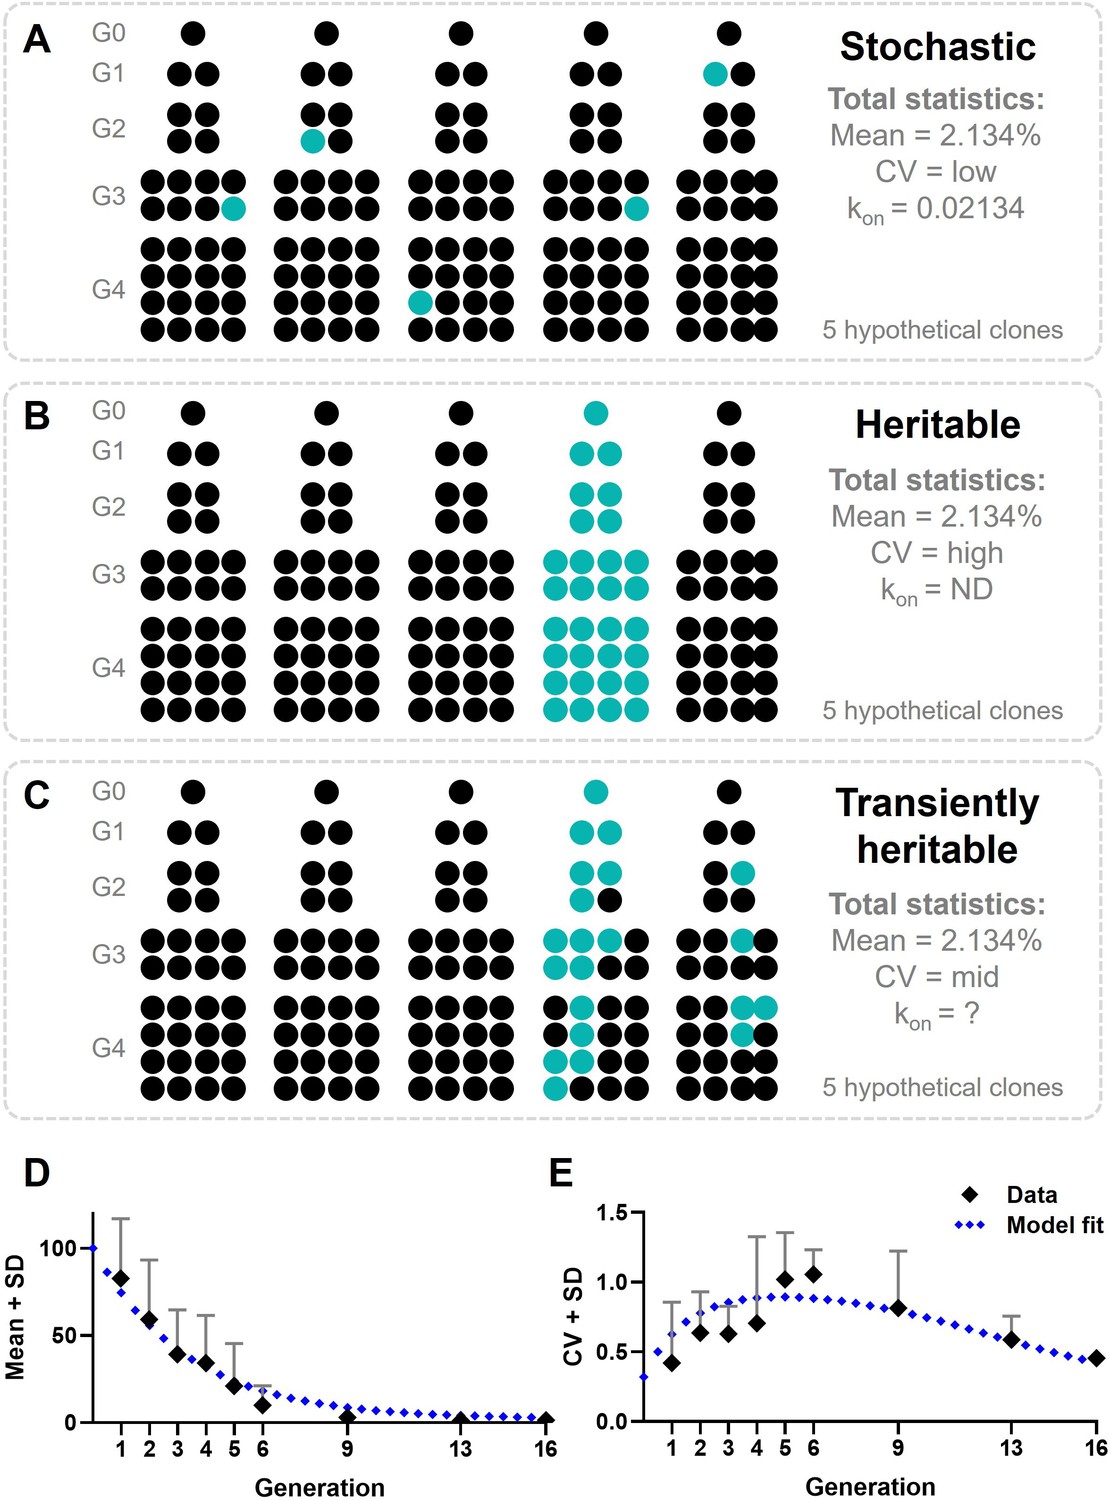
Modeling cellular decision-making during early type I interferon (IFN-I) responses.
(A) Hypothetical outcomes of responding cells upon cloning, assuming cellular decision-making during early IFN-I responses is a stochastic process. Responders will appear randomly across clones, resulting in a total mean of 2.134%, a low coefficient of variation (CV), and a low kon. (B) Hypothetical outcomes of responding cells upon cloning, assuming cellular decision-making during early IFN-I responses is a heritable process. Responders will appear only from the lineage that started with a responding cell, resulting in all offspring becoming responders. The total mean will still be 2.134%, though the CV will be high and the kon will be zero, as no cell switch fate. (C) Hypothetical outcomes of responding cells upon cloning, assuming cellular decision-making during early IFN-I responses is a transiently heritable process. Responders are more likely to appear in lineages originating from a responding cells, but can also appear in lineages that started with a nonresponding cell. Besides, responding cells can also disappear from responding lineages. This results in a total mean of responding cells that higher than 2.134%, with a high CV, and a variable kon. (D) Mean plus standard deviation (SD) of experimental outcomes of fluctuation assay with ordinary differential equation (ODE) model fitted; data are presented as mean ± SD. (E) CVs of fluctuation assay with ODE model fitted.
Figure 7 with 1 supplement
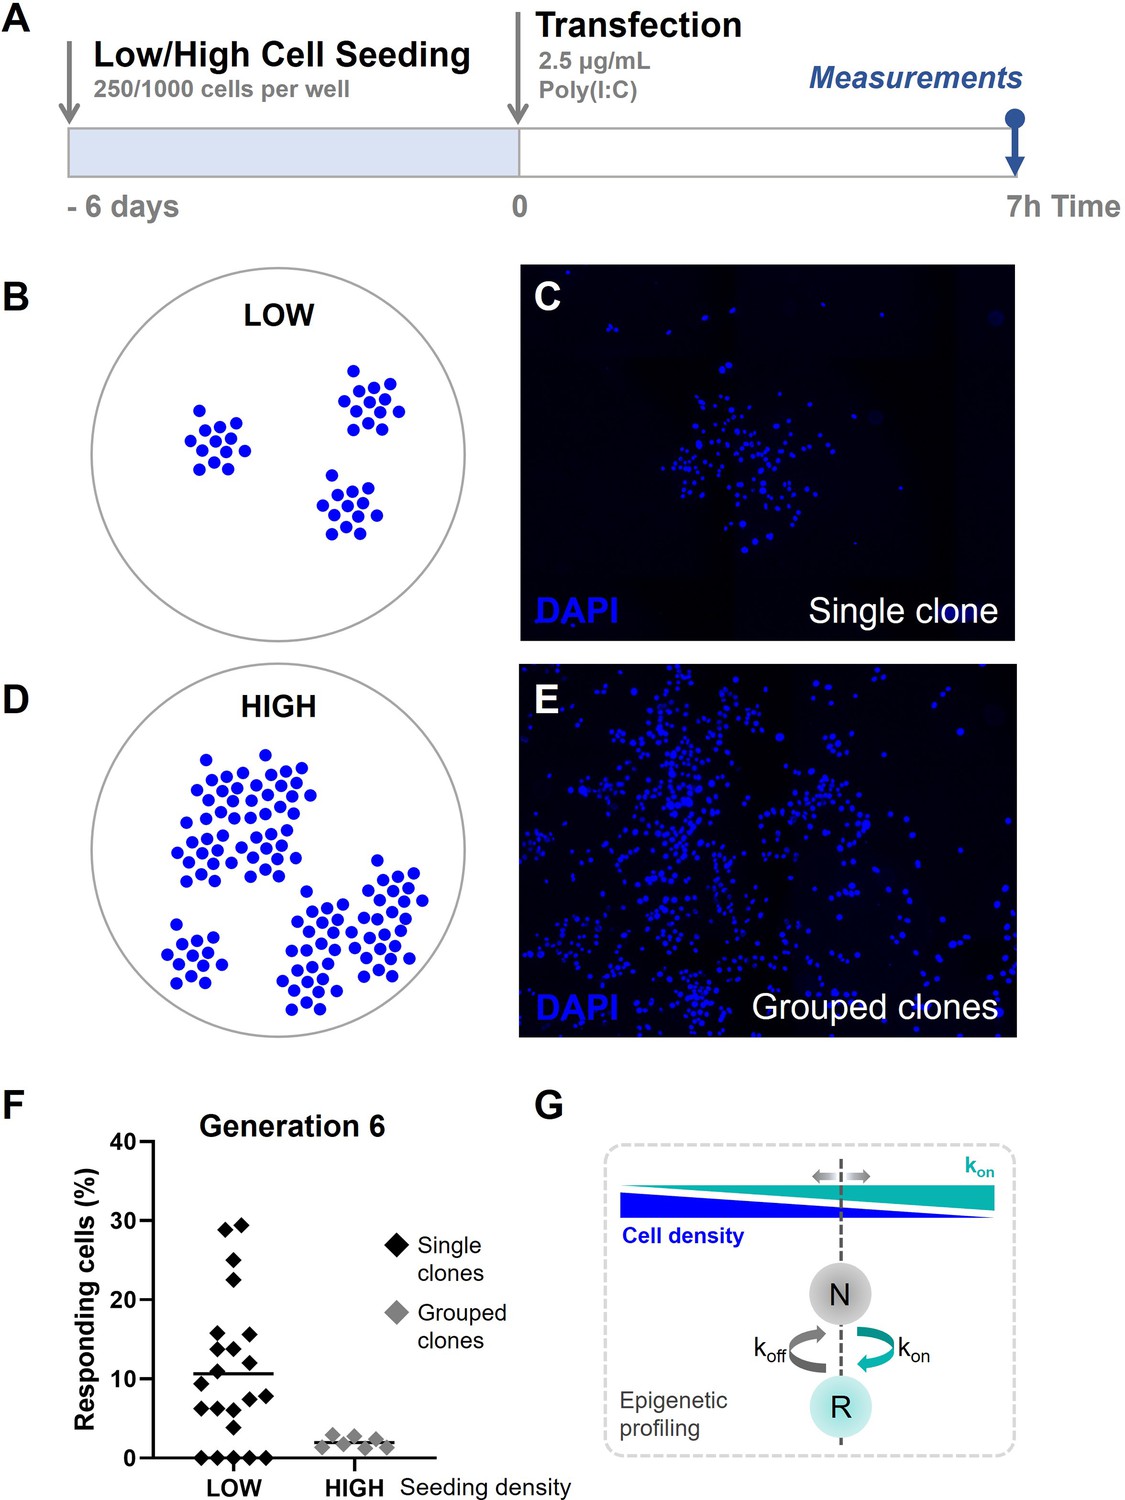
Quorum sensing drives cellular decision-making during early type I interferon (IFN-I) responses.
(A) Experimental design of quorum sensing experiments with NIH3T3: IRF7-CFP cells. Cells were either seeded at low numbers or high numbers (250 versus 1000 cells per 24-well) 6 days prior to the start of the experiment. Next, cells were transfected with 2.5 μg/ml Poly(I:C) and assessed for nuclear translocation of IRF7 after 7 hr. (B) Schematic representation of single clones of generation 6 on coverslips, seeded at low cell densities. (C) Microscopy image of DAPI (4′,6-diamidino-2-phenylindole) channel, visualizing the nuclei of cells, displaying clear clustering of single clones of generation 6. (D) Schematic representation of grouped clones of generation 6 on coverslips, seeded at high cell densities. (E) Microscopy image of DAPI channel, visualizing the nuclei of cells, displaying grouped clusters of cells, consisting of numerous clones of generation 6. (F) Scatter plots on percentages of responding cell of clones of generation 6 seeded in low densities (n = 22 clones), and grouped clones seeded at high densities (n = 7). (G) Schematic on cell fate switching, influenced by cell density.
Figure 7—figure supplement 1
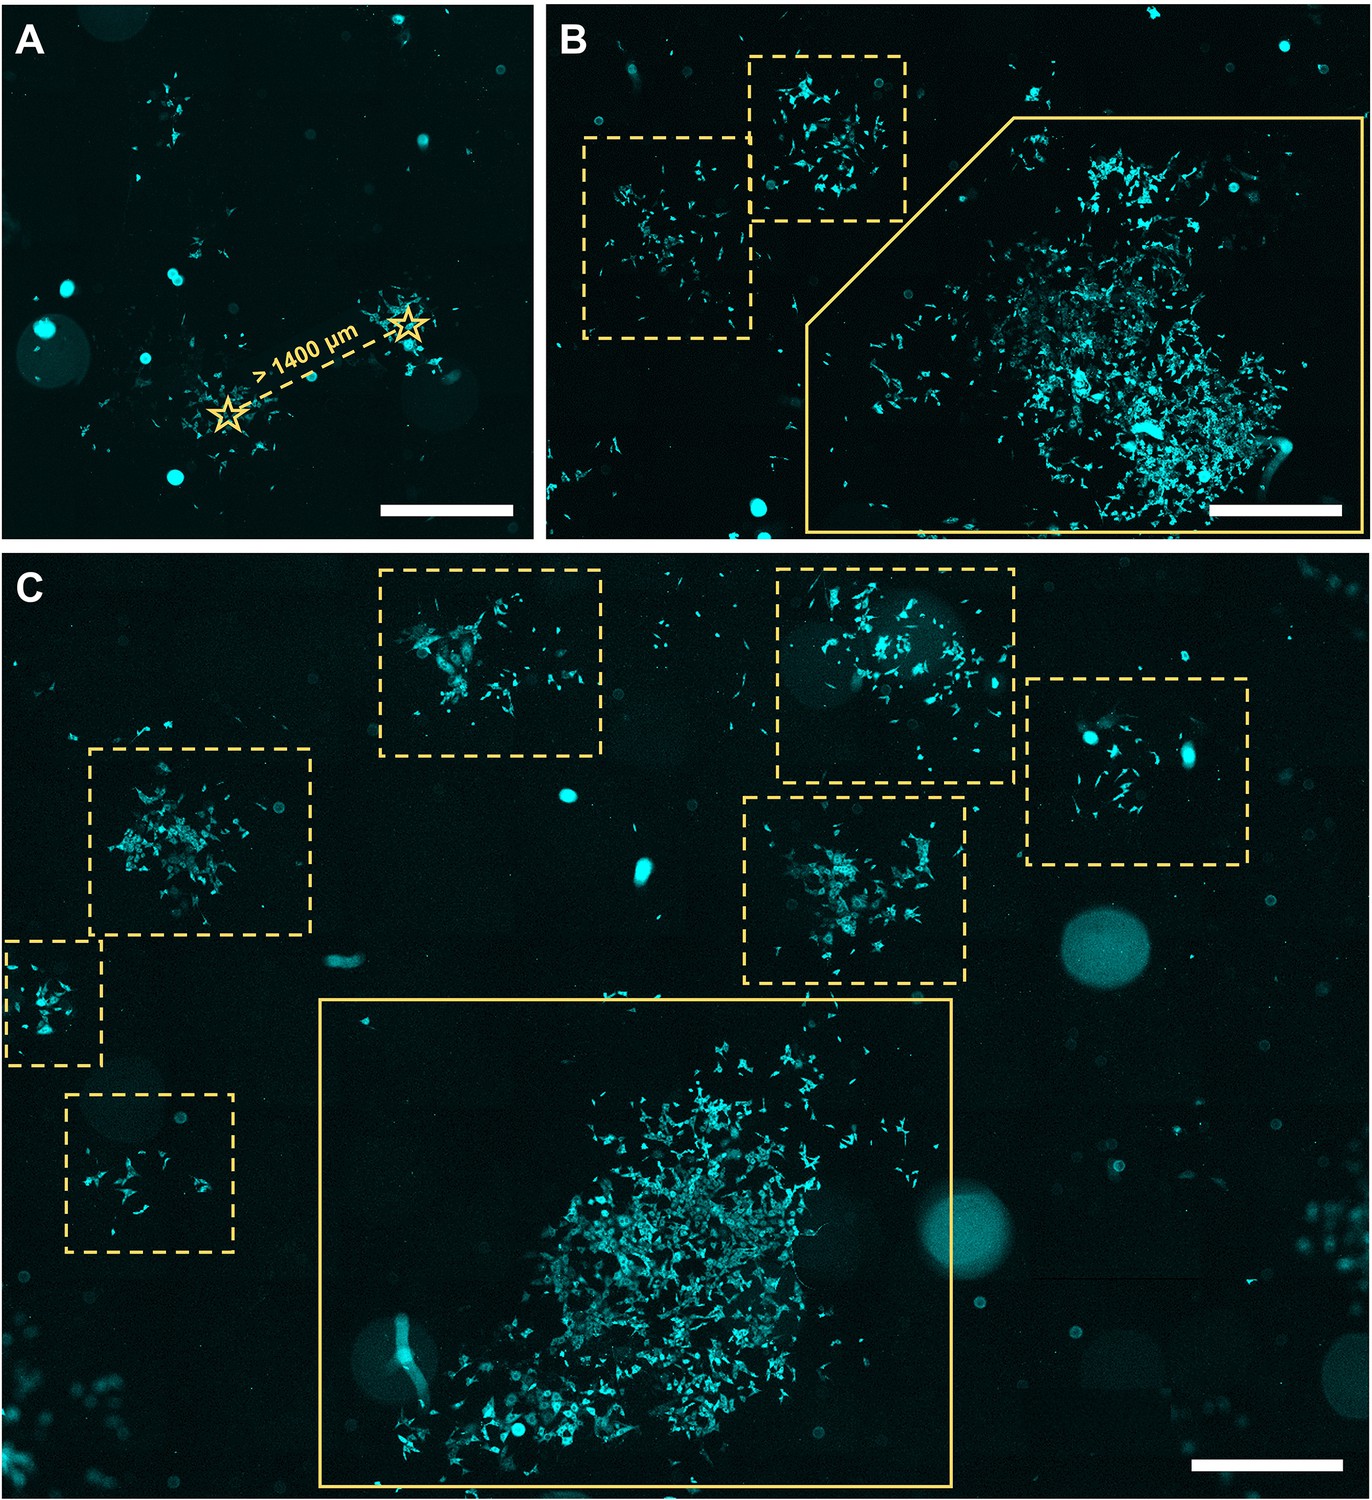
Microscopy images of cells of generation 6 seeded at varying seeding densities.
(A) Visualization of two clusters of cells that were considered two separate clones, with over 140 μm distance between the centers of the clusters, depicted by the star symbol. (B, C) Several examples of clones of generation 6, in dashed boxes, with in the same field a grouped clone, in solid box. +20% brightness and +20% contrast were applied for visualization purposes. Scale bar equals 1000 μm.
Tables
Key resources table
| Reagent type (species) or resource | Designation | Source or reference | Identifiers | Additional information |
|---|---|---|---|---|
| Cell line (Mus musculus) | NIH3T3: IRF7-CFP | Obtained from Ulfert Rand and Mario Köster, Helmholtz Centre for Infection Research, Germany | Rand et al., 2012 | |
| Cell line (Mus musculus) | NIH3T3: STAT1-CFP, STAT2-YFP | Obtained from Ulfert Rand and Mario Köster, Helmholtz Centre for Infection Research, Germany | Rand et al., 2012 | |
| Chemical compound, drug | Lipofectamine2000 | Invitrogen | cat #12566014 | |
| Chemical compound, drug | Poly(I:C) (LMW) Rhodamine | InvivoGen | cat #tlrl-piwr | |
| Chemical compound, drug | 5-Aza-2′-deoxycytidine | Sigma-Aldrich | cat #A3656 | |
| Chemical compound, drug | Trichostatin A | Sigma-Aldrich | cat #T8552 | |
| Software, algorithm | CellProfiler | https://www.cellprofiler.org | Stirling et al., 2021 |
Additional files
Download links
A two-part list of links to download the article, or parts of the article, in various formats.
Downloads (link to download the article as PDF)
Open citations (links to open the citations from this article in various online reference manager services)
Cite this article (links to download the citations from this article in formats compatible with various reference manager tools)
Transiently heritable fates and quorum sensing drive early IFN-I response dynamics
eLife 12:e83055.
https://doi.org/10.7554/eLife.83055


