Hierarchical sequence-affinity landscapes shape the evolution of breadth in an anti-influenza receptor binding site antibody
- Department of Organismic and Evolutionary Biology, Harvard University, United States
- Department of Microbiology and Immunology, University of California, San Francisco, United States
- Ragon Institute of MGH, MIT, and Harvard, United States
- Department of Microbiology, Harvard Medical School, United States
- Department of Physics, Harvard University, United States
- NSF-Simons Center for Mathematical and Statistical Analysis of Biology, Harvard University, United States
- Quantitative Biology Initiative, Harvard University, United States
Figures
Figure 1 with 4 supplements
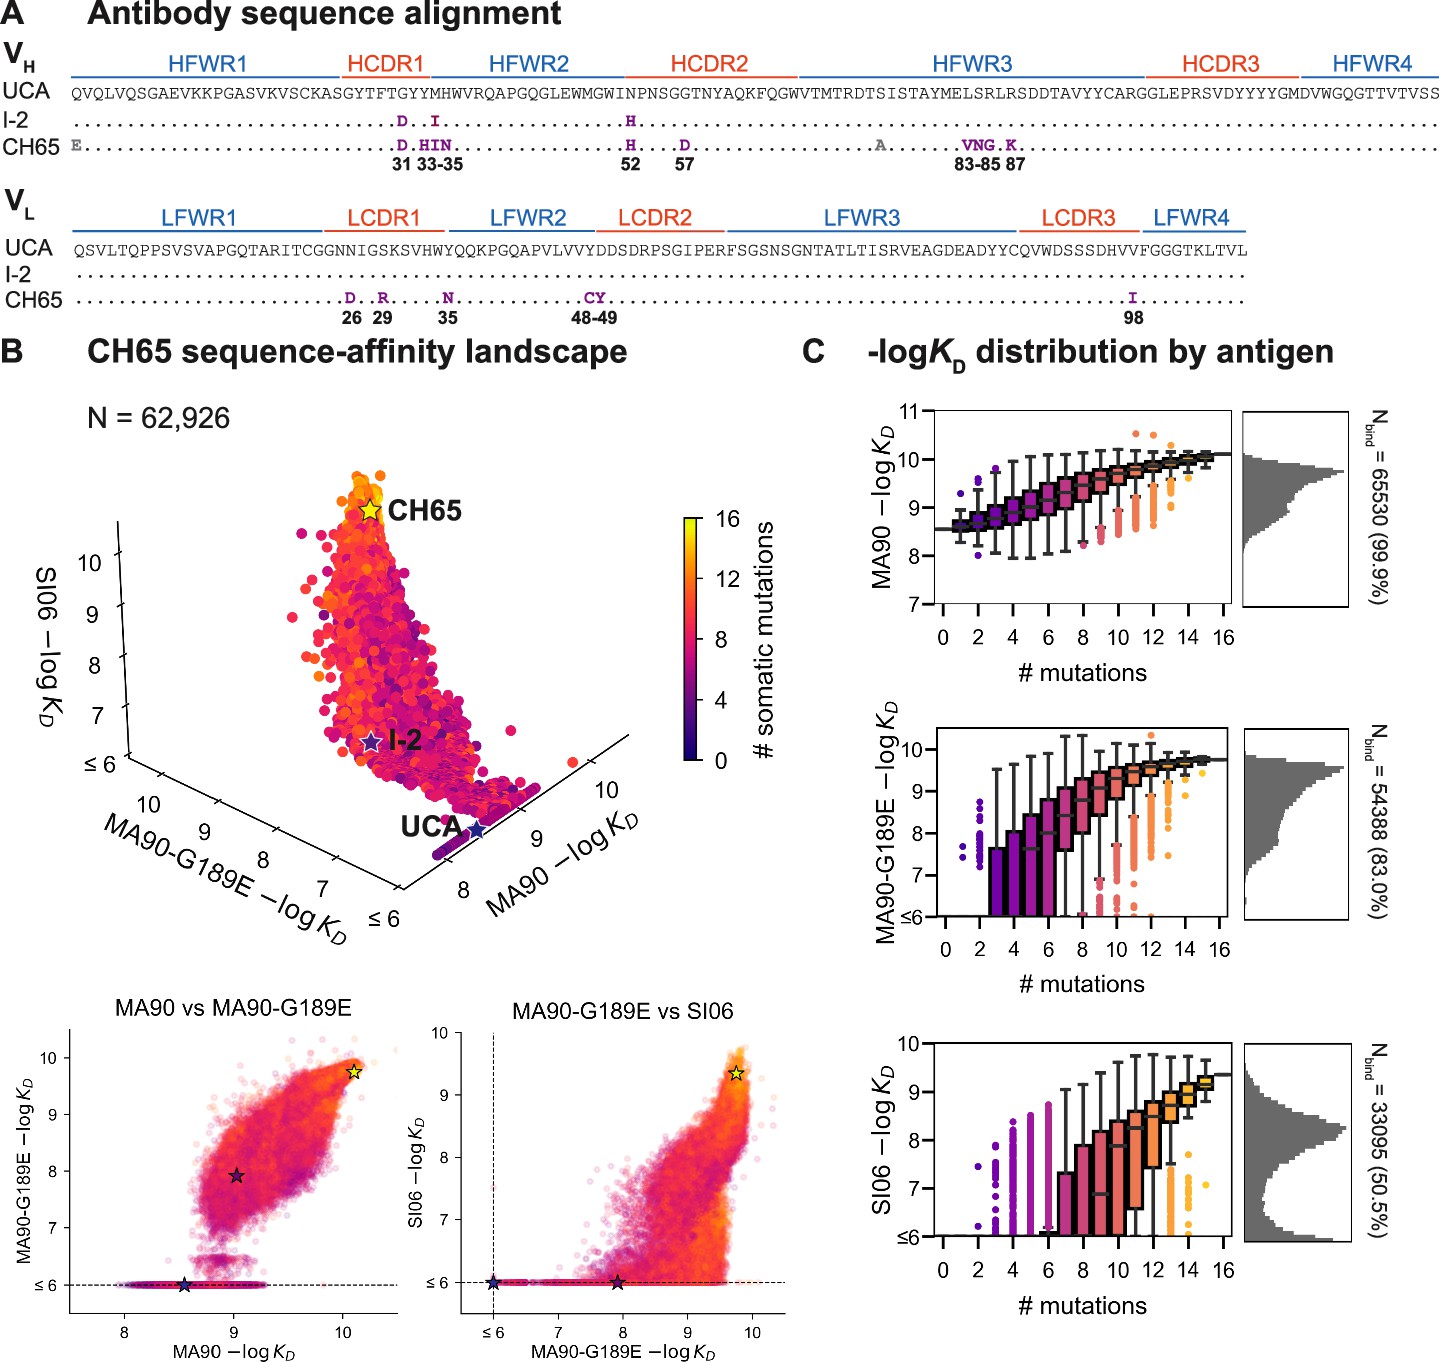
CH65 sequence-affinity landscape.
(A) Alignment of unmutated common ancestor (UCA), I-2, and CH65 VH (top) and VL (bottom) sequences. Mutations of interest are shown in purple and are numbered; gray mutations do not impact affinity and were excluded from the library. (B) -logKD for ~216 variants to each of the three antigens. Each point represents the mean -logKD of biological duplicates and is colored by the number of somatic mutations in the corresponding variant. The UCA, I-2, and CH65 are annotated as stars; N = 62,926 after filtering poor KD measurements from the Tite-Seq data (see 'Materials and methods'). Two-dimensional representations of the data are shown below the three-dimensional plot. (C) Distribution of -logKD for each antigen. Left: variant -logKD grouped by the number of somatic mutations; Right: -logKD histograms for variants that bind each antigen, with total number of binding variants (N) indicated on plot.
-
Figure 1—source data 1
CH65 library expression and -logKD to MA90, MA90-G189E, and SI06.
Biological duplicates, mean, and standard error are reported.
- https://cdn.elifesciences.org/articles/83628/elife-83628-fig1-data1-v3.xlsx
-
Figure 1—source data 2
Isogenic flow cytometry measurements of -logKD and expression for select CH65 variants.
Mean and standard error for -logKD and expression are reported for biological duplicates, alongside the corresponding Tite-Seq -logKD and expression measurements (as in Figure 1—source data 1).
- https://cdn.elifesciences.org/articles/83628/elife-83628-fig1-data2-v3.xlsx
Figure 1—figure supplement 1

CH65 mutation reversion.
Isogenic measurements of -logKD for CH65 with (18-mut) and without (16-mut) Q1E and S75A to MA90 (p-value=0.82, t-stat = 0.26) and SI06 (p-value=1.0, t-stat = 0.0); ‘ns’ designates a p-value>0.05. Error bars indicate standard error between biological duplicates.
Figure 1—figure supplement 2
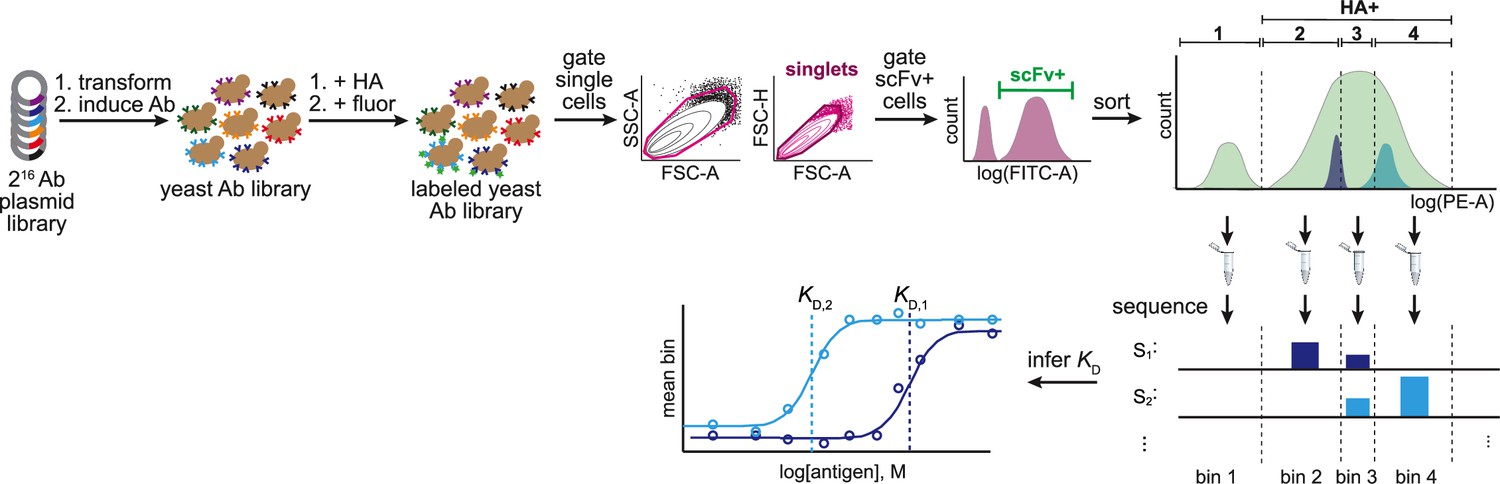
Tite-Seq workflow.
Combinatorially complete (N = 216 variants) antibody plasmid library is transformed into yeast and expression of antibodies is induced. Yeast antibody library is then labeled with HA (at varying concentrations) followed by fluorophores (FITC, which binds the Ab, and PE, which binds HA). Labeled yeast library is then gated to select single cells that express scFv. scFv-positive cells are then sorted according to HA binding (PE fluorescence) into four bins. Bin 1 corresponds to all HA-negative cells, HA-positive cells are split evenly between the remaining three bins. Each bin is then sequenced to determine variant frequency in each bin. KD is then inferred by fitting the mean bin each variant is observed in to the antigen concentration.
Figure 1—figure supplement 3
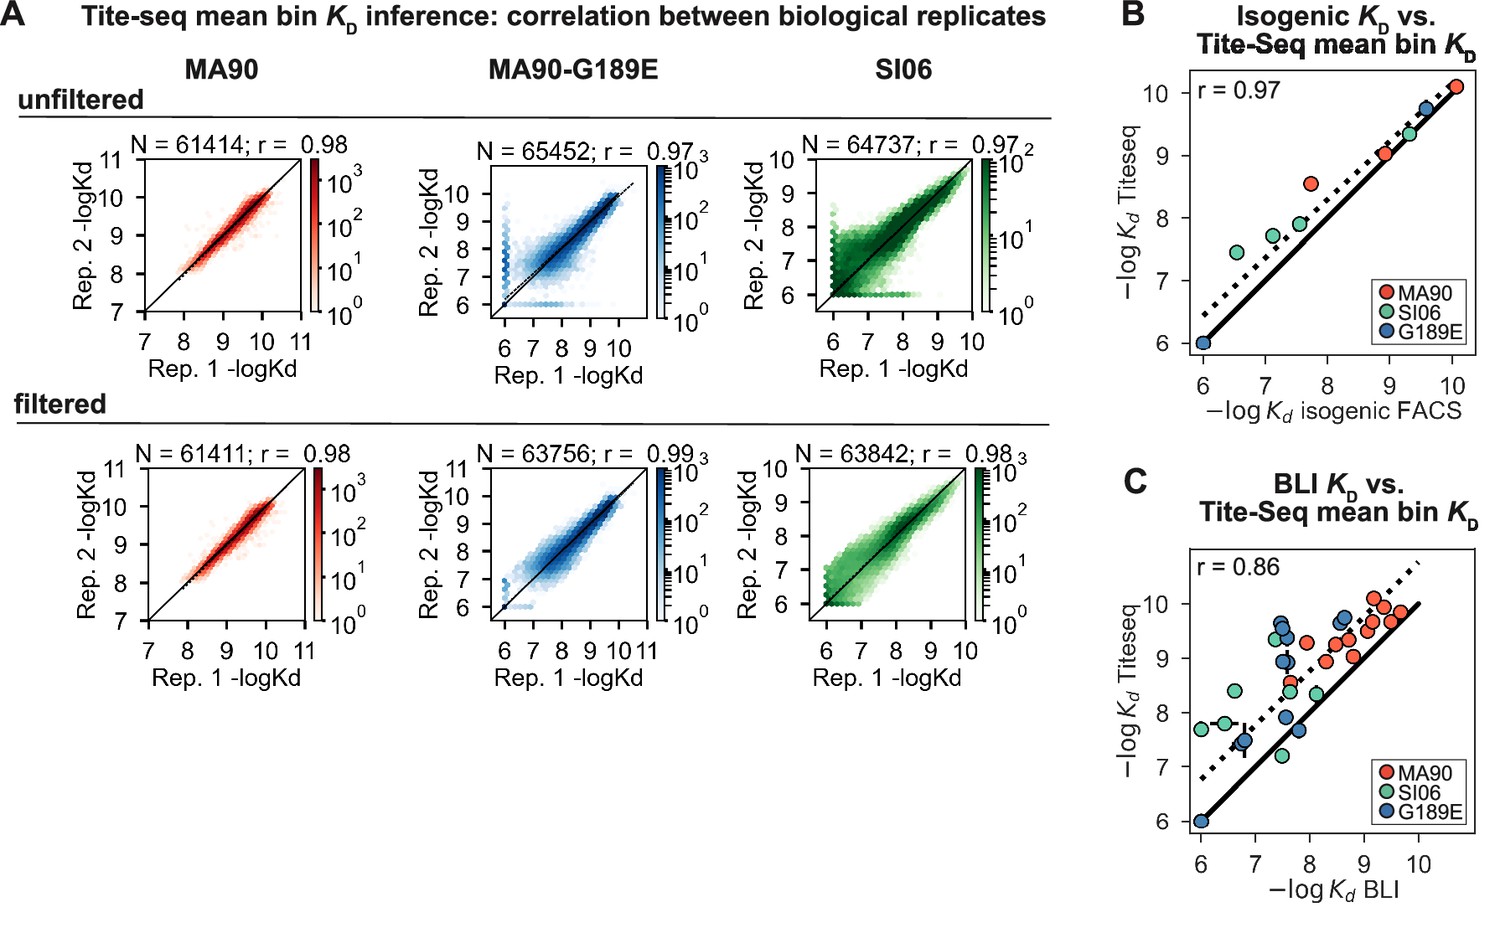
Tite-Seq KD quality control and isogenic measurements.
(A) Correlation between biological duplicate Tite-Seq KD measurements before (top) and after (bottom) removing genotypes with -logKD differing by more than one-log between biological replicates. The latter set of measurements were used for all downstream analyses. N indicates the number of variants plotted, r indicates the correlation between biological replicates. (B) Correlation between Tite-Seq -logKD measurements and isogenic fluorescence-based -logKD measurements for a subset of mutants to one of the three antigens, as indicated in key. Points and error bars indicate the mean and SEM between biological replicates, respectively; SEM are generally smaller than the points. (C) Correlation between Tite-Seq -logKD measurements and BLI -logKD measurements for a subset of mutants to one of the three antigens, as indicated in key. Error bars indicate the SEM between biological replicates (for Tite-Seq) and the SE of the fit (for BLI) and are generally smaller than the points.
Figure 1—figure supplement 4
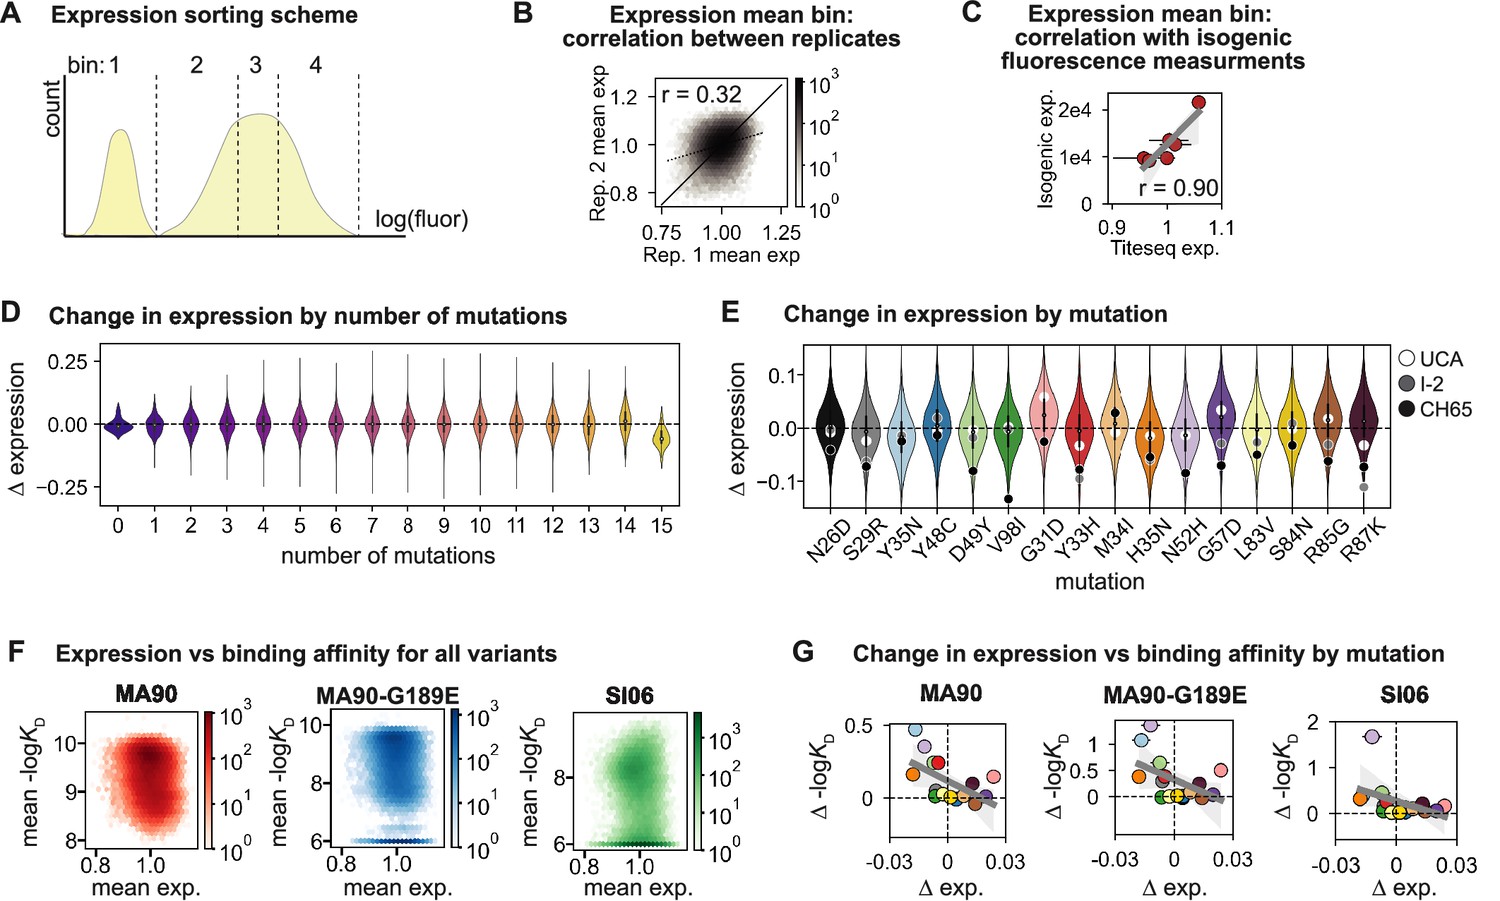
CH65 library expression.
(A) Sorting scheme for scFv expression. Library was sorted into four bins, each comprising 25% of the total population, along the log(fluorescence) axis corresponding to expression (FITC). (B) Correlation between Tite-Seq biological replicate measurements of expression for all variants in the CH65 library. (C) Correlation between mean Tite-Seq expression measurement and mean isogenic expression measurement for select variants. (D) Change in expression resulting from mutation as a function of the number of other mutations present. (E) Change in expression resulting from each mutation. Each violin contains 215 points corresponding to the effect of that mutation on the 215 other genetic backgrounds. White, gray, and black points show the impact of the mutation on expression on the unmutated common ancestor (UCA), I-2, and CH65 genetic backgrounds, respectively. (F) Relationship between expression and binding affinity for all variants in the CH65 library. (G) Relationship between mean change in expression and mean change in binding affinity resulting from each of the 16 mutations in CH65. Mutations are colored as in (E).
Figure 2 with 1 supplement

Mutational effects on affinity.
(A) Change in -logKD resulting from each mutation on all ~215 genetic backgrounds. Impact of mutation on the unmutated common ancestor (UCA), I-2, and the CH65 genetic backgrounds are represented by white, gray, and black points, respectively. (B) Correlation of mean effect on -logKD for MA90, SI06, and MA90-G189E resulting from each mutation. Regression line and 95% confidence intervals are shown in gray. Mutations are colored as in (A). (C) Frequency of each mutation amongst variants that bind a given antigen with KD ≤ 1 nM. Error bars correspond to standard deviation across bootstrapped data (N = 10). (D) Mutations present at >55% frequency (p-value<0.05 from one-sided t-test) amongst binders for each antigen. Figure 2—figure supplement 1. Change in -logKD resulting from each mutation as a function of the number of other mutations present.
Figure 2—figure supplement 1

Change in -logKD resulting from each mutation as a function of the number of other mutations present.
Line represents mean, and shading represents 95% confidence interval over all genetic backgrounds (N ~ 215).
Figure 3 with 6 supplements

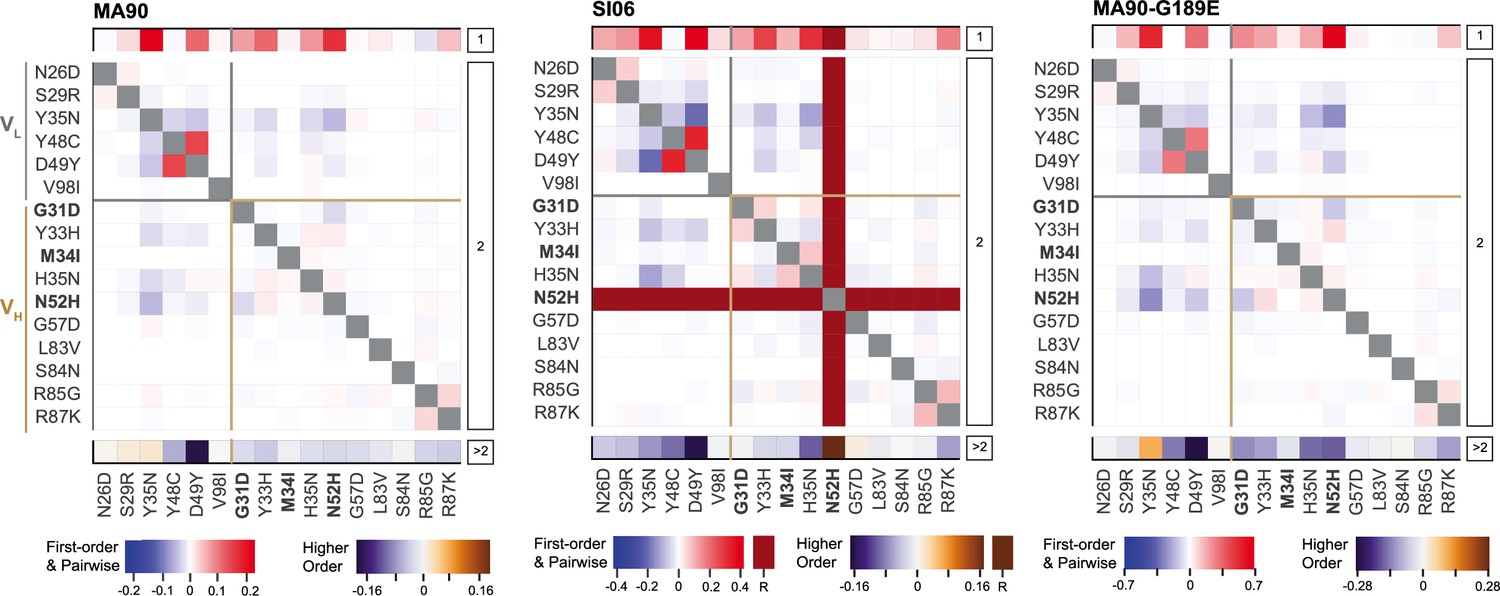
Epistatic coefficients for biochemical model of epistasis.
(A) Significant first-order, pairwise, and higher-order mutational effects for each of the 16 mutations inferred from the optimal order model for each antigen. Higher-order effects are reported as a sum. Mutations present in I-2 are shown in bold. ‘R’ indicates that the mutation is required for binding (defined as being present in ≥90% of binding variants) and is thus excluded from the epistasis inference. (B) Structural context of significant first-order and epistatic effects. For each mutation, the upper triangle shows the first-order effect, the lower triangle shows the sum of the pairwise and higher-order effects, and the contact surface area with HA and HCDR3 are shown in the fourth and fifth columns. Significance in (A) and (B) indicates the coefficient 95% CIs do not include zero, see 'Materials and methods' and Figure 3—source data 1. Figure 3—figure supplement 1. Pairwise effects versus distance.
-
Figure 3—source data 1
Interaction model coefficients for CH65.
Coefficients are reported for each antigen, with standard errors, p-values, and 95% confidence intervals.
- https://cdn.elifesciences.org/articles/83628/elife-83628-fig3-data1-v3.xlsx
Figure 3—figure supplement 1

Pairwise effects versus distance.
(A) Pairwise coefficients plotted as a function of the distance between alpha-carbons (in Angstroms) of the corresponding residues. Select outliers are annotated. (B) Left: mean pairwise coefficients between residues, binned according to the distance between alpha-carbons (in 4-Angstrom bins). Right: same data as left, but coefficients were permuted to generate null expectation. Error bars correspond to standard deviation.
Figure 3—figure supplement 2
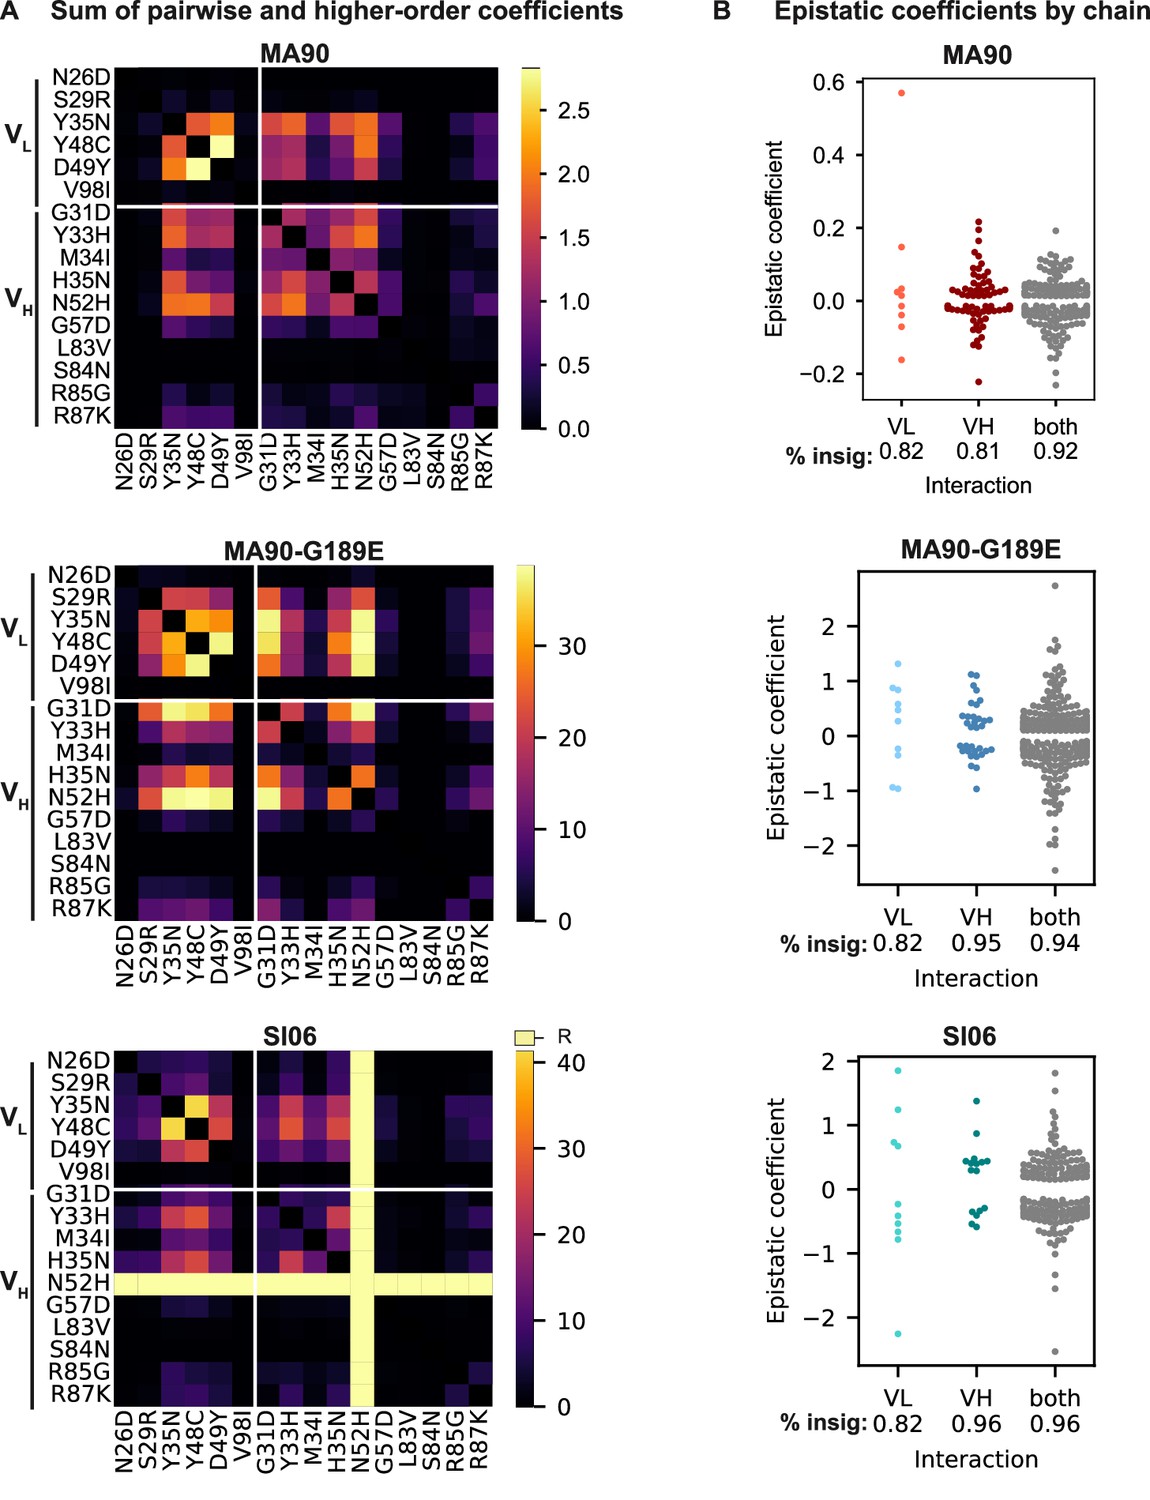
Biochemical epistasis within heavy and light chains and between chains.
(A) Sum of absolute value of statistically significant pairwise and higher-order coefficients for MA90, MA90-G189E, and SI06. Significant coefficients are defined as those with 95% CI that do not include zero. (B) Significant epistatic coefficients between mutations in the light chain (VL), heavy chain (VH), or between mutations spread across both chains (both). Percentage of insignificant coefficients is indicated below each swarm plot.
Figure 3—figure supplement 3
Epistatic coefficients for statistical model of epistasis.
Significant first-order, pairwise, and higher-order mutational effects for each of the 16 mutations inferred from the optimal order model for each antigen. Higher-order effects are reported as a sum. Mutations present in I-2 are shown in bold. ‘R’ indicates that the mutation is required for binding (defined as being present in ≥90% of binding variants) and is thus excluded from the epistasis inference. Significant coefficients are defined as those with 95% CI that do not include zero.
Figure 3—figure supplement 4

Comparison of coefficients in biochemical and statistical models.
Total number of statistically significant coefficients is plotted for each antigen and epistatic model. Significant coefficients are defined as those with 95% CI that do not include zero.
Figure 3—figure supplement 5
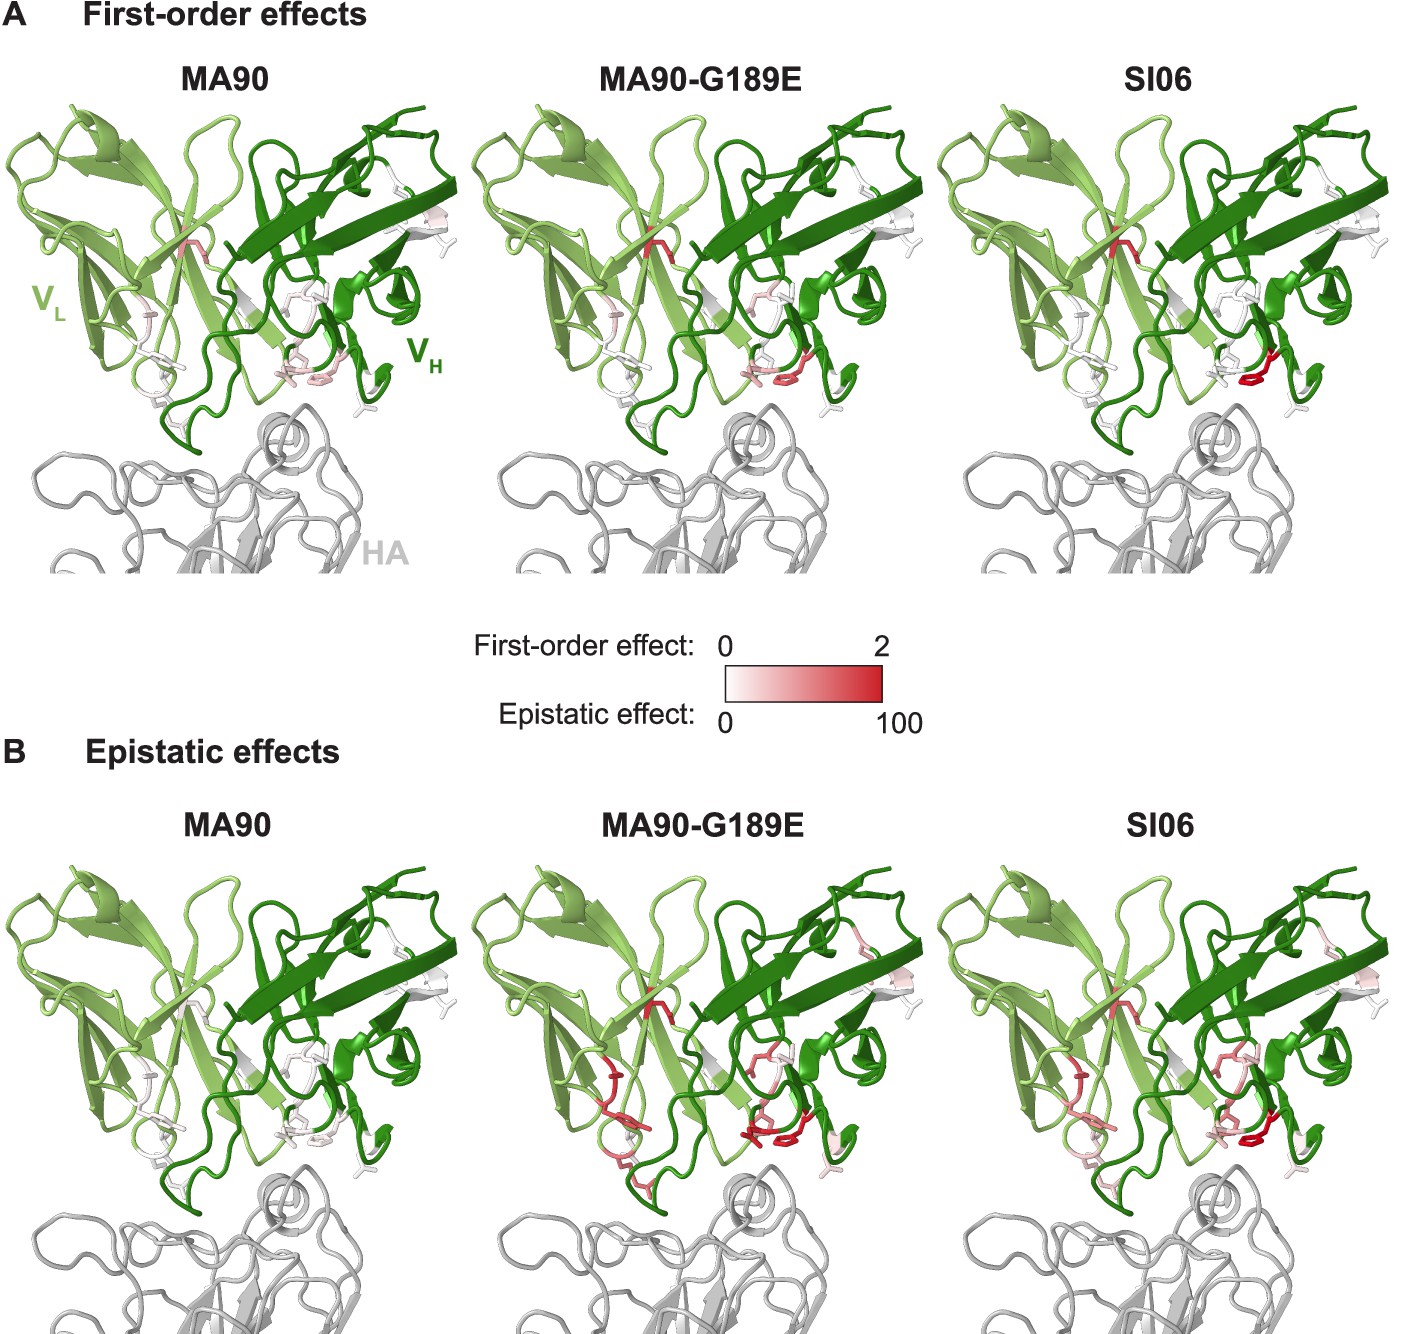
First-order and epistatic effects plotted on co-crystal structure for each antigen.
Absolute value of first-order mutational effects (A) and sum of absolute value of pairwise and higher-order (i.e., epistatic) mutational effects (B) on affinity to each antigen mapped onto the antibody-antigen co-crystal structure (5UGY). Mutations in CH65 relative to unmutated common ancestor (UCA) are shown as sticks; first-order and epistatic effects are colored on the same numeric color scale for each antigen.
Figure 3—figure supplement 6

Variance partitioning of statistical epistasis coefficients by order of interaction.
Figure 4 with 6 supplements

Structural basis of epistasis in CH65.
(A) Three mutations in I-2 (G31D, M34I, N52H) confer affinity to MA90-G189E. Each violin contains 64 genotypes that have the unmutated common ancestor (UCA) residue at positions 35, 48, 49 (VL) and 33, 35, 85, 87 (VH), and are variable at the remaining six positions. In (A) and (D), the white dots indicate the distribution means, and the gray and dotted lines indicate the additive and pairwise expectations, respectively. (B) Epistatic mutations that confer affinity to viral escape strains are distant from the sites of escape. Shown is CH65 bound to SI06 (PDB 5UGY; Whittle et al., 2011). Colored residues highlight the locations of the mutations shown in (A) and (D). Spheres highlight the locations of the viral escape mutations (G189E, ∆K133a, and E156G). (C) Top, left: mutations N52H and G31D establish a network of interactions between HCDR1, HCDR2, and HA. Top, right: distance between G189E and N52H or G31D precludes interaction. Alpha carbon distances are shown. Bottom: Binding kinetics against MA90-G189E for select variants at 30°C by biolayer interferometry using a bivalent analyte binding model. (D) Mutations in I-2 are insufficient for affinity to SI06 (top) but interact epistatically with Y35N and H35N to bind SI06 (bottom). Top: each violin contains 64 genotypes that have the UCA residue at positions 35, 48, 49 (VL) and 33, 35, 85, 87 (VH), and are variable at the remaining six positions. Bottom: each violin contains 64 genotypes that have the UCA residue at positions 48, 49 (VL) and 33, 85, 87 (VH), the CH65 residue at positions 31 and 34 (VH), and are variable at the remaining six positions. ‘’ and ‘+’ indicate mutations that have neutral or beneficial mean effects on -logKD, respectively. (E) Left: epistatic mutations Y35N and H35N are located at the VH-VL interface. Right: somatic mutations remove interactions with the HCDR3. Shown is the unbound I-2 structure (PDB 4HK3 Schmidt et al., 2013). Bottom: binding kinetics against SI06 for select variants at 30°C by biolayer interferometry using a bivalent analyte binding model.
-
Figure 4—source data 1
Binding kinetics for selected antibody variants determined by biolayer interferometry.
Association rates, dissociation rates, and dissociation constants are reported for 12 antibody variants at multiple temperatures against MA90, MA90-G189E, and SI06. Standard errors for each parameter, χ2, and R2 values are reported from global curve fitting using the bivalent analyte model.
- https://cdn.elifesciences.org/articles/83628/elife-83628-fig4-data1-v3.xlsx
-
Figure 4—source data 2
X-ray data collection and refinement statistics for unbound Fabs.
- https://cdn.elifesciences.org/articles/83628/elife-83628-fig4-data2-v3.xlsx
Figure 4—figure supplement 1

Structural analysis of HCDR3 conformations observed in crystal structures of unbound and bound Fabs in the CH65 lineage.
(A) The mutation N52H in CH65 (PDB 4WUK (unbound) and 5UGY (bound)) clashes with E102 in the HCDR3 conformations observed in the unbound crystal structures of the unmutated common ancestor (UCA) (PDB 4HK0) and I-2 (PDB 4HK3). (B) Residue 52H moves to π-stack with residue 33 in a T configuration in CH65 compared to hydrogen bonding between 52H and 33Y in unbound I-2. (C) Unbound Fab structures of several variants in the CH65 lineage. Cartoon volume is scaled by B factors. Previously reported structures show that the HCDR3 conformation in the UCA and I-2 is different than that in CH65, which matches the bound conformation (top). Although the UCA with the Y35N mutation confers affinity to MA90-G189E, the HCDR3 is not in the binding conformation and has exceedingly high B factors (bottom left). Similarly, although the I-2 with the mutations Y35N and H35N confer affinity to SI06, the HCDR3 lacked sufficient density and also had high B factors (bottom middle).
Figure 4—figure supplement 2
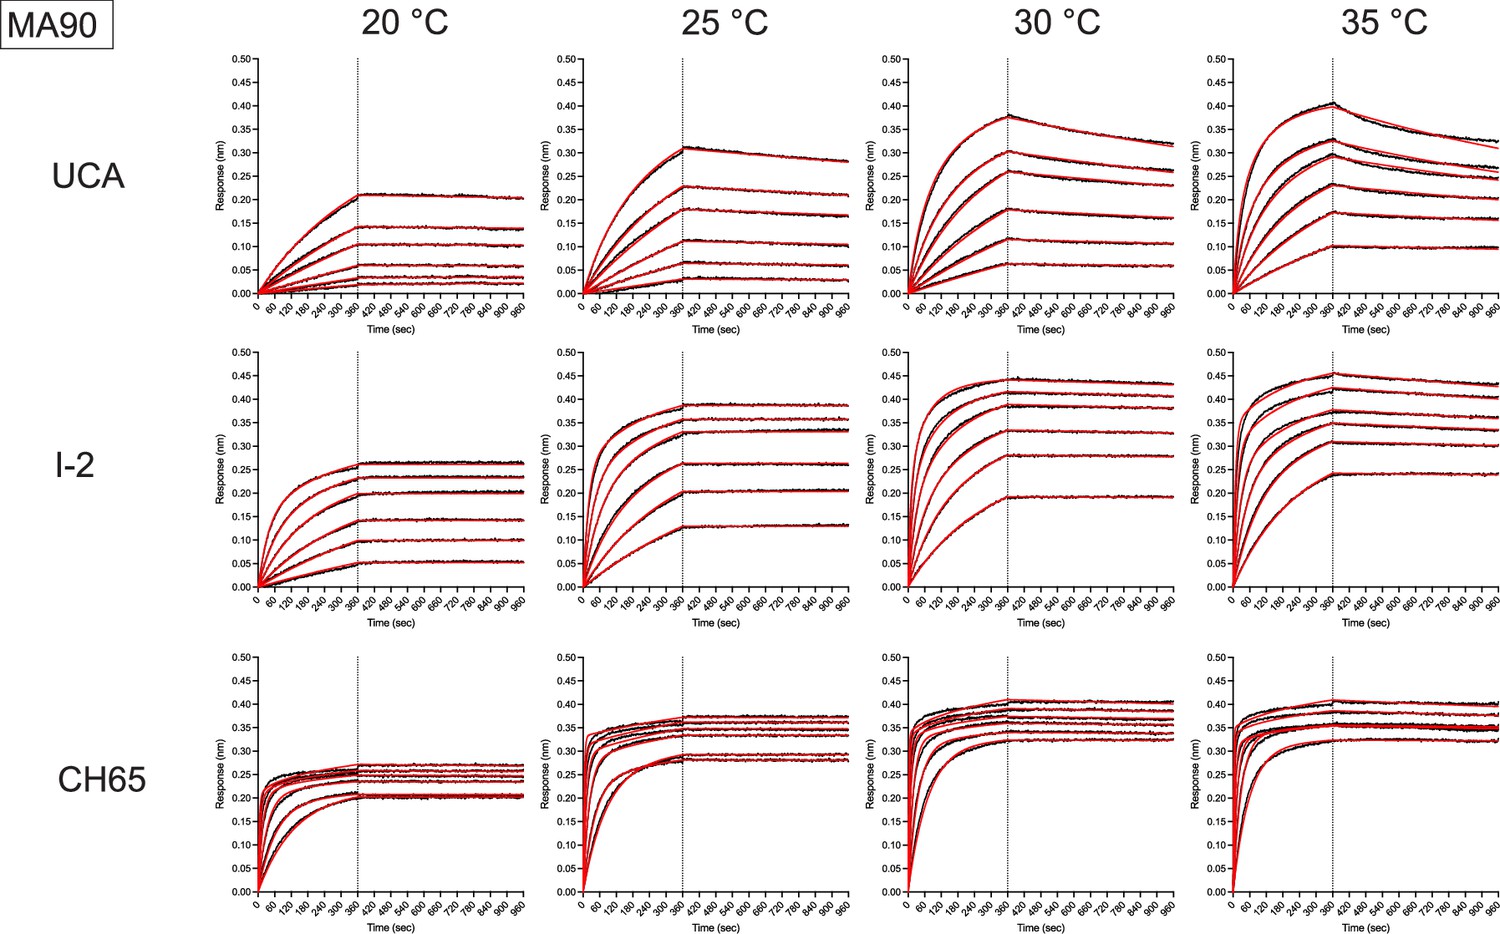
Representative biolayer interferometry binding traces against MA90 for the indicated antibodies (left) and temperatures (top).
Black is the processed data and red is the global curve fit using the bivalent analyte model.
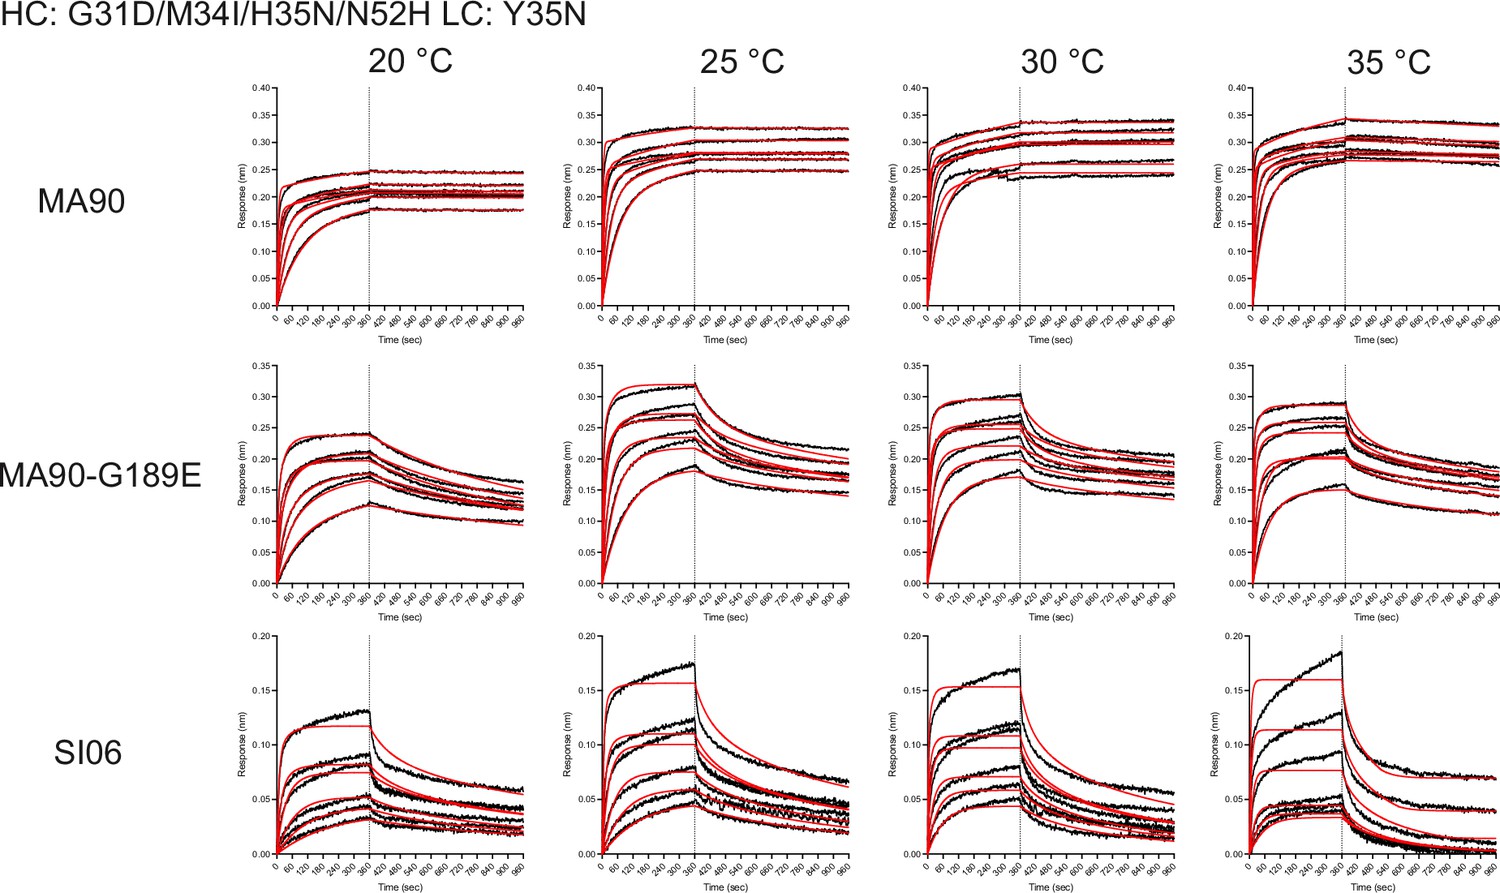
Figure 4—figure supplement 3
Representative biolayer interferometry binding traces against MA90-G189E for the indicated antibodies (left) and temperatures (top).
Black is the processed data and red is the global curve fit using the bivalent analyte model. For the unmutated common ancestor (UCA), there was no detectable binding.
Figure 4—figure supplement 4

Representative biolayer interferometry binding traces against SI06 for the indicated antibodies (left) and temperatures (top).
Black is the processed data and red is the global curve fit using the bivalent analyte model. For the unmutated common ancestor (UCA) and I-2, any signal was too weak for analysis.
Figure 4—figure supplement 5

Summary of all association rates, dissociation rates, and dissociation constants measured by BLI against MA90, MA90-G189E, and SI06 at multiple temperatures.
Error bars represent the standard error for kinetic parameters derived from global curve fitting with a bivalent analyte model using the analysis software supplied with the instrument (Sartorius Data Analysis HT 12.0.2.59). For some high-affinity variants, the dissociation time was too short to accurately measure the dissociation rate against MA90 accurately, especially at lower temperatures (left), resulting in inaccurate dissociation rates with large errors. Antibodies that did not bind MA90-G189E (middle) or SI06 (right) were not included in the plots.
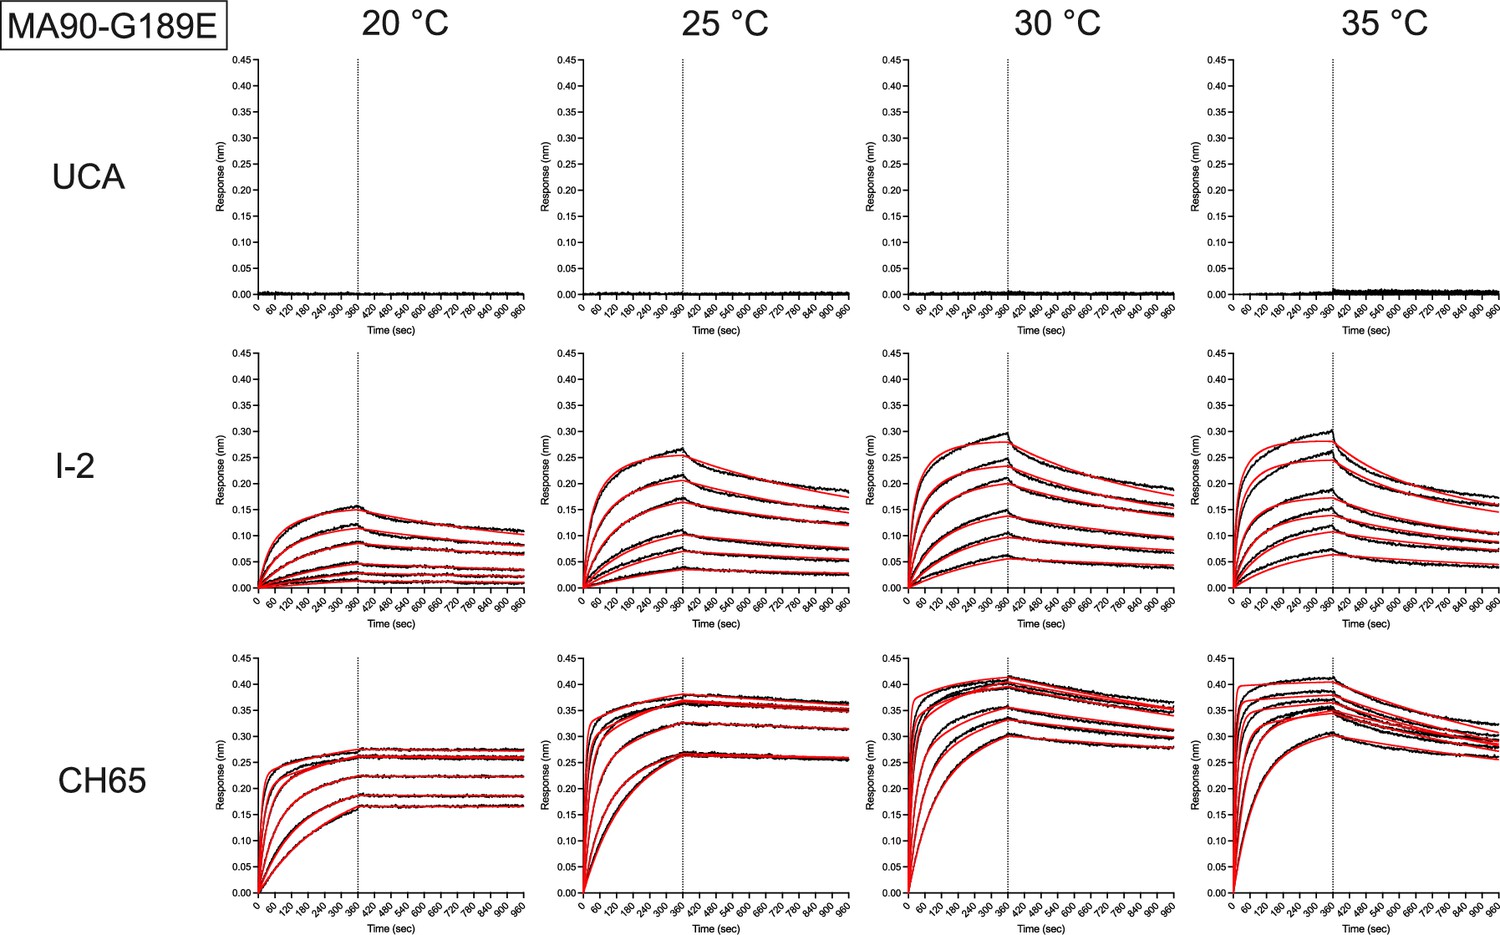
Figure 4—figure supplement 6
Biolayer interferometry binding traces for the antibody variant containing the I-2 mutations (G31D, M34I, and N52H) in addition to H35N and Y35N for the indicated antigens (left) and temperatures (top).
Weak but detectable binding is observed for SI06.
Figure 5 with 3 supplements

Antigen selection scenarios and likely mutational pathways.
(A) Selection scenario likelihood. Total log probability (in arbitrary units) of all mutational paths from the unmutated common ancestor (UCA) to CH65 (left) or paths from the UCA to CH65 that pass through I-2 (right), assuming specific antigen selection scenarios are shown. 'Most likely' scenarios are those with the highest total probability; 'various orders' show the most likely scenarios for scenarios that begin with MA90 and alternatively, with SI06. Error bars indicate standard error obtained through bootstrap, see 'Materials and methods.' (B) -logKD for 25 most likely paths under designated antigen selection scenarios are shown with (right) and without (left) the constraint of passing through I-2. (C) Probability of each mutation occurring at a specific order under select antigen selection scenarios, with (right) and without (left) the constraint of passing through I-2.
Figure 5—figure supplement 1
Antigen selection scenarios and likely mutational pathways with MA90, SI06, and MA90-G189E.
(A) Selection scenario likelihood. Total log probability (in arbitrary units) of all mutational paths from the unmutated common ancestor (UCA) to CH65 (left) or paths from the UCA to CH65 that pass through I-2 (right), assuming specific antigen selection scenarios are shown. 'Most likely' scenarios are those with the highest total probability; 'various orders' show the most likely scenarios for all possible orders of antigen exposure. Error bars indicate standard error obtained through bootstrap; see 'Materials and methods.' (B) -logKD for 25 most likely paths under designated antigen selection scenarios are shown with (right) and without (left) the constraint of passing through I-2. (C) Probability of each mutation occurring at a specific order under select antigen selection scenarios, with (right) and without (left) the constraint of passing through I-2.
Figure 5—figure supplement 2

Likelihood of passing through specific 3-mutation intermediates.
Histogram indicates number of 3-mutation variants with a given log-likelihood under the unconstrained moderate selection model presented in Figure 5. The log-likelihood corresponding to I-2, the expectation for a 3-mutation genotype chosen at random (1/560), and the median across all 3-mutation genotypes are indicated as vertical lines on the plot.
Figure 5—figure supplement 3

Graphical model for acquisition of antibody breadth.
(A) Hierarchical mutations confer affinity to two distinct antigens. In this model, mutations a and b (mx) improve affinity to antigen-1; mutations a, b, c, and d improve affinity to antigen-2 (mt). (B) Mutations may confer affinity additively or epistatically. Given the hierarchical structure of mutational effects defined in (A), affinity to each antigen could theoretically be mediated by additive (top) and/or epistatic (bottom) effects. (C) Additive and epistatic models result in distinct sequence-affinity landscapes. The hypothetical additive and epistatic mutational effects presented in (C) would result in distinct sequence-affinity landscapes (compare with data in Figure 1B). Each point in the scatter plot represents one of the 16 possible genotypes, colored by the number of mutations it contains. (D) Graphical summary for epistasis-mediated breadth of CH65. The unmutated common ancestor (UCA) has affinity to MA90 and improves in affinity to MA90 through minimal mutations that are largely additive and low-order effects mediated by contacts with the antigen and HCDR3. After acquiring these mutations (mx), affinity to MA90 does not improve substantially, but additional mutations begin to improve affinity to SI06 through high-order synergistic epistasis mediated by multi-residue interactions.
Tables
Key resources table
| Reagent type (species) or resource | Designation | Source or reference | Identifiers | Additional information |
|---|---|---|---|---|
| Strain, strain background (Saccharomyces cerevisiae) | EBY100 | ATCC | Cat# MYA-4941 | |
| Strain, strain background (influenza A virus) | Influenza A/Puerto Rico/8/1934 with A/Massachusetts/1/1990HA and A/Siena/10/1989 NA | Jesse Bloom and this paper | GenBank: L19027 (HA); GenBank: CY036823 (NA) | |
| Cell line (Homo sapiens) | HEK293T | ATCC | Cat# CRL-3216 | |
| Cell line (Canis lupus familiaris) | MDCK-SIAT1 | MilliporeSigma | Cat# 05071502 | |
| Cell line (H. sapiens) | Expi293F | Gibco | Cat# A14527 | |
| Antibody | Anti-cMyc-FITC (mouse monoclonal) | Miltenyi Biotec | Cat# 130-116-485 | FACS (1:50) |
| Recombinant DNA reagent | pCHA (plasmid) | Dane Wittrup Mata-Fink et al., 2013 | ||
| Recombinant DNA reagent | pCHA_UCA860_scFv (plasmid) | This paper | Plasmid map in Supplementary file 1 | |
| Recombinant DNA reagent | pCHA_CH65_scFv (plasmid) | This paper | Plasmid map in Supplementary file 2 | |
| Sequence-based reagent | CH65 golden gate primers | IDT | Sequences listed in Supplementary file 3 | |
| Sequence-based reagent | Illumina sequencing primers | IDT | Sequences listed in Supplementary file 4 | |
| Peptide, recombinant protein | Streptavidin-RPE | Thermo Fisher | Cat# S866 | FACS (1:100) |
| Peptide, recombinant protein | A/Massachusetts/1/1990 – MA90 | This paper | Sequence in Supplementary file 5 | |
| Peptide, recombinant protein | A/Massachusetts/1/1990 – MA90-G189E | This paper | Sequence in Supplementary file 6 | |
| Peptide, recombinant protein | A/Solomon Islands/03/2006 | This paper | Sequence in Supplementary file 7 | |
| Peptide, recombinant protein | Various Fabs & IgGs | This paper | See Figure 4—source data 1 for specific sequences | |
| Commercial assay or kit | BirA500 kit | Avidity | ||
| Commercial assay or kit | Zymo Yeast Plasmid Miniprep II | Zymo Research | Cat# D2004 | |
| Software, algorithm | Custom code | This paper | github.com/amphilli/CH65-comblib | |
| Software, algorithm | Interactive data browser | This paper | https://ch65-ma90-browser.netlify.app/ |
Additional files
-
Supplementary file 1
Plasmid map of pCHA with UCA860 scFv sequence.
- https://cdn.elifesciences.org/articles/83628/elife-83628-supp1-v3.zip
-
Supplementary file 2
Plasmid map of pCHA with CH65 scFv sequence.
- https://cdn.elifesciences.org/articles/83628/elife-83628-supp2-v3.zip
-
Supplementary file 3
Primers for constructing CH65 combinatorial mutation library.
- https://cdn.elifesciences.org/articles/83628/elife-83628-supp3-v3.xlsx
-
Supplementary file 4
Primers for sequencing library preparation.
- https://cdn.elifesciences.org/articles/83628/elife-83628-supp4-v3.xlsx
-
Supplementary file 5
MA90 full-length soluble ectodomain HA expression construct.
- https://cdn.elifesciences.org/articles/83628/elife-83628-supp5-v3.zip
-
Supplementary file 6
MA90-G189E full-length soluble ectodomain expression construct.
- https://cdn.elifesciences.org/articles/83628/elife-83628-supp6-v3.zip
-
Supplementary file 7
SI06 full-length soluble ectodomain HA expression construct.
- https://cdn.elifesciences.org/articles/83628/elife-83628-supp7-v3.zip
-
MDAR checklist
- https://cdn.elifesciences.org/articles/83628/elife-83628-mdarchecklist1-v3.docx
Download links
A two-part list of links to download the article, or parts of the article, in various formats.
Downloads (link to download the article as PDF)
Open citations (links to open the citations from this article in various online reference manager services)
Cite this article (links to download the citations from this article in formats compatible with various reference manager tools)
Hierarchical sequence-affinity landscapes shape the evolution of breadth in an anti-influenza receptor binding site antibody
eLife 12:e83628.
https://doi.org/10.7554/eLife.83628


