A hierarchy of cell death pathways confers layered resistance to shigellosis in mice
- Division of Immunology & Molecular Medicine, Department of Molecular & Cell Biology, University of California, Berkeley, United States
- Cancer Research Laboratory, University of California, Berkeley, United States
- Department of Microbiology, Harvard Medical School, United States
- Broad Institute of Harvard and MIT, United States
- Department of Medicine, Division of Infectious Diseases, Massachusetts General Hospital, United States
- Immunotherapeutics and Vaccine Research Initiative, University of California, Berkeley, United States
- Howard Hughes Medical Institute, University of California, Berkeley, United States
Figures
Figure 1 with 2 supplements
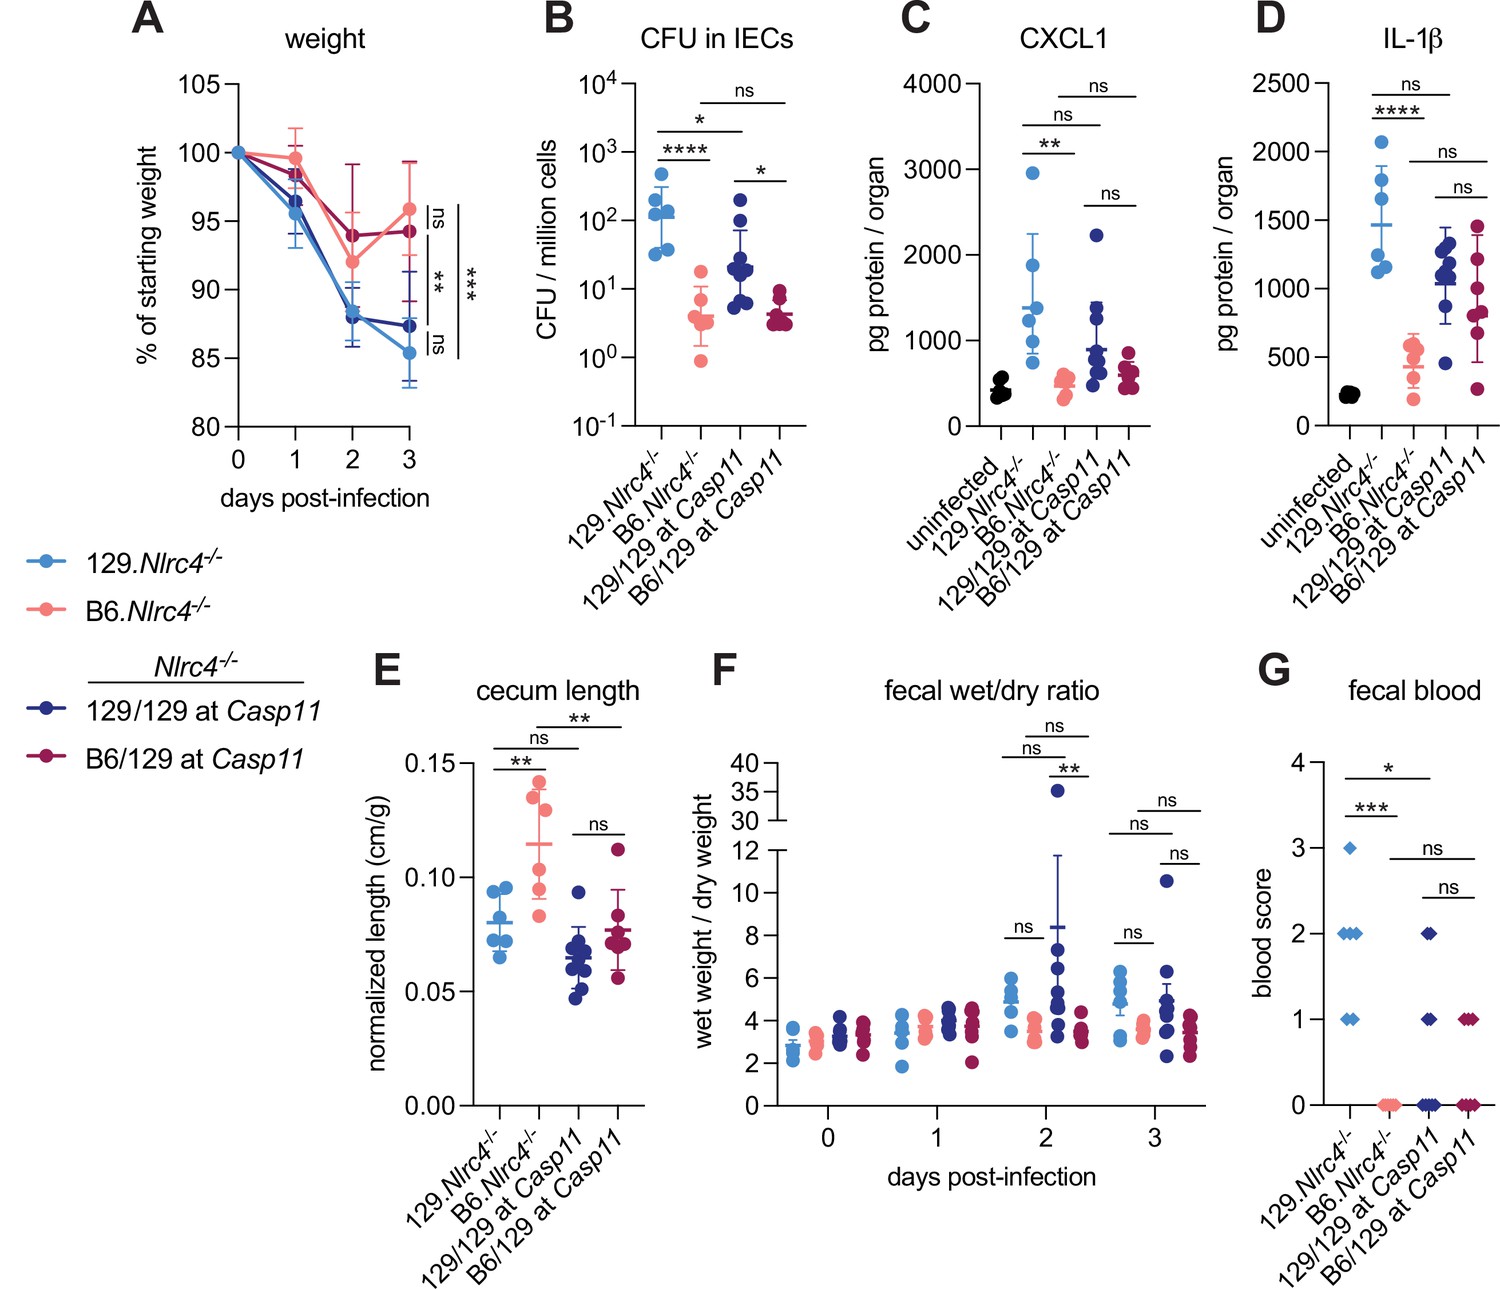
CASP11 contributes to resistance of B6 versus 129 Nlrc4–/– mice to shigellosis.
(A–G) B6.Nlrc4–/– mice (pink, n=6), 129.Nlrc4–/– mice (light blue, n=6), and backcrossed littermates that are homozygous 129/129 at Casp11 (dark blue, n=9) or heterozygous B6/129 at Casp11 (maroon, n=7) were co-housed for 3 weeks, treated orally with 25 mg streptomycin sulfate in water, and orally challenged the next day with 107 colony forming units (CFUs) of wild-type (WT) Shigella flexneri. Mice were sacrificed at 3 days post-infection. (A) Mouse weights from 0 through 3 days post-infection. Each symbol represents the mean for all mice of the indicated genotype. (B) Shigella CFUs per million cells from the combined intestinal epithelial cell (IEC) enriched fraction of gentamicin-treated cecum and colon tissue. (C, D) CXCL1 and IL-1β levels measured by ELISA from homogenized cecum and colon tissue of infected mice. (E) Quantification of cecum lengths normalized to mouse weight prior to infection; cecum length (cm)/mouse weight (g). (F) The ratio of fecal pellet weight when wet (fresh) divided by the fecal pellet weight after overnight drying. A larger wet/dry ratio indicates increased diarrhea. Pellets were collected daily from 0 to 3 days post-infection. (G) Additive blood scores from feces collected at 2 and 3 days post-infection. 1=occult blood, 2=macroscopic blood for a given day, maximum score is 4. (B–G) Each symbol represents one mouse. Data collected from one experiment. Mean ± SD is shown in (A, C– E). Geometric mean ± SD is shown in (B). Mean ± SEM is shown in (F). Statistical significance was calculated by one-way ANOVA with Tukey’s multiple comparison test (A (day 3), B, C, D, E, and G) and by two-way ANOVA with Tukey’s multiple comparison test (F). Data were log-transformed prior to calculations in (B) and (F) to achieve normality. *p<0.05, **p<0.01, ***p<0.001, ****p<0.0001, ns = not significant (p>0.05).
Figure 1—figure supplement 1
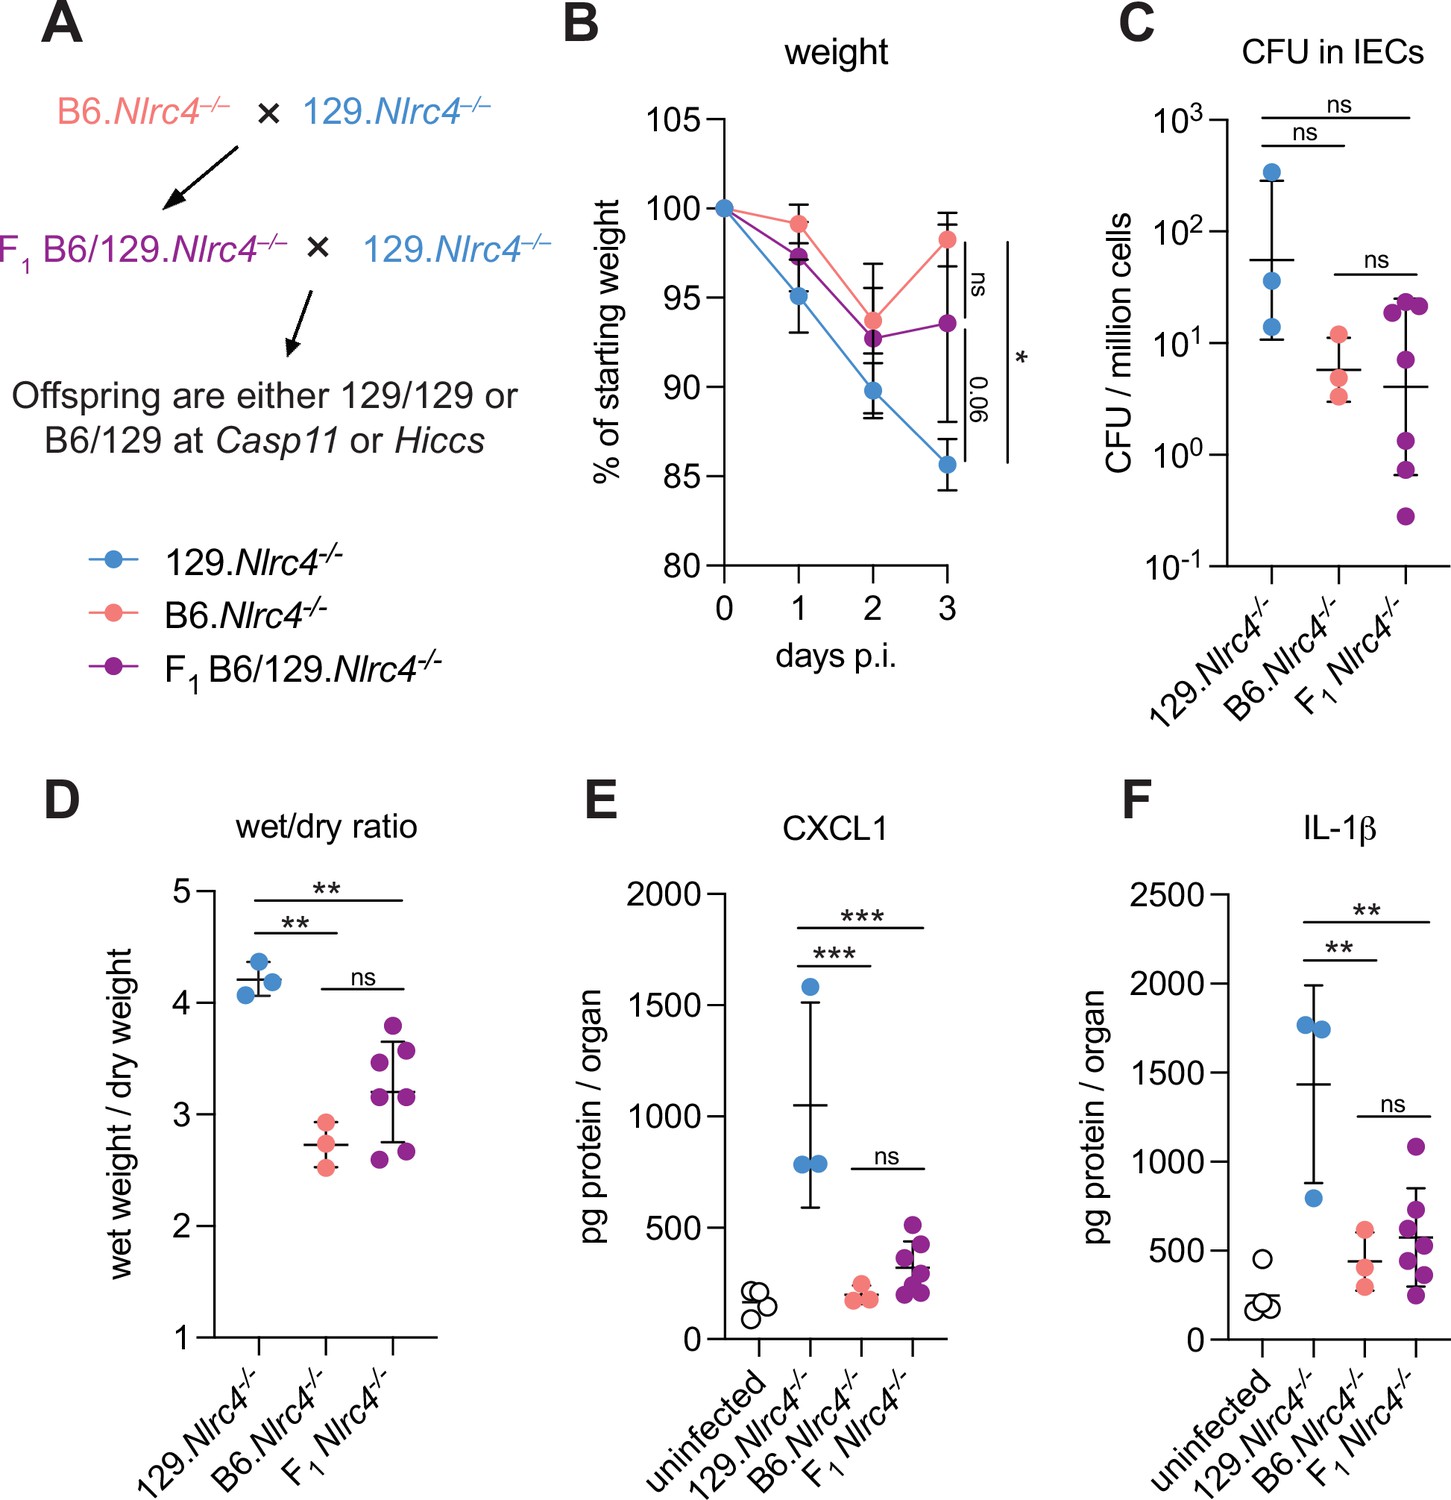
B6/129.Nlrc4–/– F1 hybrids are modestly susceptible to Shigella.
Crossing scheme to generate B6/129.Nlrc4–/– F1 mice and backcrossed Nlrc4–/– mice that are heterozygous B6/129 or homozygous 129/129 at Casp11 or Hiccs. (B–E) 129.Nlrc4–/– (light blue, n=3), B6.Nlrc4–/– (pink, n=3), and 129/B6.Nlrc4–/– F1 (plum, n=7) mice were treated orally with 25 mg streptomycin sulfate in water and orally challenged the next day with 107 colony forming units (CFUs) of wild-type (WT) Shigella flexneri. Mice were sacrificed at 3 days post-infection. (B) Mouse weights from 0 through 3 days post-infection. Each symbol represents the mean for all mice of the indicated group. (C) Shigella CFUs per million cells from the combined intestinal epithelial cell (IEC) enriched fraction of gentamicin-treated cecum and colon tissue. (D) The ratio of fecal pellet weight when wet (fresh) divided by the fecal pellet weight after overnight drying. A larger wet/dry ratio indicates increased diarrhea. Pellets were collected at day 2 post-infection. (E, F) CXCL1 and IL-1β levels measured by ELISA from homogenized cecum and colon tissue of infected mice. (C–F) Each symbol represents one mouse. Data collected from one experiment. Mean ± SD is shown in (B, D–F). Geometric mean ± SD is shown in (C). Statistical significance was calculated by one-way ANOVA with Tukey’s multiple comparison test (B (day 3), C–F). Data were log-transformed prior to calculations in (C) to achieve normality. *p<0.05, **p<0.01, ***p<0.001, ****p<0.0001, ns = not significant (p>0.05).
Figure 1—figure supplement 2
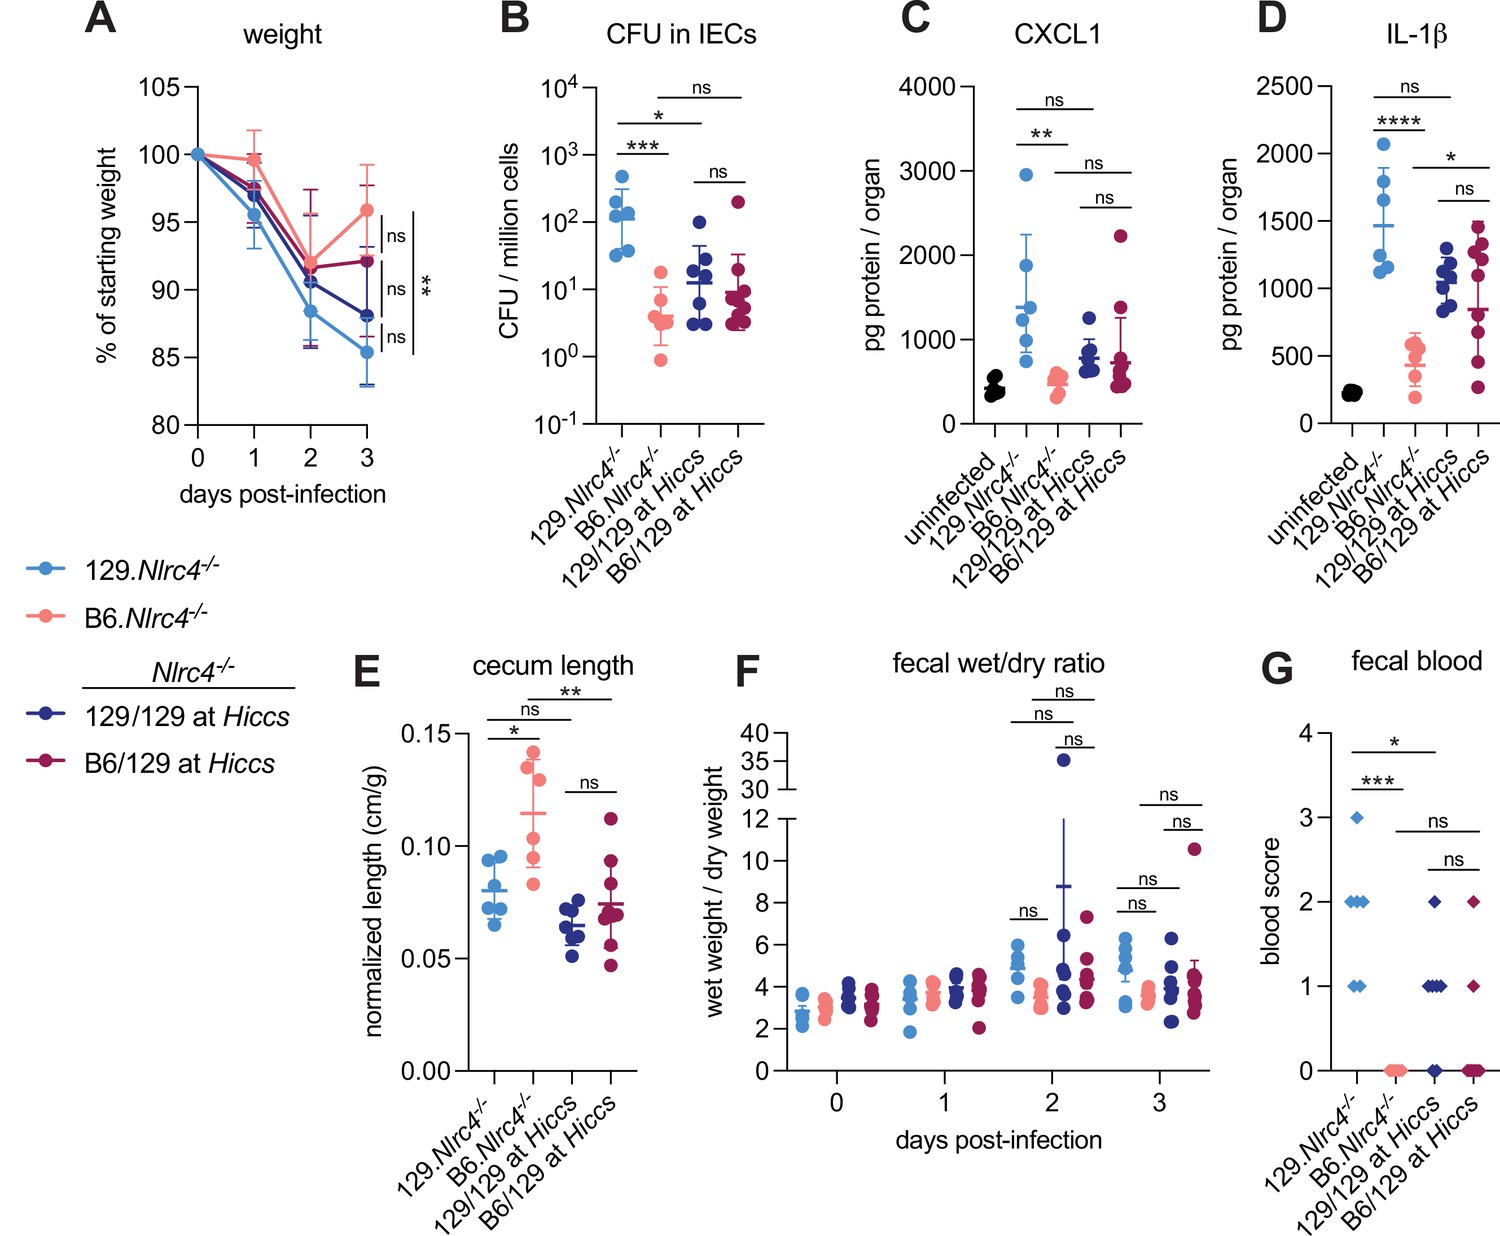
Hiccs does not contribute to resistance of B6 versus 129 Nlrc4–/– mice to shigellosis.
(A–G) Backcrossed Nlrc4–/– littermates from Figure 1 were genotyped at Hiccs to determine whether they were 129/129 (dark blue, n=7) or B6/129 (maroon, n=9) at this locus. Data originally generated in Figure 1 were stratified by Hiccs locus genotype for each backcrossed mouse and compared to the original parental B6.Nlrc4–/– (pink), 129.Nlrc4–/– (light blue) mice. Refer to the Figure 1 legend for experimental details. (A) Mouse weights from 0 through 3 days post-infection. Each symbol represents the mean for all mice of the indicated genotype. (B) Shigella colony forming units (CFUs) per million cells from the combined intestinal epithelial cell (IEC) enriched fraction of gentamicin-treated cecum and colon tissue. (C, D) CXCL1 and IL-1β levels measured by ELISA from homogenized cecum and colon tissue of infected mice. (E) Quantification of cecum lengths normalized to mouse weight prior to infection; cecum length (cm)/mouse weight (g). (F) The ratio of fecal pellet weight when wet (fresh) divided by the fecal pellet weight after overnight drying. A larger wet/dry ratio indicates increased diarrhea. Pellets were collected daily from 0 to 3 days post-infection. (G) Additive blood scores from feces collected at 2 and 3 days post-infection. 1=occult blood, 2=macroscopic blood for a given day. (B–G) Each symbol represents one mouse. Data collected from one experiment. Mean ± SD is shown in (A, C–E). Geometric mean ± SD is shown in (B). Mean ± SEM is show in (F). Statistical significance was calculated by one-way ANOVA with Tukey’s multiple comparison test (A (day 3), B, C, D, E, and G) and by two-way ANOVA with Tukey’s multiple comparison test (F). Data were log-transformed prior to calculations in (B) and (F) to achieve normality. *p<0.05, **p<0.01, ***p<0.001, ****p<0.0001, ns = not significant (p>0.05).
Figure 2 with 2 supplements
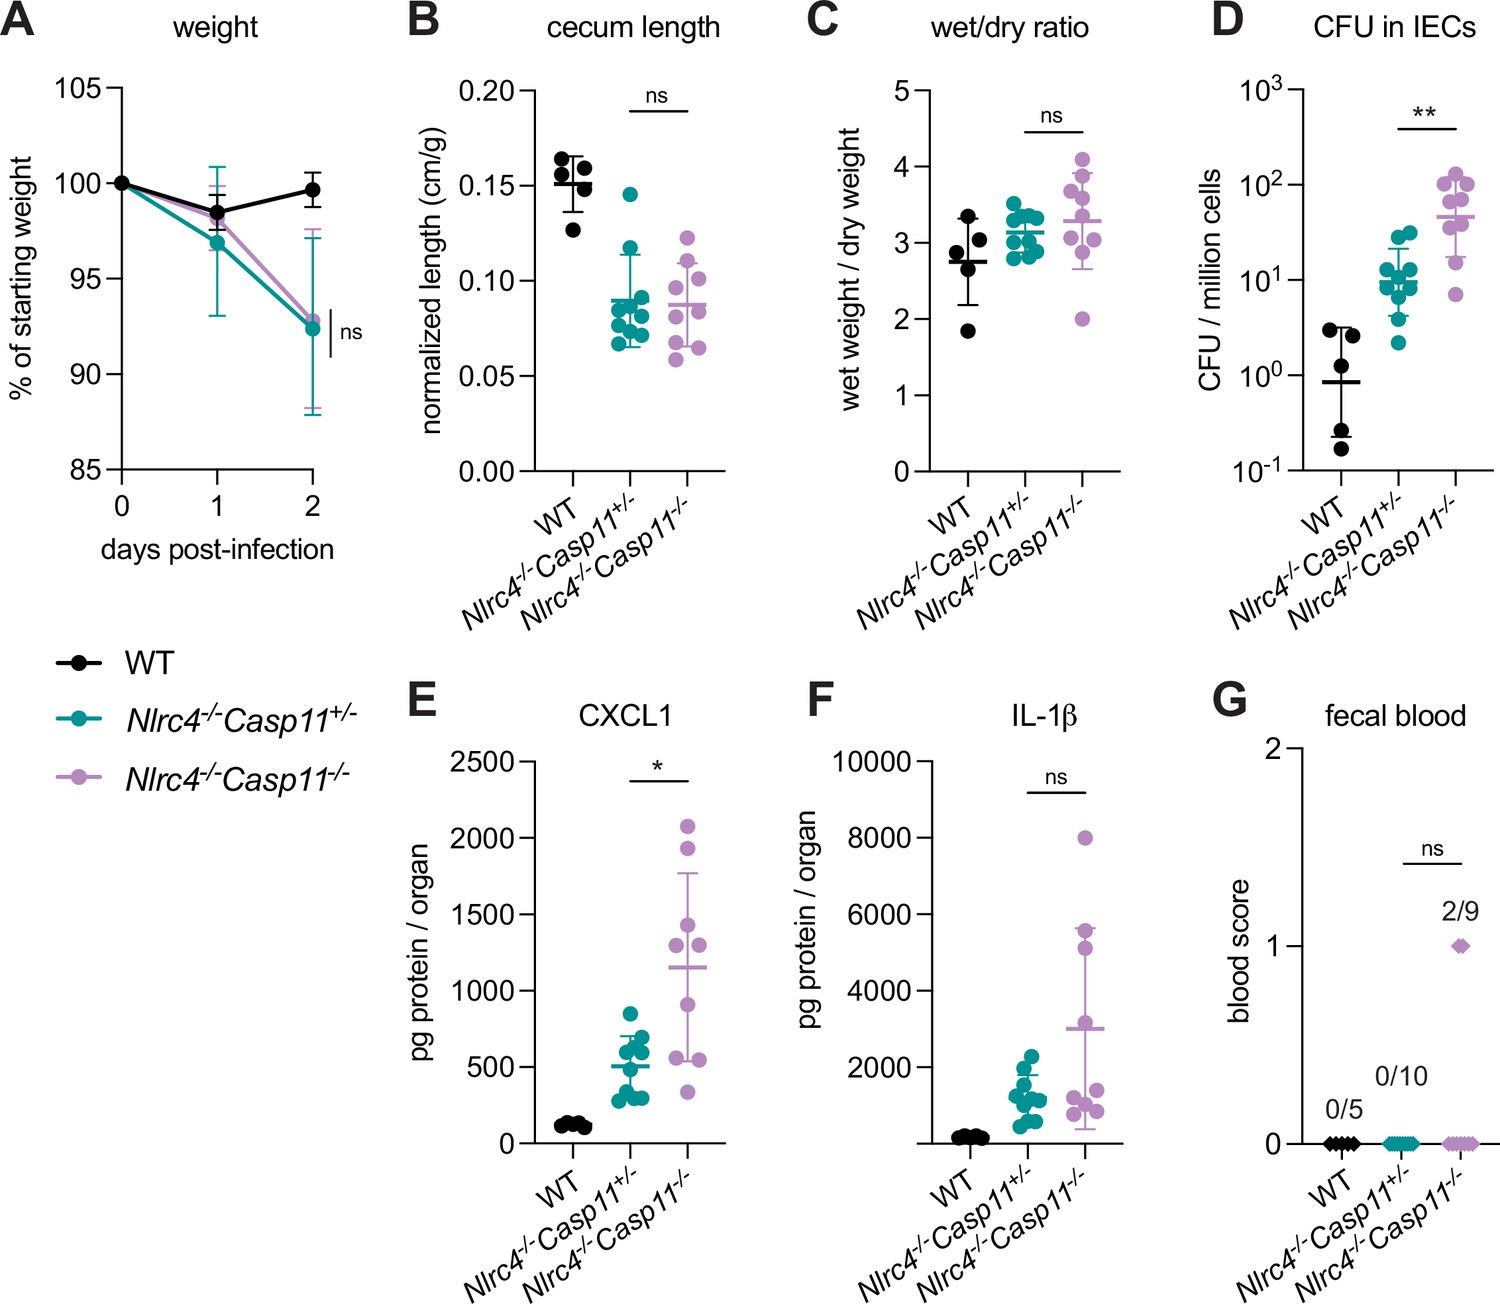
CASP11 modestly contributes to resistance of B6.Nlrc4–/– mice to shigellosis.
(A–G) B6.WT mice (co-housed B6.WT and B6.Nlrc4+/–Casp11+/–mice, black, n=5) and B6.Nlrc4–/–Casp11+/– (teal, n=10) and B6.Nlrc4–/–Casp11–/– (lavender, n=9) littermates were treated orally with 25 mg streptomycin sulfate in water and orally challenged the next day with 107 colony forming units (CFUs) of wild-type (WT) Shigella flexneri. Mice were sacrificed at 2 days post-infection. (A) Mouse weights from 0 through 2 days post-infection. Each symbol represents the mean for all mice of the indicated genotype. (B) Quantification of cecum lengths normalized to mouse weight prior to infection; cecum length (cm)/mouse weight (g). (C) The ratio of fecal pellet weight when wet (fresh) divided by the fecal pellet weight after overnight drying. Pellets were collected at day 2 post-infection. A larger wet/dry ratio indicates increased diarrhea. (D) Shigella CFUs per million cells from the combined intestinal epithelial cell (IEC) enriched fraction of gentamicin-treated cecum and colon tissue. (E, F) CXCL1 and IL-1β levels measured by ELISA from homogenized cecum and colon tissue of infected mice. (G) Blood scores from feces collected at 2 days post-infection. 1=occult blood, 2=macroscopic blood. (B–G) Each symbol represents one mouse. Data collected from two independent experiments. Mean ± SD is shown in (A–C, E, F). Geometric mean ± SD is shown in (D). Statistical significance was calculated by Mann-Whitney test in (A–F) and by Fisher’s exact test in (G) where data were stratified by presence (score = 1 or 2) or absence (score = 0) of blood. In (A) statistical analysis was performed at day 2. *p<0.05, **p<0.01, ***p<0.001, ****p<0.0001, ns = not significant (p>0.05).
Figure 2—figure supplement 1
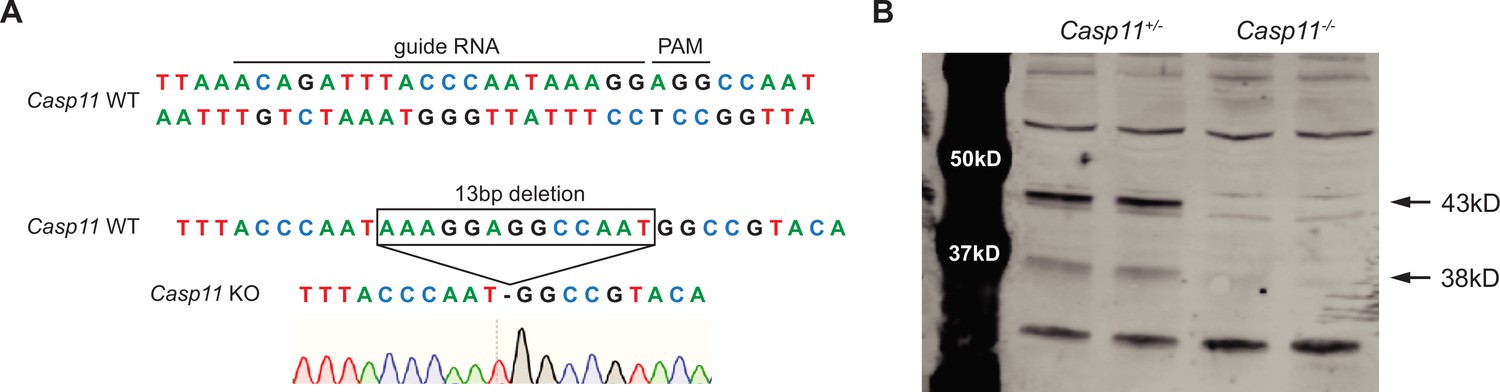
B6.Nlrc4–/–Casp11–/– mice have a 13 bp deletion in Casp11 and loss of CASP11 protein.
(A) Endogenous B6.Casp11 gene with guide RNA sequence and PAM site (above) and resulting edited locus (below). Edited mice have a 13 bp deletion in Casp11 that results in a frameshift mutation. (B) Western blot of bone marrow-derived macrophage lysates from mice edited at Casp11 that are either heterozygous (left two lanes) or homozygous knockout (right two lanes). The absence of bands at ~38 and ~43 kD indicates loss of Caspase-11 protein in the Casp11–/– mice. For raw blots of (B) see Figure 2—figure supplement 1—source data 1.
-
Figure 2—figure supplement 1—source data 1
Raw images of CASP11 protein western blots from bone marrow-derived macrophage lysates from mice edited at Casp11 that are either heterozygous (left two lanes) or homozygous knockout (right two lanes).
Raw images were cropped and inverted to show lanes in a more readable orientation.
- https://cdn.elifesciences.org/articles/83639/elife-83639-fig2-figsupp1-data1-v2.zip
Figure 2—figure supplement 2
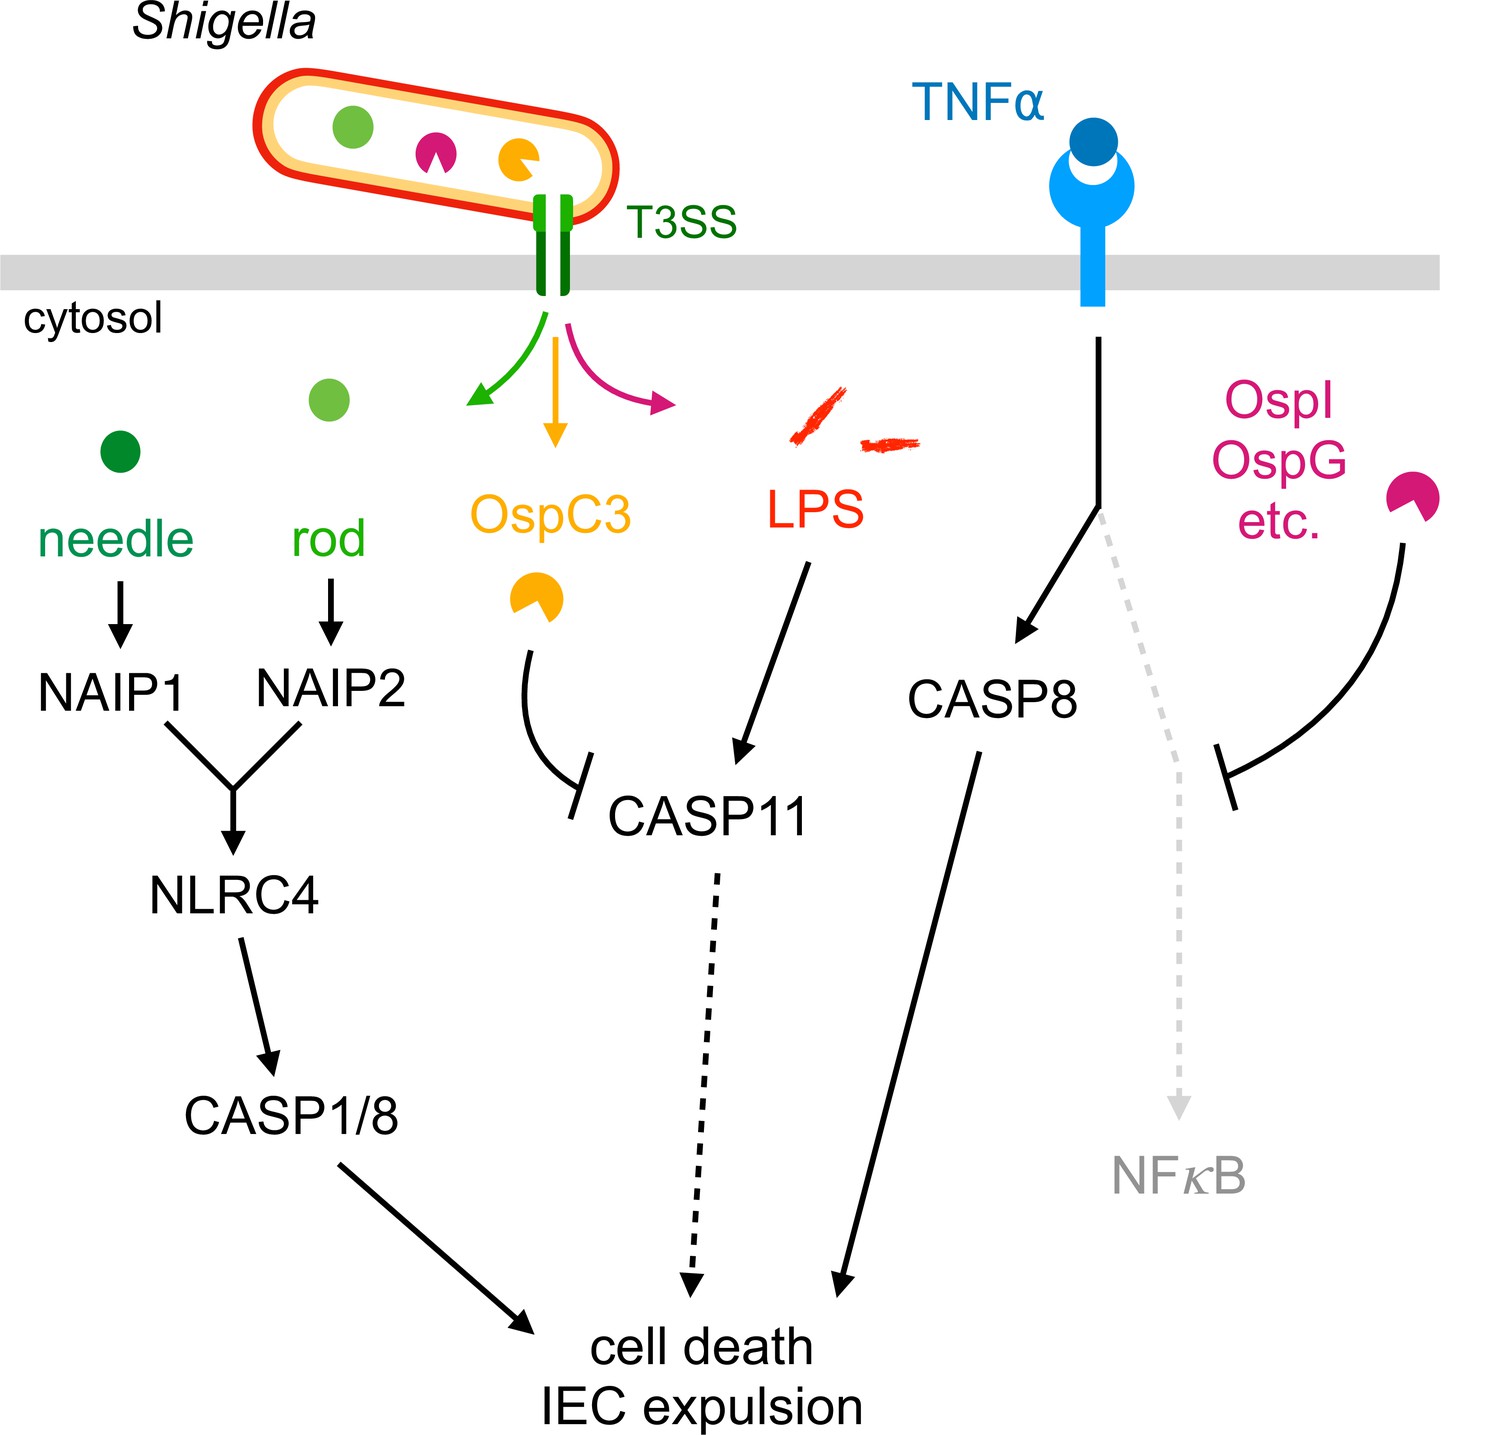
Shigella activates mouse cell death pathways.
Mouse NAIP–NLRC4, CASP11, and CASP8 respond to Shigella pathogen-associated molecular patterns or activities to initiate cell death. NAIP1 and NAIP2 receptors bind cytosolic needle and rod proteins (green), respectively, that are secreted through the Shigella type three secretion system (T3SS) leading to NLRC4 inflammasome formation and CASP1- or CASP8-dependent pyroptosis. CASP11 recognizes cytosolic Shigella LPS (read), leading to non-canonical inflammasome formation and pyroptosis which is partially inhibited when Shigella expresses effector OspC3 (yellow). TNFα (blue) initiates CASP8-dependent apoptosis through TNFRI when NF-κB signaling is suppressed by Shigella effectors (magenta). All three pathways also lead to cell expulsion when activated in intestinal epithelial cells.
Figure 3
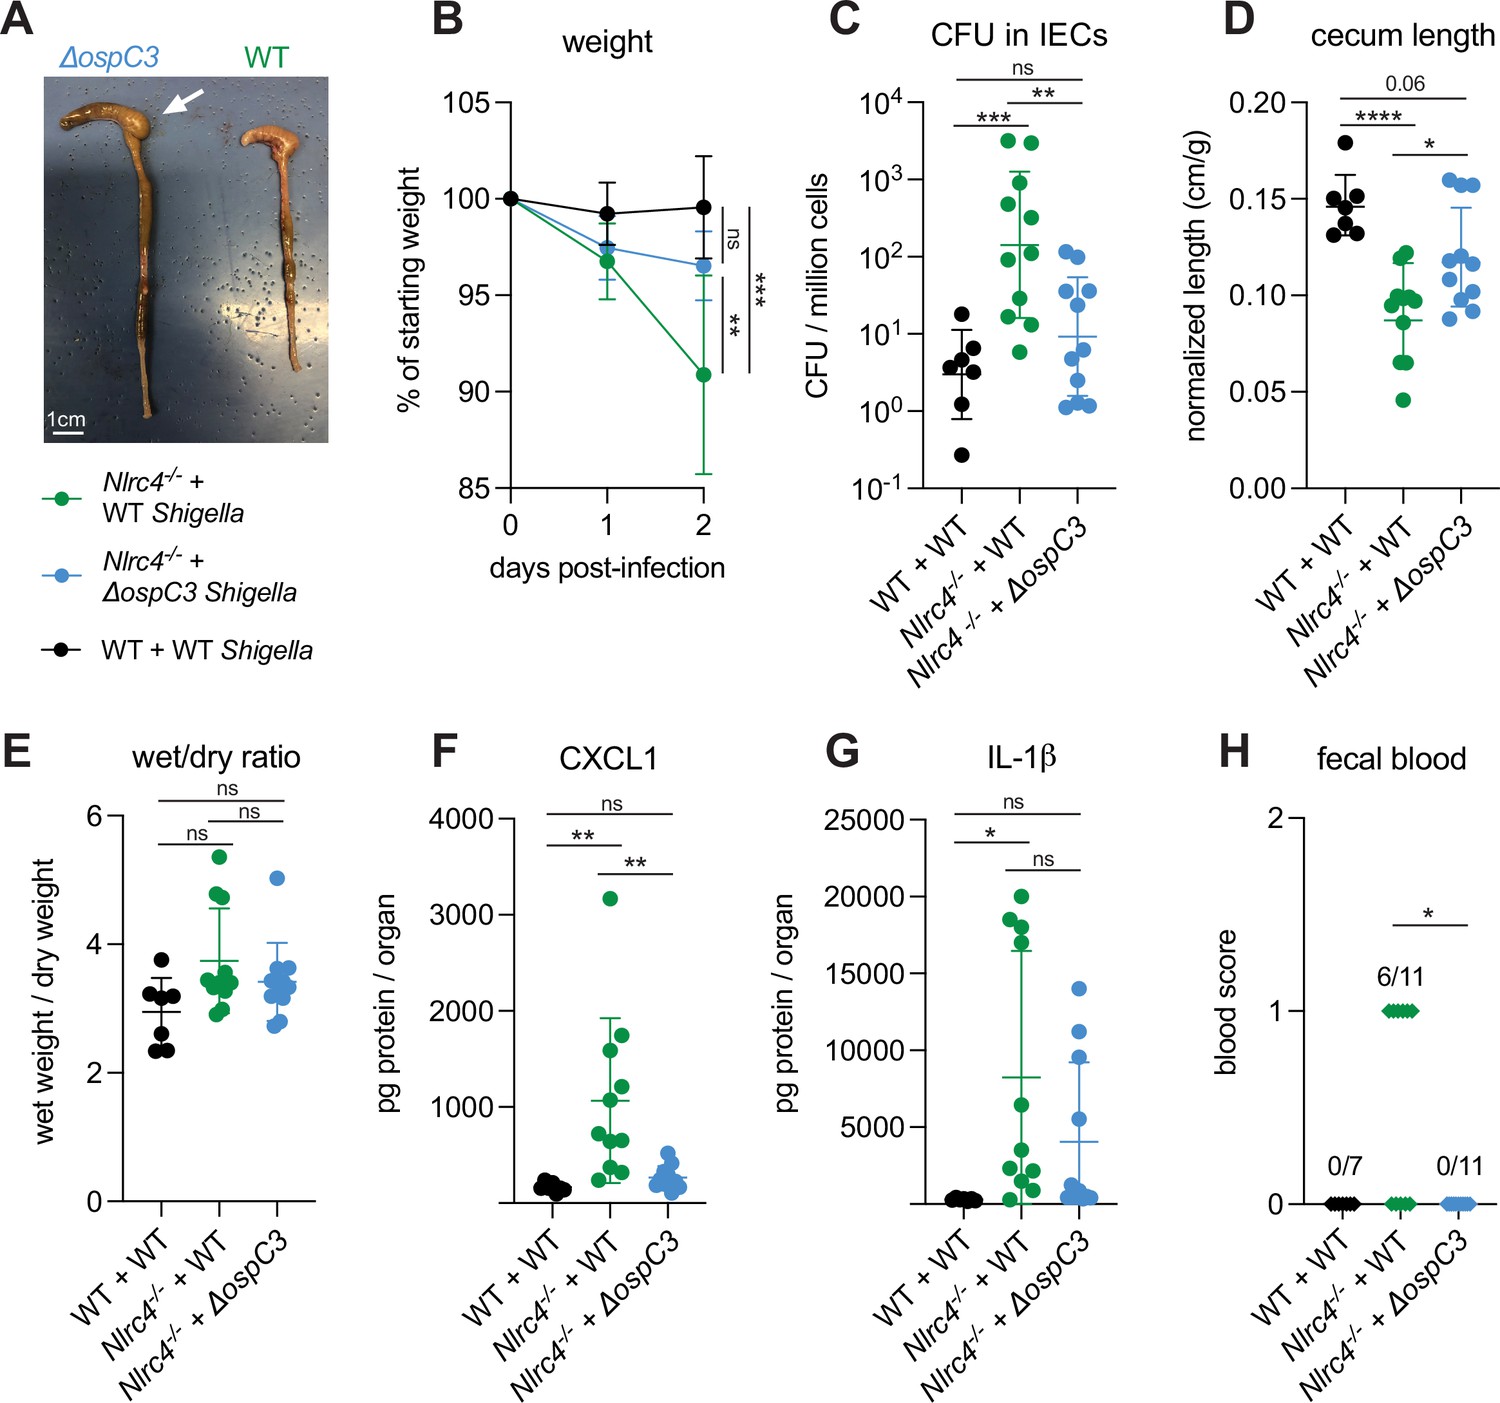
Shigella effector OspC3 is critical for virulence in oral Shigella infection.
(A–H) Mice were treated orally with 25 mg streptomycin sulfate in water and infected 1 day later. B6.WT mice (co-housed wild-type [WT] and B6.Nlrc4+/–Casp11+/–) were orally challenged with 107 colony forming units (CFUs) of WT Shigella flexneri (n=7) and B6.Nlrc4–/– mice (co-housed B6.Nlrc4–/– and B6.Nlrc4–/–Casp11+/–) were challenged with WT (green, n=11) or ΔospC3 S. flexneri (blue, n=11). Mice were sacrificed at 2 days post-infection. (A) Representative images of the cecum and colon from B6.Nlrc4–/– mice infected with WT or ΔospC3 S. flexneri. The white arrow indicates clear but reduced inflammation in mice infected with the ΔospC3 strain. (B) Mouse weights from 0 through 2 days post-infection. Each symbol represents the mean for all mice of the indicated genotype. (C) Shigella CFUs per million cells from the combined intestinal epithelial cell (IEC) enriched fraction of gentamicin-treated cecum and colon tissue. (D) Quantification of cecum lengths normalized to mouse weight prior to infection; cecum length (cm)/mouse weight (g). (E) The ratio of fecal pellet weight when wet (fresh) divided by the fecal pellet weight after overnight drying. Pellets were collected at day 2 post-infection. (F, G) CXCL1 and IL-1β levels measured by ELISA from homogenized cecum and colon tissue of infected mice. (H) Blood scores from feces collected at 2 days post-infection. 1=occult blood, 2=macroscopic blood. (C–H) Each symbol represents one mouse. Data collected from two independent experiments. Mean ± SD is shown in (B, D–G). Geometric mean ± SD is shown in (C). Statistical significance was calculated by one-way ANOVA with Tukey’s multiple comparison test (B (day 2), C–G) and by Fisher’s exact test in (H) where data were stratified by presence (score = 1 or 2) or absence (score = 0) of blood. Data were log-transformed prior to calculations in (C) to achieve normality. *p<0.05, **p<0.01, ***p<0.001, ****p<0.0001, ns = not significant (p>0.05).
Figure 4
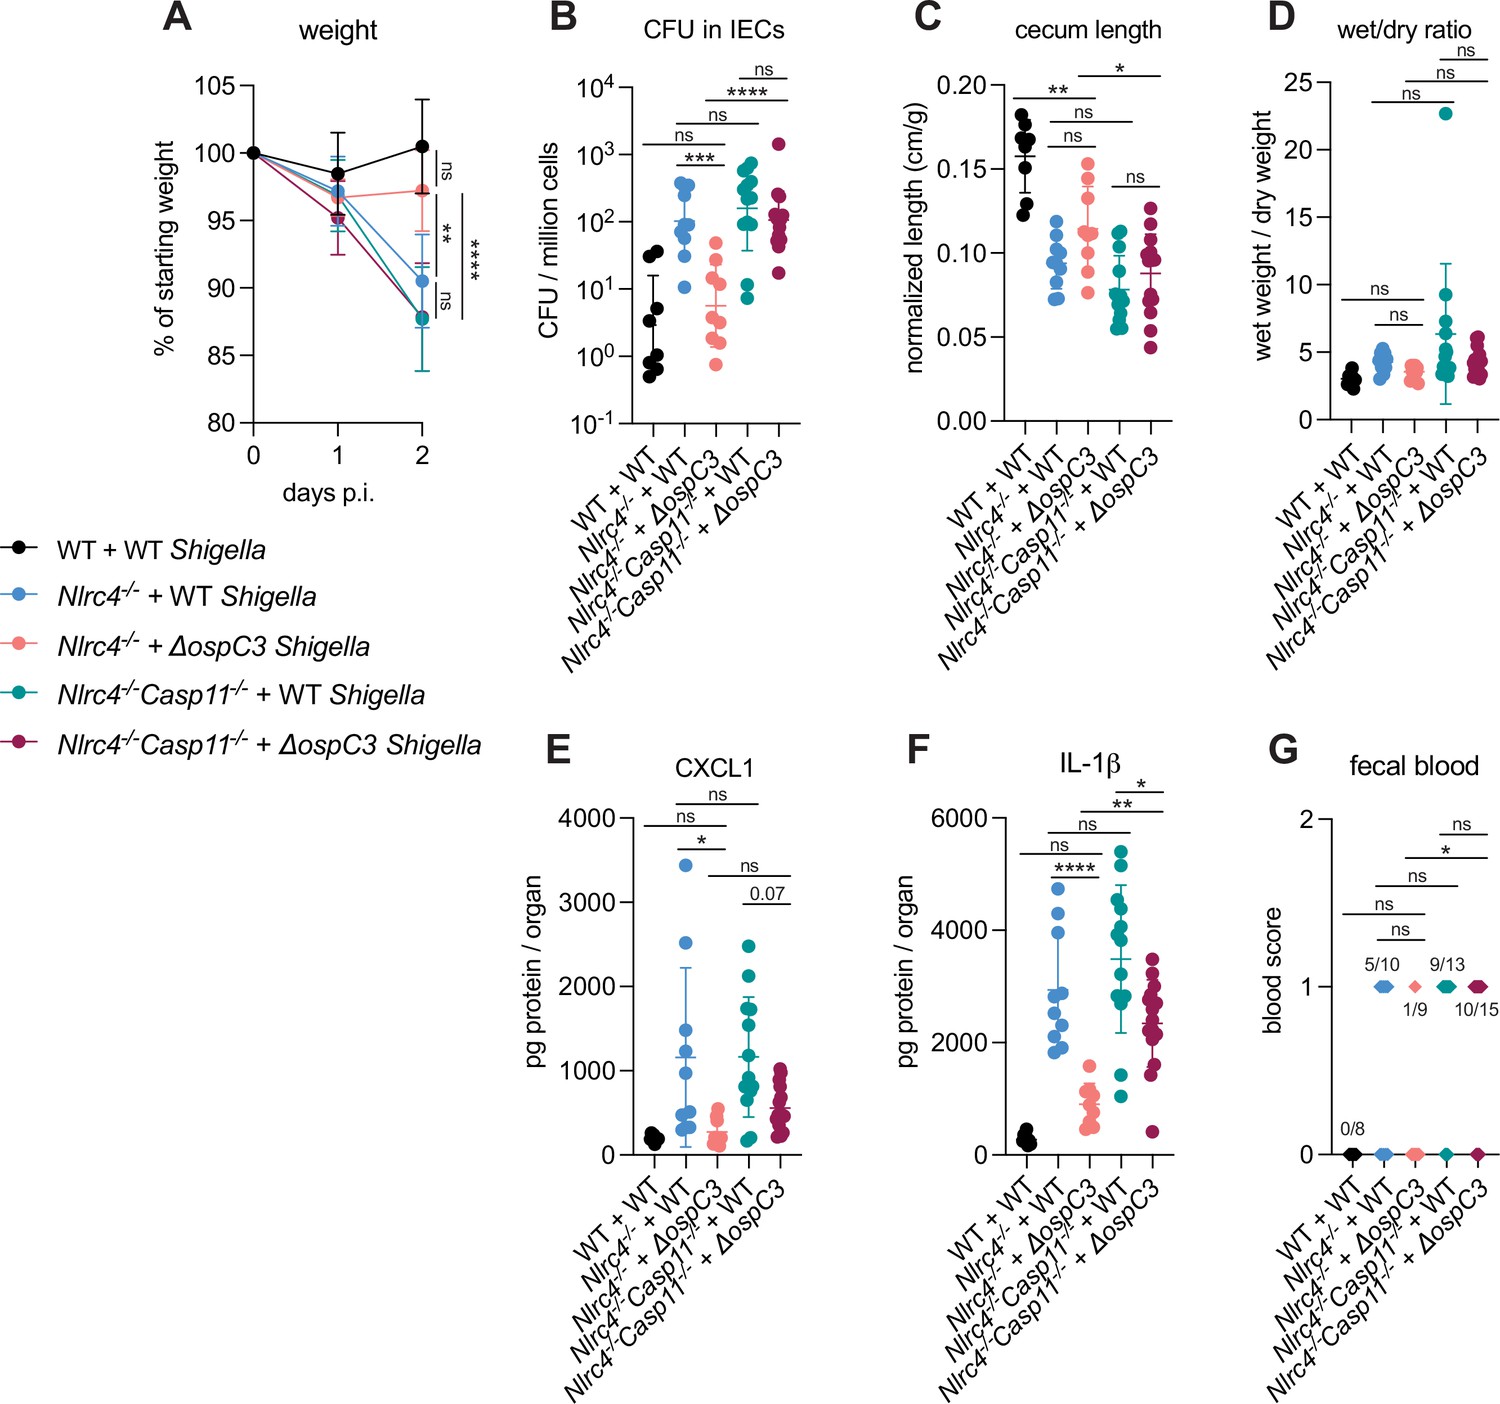
OspC3-driven virulence in B6.Nlrc4–/– mice depends on Caspase-11.
(A–G) Mice were treated orally with 25 mg streptomycin sulfate in water and then infected 1 day later. B6.WT mice were orally challenged with 107 colony forming units (CFUs) of wild-type (WT) Shigella flexneri (black, n=8), B6.Nlrc4–/– (co-housed B6.Nlrc4–/–Casp11+/+ and B6.Nlrc4–/–Casp11+/–) mice were challenged with WT (blue, n=10) or ΔospC3 S. flexneri (pink, n=9), and B6.Nlrc4–/–Casp11–/– mice (littermates with the B6.Nlrc4–/–Casp11+/–) were challenged with WT (teal, n=13) or ΔospC3 S. flexneri (maroon, n=15). Mice were littermates or were co-housed for 3 weeks prior to infection and were sacrificed at 2 days post-infection. (A) Mouse weights from 0 through 2 days post-infection. Each symbol represents the mean for all mice of the indicated group. (B) Shigella CFUs per million cells from the combined intestinal epithelial cell (IEC) enriched fraction of gentamicin-treated cecum and colon tissue. (C) Quantification of cecum lengths normalized to mouse weight prior to infection; cecum length (cm)/mouse weight (g). (D) The ratio of fecal pellet weight when wet (fresh) divided by the fecal pellet weight after overnight drying. Pellets were collected at day 2 post-infection. (E, F) CXCL1 and IL-1β levels measured by ELISA from homogenized cecum and colon tissue of infected mice. (G) Blood scores from feces collected at 2 days post-infection. 1=occult blood, 2=macroscopic blood. (B–G) Each symbol represents one mouse. Data collected from two independent experiments. Mean ± SD is shown in (A, C–F). Geometric mean ± SD is shown in (B). Statistical significance was calculated by one-way ANOVA with Tukey’s multiple comparison test (A (day 2), B–F) and by Fisher’s exact test in (G) where data were stratified by presence (score = 1 or 2) or absence (score = 0) of blood. Data were log-transformed prior to calculations in (B, D) to achieve normality. *p<0.05, **p<0.01, ***p<0.001, ****p<0.0001, ns = not significant (p>0.05).
Figure 5
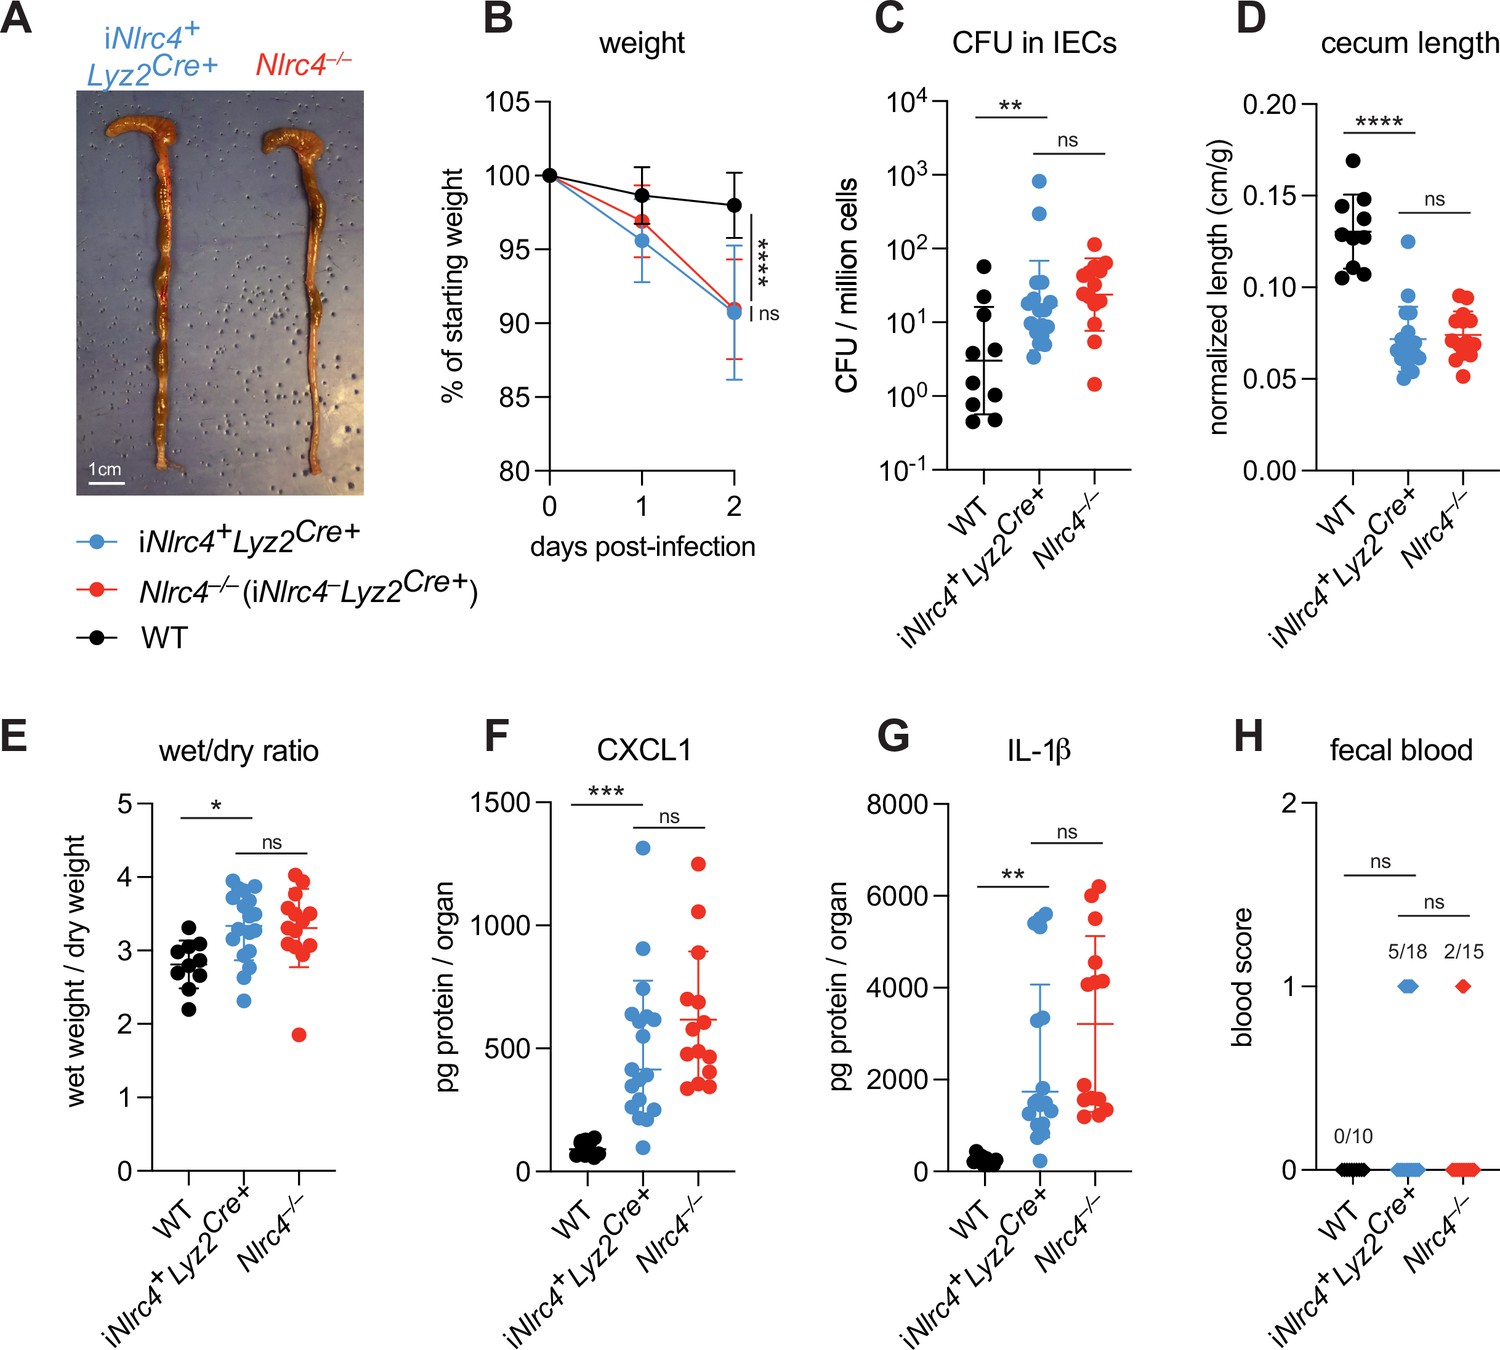
NLRC4 in myeloid-derived cells does not affect Shigella pathogenesis.
(A–H) B6.WT (black, n=10) mice were co-housed with B6.iNlrc4+Lyz2Cre+ (blue, n=18) and B6.Nlrc4–/– (iNlrc4–Lyz2Cre+, red, n=15) littermates, treated orally with 25 mg streptomycin sulfate in water, and orally challenged the next day with 107 colony forming units (CFUs) of wild-type (WT) Shigella flexneri. Mice were sacrificed at 2 days post-infection. (A) Representative images of the cecum and colon from iNlrc4+Lyz2Cre+ and B6.Nlrc4–/– mice. Note the similarity in gross pathology between the two genotypes. (B) Mouse weights from 0 through 2 days post-infection. Each symbol represents the mean for all mice of the indicated group. (C) Shigella CFUs per million cells from the combined intestinal epithelial cell (IEC) enriched fraction of gentamicin-treated cecum and colon tissue. (D) Quantification of cecum lengths normalized to mouse weight prior to infection; cecum length (cm)/mouse weight (g). (E) The ratio of fecal pellet weight when wet (fresh) divided by the fecal pellet weight after overnight drying. Pellets were collected at day 2 post-infection. (F, G) CXCL1 and IL-1β levels measured by ELISA from homogenized cecum and colon tissue of infected mice. (H) Blood scores from feces collected at 2 days post-infection. 1=occult blood, 2=macroscopic blood. (C–H) Each symbol represents one mouse. Data collected from two independent experiments. Mean ± SD is shown in (B, D–G). Geometric mean ± SD is shown in (C). Statistical significance was calculated by one-way ANOVA with Tukey’s multiple comparison test (B (day 2), C–G) and by Fisher’s exact test in (H) where data were stratified by presence (score = 1 or 2) or absence (score = 0) of blood. Data were log-transformed prior to calculations in (C) to achieve normality. *p<0.05, **p<0.01, ***p<0.001, ****p<0.0001, ns = not significant (p>0.05).
Figure 6
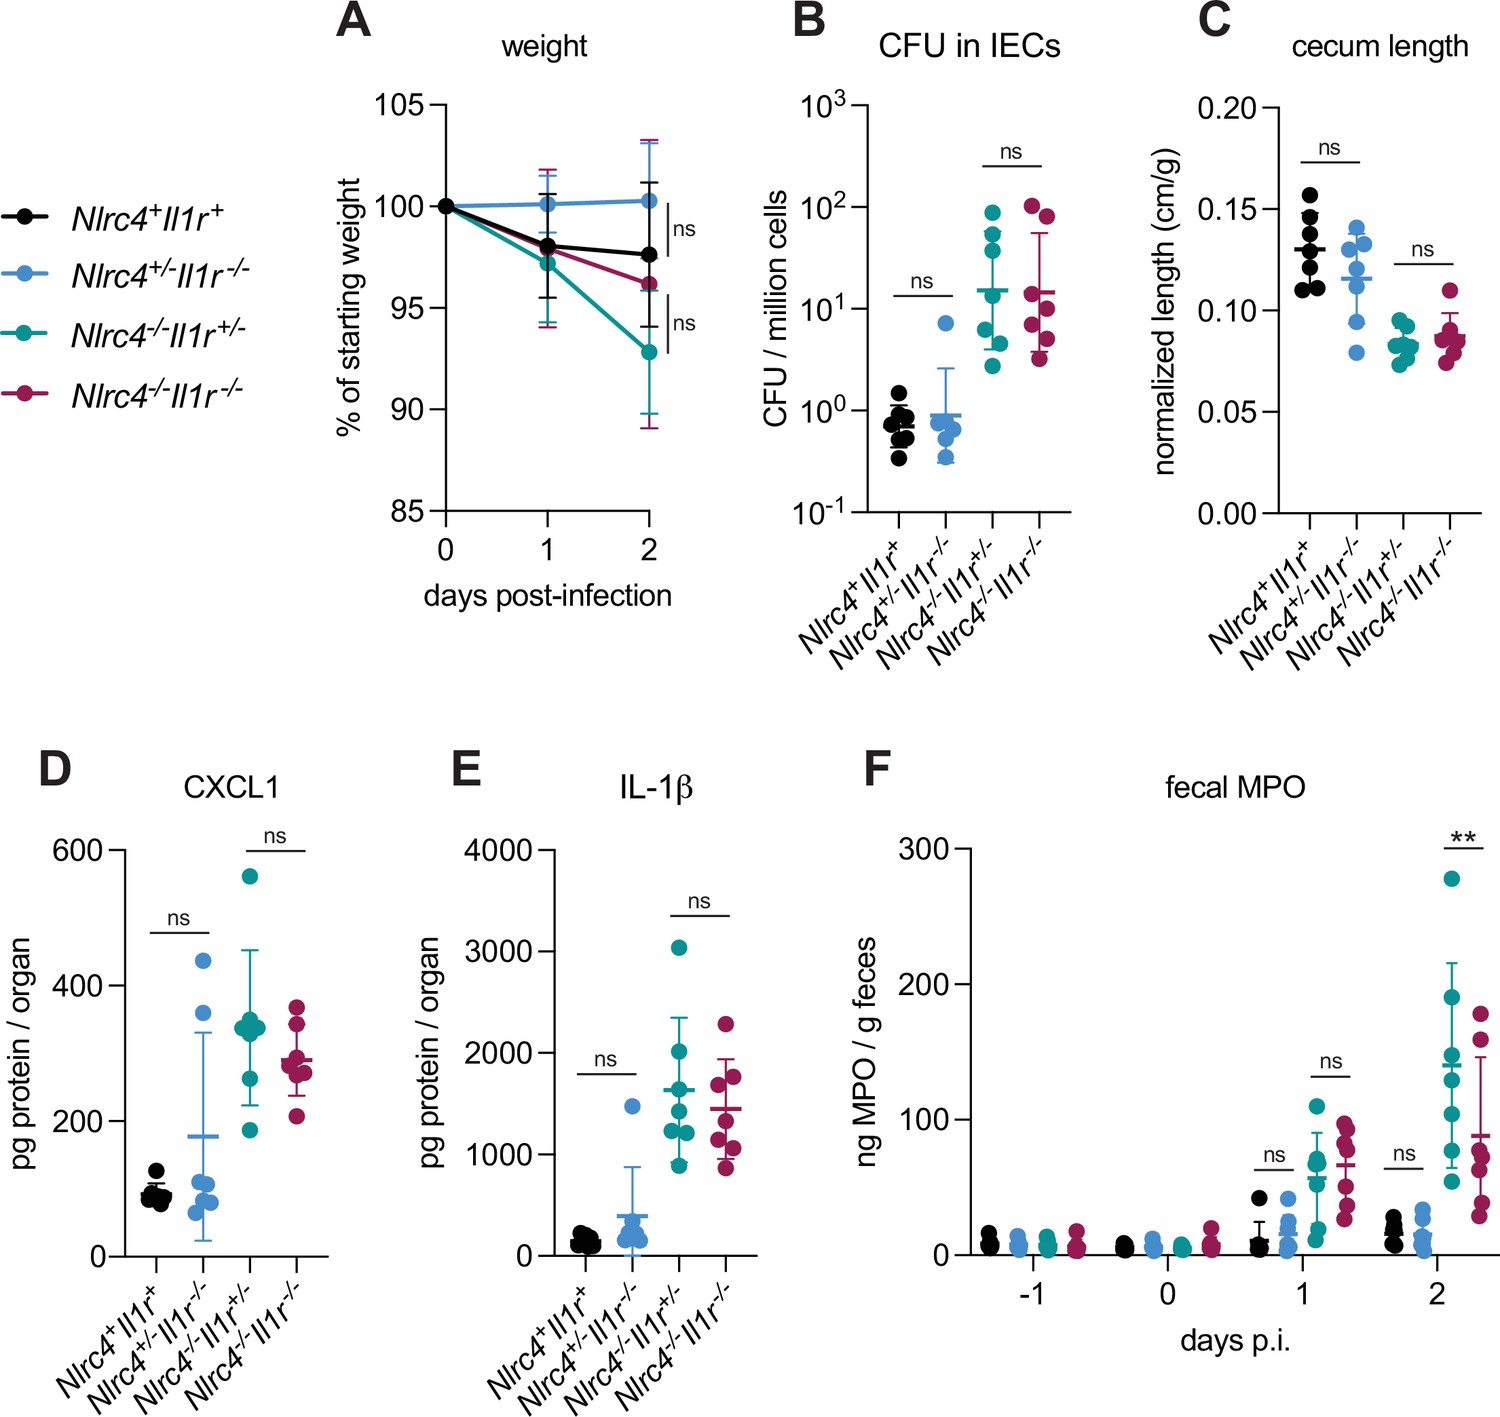
IL-1 signaling does not affect Shigella pathogenesis.
(A–F) Nlrc4+Il1r1+mice (co-housed B6.WT and Nlrc4+/–Il1r1+/–, black, n=7), Nlrc4+/–Il1r1–/– (blue, n=7), Nlrc4–/–Il1r1+/– (teal, n=7), and Nlrc4–/–Il1r1–/– (maroon, n=7) littermates were treated orally with 25 mg streptomycin sulfate in water and orally challenged the next day with 107 colony forming units (CFUs) of wild-type (WT) Shigella flexneri. Mice were sacrificed at 2 days post-infection. (A) Mouse weights from 0 through 2 days post-infection. Each symbol represents the mean for all mice of the indicated group. (B) Shigella CFUs per million cells from the combined intestinal epithelial cell (IEC) enriched fraction of gentamicin-treated cecum and colon tissue. (C) Quantification of cecum lengths normalized to mouse weight prior to infection; cecum length (cm)/mouse weight (g). (D, E) CXCL1 and IL-1β levels measured by ELISA from homogenized cecum and colon tissue of infected mice. (F) Myeloperoxidase enzyme levels in mouse feces collected each day prior to and during infection and measured by ELISA. (B–F) Each symbol represents one mouse. Data were collected from one experiment but are representative of two independent experiments. Mean ± SD is shown in (A, C–F). Geometric mean ± SD is shown in (B). Statistical significance was calculated by one-way ANOVA with Tukey’s multiple comparison test (A (day 2), B–E) and two-way ANOVA with Tukey’s multiple comparison test (F). Data were log-transformed prior to calculations in (B) to achieve normality. *p<0.05, **p<0.01, ***p<0.001, ****p<0.0001, ns = not significant (p>0.05).
Figure 7 with 1 supplement
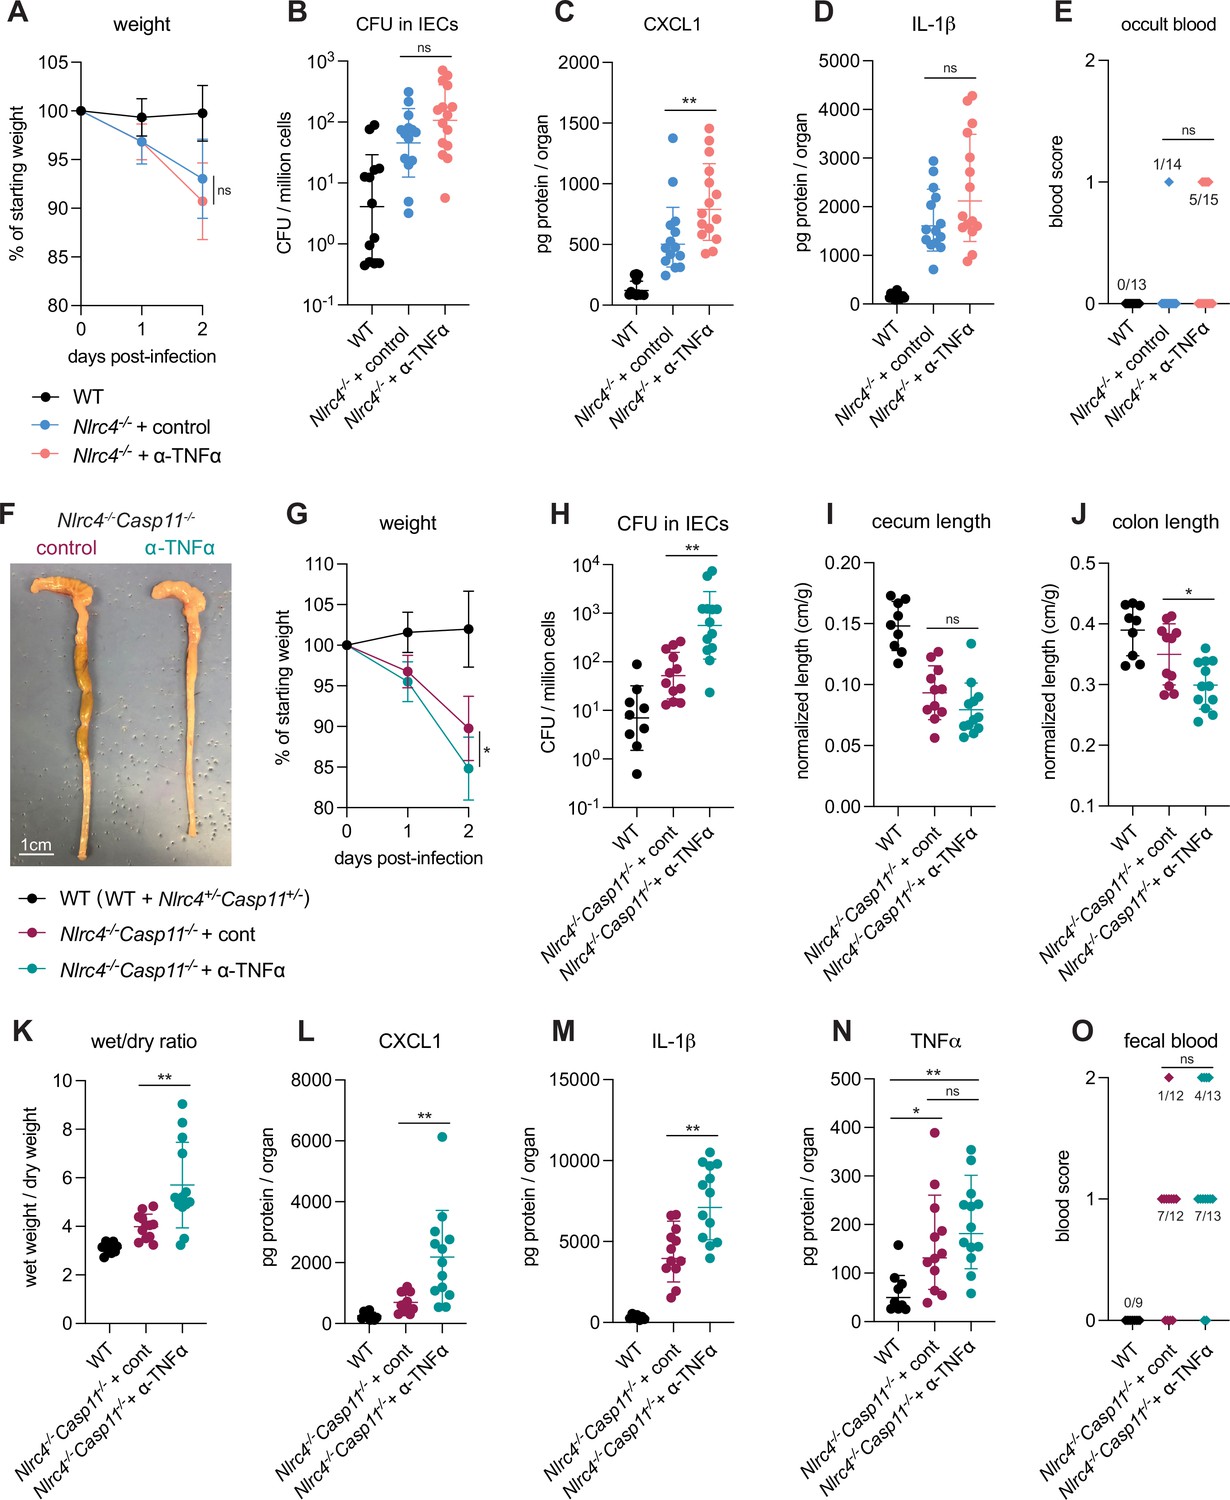
TNFα contributes to resistance to Shigella when mice lack NLRC4 and CASP11.
Wild-type (WT) (B6.WT, black, n=13 for (A–E), and both co-housed B6.WT and B6.Nlrc4+/–Casp11+/–, black, n=9 for (F–O)), B6.Nlrc4–/–, and B6.Nlrc4–/–Casp11–/– mice were treated orally with 25 mg streptomycin sulfate in water and orally challenged the next day with 107 colony forming units (CFUs) of WT Shigella flexneri. In (A–E), B6.Nlrc4–/– mice received 200 μg of either TNFα neutralizing antibody (pink, n=13) or isotype control antibody (light blue, n=14) by intraperitoneal injection daily from 1 day before infection through sacrifice at 2 days post-infection. In (F–O), B6.Nlrc4–/–Casp11–/– mice received 200 μg of either TNFα neutralizing antibody (teal, n=12) or isotype control antibody (maroon, n=13) by intraperitoneal injection daily from 1 day before infection through sacrifice at 2 days post-infection. (A, G) Mouse weights from 0 through 2 days post-infection. Each symbol represents the mean for all mice of the indicated group. (B, H) Shigella CFUs per million cells from the combined intestinal epithelial cell (IEC) enriched fraction of gentamicin-treated cecum and colon tissue. (C, D, L–N) CXCL1, IL-1β, and TNFα levels measured by ELISA from homogenized cecum and colon tissue of infected mice. (E, O) Blood scores from feces collected at 2 days post-infection. 1=occult blood, 2=macroscopic blood. (F) Representative images of the cecum and colon from B6.Nlrc4–/–Casp11–/– mice receiving either isotype control or TNFα neutralizing antibody. (I, J) Quantification of cecum and colon lengths normalized to mouse weight prior to infection; cecum or colon length (cm)/mouse weight (g). (K) The ratio of fecal pellet weight when wet (fresh) divided by the fecal pellet weight after overnight drying. Pellets were collected at day 2 post-infection. (B–E, H–O) Each symbol represents one mouse. Data collected from three independent experiments (A–E) and two independent experiments (F–O). Mean ± SD is shown in (A, C, D, G, I–N). Geometric mean ± SD is shown in (B, H). Statistical significance was calculated by Mann-Whitney test in (A (day 2), B–D, G (day 2), H–M), by one-way ANOVA with Tukey’s multiple comparison test in (N), and by Fisher’s exact test in (E, O) where data were stratified by presence (score = 1 or 2) or absence (score = 0) of blood. *p<0.05, **p<0.01, ***p<0.001, ****p<0.0001, ns = not significant (p>0.05).
Figure 7—figure supplement 1
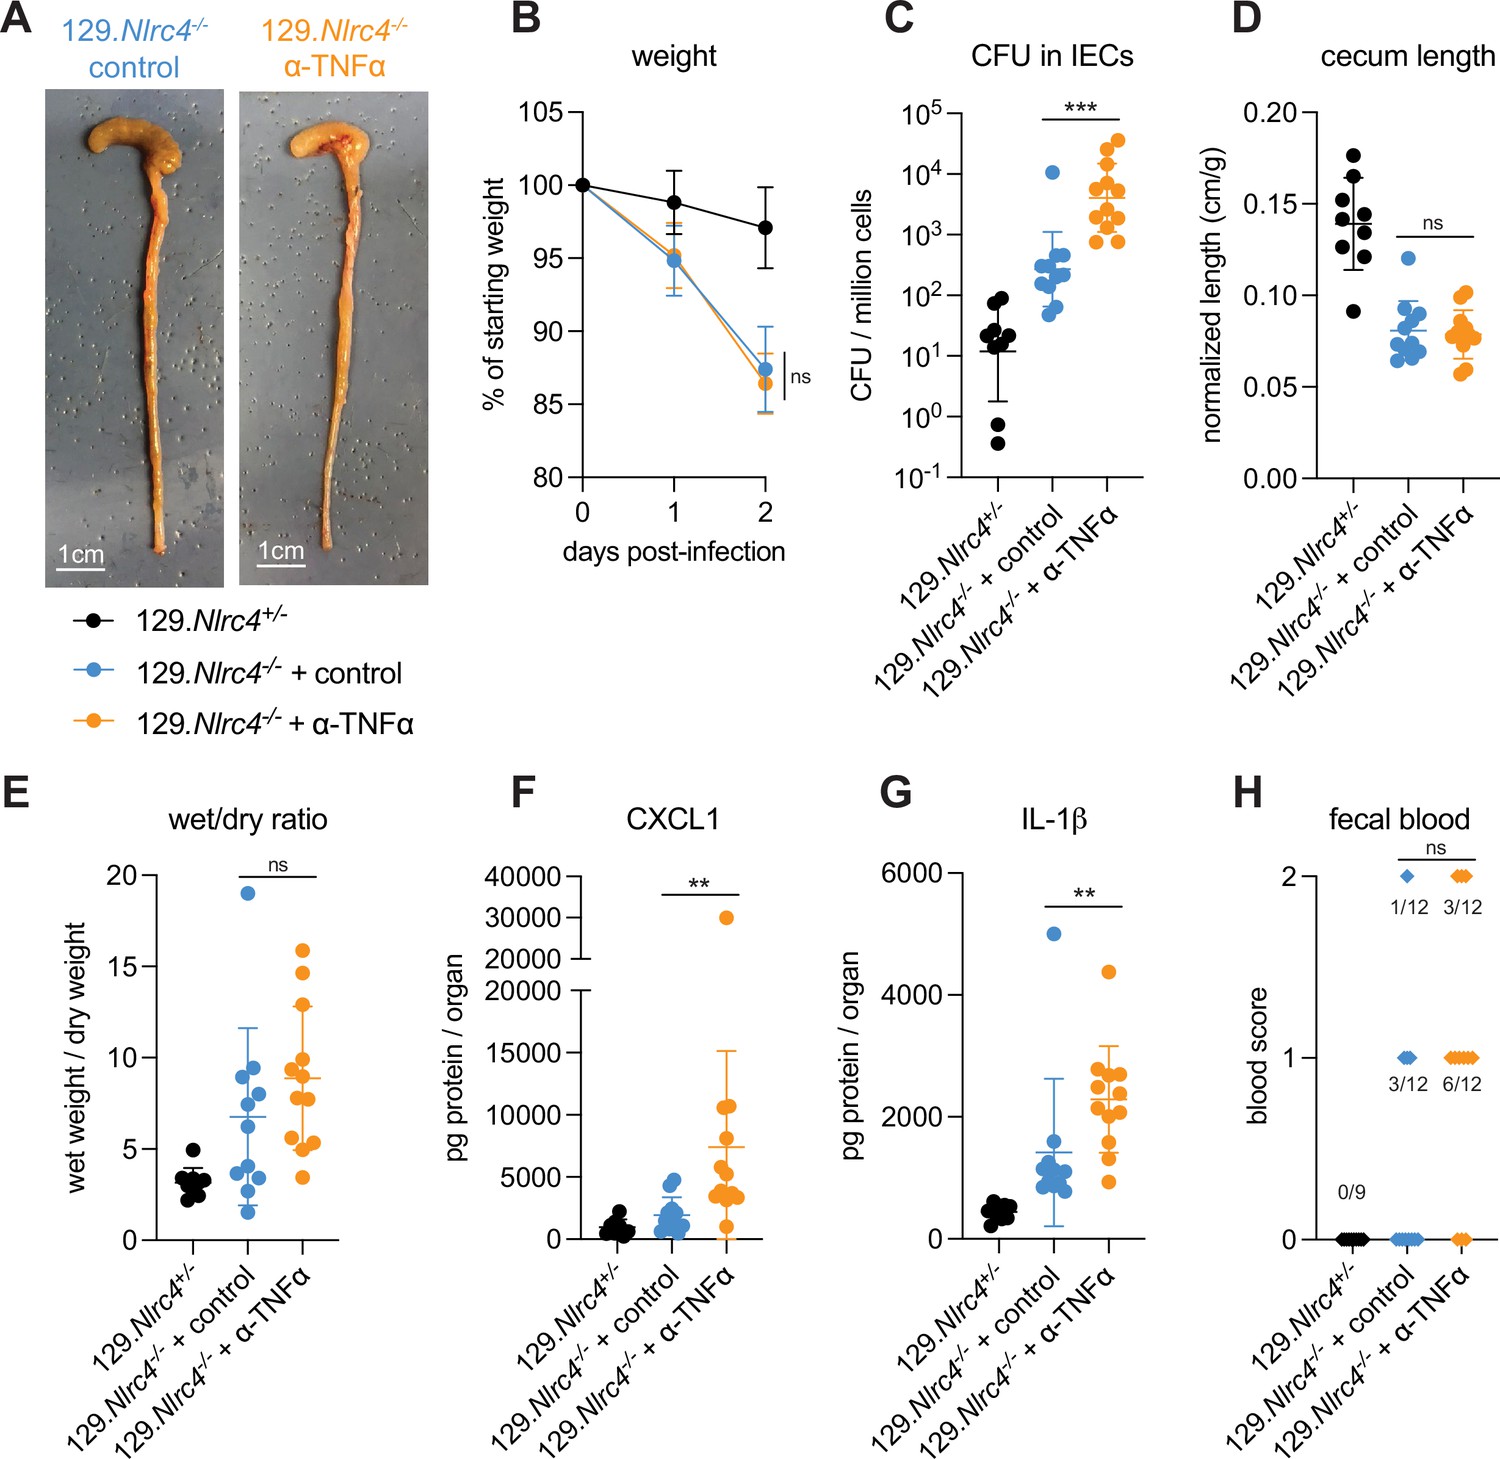
TNFα neutralization renders 129.Nlrc4–/– mice more susceptible to Shigella.
(A–H) 129.Nlrc4+/– (black, n=9) and 129.Nlrc4–/– mice were treated orally with 25 mg streptomycin sulfate in water and orally challenged the next day with 107 colony forming units (CFUs) of wild-type (WT) Shigella flexneri. 129.Nlrc4–/– mice also received 200 μg of either TNFα neutralizing antibody (orange, n=12) or isotype control antibody (blue, n=12) by intraperitoneal injection daily from 1 day before infection through sacrifice at 2 days post-infection. (A) Representative images of the cecum and colon from 129.Nlrc4–/– mice receiving either isotype control or TNFα neutralizing antibody. (B) Mouse weights from 0 through 2 days post-infection. Each symbol represents the mean for all mice of the indicated group. (C) Shigella CFUs per million cells from the combined intestinal epithelial cell (IEC) enriched fraction of gentamicin-treated cecum and colon tissue. (D) Quantification of cecum lengths normalized to mouse weight prior to infection; cecum length (cm)/mouse weight (g). (E) The ratio of fecal pellet weight when wet (fresh) divided by the fecal pellet weight after overnight drying. Pellets were collected at day 2 post-infection. (F, G) CXCL1 and IL-1β levels measured by ELISA from homogenized cecum and colon tissue of infected mice. (H) Blood scores from feces collected at 2 days post-infection. 1=occult blood, 2=macroscopic blood. (C–H) Each symbol represents one mouse. Data collected from two independent experiments. Mean ± SD is shown in (B, D–G). Geometric mean ± SD is shown in (C). Statistical significance was calculated by Mann-Whitney test in (B (day 2), C–G) and by Fisher’s exact test in (H) where data were stratified by presence (score = 1 or 2) or absence (score = 0) of blood. *p<0.05, **p<0.01, ***p<0.001, ****p<0.0001, ns = not significant (p>0.05).
Figure 8
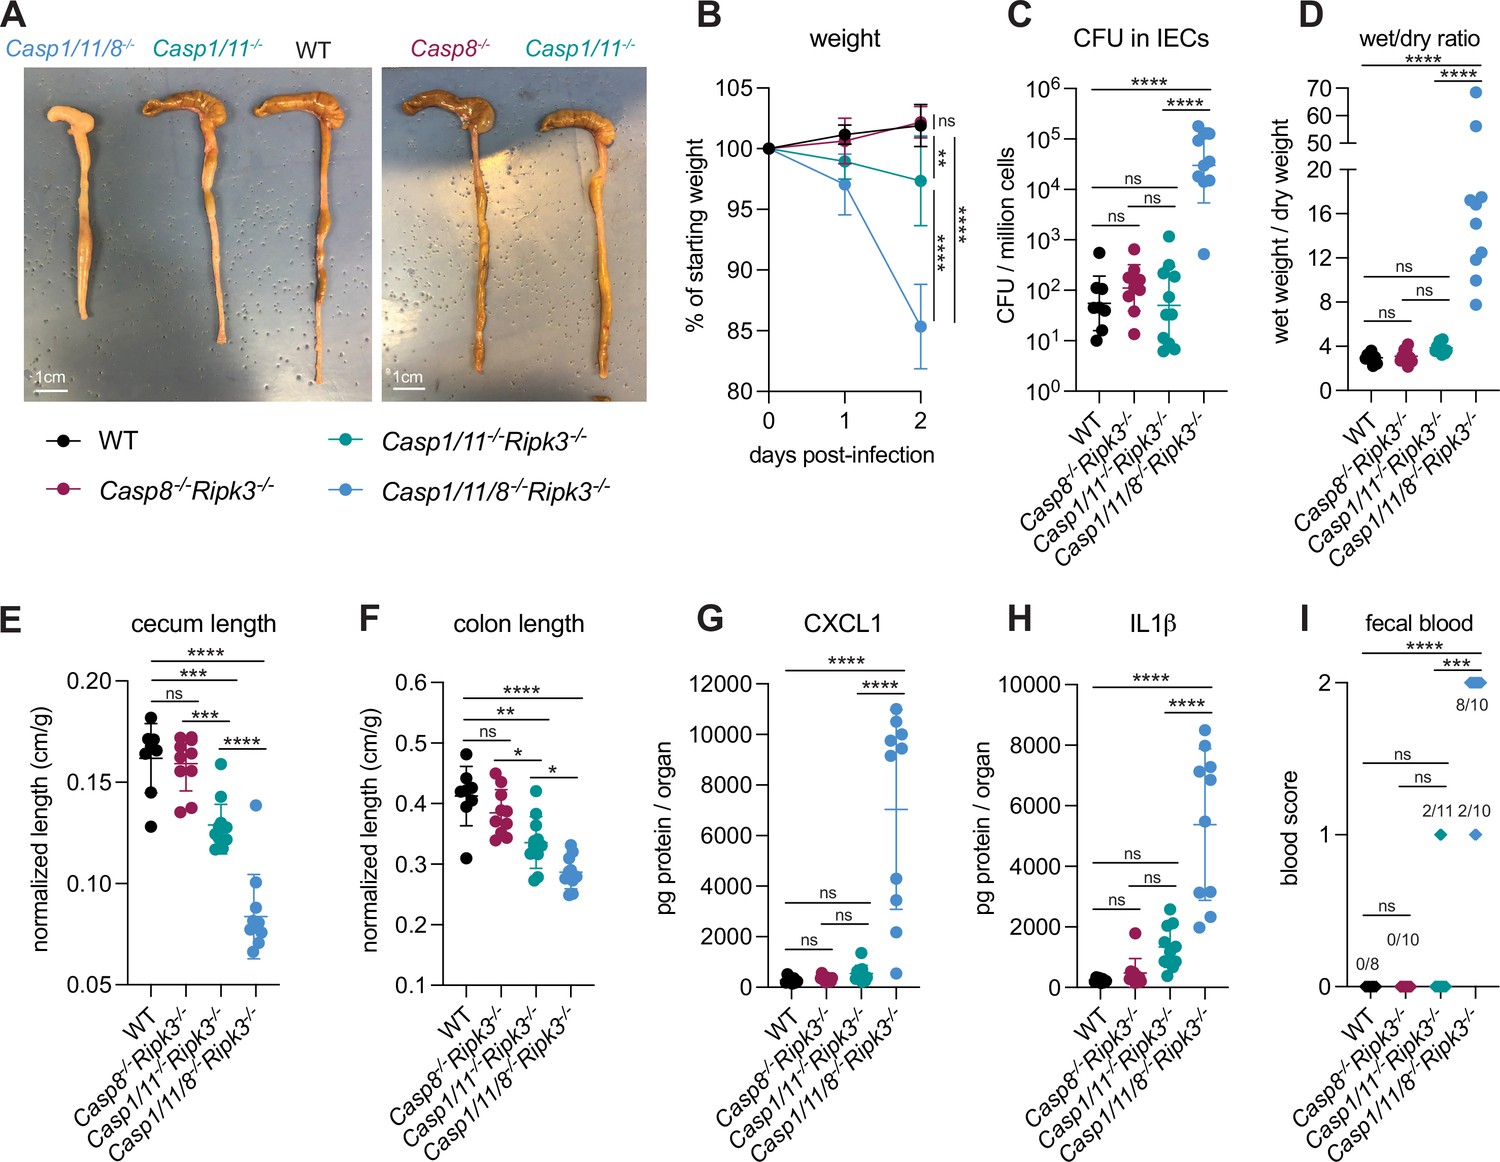
Loss of multiple cell death pathways renders mice hyper-susceptible to Shigella.
(A–I) B6.WT mice (black, n=8) were co-housed with B6.Casp8–/–Ripk3–/– (B6. Casp1/11+/–Casp8–/–Ripk3–/–, maroon, n=10), B6.Casp1/11–/–Ripk3–/– (B6.Casp1/11–/–Casp8+/–Ripk3, teal, n=11), and B6.Casp1/11/8–/–Ripk3–/– (light blue, n=10) littermates and treated orally with 25 mg streptomycin sulfate in water and orally challenged the next day with 107 colony forming units (CFUs) of wild-type (WT) Shigella flexneri. Mice were sacrificed at 2 days post-infection. (A) Representative images of the cecum and colon of infected B6.WT, B6.Casp8–/–Ripk3–/–, B6.Casp1/11–/–Ripk3–/–, and Casp1/11/8–/–Ripk3–/– mice. Note the severe inflammation in the Casp1/11/8–/–Ripk3–/– mice (left-most organs). (B) Mouse weights from 0 through 2 days post-infection. Each symbol represents the mean for all mice of the indicated group. (C) Shigella CFUs per million cells from the combined intestinal epithelial cell (IEC) enriched fraction of gentamicin-treated cecum and colon tissue. (D) The ratio of fecal pellet weight when wet (fresh) divided by the fecal pellet weight after overnight drying. Pellets were collected at day 2 post-infection. (E, F) Quantification of cecum and colon lengths normalized to mouse weight prior to infection; cecum or colon length (cm)/mouse weight (g). (G, H) CXCL1 and IL-1β levels measured by ELISA from homogenized cecum and colon tissue of infected mice. (I) Blood scores from feces collected at 2 days post-infection. 1=occult blood, 2=macroscopic blood. (C–I) Each symbol represents one mouse. Data collected from two independent experiments. Mean ± SD is shown in (B, D–H). Geometric mean ± SD is shown in (C). Statistical significance was calculated by one-way ANOVA with Tukey’s multiple comparison test (B (day 2), C–H) and by Fisher’s exact test in (I) where data were stratified by presence (score = 1 or 2) or absence (score = 0) of blood. Data were log-transformed prior to calculations in (C, D) to achieve normality. *p<0.05, **p<0.01, ***p<0.001, ****p<0.0001, ns = not significant (p>0.05).
Tables
Key resources table
| Reagent type (species) or resource | Designation | Source or reference | Identifiers | Additional information |
|---|---|---|---|---|
| Strain, strain background (Mus musculus, C57BL/6J) | WT | Jax and Vance Lab colony, Jax stock No. 000664 | ||
| Strain, strain background (Mus musculus, C57BL/6J) | Nlrc4–/– | Vance Lab colony Tenthorey et al., 2020 | Crossed to 129. Nlrc4–/– mice for mapping studies | |
| Strain, strain background (Mus musculus, C57BL/6J) | Casp11–/– | Vance Lab colony, this paper | ||
| Strain, strain background (Mus musculus, C57BL/6J) | Il1r1–/– | Jax and Vance Lab colony, Jax stock No. 003245 | ||
| Strain, strain background (Mus musculus, C57BL/6J) | Casp1/11/8–/– Ripk3–/– | Vance Lab colony Rauch et al., 2017 | ||
| Strain, strain background (Mus musculus, C57BL/6J and C57BL/6N mixed) | Rosa26LSL-Nlrc4 (formerly called iNlrc4) | Vance Lab colony Rauch et al., 2017 | Encode a Cre-inducible Nlrc4 gene in the Rosa26 locus | |
| Strain, strain background (Mus musculus, C57BL/6J) | Lyz2Cre | Jax and Vance Lab Colony, Jax stock No. 004781 | ||
| Strain, strain background (Mus musculus, 129S1/SvImJ) | WT | Jax and Vance Lab colony, Jax stock No. 002448 | ||
| Strain, strain background (Mus musculus, 129S1/SvImJ) | Nlrc4–/– | Vance Lab colony Mitchell et al., 2020 | Crossed to B6. Nlrc4–/– mice for mapping studies | |
| Strain, strain background (Shigella flexneri serovar 2a) | WT 2457T | Lesser Lab | Streptomycin resistant | |
| Strain, strain background (Shigella flexneri serovar 2a) | ΔospC3 2457T | Lesser Lab Mou et al., 2018 | Streptomycin resistant | |
| Antibody | Rat anti-mIL-1β capture and goat anti-mIL-1β polyclonal detection antibodies | R&D | DY401 | For ELISA (each used at 100 µL per well) |
| Antibody | Rat anti-mCXCL1 capture and rat anti-mCXCL1 detection antibodies | R&D | DY453 | For ELISA (each used at 100 µL per well) |
| Antibody | Goat anti-mMPO capture and goat anti-mMPO detection antibodies | R&D | DY3667 | For ELISA (each used at 100 µL per well) |
| Antibody | Monoclonal anti-TNFα capture and detection antibodies | Thermo Fisher | BMS607HS | For ELISA. Capture antibody is precoated on purchased plates, detection antibody used at 50 µL per well |
| Antibody | Hamster anti-TNFα monoclonal neutralizing antibody | Bio X cell | TN3-19.12 | In vivo treatments, 200 μg daily |
| Antibody | Polyclonal Armenian hamster IgG isotype control | Bio X cell | BE0091 | In vivo treatments,, 200 μg daily |
| Antibody | Rat anti-mCasp11 monoclonal antibody | Novus | 17D9 | 1:500 |
Additional files
Download links
A two-part list of links to download the article, or parts of the article, in various formats.
Downloads (link to download the article as PDF)
Open citations (links to open the citations from this article in various online reference manager services)
Cite this article (links to download the citations from this article in formats compatible with various reference manager tools)
A hierarchy of cell death pathways confers layered resistance to shigellosis in mice
eLife 12:e83639.
https://doi.org/10.7554/eLife.83639


