A Bayesian approach to single-particle electron cryo-tomography in RELION-4.0
- MRC Laboratory of Molecular Biology, United Kingdom
- Laboratory of Biomedical Imaging (LIB), Switzerland
- BioEM lab, Biozentrum, University of Basel, Switzerland
- ALBA Synchrotron, Spain
- Max Planck Institute of Biochemistry, Germany
- Sir William Dunn School of Pathology, University of Oxford, United Kingdom
- Institute of Structural and Molecular Biology, Birkbeck College, United Kingdom
- Instituto Biofisika, Spain
Figures
Figure 1 with 3 supplements
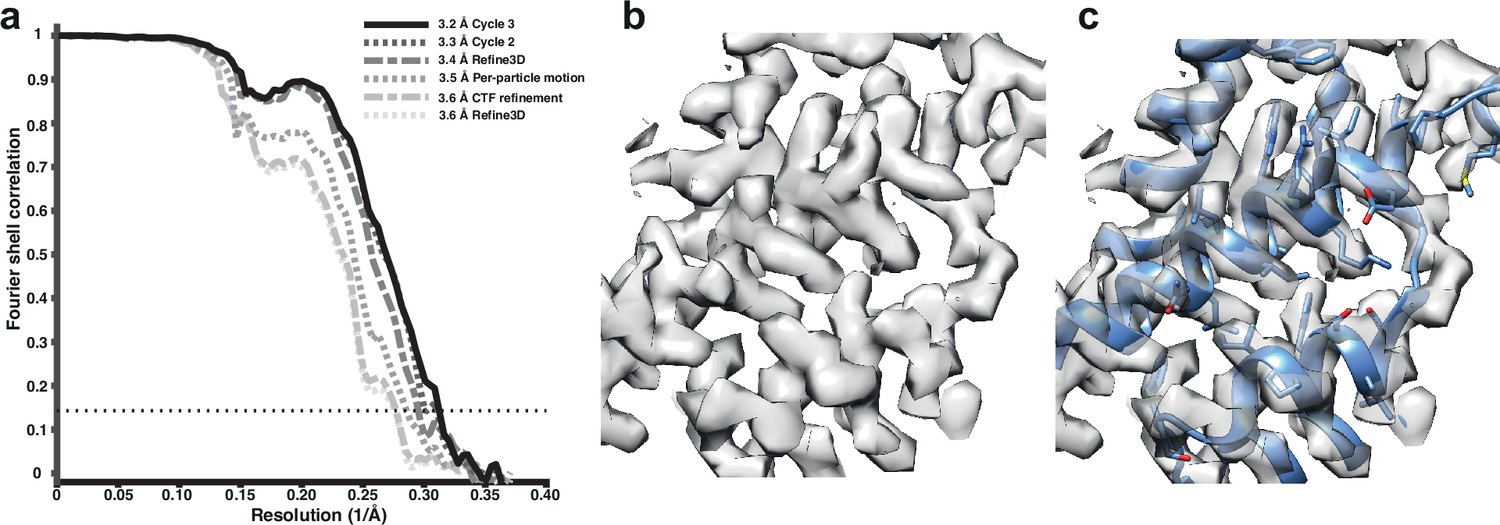
Subtomogram averaging of the HIV-1 immature capsid.
(a) Fourier Shell Correlation (FSC) for resolution estimation of iteratively improved reconstructions using the new RELION-4.0 workflow. (b) Representative region of reconstructed density in the final map. (c) The same density as in (b), together with the published atomic model 5L93, which has not been additionally refined in the density.
Figure 1—figure supplement 1
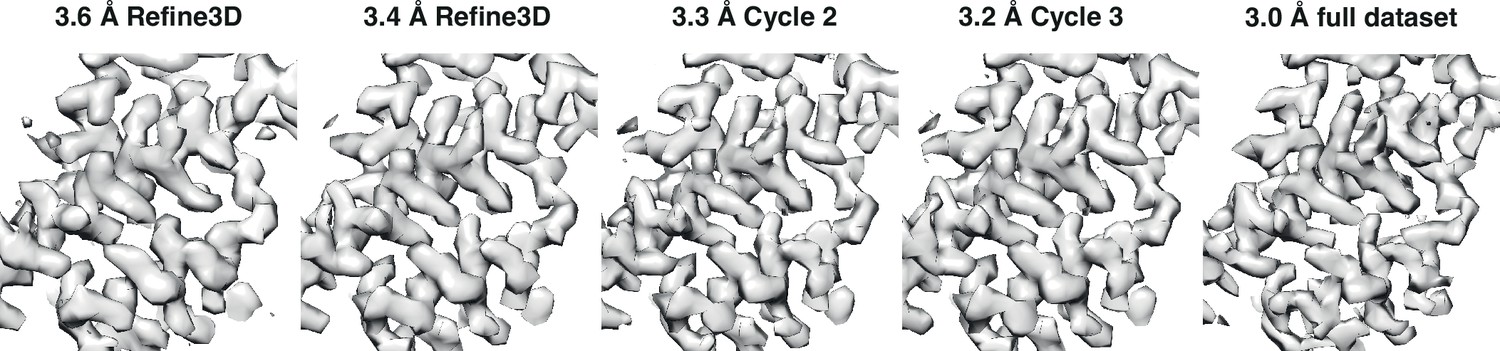
Iterative map improvement.
Representative region of reconstructed densities at several stages of the iterative refinement process. The four panels on the left show the four stages with the same labels as in Figure 1a; the fifth panel shows the same region from the final map that was calculated from all 43 tomograms.
Figure 1—figure supplement 2
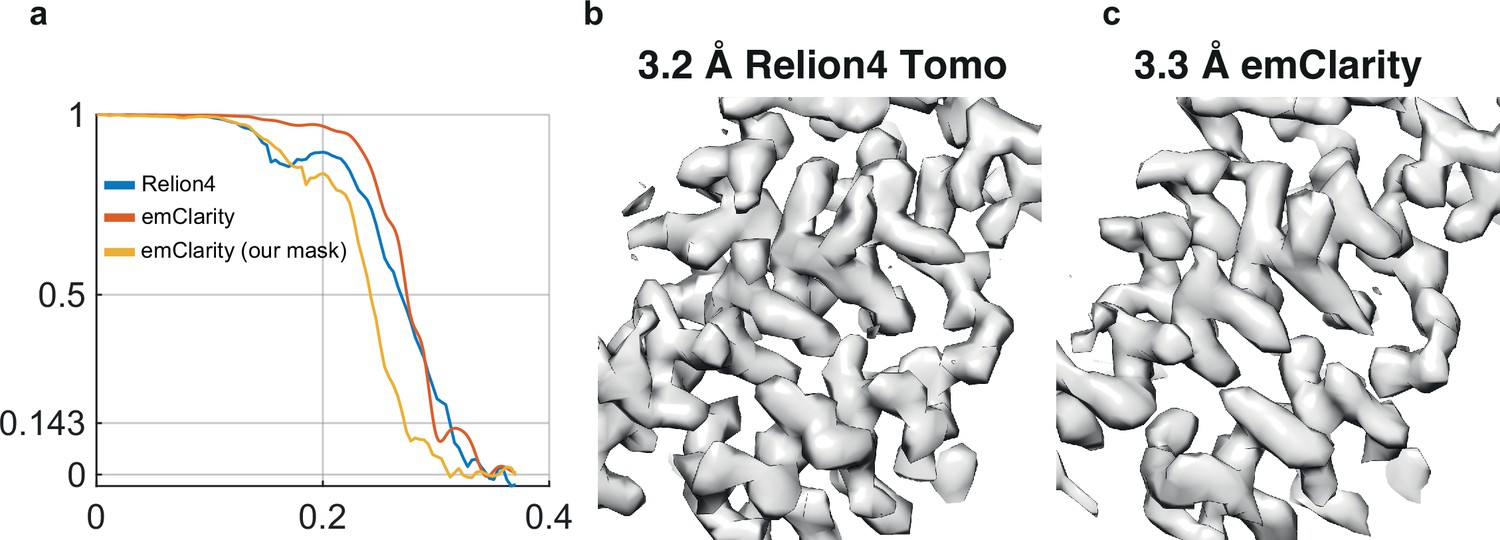
Comparison with emClarity.
(a) FSC for the RELION-4.0 map, which used 12,910 particles from the five tomogram subset (blue); the reported FSC for emClarity, which used 15,460 particles from the five tomogram subset (orange); and the FSC calculated from the deposited half-maps of emClarity, using the same mask as used for the RELION-4.0 FSC curve (yellow). (b) Representative region of the map calculated by RELION-4.0 from the five tomogram subset. (c) The same region of the map calculated by emClarity.
Figure 1—figure supplement 3
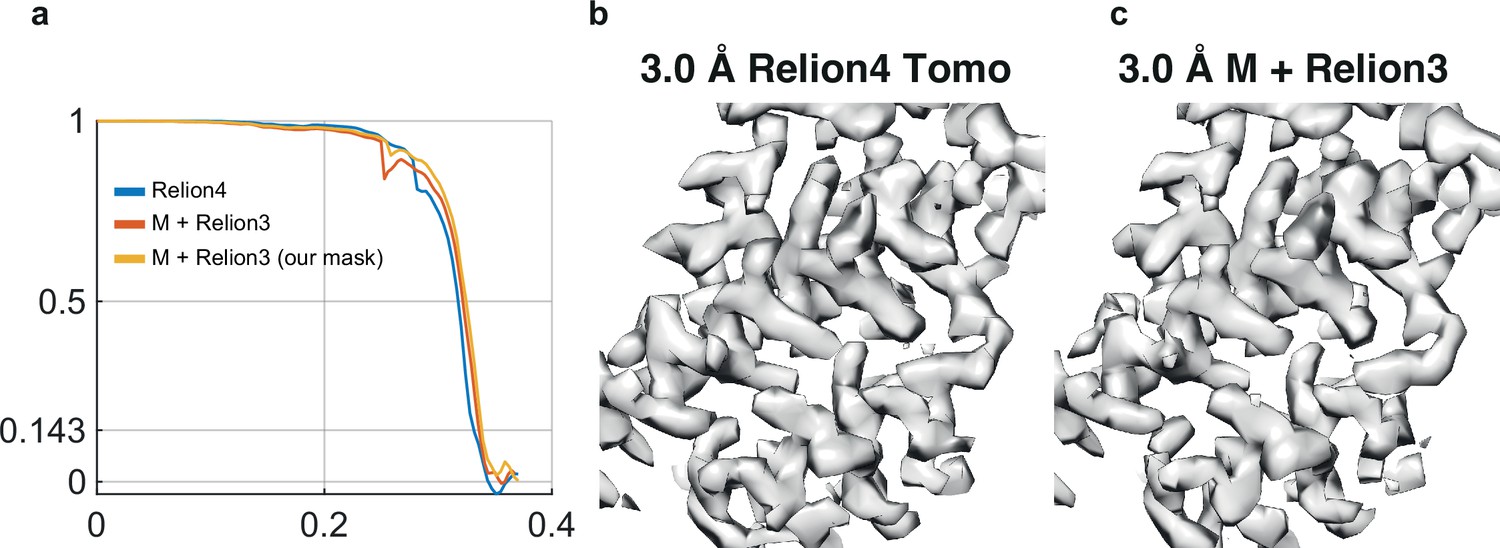
Comparison with M/RELION-3.1.
(a) FSC for the RELION-4.0 map, which used 144,275 particles from the full 43 tomogram data set (blue); the reported FSC for M/RELION-3.1, which used 130,658 particles from the full 43 tomogram data set (orange); and the FSC calculated from the deposited half-maps of M, using the same mask as used for the RELION-4.0 FSC curve (yellow). (b) Representative region of the map calculated by RELION-4.0 from the full 43 tomogram data set. (c) The same region of the map calculated by M/RELION-3.1.
Figure 2 with 1 supplement
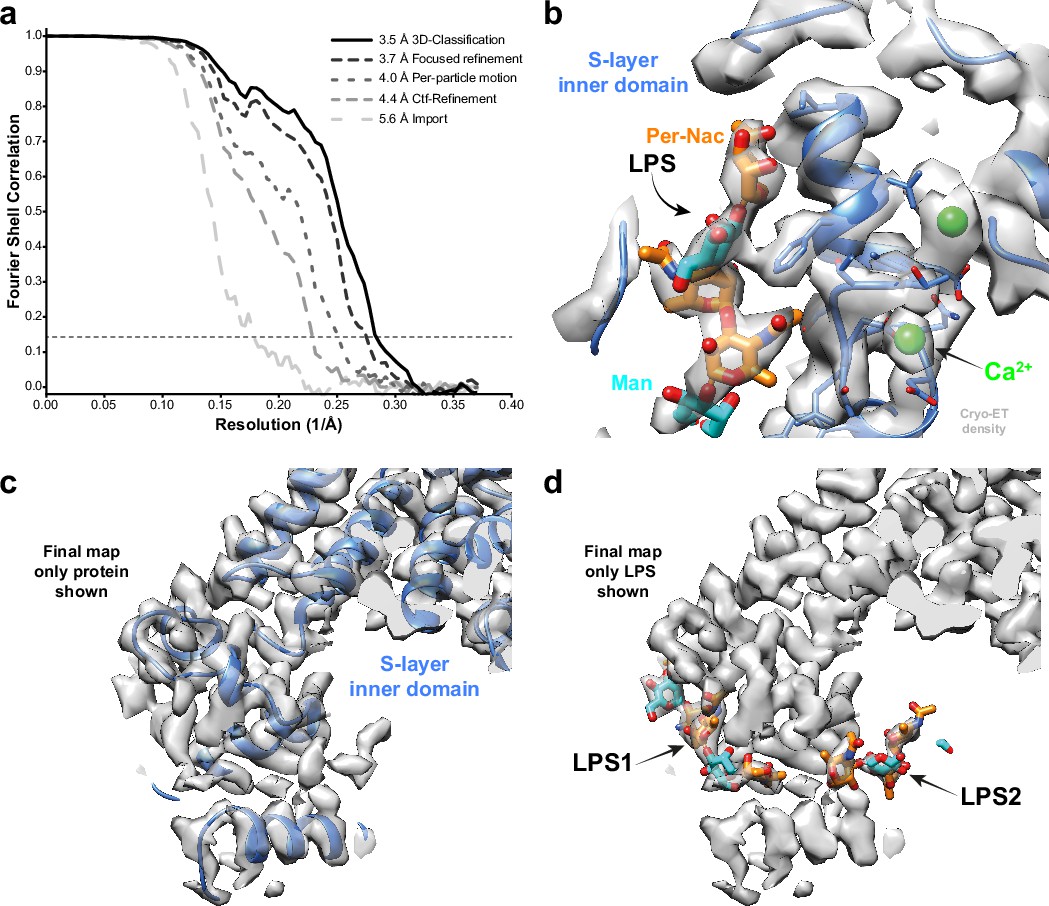
Subtomogram averaging of the C. crescentus S-layer from cell stalks.
(a) FSC for resolution estimation of iteratively improved reconstructions using the new RELION-4.0 workflow, tested on the S-layer inner domain. (b) Densities for the previously identified lipopolysaccharide (LPS) (cyan and orange) and Ca2+ ions (green) in prior electron cryo-microscopy (cryo-EM) single-particle analyses are resolved. (c, d) The final map shows two densities for bound LPS O-antigen chains. Panel (c) shows only the S-layer protein as blue ribbon and (d) shows LPS O-antigen as orange and cyan sugars corresponding to the N-acetyl-perosamine and mannose moieties, respectively.
Figure 2—figure supplement 1
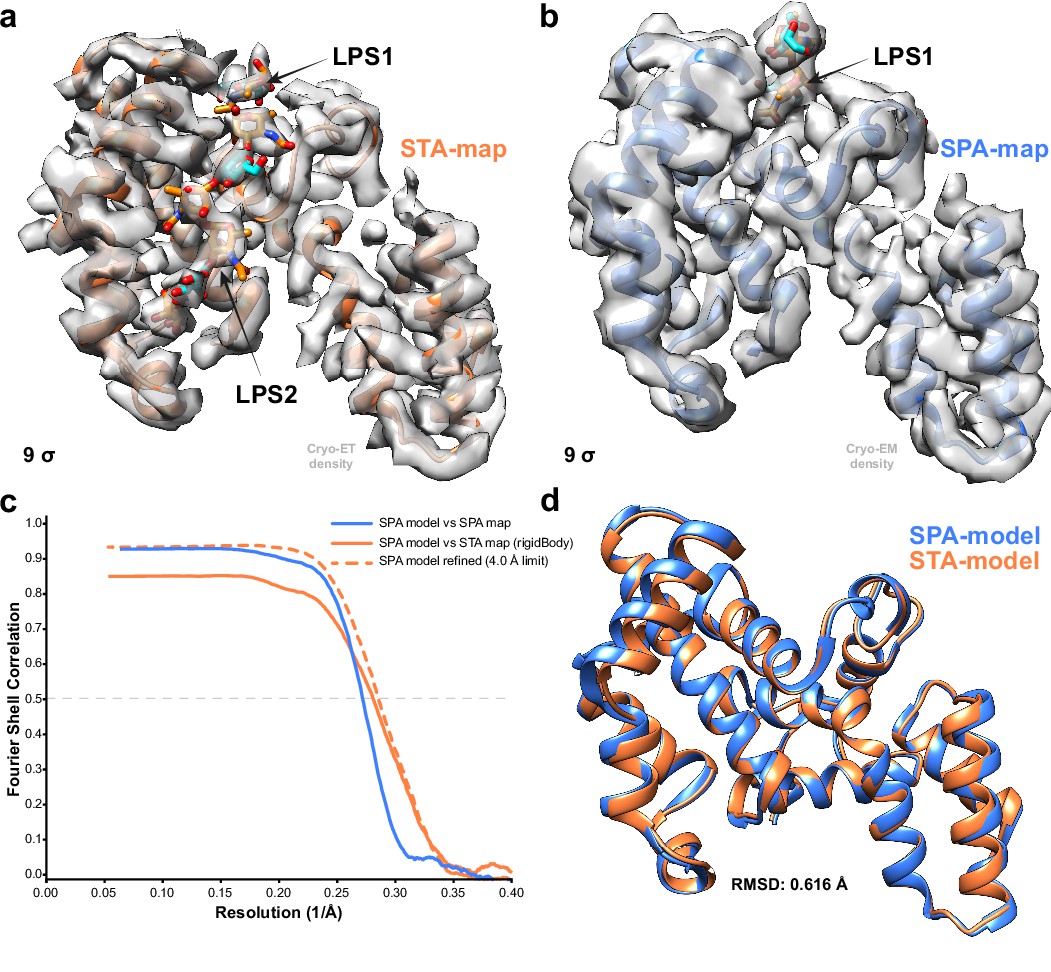
Comparison of subtomogram averaging (STA) and single-particle analysis (SPA) reconstructions of the C. crescentus RsaA.
(a) Bottom view of STA map of C. crescentus RsaA with lipopolysaccharide (LPS) O-antigen binding site as orange and cyan sugars corresponding to the N-acetyl-perosamine and mannose moieties, respectively, at a threshold of 9 σ. (b) Same view of the SPA map (EMD-10389) with no second LPS O-antigen. (c) FSC between the original refined model (PDB-ID: 6T72) and the SPA map (blue), as well as the same model after a rigid body fit (orange solid line) and refinement with a 4 Å resolution cut-off (orange dashed line) into the STA map. (d) Overlay of the refined model in the STA map (orange) and the original model (light blue, PDB-ID: 6T72) with an overall RMSD of 0.62 Å.
Figure 3
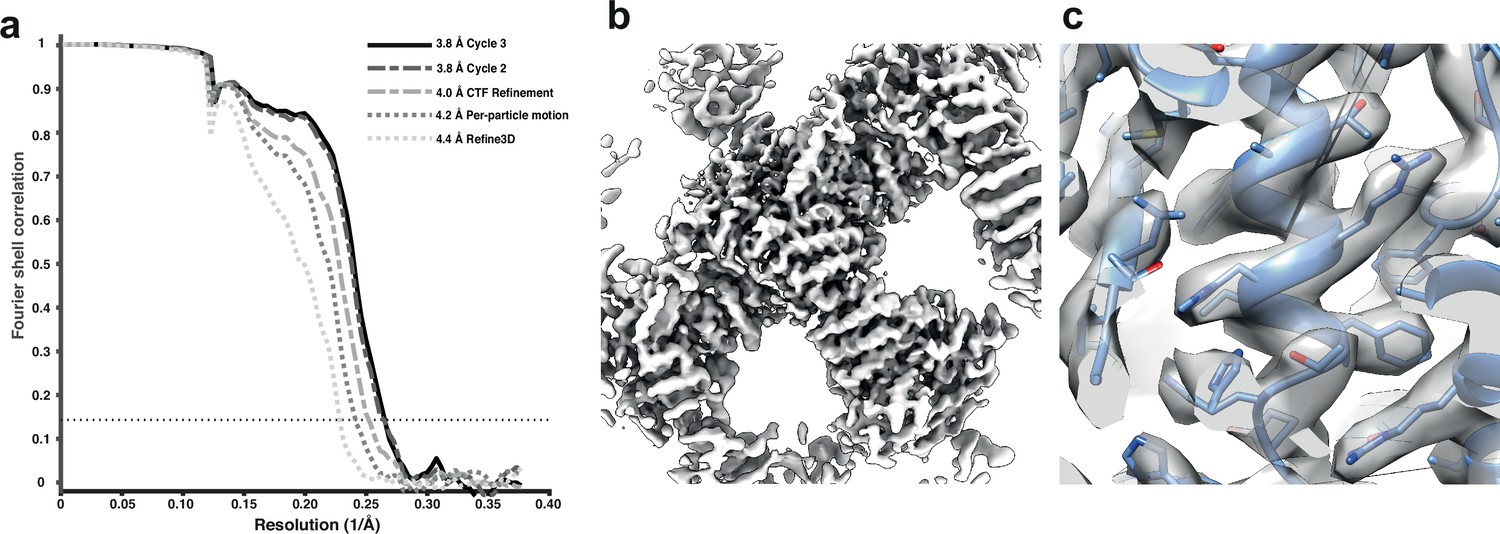
Subtomogram averaging of the COP-II inner layer.
(a) FSC for resolution estimation of iteratively improved reconstructions using the new RELION-4.0 workflow, tested on the COP-II inner layer. (b) Reconstructed density for the inner layer. (c) Zoomed-in region of the final map (in transparent grey) with the refined atomic model (blue).
Tables
Appendix 2—table 1
Electron cryo-tomography (Cryo-ET) data collection, refinement, and validation statistics.
| HIV-1 Gag(EMD-16207 /EMD-16209) | S-layer_inner_domain(EMD-16183)(PDB 8BQE) | COPII inner coat(EMD-15949)(PDB 8BSH) | |
|---|---|---|---|
| Data collection | |||
| Microscope | Titan Krios | Titan Krios | Titan Krios |
| Detector | K2 (Gatan) | K2 (Gatan) | K2 (Gatan) |
| Software | SerialEM (Mastronarde, 2003) | SerialEM (Mastronarde, 2003) | SerialEM (Mastronarde, 2003) |
| Voltage (kV) | 300 | 300 | 300 |
| Slit width (eV) | 20 | 20 | 20 |
| Defocus range ( μm) | –1.5 to –5.0 | –1.5 to –5.0 | –1.5 to –4.5 |
| Pixel size (Å) | 1.35 | 1.35 | 1.33 |
| Total exposure () | 120–145 | ∼140 | ∼120 |
| Exposure per tilt ( ) | 3.0–3.5 | 3.4 | 2.9 |
| Total number of tilts | 41 | 41 | 41 |
| Frames per tilt-movie | 8–10 | 10 | 10 |
| Tilt increment | |||
| Tilt-series scheme | Dose-symmetrical | Dose-symmetrical | Dose-symmetrical |
| Tilt range | |||
| Tilt-series (no.) | 5/43 | 110 | 137 |
| Data processing | |||
| Software tilt-series alignment | IMOD (Kremer et al., 1996) | IMOD (Kremer et al., 1996) | Dynamo (Castaño-Díez et al., 2012) |
| Software CTF estimation | CTFPLOTTER (Xiong et al., 2009) | CTFFIND4 (Rohou and Grigorieff, 2015) | CTFFIND4 (Rohou and Grigorieff, 2015) |
| Particle images (no.) | 12,910/144,275 | 42,990 | 106,533 |
| Pre-cropped box-size (pix) | 512 | 600 | 512 |
| Final box-size (pix) | 192 | 180 | 196 |
| Pixel size final rec. (Å) | 1.35 | 1.35 | 1.33 |
| Symmetry imposed | C6 | C6 | C1 |
| Map resolution (Å) | 3.2/3.0 | 3.5 | 3.8 |
| FSC threshold | 0.143 | 0.143 | 0.143 |
| Map resolution range (Å) | 3.2–4.3/3.0–3.5 | 3.5–4.8 | 3.8–7.2 |
| Map sharpening B factor (Å 2) | –85 / –95 | –75 | –106 |
| Model refinement | |||
| Initial model used (PDB code) | 6T72 | 6GNI | |
| Software | PHENIX (Afonine et al., 2018) | Isolde (Croll, 2018) and PHENIX (Afonine et al., 2018) | |
| Model resolution (Å) | 3.6 | 4.0 | |
| FSC threshold | 0.5 | 0.5 | |
| Model composition | |||
| Non-hydrogen atoms (no.) | 11,274 | 13,635 | |
| Protein residues (no.) | 1452 | 1729 | |
| R.m.s. deviations | |||
| Bond lengths (Å) | 0.001 | 0.004 | |
| Bond angles (°) | 0.322 | 0.858 | |
| Validation | |||
| MolProbity score | 1.13 | 2.01 | |
| Clashscore | 3.42 | 14.71 | |
| Poor rotamers (%) | 0 | 0.66 | |
| C outliers (%) | 0 | 0.00 | |
| CABLAM outliers (%) | 0.84 | 2.33 | |
| Ramachandran plot | |||
| Favoured (%) | 98.8 | 95.1 | |
| Allowed (%) | 1.2 | 4.8 | |
| Disallowed (%) | 0 | 0.1 |
Appendix 2—table 2
Computational costs and hardware specifics.
| HIV-1 Gag | S-layer inner domain | COPII inner coat | |
|---|---|---|---|
| Tilt-series (no.) | 5/43 | 110 | 137 |
| Final particle images (no.) | 12,910/144,275 | 42,990 | 106,533 |
| Pre-cropped box-size (pix) | 512 | 600 | 512 |
| Final box-size (pix) | 192 | 180 | 196 |
| Computational costs | |||
| Pseudo-subtomogram | |||
| Compute time | 21 min/40 min | 34 min | 67 min |
| Number of CPU nodes | 1/1 | 1 | 1 |
| Disk space | 343 GB/3.8 TB | 777 GB | 3.1 TB |
| Refine3D | |||
| Compute time | 18 hr*/33 hr | 14 hr | 57 hr |
| Number of GPU nodes | 1/1 | 1 | 1 |
| Ctf refinement | |||
| Compute time | 15 min*/35 min | 2 hr | 2 hr |
| Number of CPU nodes | 1/1 | 1 | 1 |
| Disk space | 32 MB/247 MB | 621 MB | 673 MB |
| Frame alignment | |||
| Compute time | 2 hr*/12 hr | 2 hr | 6 hr |
| Number of CPU nodes | 1/1 | 1 | 1 |
| Disk space | 383 MB/4.1 GB | 1.9 GB | 2.2 GB |
| Hardware specifics | |||
| CPU nodes | |||
| CPU model | 2x Intel Xeon E5-2698 v4 | 2x Intel Xeon 6258R | 1x AMD EPYC 7H12 |
| CPU memory | 512 GB | 754 GB | 256 GB |
| GPU nodes | |||
| CPU model | 2x Intel Xeon Silver 4116 | 2x Intel Xeon E5-2667 v4 | 1x AMD EPYC 7H12 |
| CPU memory | 384 GB | 256 GB | 256 GB |
| GPU model | 2x Nvidia Quadro RTX 5000 | 4x Nvidia GeForce GTX 1080 Ti | 4x Nvidia RTX A6000 |
-
*
These calculations were performed using the same hardware as for the S-layer inner domain.
Additional files
Download links
A two-part list of links to download the article, or parts of the article, in various formats.
Downloads (link to download the article as PDF)
Open citations (links to open the citations from this article in various online reference manager services)
Cite this article (links to download the citations from this article in formats compatible with various reference manager tools)
A Bayesian approach to single-particle electron cryo-tomography in RELION-4.0
eLife 11:e83724.
https://doi.org/10.7554/eLife.83724


