Spatiotemporal tissue maturation of thalamocortical pathways in the human fetal brain
- Centre for the Developing Brain, School of Biomedical Engineering and Imaging Sciences, King’s College London, United Kingdom
- Centre for Neurodevelopmental Disorders, King’s College London, United Kingdom
- Biomedical Image Technologies, ETSI Telecomunicación, Universidad Politécnica de Madrid, Spain
- Biomedical Research Networking Center in Bioengineering, Biomaterials and Nanomedicine (CIBER-BBN), Spain
- Department of Electrical Engineering (ESAT/PSI), Katholieke Universiteit Leuven, Belgium
- Department of Biomedical Engineering, School Biomedical Engineering and Imaging Sciences, King’s College London, St. Thomas' Hospital, United Kingdom
- Department of Forensic and Neurodevelopmental Sciences, King’s College London, United Kingdom
- Department of Neuroimaging, Institute of Psychiatry, Psychology and Neuroscience, King’s College London, United Kingdom
- Children’s Neurosciences, Evelina London Children’s Hospital, Guy’s and St Thomas’ NHS Foundation Trust, United Kingdom
- Department of Bioengineering, Imperial College London, United Kingdom
Figures
Figure 1
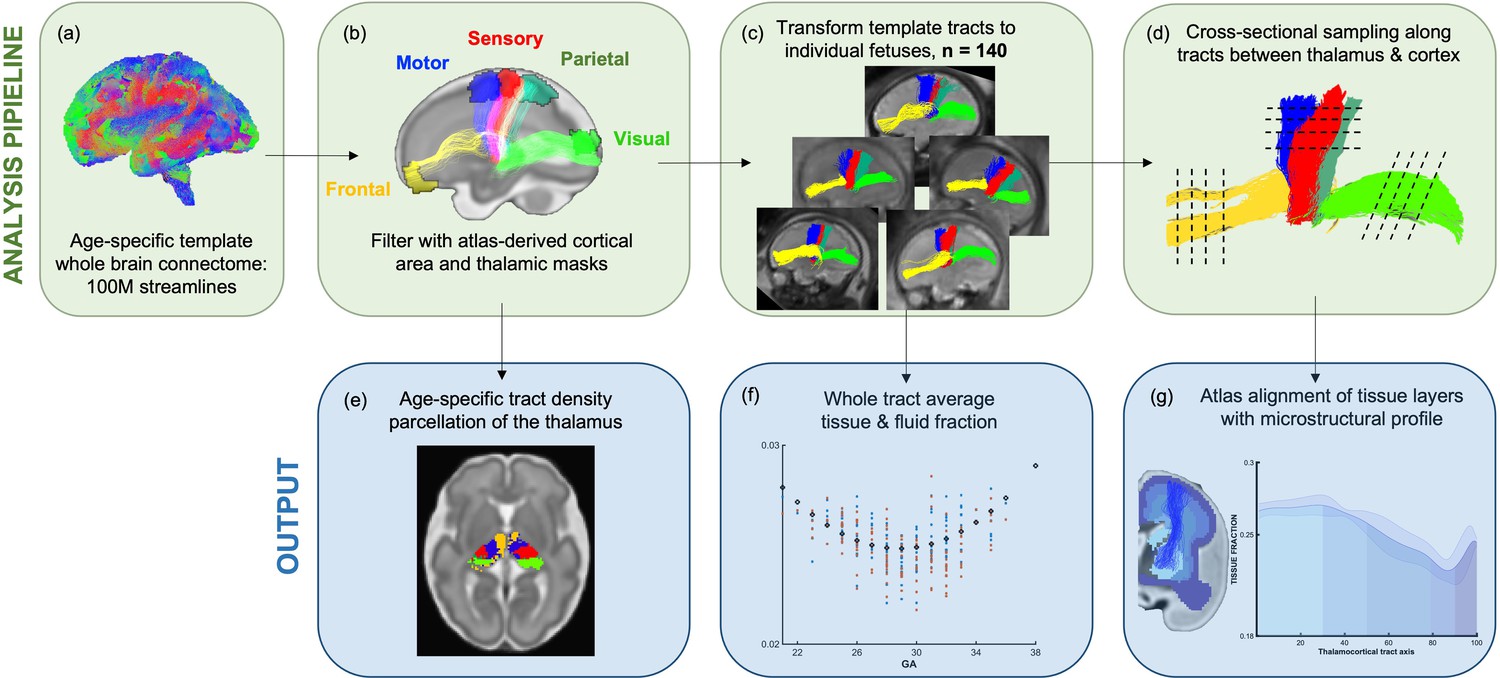
Methods pipeline to estimate and quantify thalamocortical tracts development.
(Top row) (a) Whole-brain connectomes generated for each gestational week template. (b) Atlas-defined masks of the thalamus and cortical areas were used to extract white matter pathways of interest from the connectomes. (c) These pathways were transformed to the native fetal diffusion space, (d) the values were sampled along the tract. (f) Whole-tract average diffusion metrics were calculated or (g) values sampled along the tract were aligned to an atlas of transient fetal compartments.
Figure 2
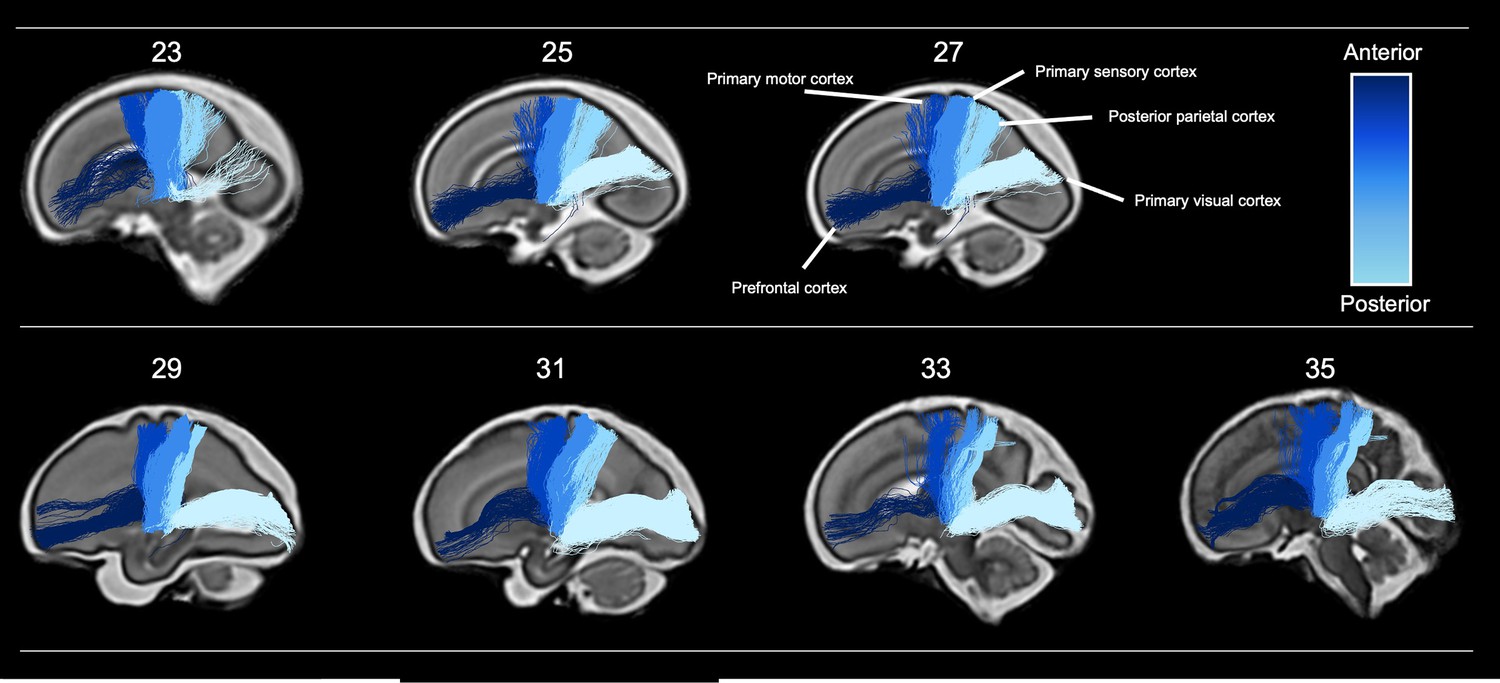
Tractography of thalamocortical pathways in different gestational week templates across the second to third trimester.
Tracts project to five different cortical areas, the prefrontal cortex, primary motor cortex, primary sensory cortex, posterior parietal cortex, and primary visual cortex, coloured according to the anterior-posterior axis.
Figure 3
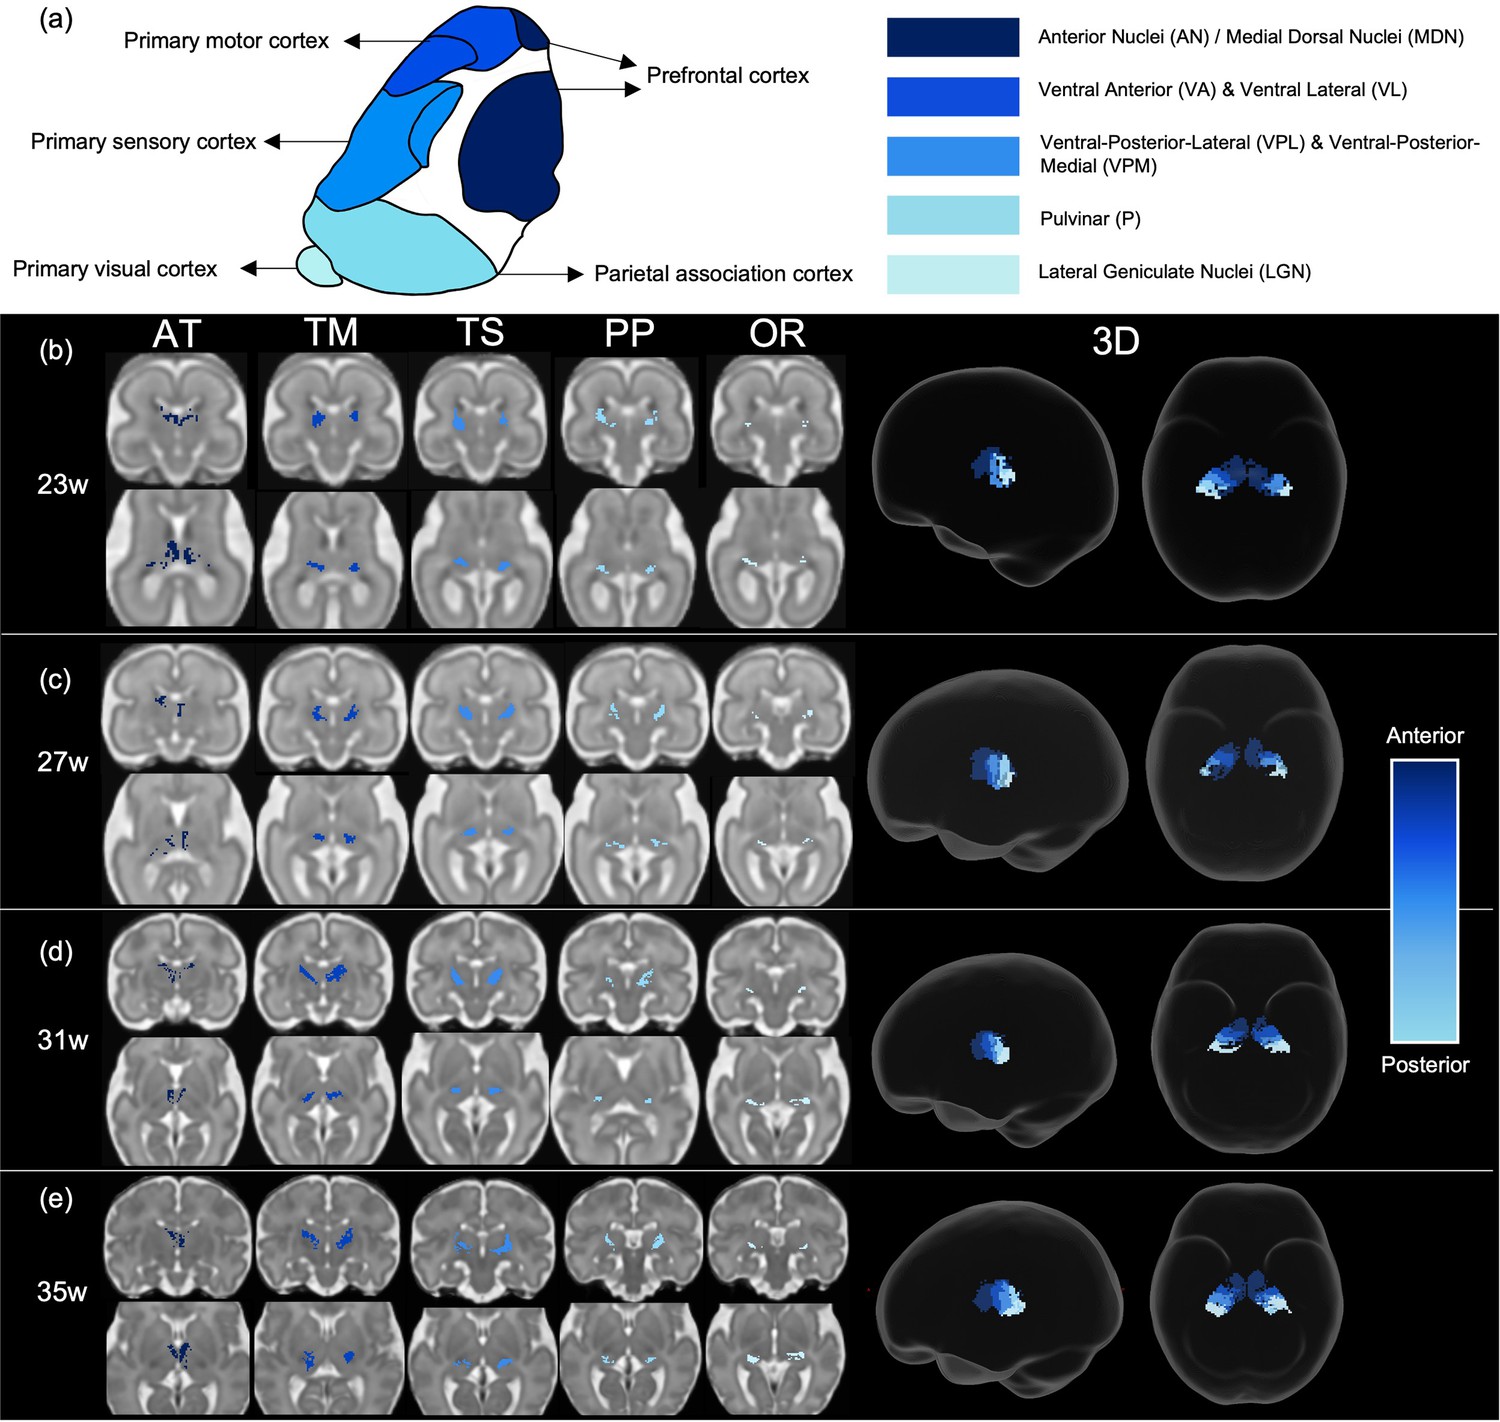
Tract density imaging parcellation of thalamus at different fetal ages.
(a) A schematic of expected cortical connectivity arrangement across the thalamus, based on Morel’s parcellation of the adult thalamic nuclei. (b) Axial slices of thalamic parcellation, thresholded for the top 20% of voxels, colour-coded according to streamline connectivity of different tracts at 23 weeks, (c) 27 weeks, (d) 31 weeks, and (e) 35 weeks.
Figure 4 with 1 supplement
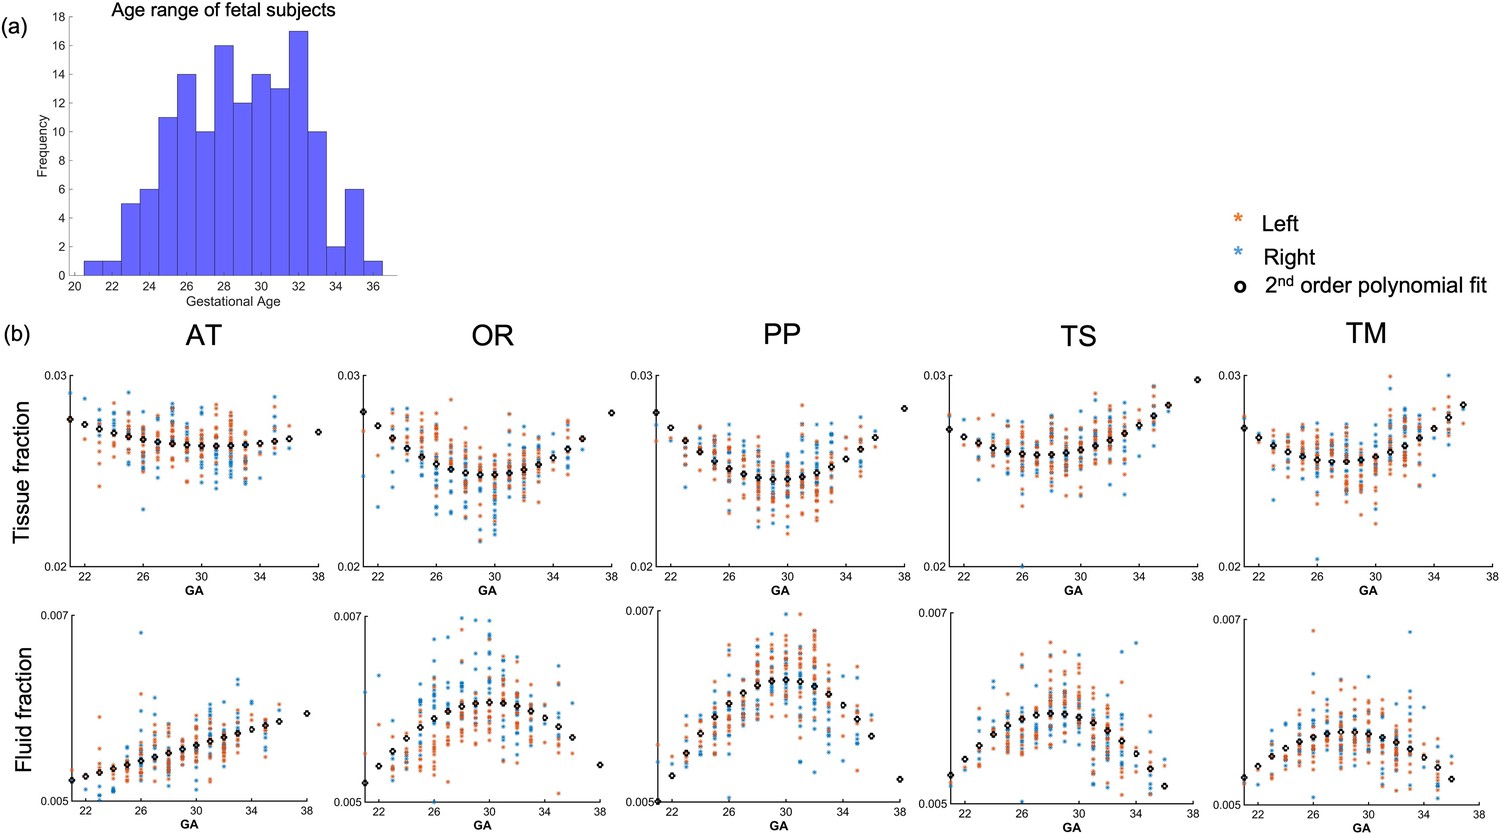
Diffusion metric age trajectories for each tract.
(a) Distribution of age among the fetal cohort (n=140) in gestational weeks. (b) Whole-tract average tissue (top) and fluid fractions (bottom) for each subject in the left (orange) and right (blue) hemisphere, plotted against gestational age (GA) of the subject, best fit by second-order polynomials (AT = anterior thalamic radiation, OR = optic radiation, PP = posterior parietal tract, TS = thalamic-sensory tract, TM = thalamic-motor tract).
Figure 4—figure supplement 1
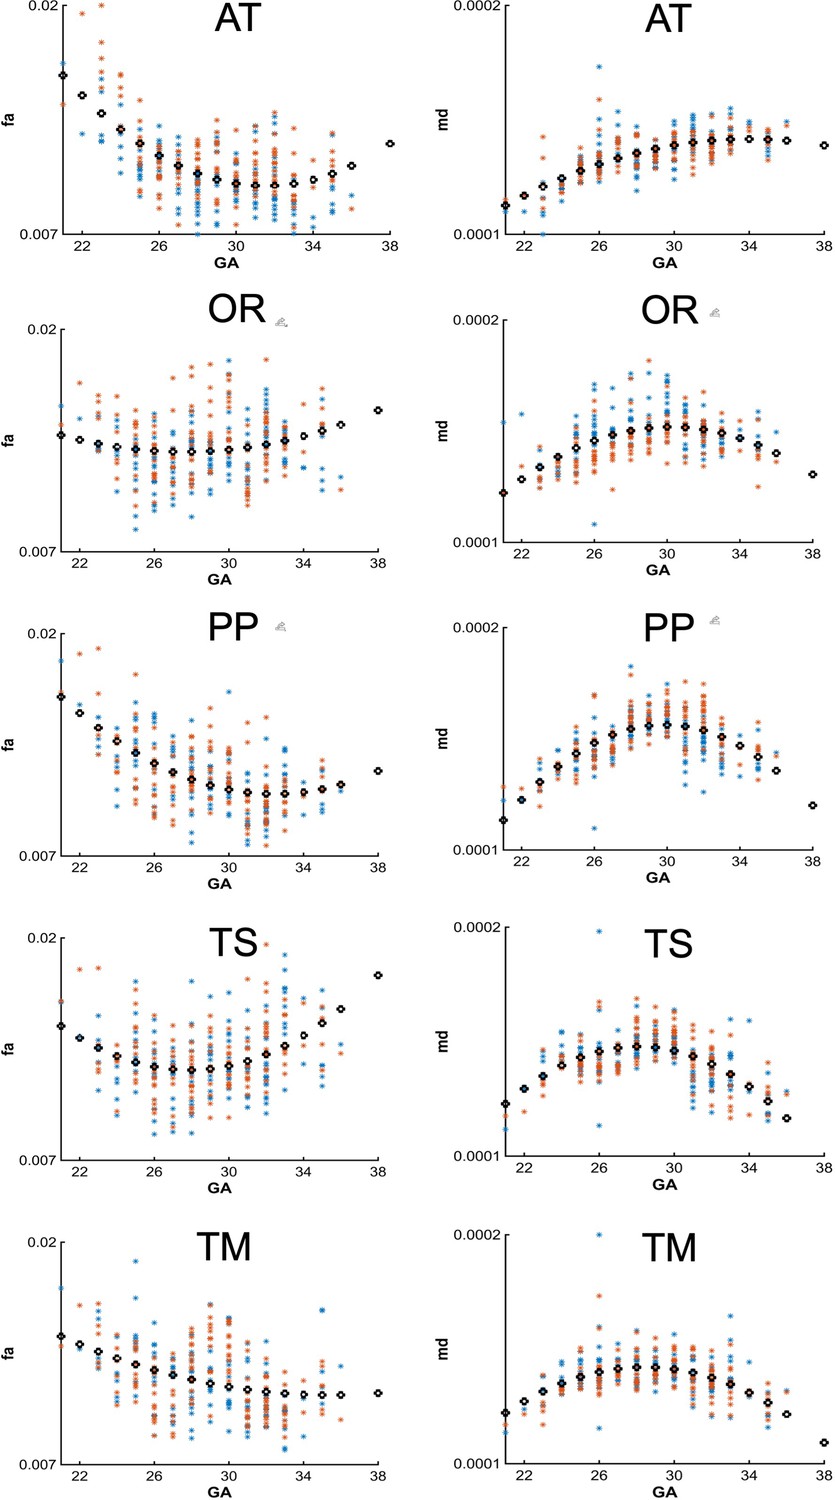
Whole-tract average of diffusion tensor metrics in the fetal cohort (n=140), fractional anisotropy (FA), and mean diffusivity (MD), in thalamocortical tracts across gestational age (every other week shown).
Figure 5 with 1 supplement
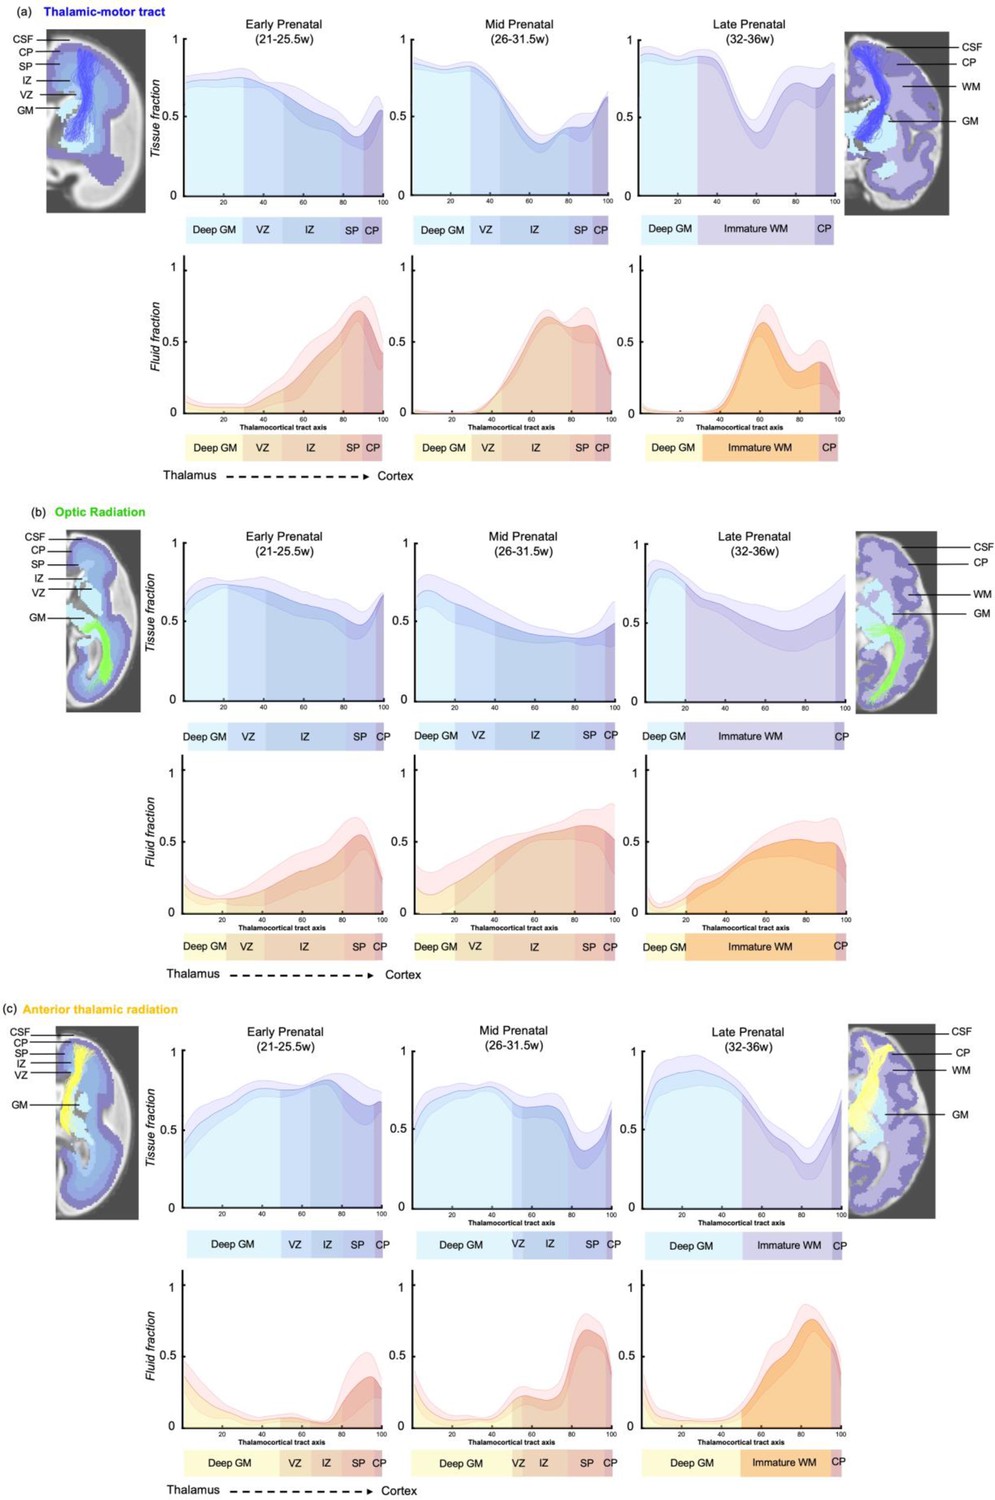
Microstructural composition of fetal compartments traversed by developing thalamic white matter.
Tracts were overlayed on the atlas of fetal compartments (examples highlight the difference between fetal brain structure in early prenatal [25 weeks] on far left, and late prenatal [35 weeks] on far right). Tissue fraction trends (top row) and fluid fraction trends (bottom row), normalised to 1, between the thalamus and cortex (thalamocortical tract axis) for the (a) thalamic-motor tract, (b) optic radiation, and (c) anterior thalamic radiation. Subjects were grouped by age, and average trajectories plotted for early prenatal (22–25.5 weeks), mid prenatal (26–31.5 weeks), late prenatal (32–36 weeks). Error bars represent the standard deviation among all subjects in each group. Atlas-derived tissue boundaries are marked on the trajectories to reveal the changing tissue properties of each layer between early, mid, and late prenatal development (cortical spinal fluid = CSF, cortical plate = CP, subplate = SP, intermediate zone = IZ, ventricular zone = VZ, deep grey matter = GM, immature white matter = WM).
Figure 5—figure supplement 1
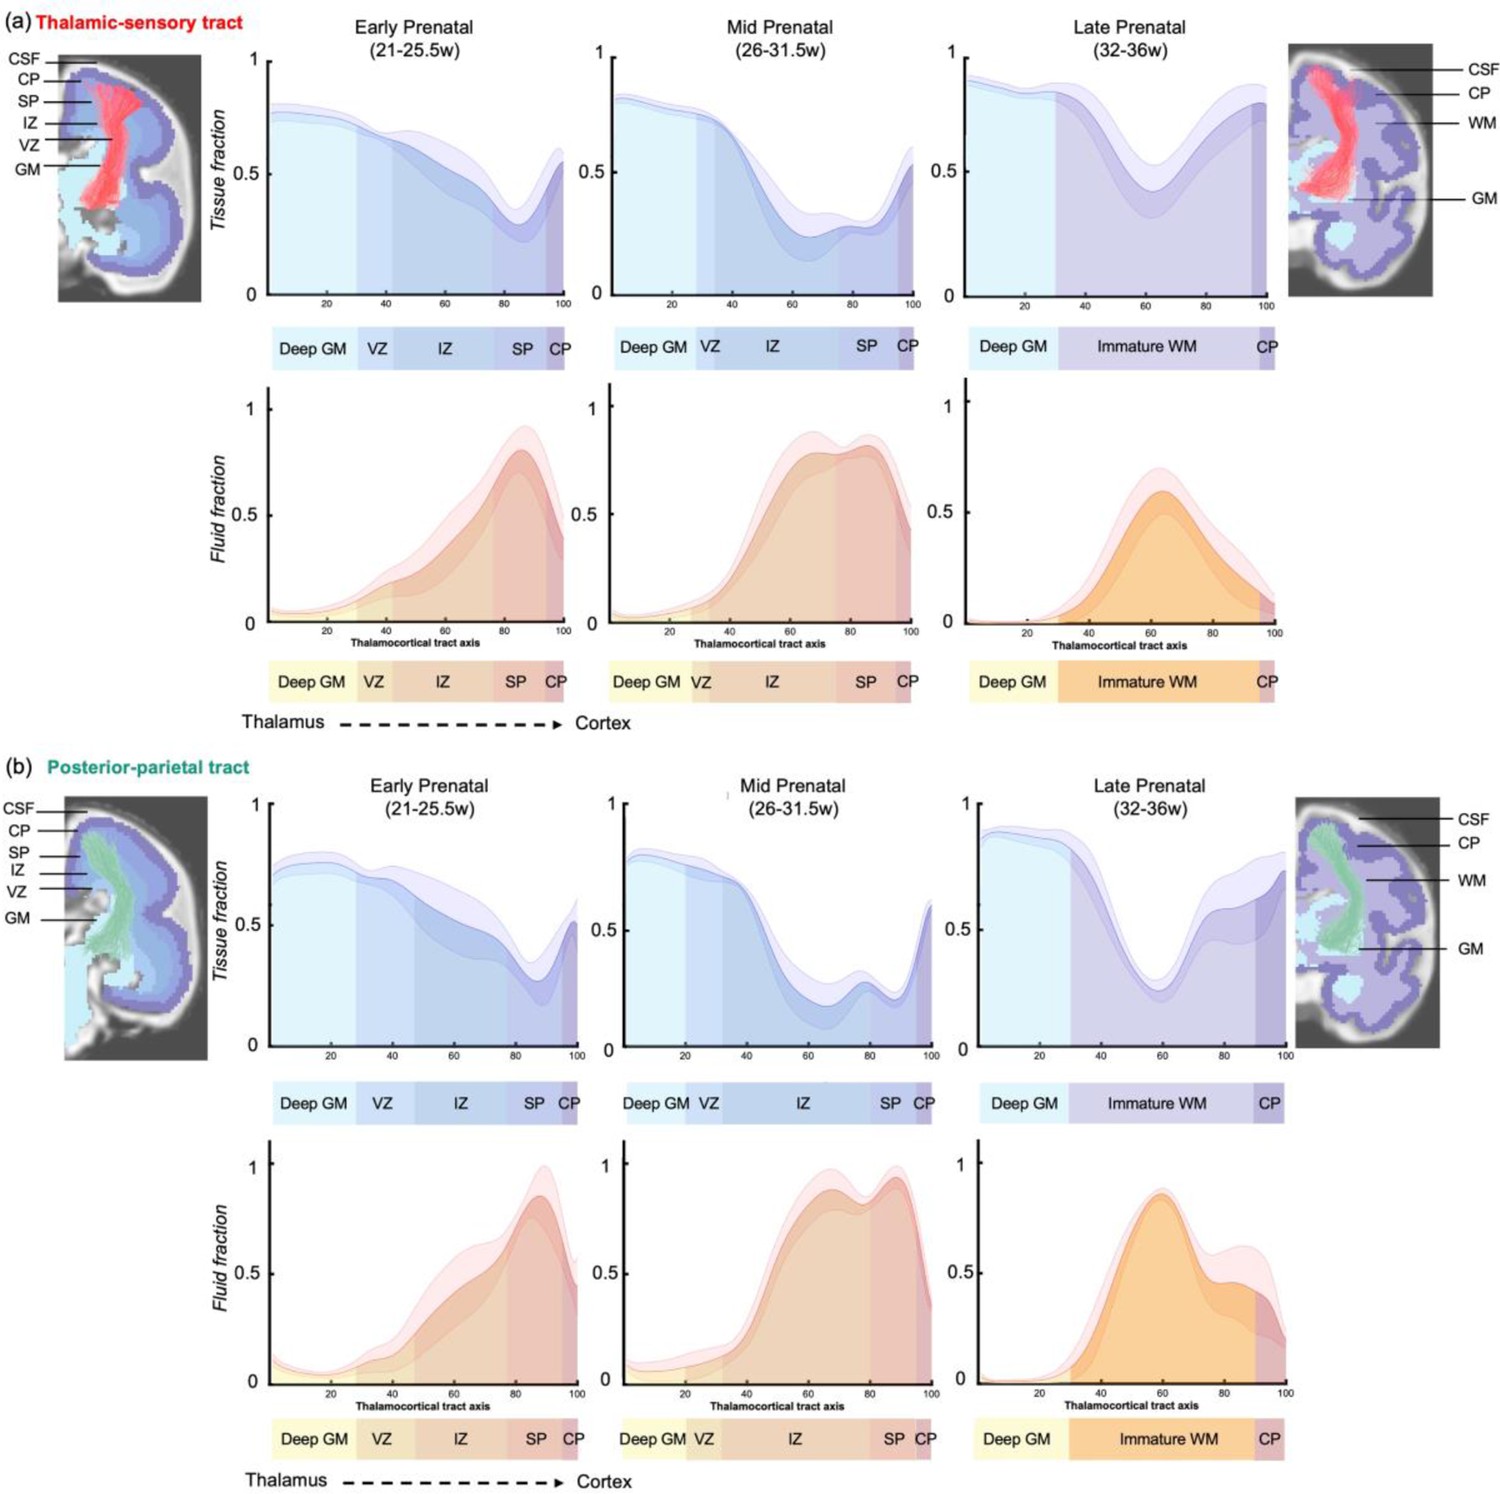
Microstructural composition of fetal compartments traversed by developing thalamic white matter.
(a) Thalamic-sensory tract and (b) posterior parietal tract. Tracts were overlayed on the atlas of fetal compartments (examples highlight the difference between fetal brain structure in early prenatal [25 weeks] on far left, and late prenatal [35 weeks] on far right). Tissue fraction trends (top row) and fluid fraction trends (bottom row) normalised to 1, between the thalamus and cortex (thalamocortical tract axis). Subjects were grouped by age, and average trajectories plotted for early prenatal (22–25.5 weeks), mid prenatal (26–31.5 weeks), late prenatal (32–36 weeks). Error bars represent the standard deviation among all subjects in each group. Atlas-derived tissue boundaries are marked on the trajectories to reveal the changing tissue properties of each layer between early, mid, and late prenatal development (cortical spinal fluid = CSF, cortical plate = CP, subplate = SP, intermediate zone = IZ, ventricular zone = VZ, deep grey matter = GM, immature white matter = WM).
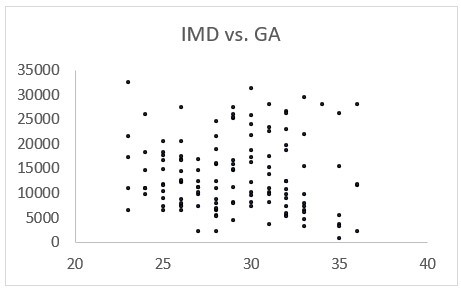
Appendix 1—figure 1
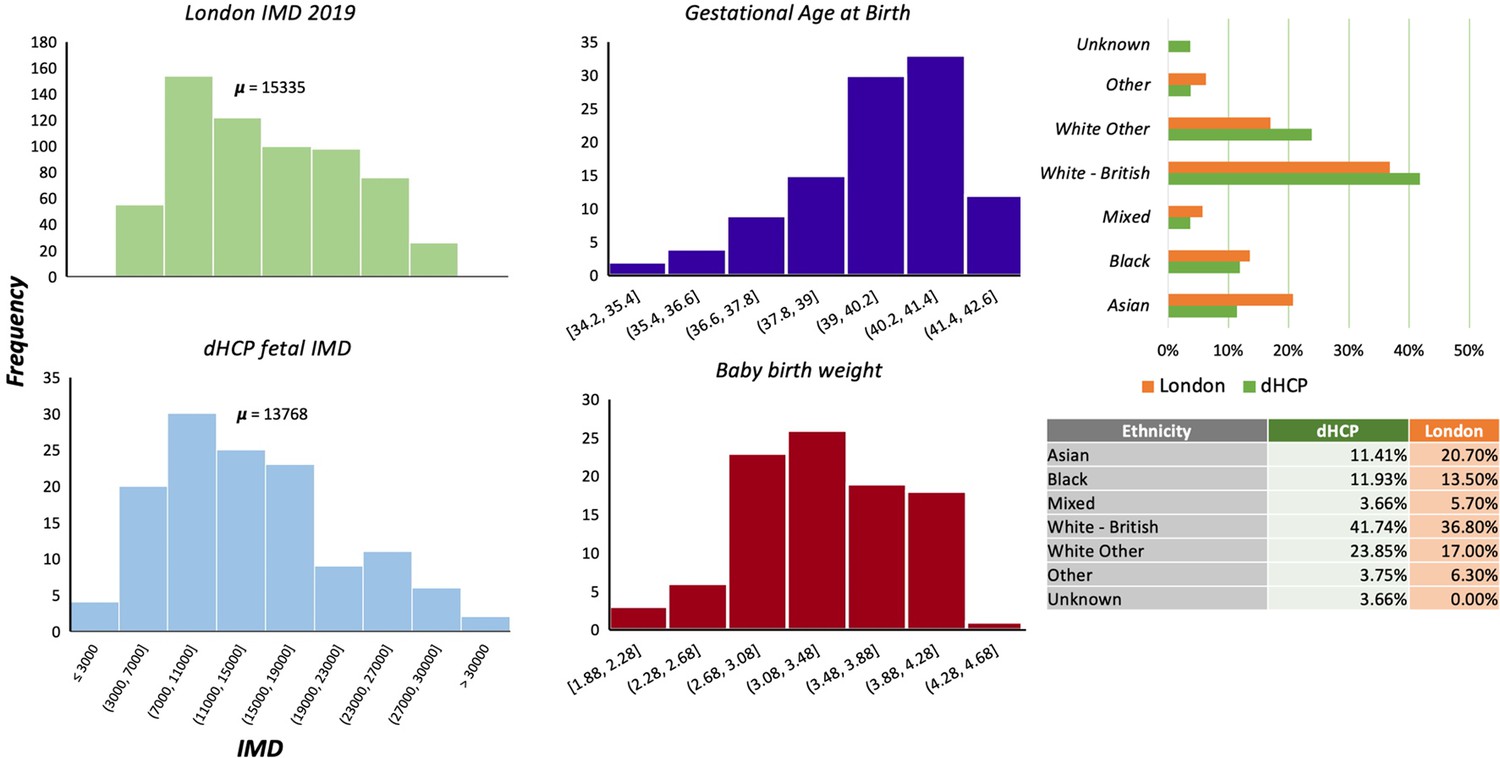
Sociodemographic and neonatal follow-up information.
Including index of multiple deprivation (IMD), London. Gestational age at birth, birth weight, and ethnicity.
Appendix 1—figure 2
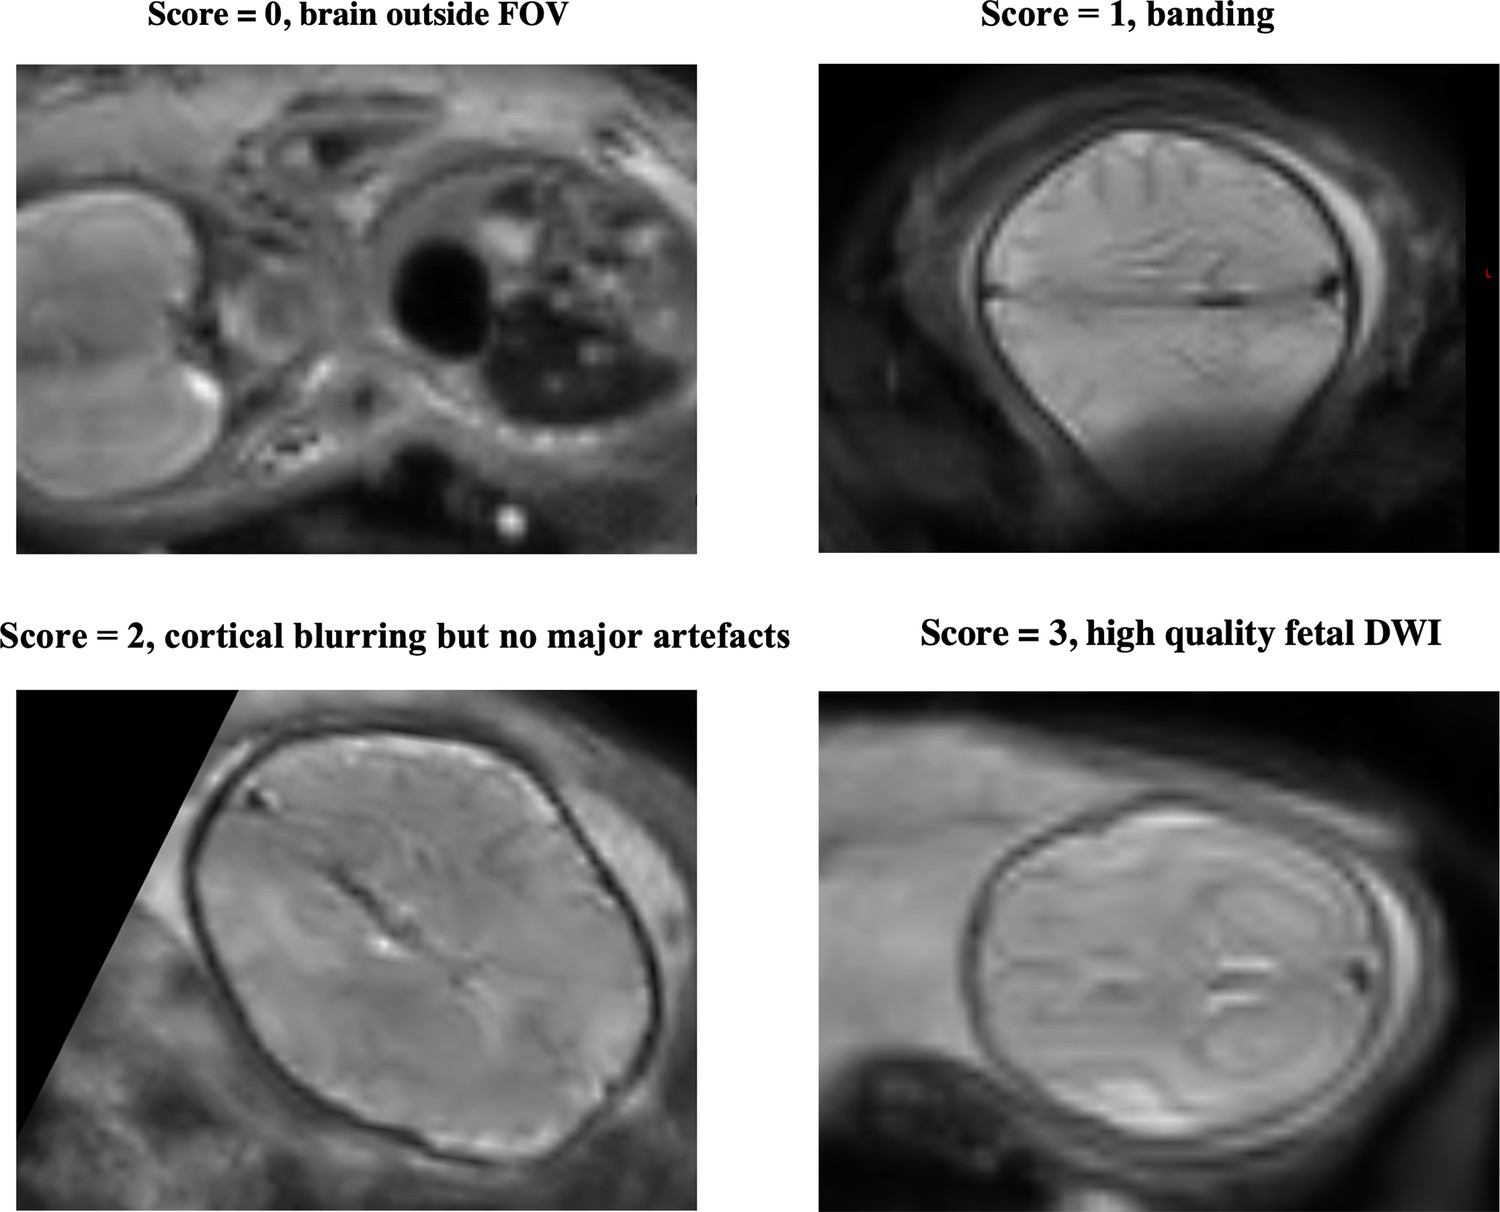
Examples of QC scoring scale for subjects, between 0 and 3, with 0 (=failure, e.g. subject moved out of the field of view) to 3 (=high quality).
Appendix 1—figure 3
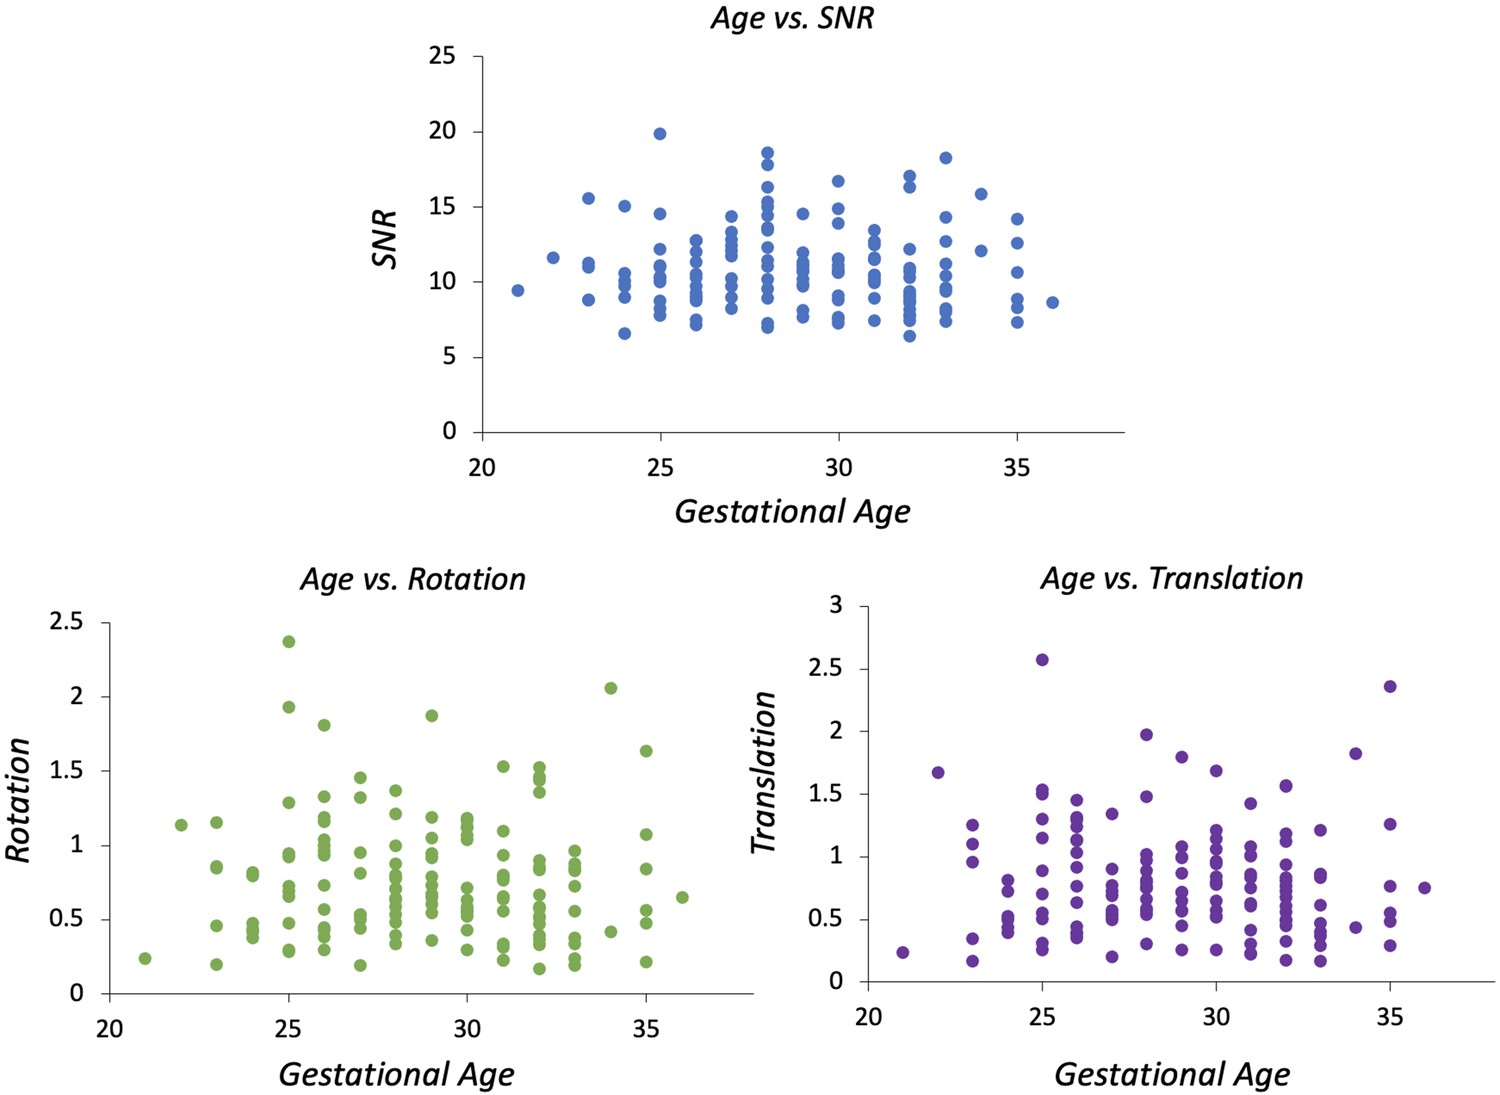
Correlations between spherical harmonics and radial decomposition (SHARD)-derived indices describing subject motion and gestational age (signal-to-noise ratio [SNR], rotation and translation).
Appendix 1—figure 4
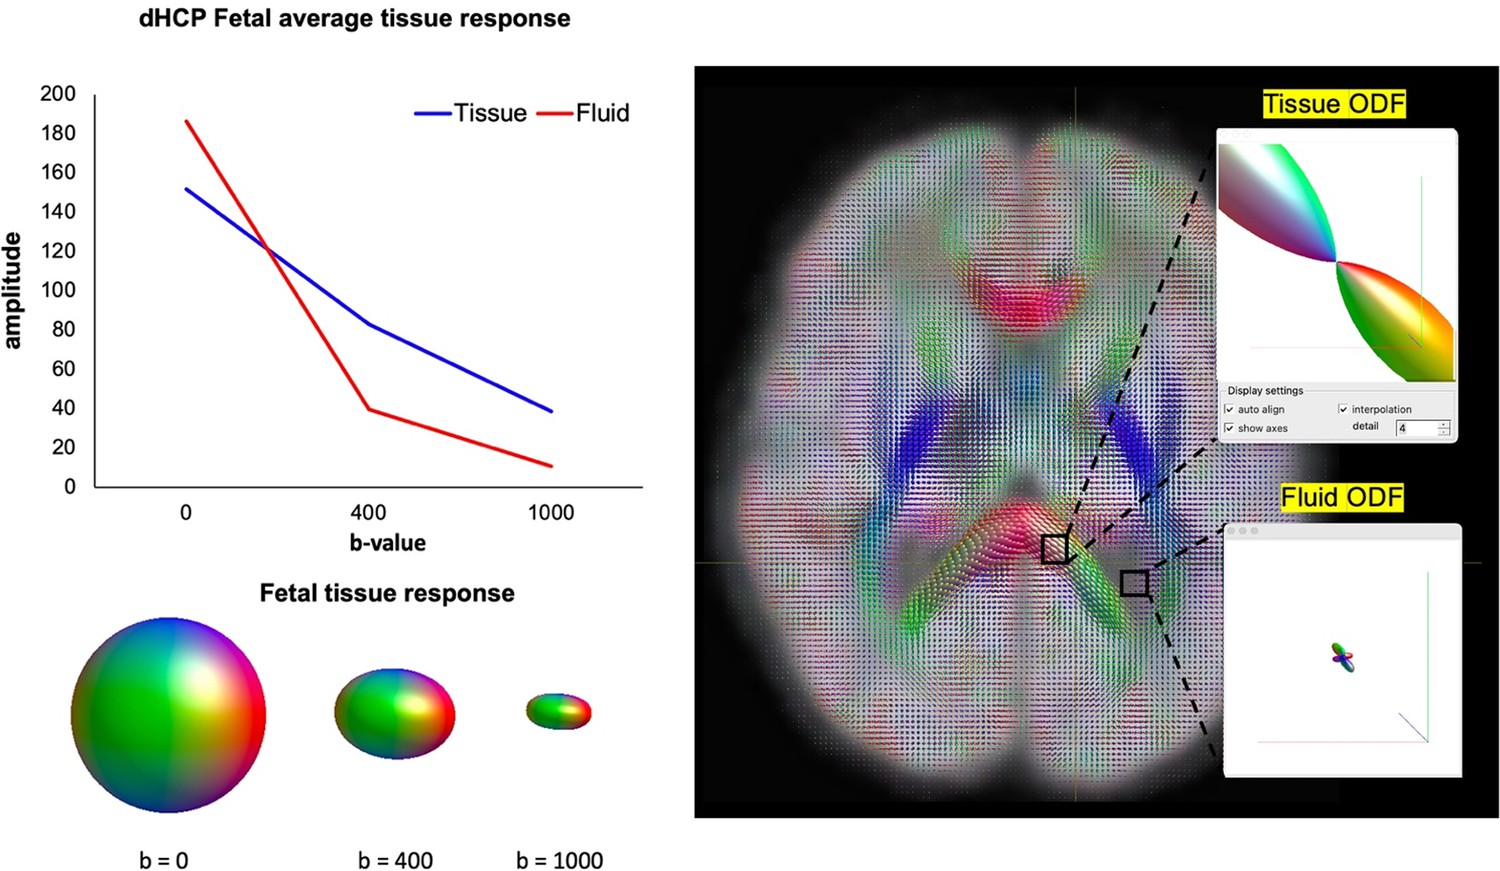
Signal amplitude decay in tissue vs. fluid response functions at different b-shells (left).
Polar plots of the distinct orientation density functions (ODFs) between the corpus callosum (white matter, tissue compartment) and ventricle (cortical spinal fluid [CSF], fluid compartment) after multi-shell multi-tissue constrained spherical deconvolution (MSMT-CSD) is applied to the data (right).
Appendix 1—figure 5
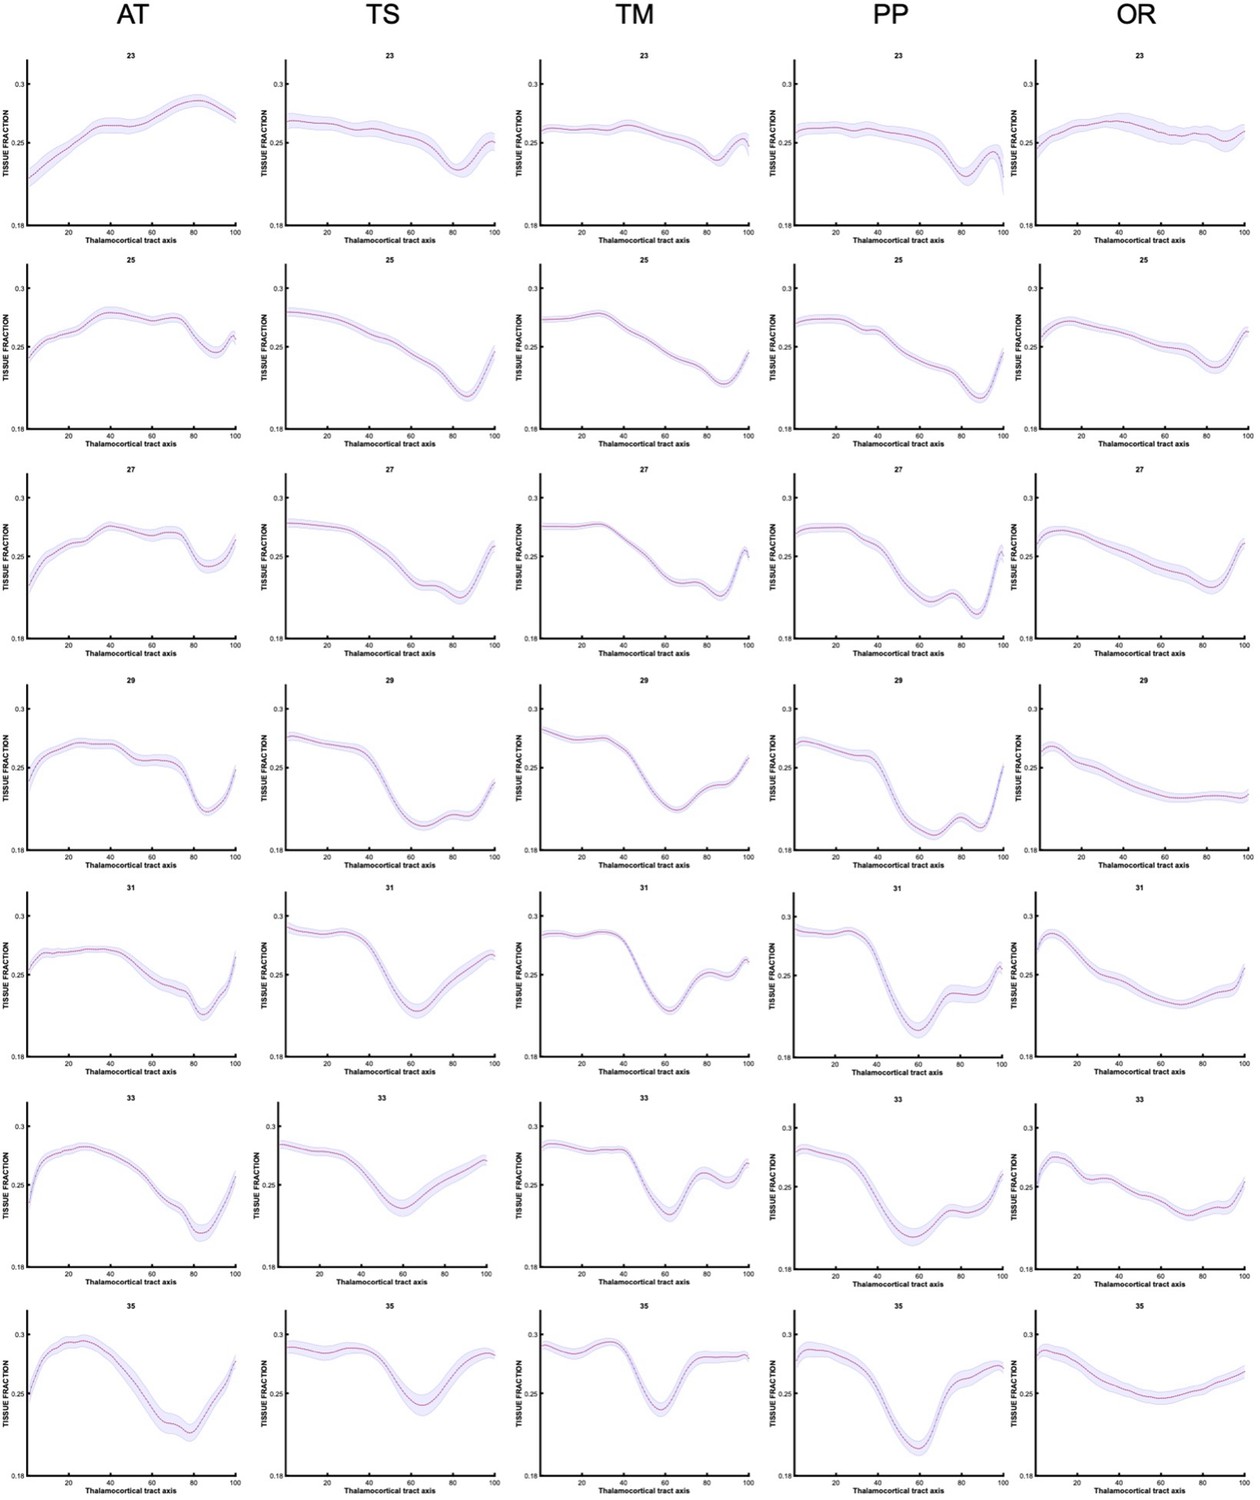
Tissue fraction trajectories along thalamocortical tract axis in each gestational week, prior to grouping into early, mid, and late prenatal (every other week shown).
Appendix 1—figure 6
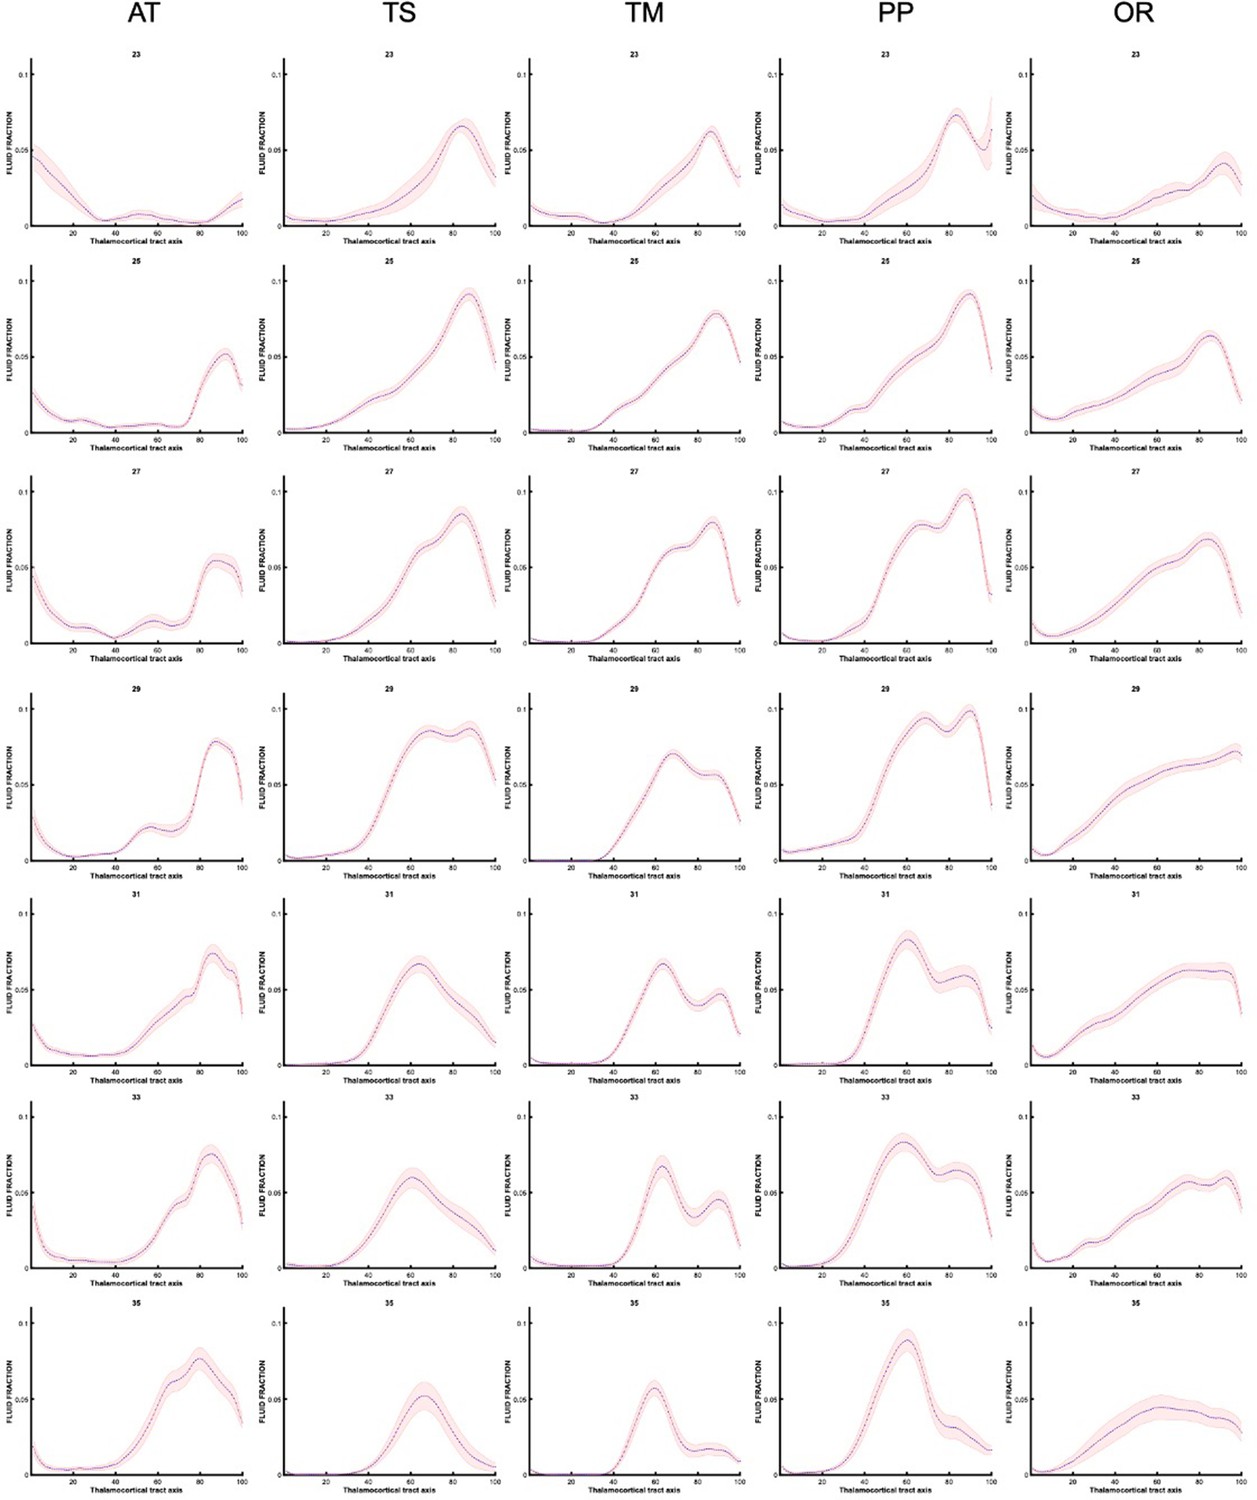
Fluid fraction trajectories along thalamocortical tract axis in each gestational week, prior to grouping into early, mid, and late prenatal (every other week shown).
Author response image 1
Author response image 2
Additional files
Download links
A two-part list of links to download the article, or parts of the article, in various formats.
Downloads (link to download the article as PDF)
Open citations (links to open the citations from this article in various online reference manager services)
Cite this article (links to download the citations from this article in formats compatible with various reference manager tools)
Spatiotemporal tissue maturation of thalamocortical pathways in the human fetal brain
eLife 12:e83727.
https://doi.org/10.7554/eLife.83727


