Characterisation of an Escherichia coli line that completely lacks ribonucleotide reduction yields insights into the evolution of parasitism and endosymbiosis
- School of Biological Sciences, University of Auckland, New Zealand
- School of Biological Sciences, University of Canterbury, New Zealand
- Division of Applied Life Sciences,Graduate School of Agriculture, Kyoto University, Japan
Figures
Figure 1 with 2 supplements

Deletion of ribonucleotide reductase (RNR) genes in E. coli.
(A) Schematic of each of the three RNR operons in E. coli and the genomic regions following scarless deletion. Arrows indicate locations of PCR primers (Supplementary file 1B) used to confirm RNR operon presence/absence. (B) Results of PCR with primers external to all three nrd operons in ΔRNR compared with the wild-type progenitor strain (REL606). Lane 1, ladder; lanes 2 and 6, no template. Lanes 3–5, band sizes consistent with operon deletion (ΔnrdAB 1645 bp, ΔnrdDG 1620 bp and ΔnrdHIEF 1477 bp) in the ΔRNR line. Lanes 6–9, band sizes for all three operons in wild-type E. coli REL606 (nrdAB 5303 bp, nrdDG 4382 bp, and nrdHIEF 5191 bp).
-
Figure 1—source data 1
This file contains unlabelled and labelled full gel pictures for Figure 1.
- https://cdn.elifesciences.org/articles/83845/elife-83845-fig1-data1-v2.zip
Figure 1—figure supplement 1
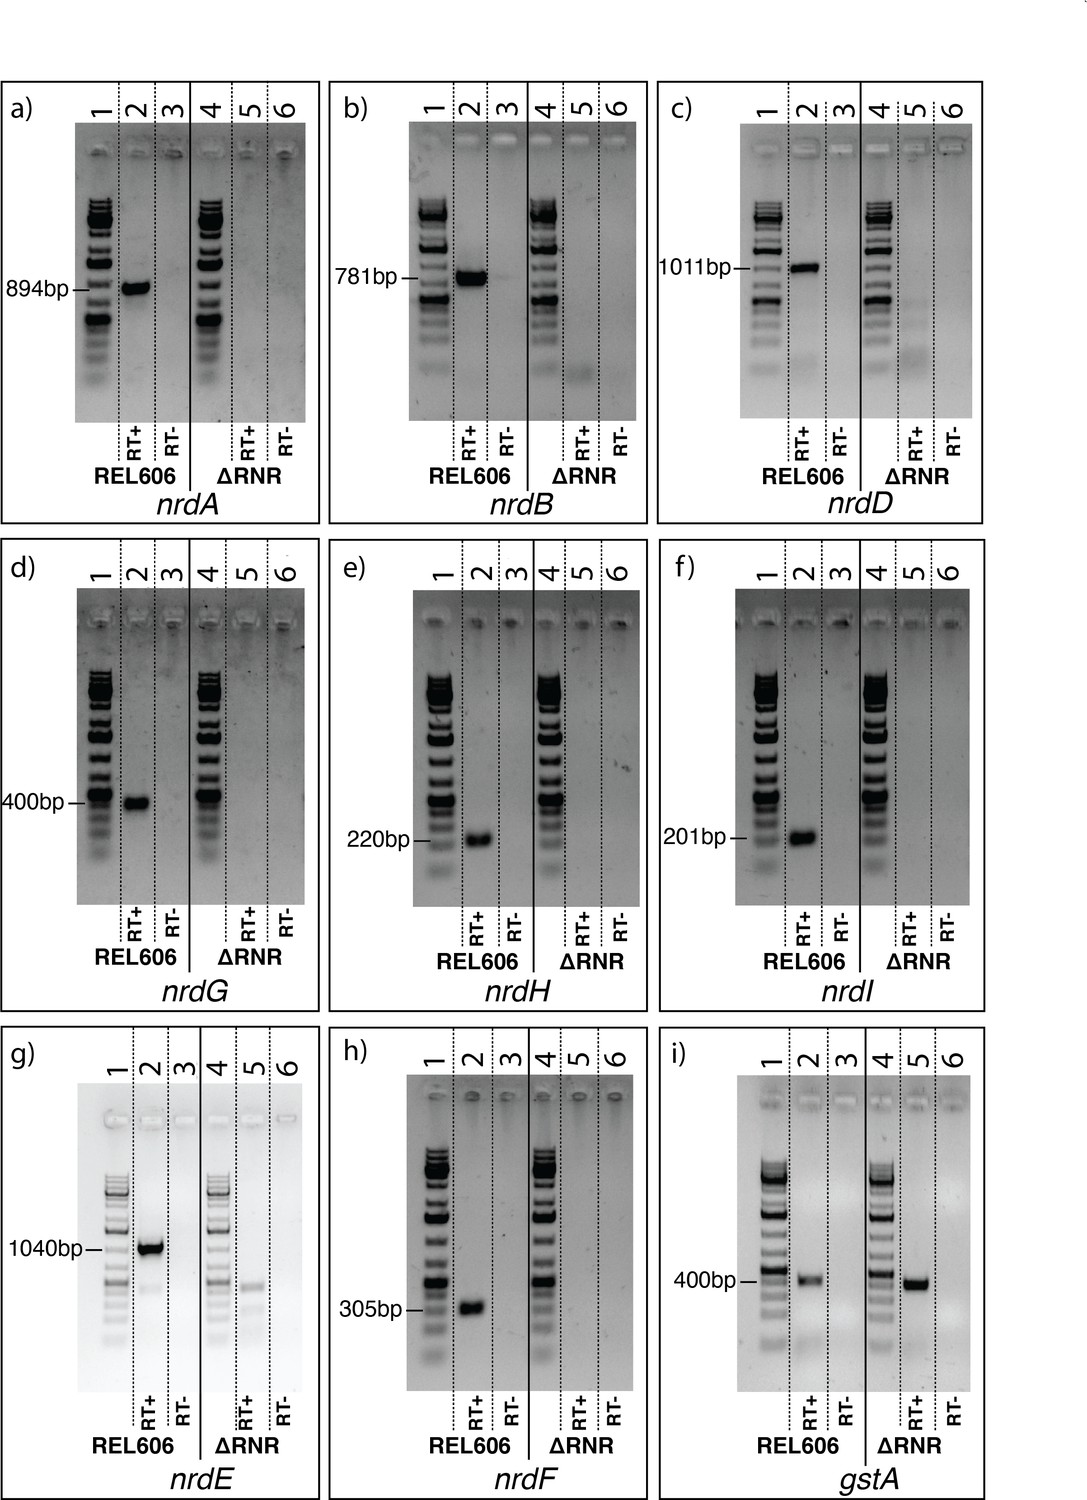
RT-PCR indicates that ribonucleotide reductase (RNR) genes are not expressed in ∆RNR.
RT-PCR using primers for (a) nrdA, (b) nrdB, (c) nrdD, (d) nrdG, (e) nrdH, (f) nrdI, (g) nrdE, and (h) nrdF on total RNA from ∆RNR or wild-type (REL606) indicate transcripts are not detected in ∆RNR, whereas expression was observed in REL606. (i) Internal primers for the gstA housekeeping gene were used as a control for RT-PCR, confirming that the absence of amplification in ∆RNR was not due to the absence of RNA in the samples. For each primer pair the order of lanes is as follows: lane 1, 1kb+ ladder; lane 2, REL606 RT+ (RT enzyme added); lane 3, REL606 RT- (no RT enzyme added); lane 4, 1kb+ ladder; lane 5, ∆RNR RT+; lane 6, ∆RNR RT-.
-
Figure 1—figure supplement 1—source data 1
This file contains unlabelled and labelled full gel pictures for Figure 1—figure supplement 1.
- https://cdn.elifesciences.org/articles/83845/elife-83845-fig1-figsupp1-data1-v2.zip
Figure 1—figure supplement 2
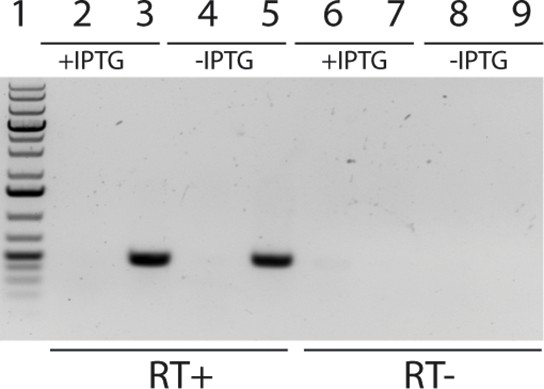
RT-PCR indicates that Mm-dAK is expressed in ∆RNR.
RT-PCR using primers for codon-optimised Mm-dAK on total RNA from ∆RNR and wild-type (REL606) indicates Mm-dAK expression is observed in ∆RNR carrying the pBAD33::Mm-dAK construct, regardless of whether the cells are IPTG-induced (+IPTG) or uninduced (-IPTG) lines. Lane 1, 1kb+ ladder; lanes 2–5 RT enzyme added (RT+): lane 2, WT+ IPTG; lane 3, ∆RNR+ IPTG; lane 4, WT- IPTG; lane 5, ∆RNR- IPTG. Lanes 6–9 controls without RT enzyme (RT-): lane 6, WT+ IPTG; lane 7, ∆RNR+ IPTG; lane 8, WT- IPTG; lane 9, ∆RNR- IPTG.
-
Figure 1—figure supplement 2—source data 1
This file contains unlabelled and labelled full gel pictures for Figure 1—figure supplement 2.
- https://cdn.elifesciences.org/articles/83845/elife-83845-fig1-figsupp2-data1-v2.zip
Figure 2
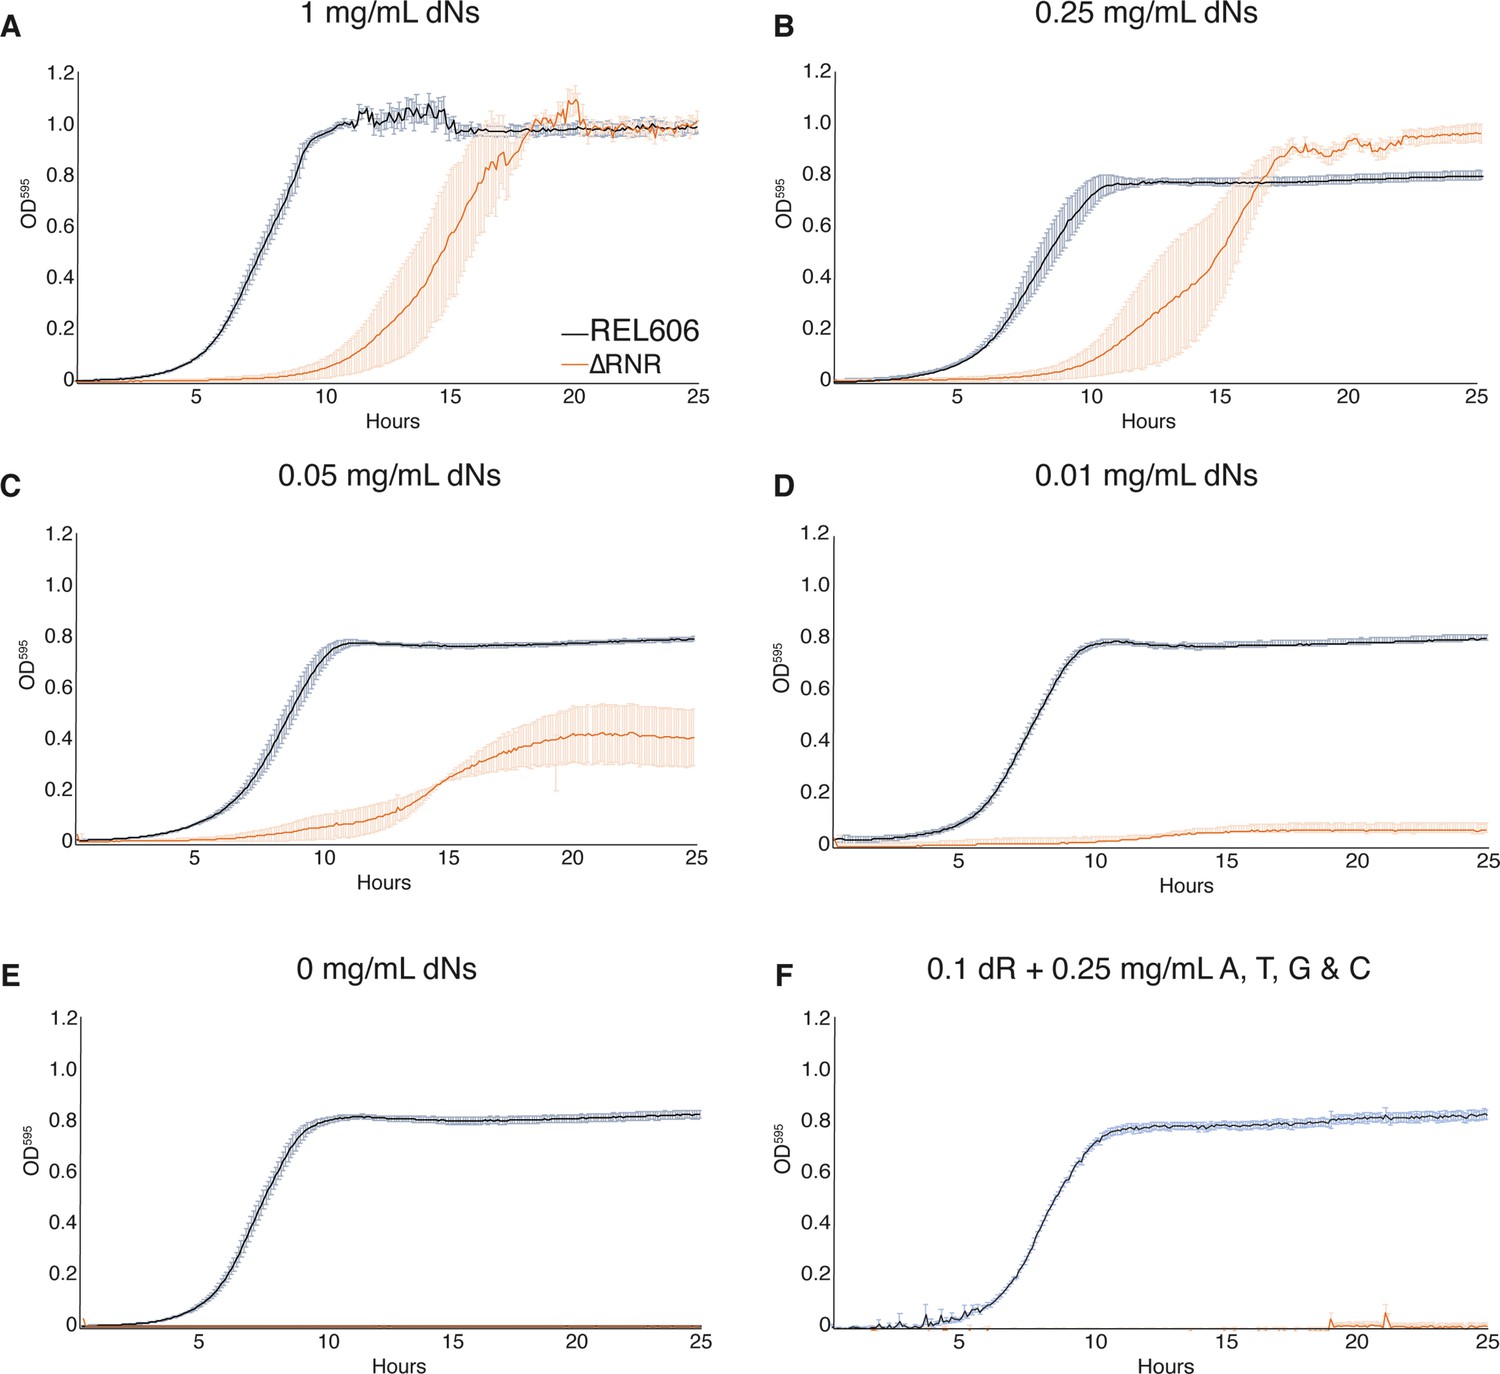
ΔRNR shows growth across a range deoxyribonucleoside (dN) concentrations but cannot grow in the absence of dN supplementation.
Growth was monitored for 25 hr in 1× MOPS media + 1% glucose with supplementation, as indicated. Wild-type (REL606, black), ΔRNR (orange). Curves show mean OD595, error bars show SEM, all experiments performed in triplicate. (A) 1 mg/mL, (B) 0.25 mg/mL, (C) 0.05 mg/mL, (D) 0.01 mg/mL, and (E) 0 mg/mL dNs. (F) 0.1 mg/mL deoxyribose (dR) + 0.25 mg/mL of adenine (A), cytosine (C), thymine (T), and guanine (G).
Figure 3
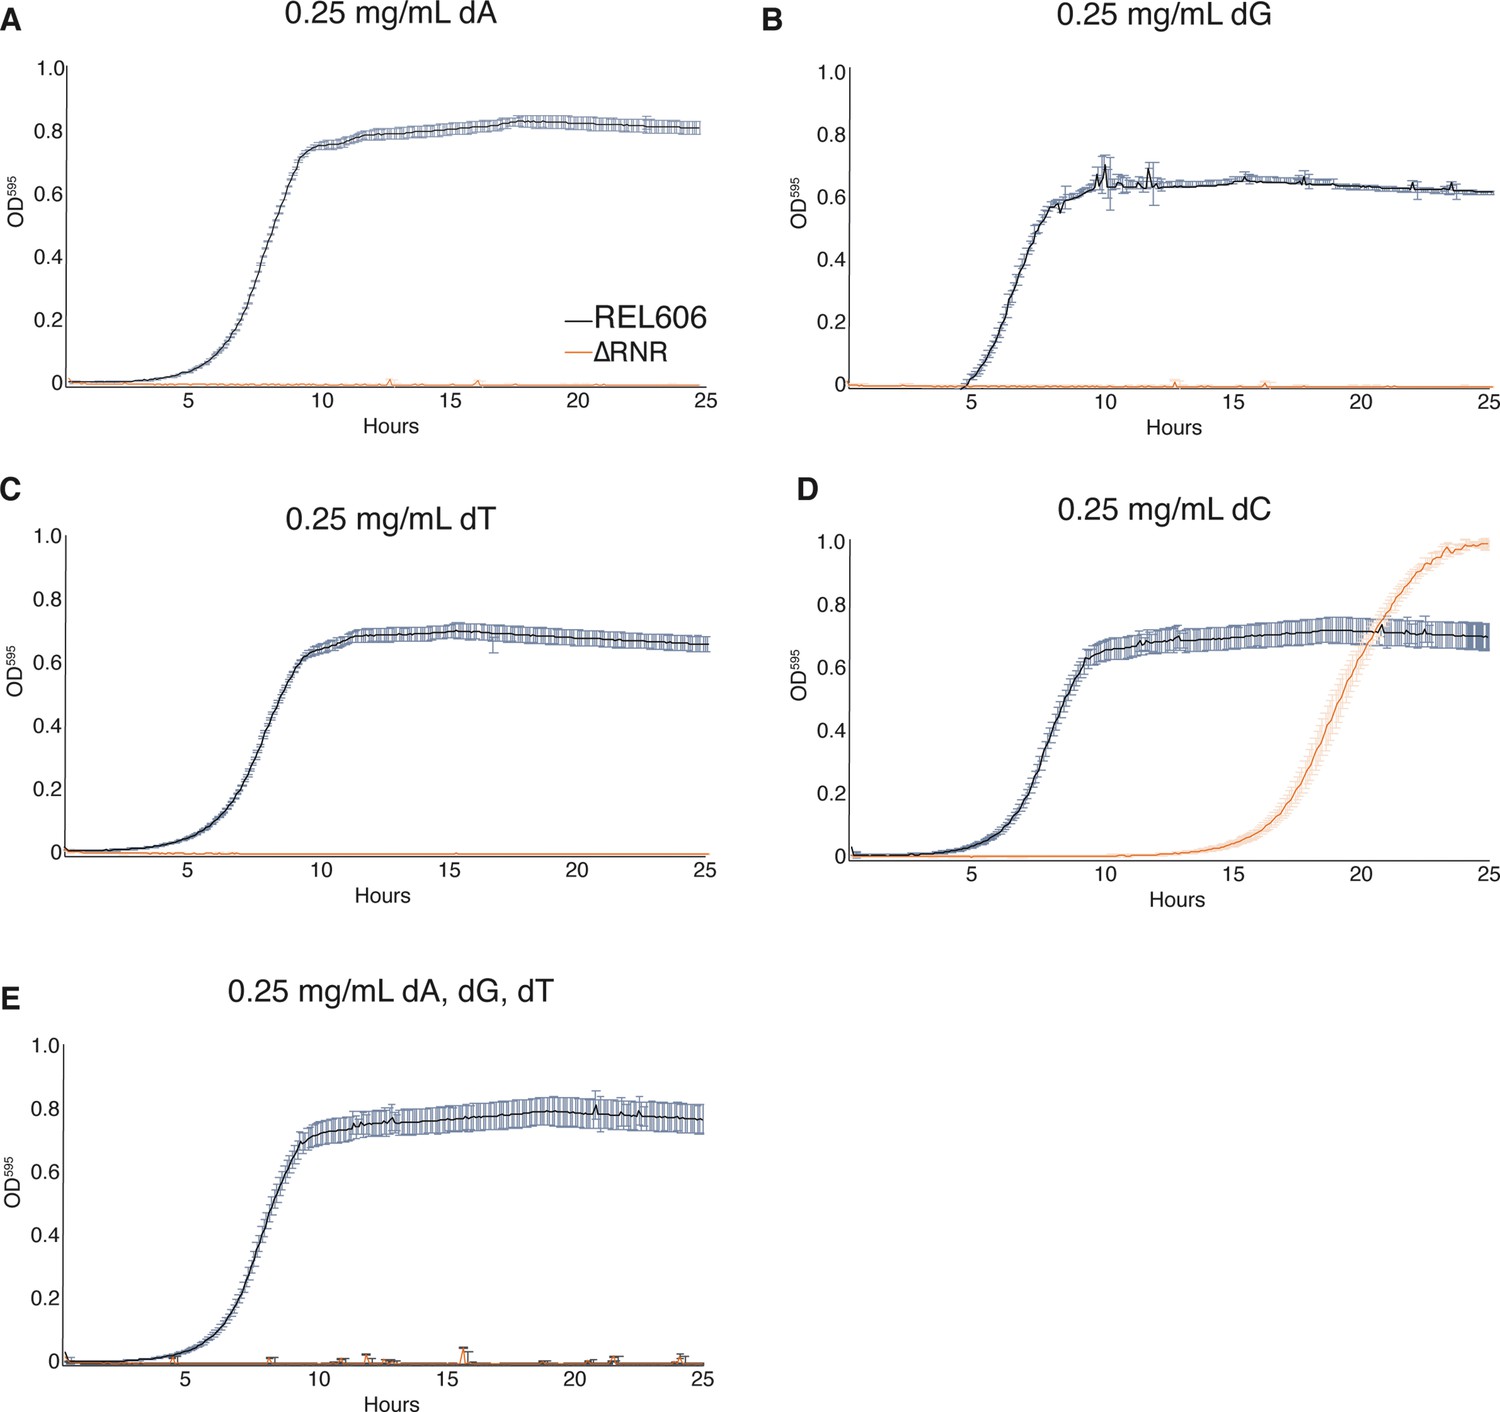
ΔRNR requires only deoxycytidine (dC) for growth in minimal media.
Growth was monitored for wild-type (REL606, black) and ΔRNR (orange) in 1× MOPS media + 1% glucose, with deoxyribonucleoside (dN) supplementation, as indicated. Growth was monitored for 25 hr. Curves show mean OD595, error bars show SEM, all experiments performed in triplicate. (A) Deoxyadenine (dA) (0.25 mg/mL), (B) deoxyguanine (dG) (0.25 mg/mL), (C) deoxythymine (dT) (0.25 mg/mL), (D) deoxycytidine (dC) (0.25 mg/mL), (E) dA, dG, dT, each at 0.25 mg/mL.
Figure 4
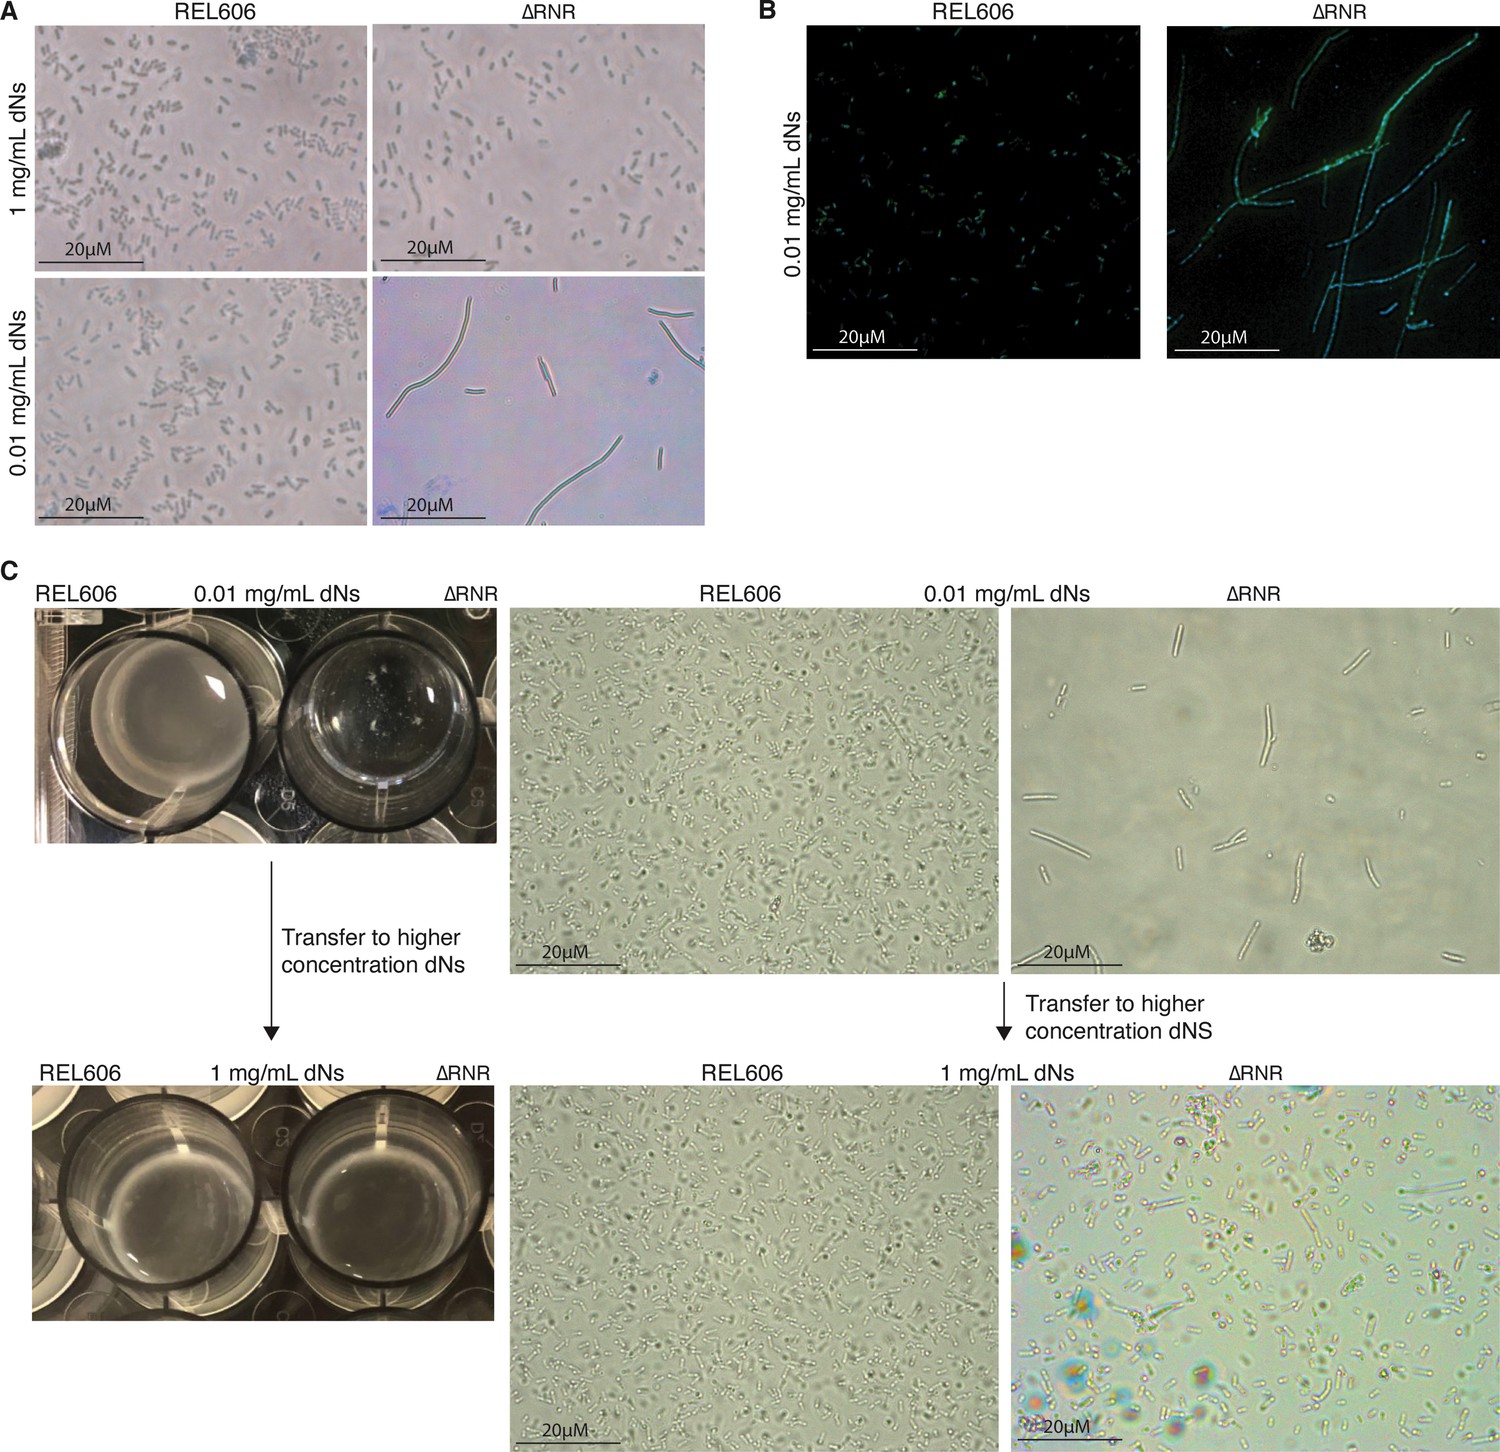
ΔRNR exhibit a reversible elongated, filamentous cell morphology with multiple nucleoids when grown in limiting deoxyribonucleoside (dN) concentrations.
(A) ×100 Brightfield photographs of REL606 and ∆RNR at 1 and 0.01 mg/mL. (B) FITC and DAPI staining at ×100 of REL606 and ∆RNR at 0.01 mg/mL. (C) ∆RNR phenotype is reversible if dN concentration is increased. Loss of clumpy phenotype occurs when ∆RNR cells are transferred from low (0.01 mg/mL) to high (1 mg/mL) dNs. Brightfield microscopy images reveal that this change is accompanied by a reduction in elongated cell morphology upon transfer to high [dN] (magnification ×1000; scale bar 20 μM).
Figure 5
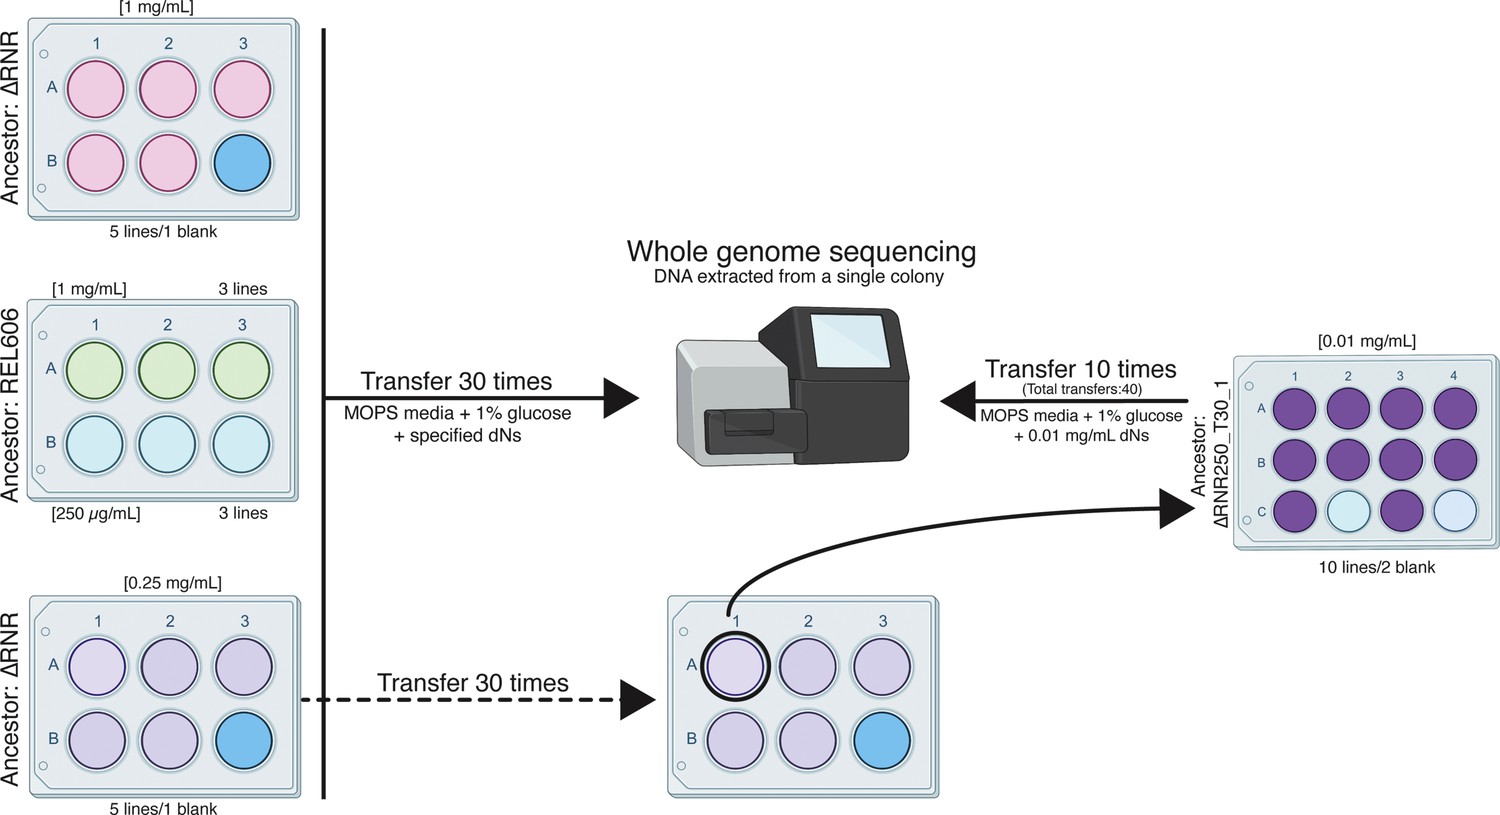
Overview of the ΔRNR evolution experiment.
Five lines of ΔRNR and three lines of wild-type progenitor (REL606) were established at one of two conditions (1 mg/mL or 0.25 mg/mL deoxyribonucleosides [dNs] in MOPS + 1% glucose), and serially passaged for 30 transfers. Genomic material from each line was then extracted from a single colony and sent for sequencing giving us clonal-level genome information. To further investigate adaptation to low concentrations of dNs, the ‘fittest’ ΔRNR line grown at 0.25 mg/mL dNs (ΔRNR_250_T30_1) was used to seed a subsequent experiment. Ten replicate lines of ΔRNR_250_T30 _1 were serially passaged for an additional 10 transfers in MOPS + 1% glucose and 0.01 mg/mL dNs. DNA from a single colony of each of these 10 lines (ΔRNR_10_T40_1–10) was then extracted and sent for whole genome sequencing.
Figure 6

The ∆RNR elongate cell phenotype diminishes over the course of an evolution experiment.
(A) Mean cell length during the course of a 30-transfer evolution experiment. Cell length was determined for 20 cells for replicate line 1 of ∆RNR and REL606 evolved in either 1 mg/mL or 0.25 mg/mL deoxyribonucleosides (dNs). Cell measurements were taken every five transfers. Over the course of the evolution experiment, ∆RNR cell length gradually reduces at both dN concentrations. (B) Morphology of wild-type (top row) and ∆RNR (bottom row) cells at transfer 1 and transfer 30 at each dN concentration (1 mg/mL or 0.25 mg/mL) (magnification ×1000; scale bar 2 μM).
Figure 7 with 1 supplement

Growth characterisation of ∆RNR lines evolved at 1 mg/mL deoxyribonucleosides (dNs) for 30 transfers.
Growth was monitored for wild-type (REL606), ancestor (∆RNR_T0), and evolved lines (∆RNR1000_T30_L1–5, evolved in 1 mg/mL dNs for 30 transfers). Growth experiments were performed in 1× MOPS media + 1% glucose with the addition of dNs at indicated concentrations. Growth was monitored for 25 hr. Curves show mean OD595, error bars show SEM, all experiments performed in triplicate. (A) 1 mg/mL dNs, (B) 0.25 mg/mL dNs, (C) 0.055 mg/mL dNs, (D) 0.011 mg/mL dNs, (E) 0 mg/mL dNs.
Figure 7—figure supplement 1
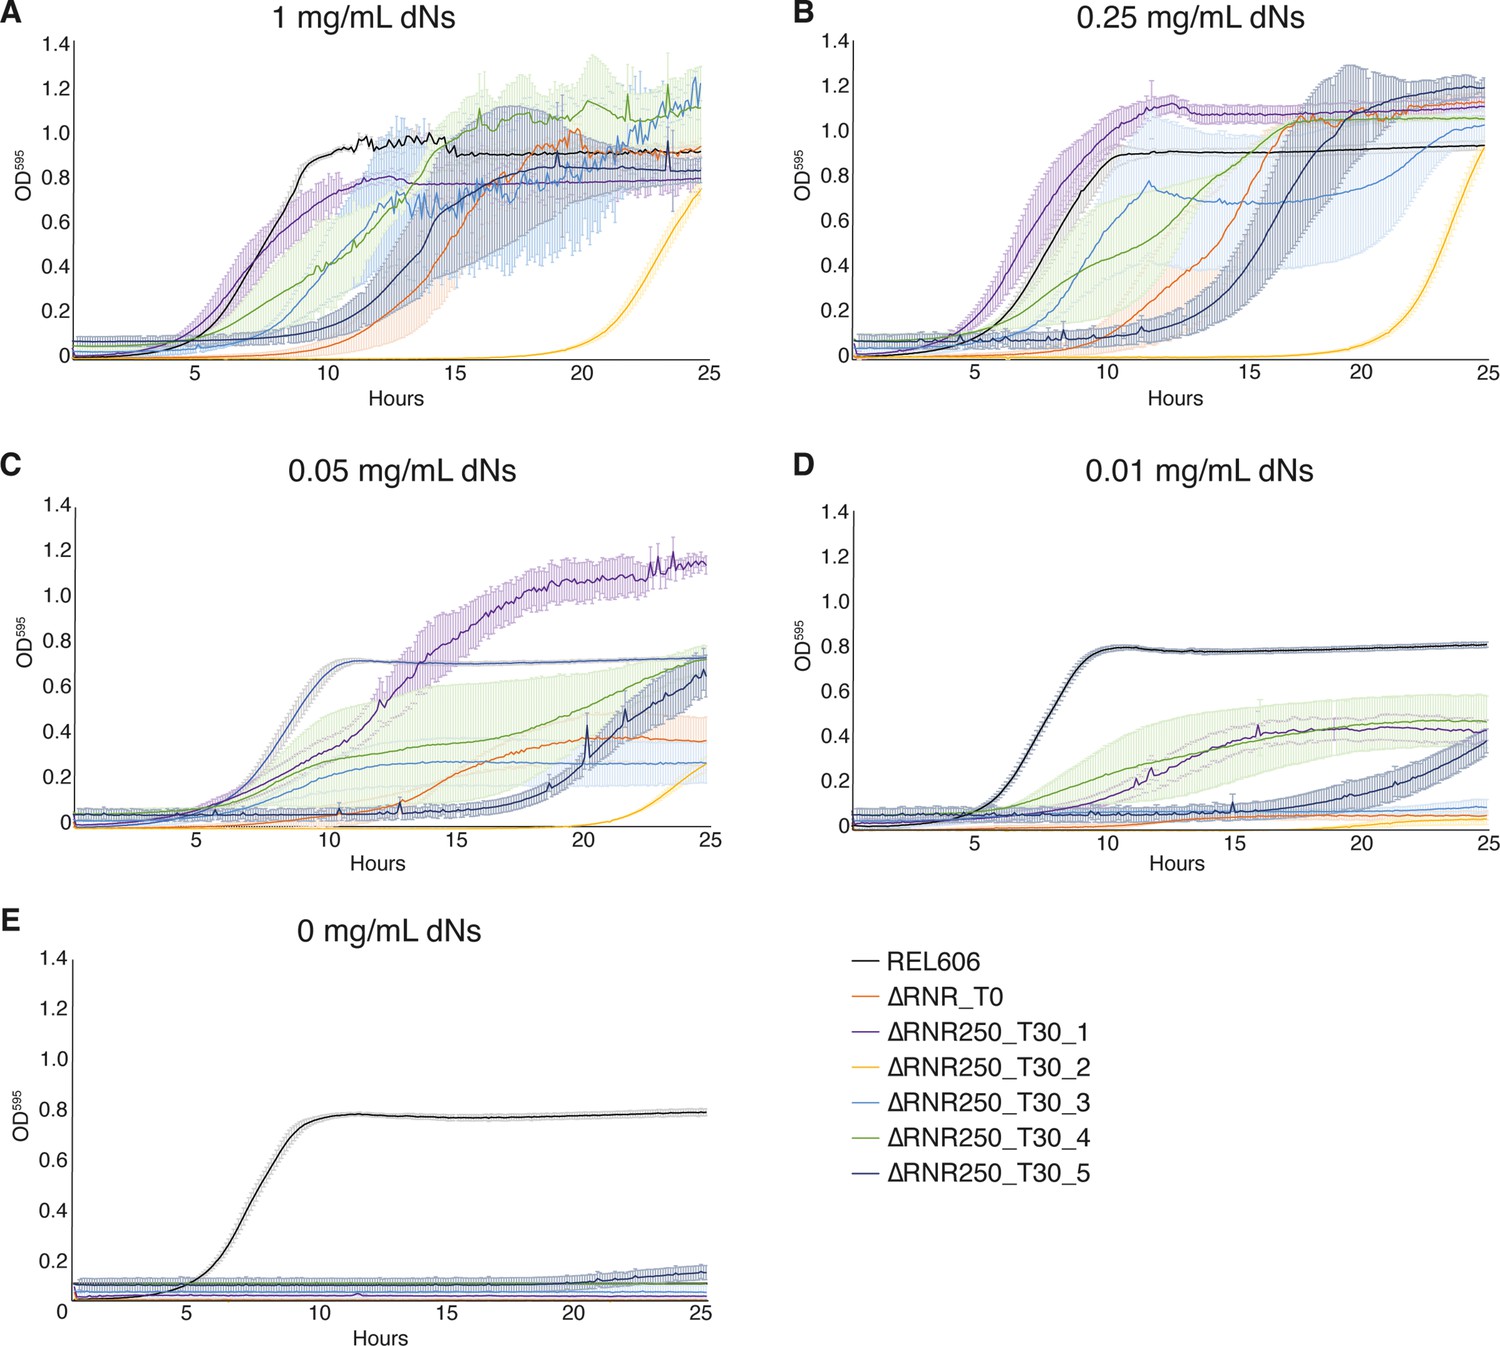
Growth characterisation of ∆RNR lines evolved at 250 μg/mL deoxyribonucleosides (dNs) for 30 transfers.
Growth was monitored for wild-type (REL606), ancestor (∆RNR_T0), and evolved lines (∆RNR250_T30_L1–5, evolved in 250 μg/mL dNs for 30 transfers). Growth experiments were performed in 1× MOPS media + 1% glucose with dN supplementation, as indicated. Growth was monitored for 25 hr. Curves show mean OD595, error bars show SEM, all experiments performed in triplicate. (A) 1 mg/mL dNs, (B) 0.25 mg/mL dNs, (C) 0.05 mg/mL dNs, (D) 0.01 mg/mL dNs, (E) 0 mg/mL.
Figure 8 with 4 supplements
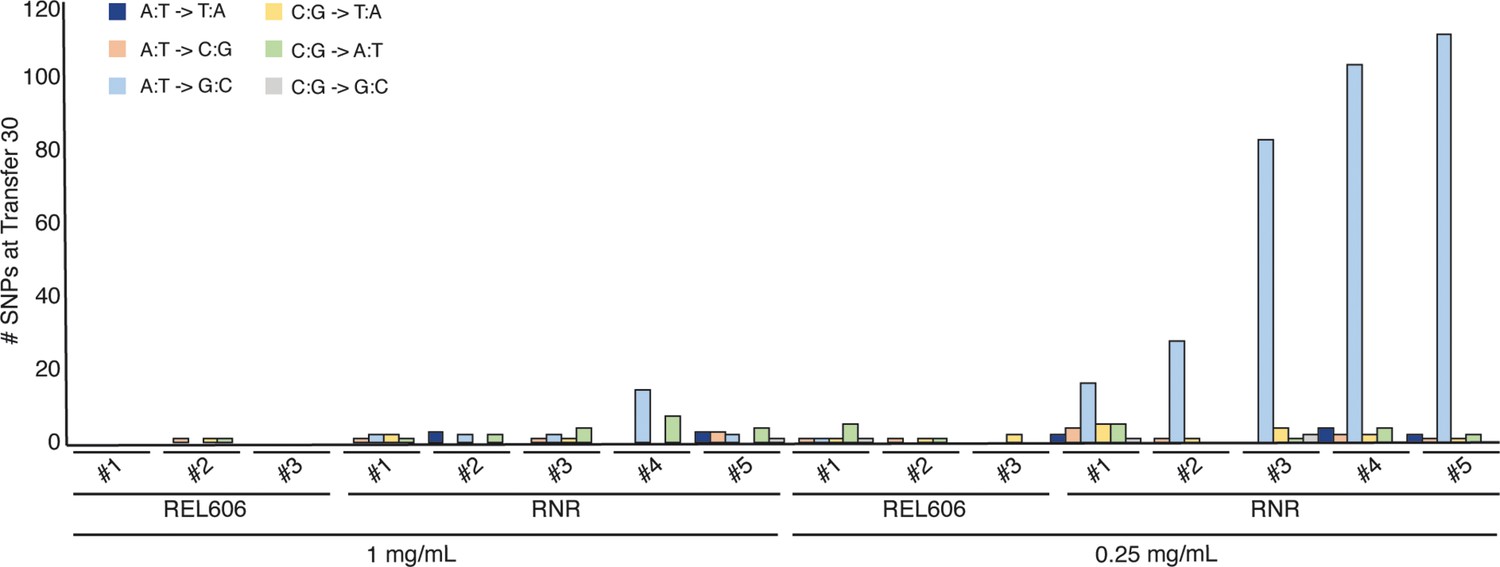
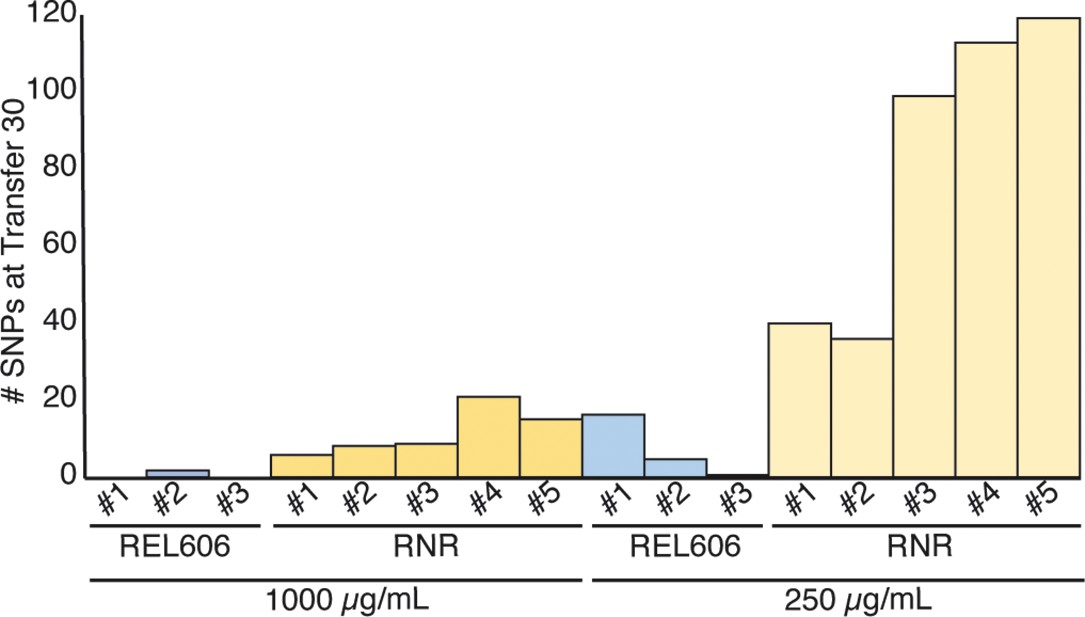
Mutations observed following experimental evolution of ∆RNR for 30 transfers.
Total single nucleotide substitutions plus indels present in each line at T30. For evolution in 1 mg/mL deoxyribonucleosides (dNs), REL606=control, RNR = ∆RNR1000_T30_L1–5. For evolution in 0.25 mg/mL, REL 606=control, RNR = ∆RNR250_T30_L1–5.
Figure 8—figure supplement 1
Mutations observed following experimental evolution of ∆RNR for 30 transfers.
Total single nucleotide substitutions plus indels present in each line at T30 REL606 control lines; RNR = ∆RNR1000_T30_L1–5 (left) and ∆RNR250_T30_L1–5 (right).
Figure 8—figure supplement 2
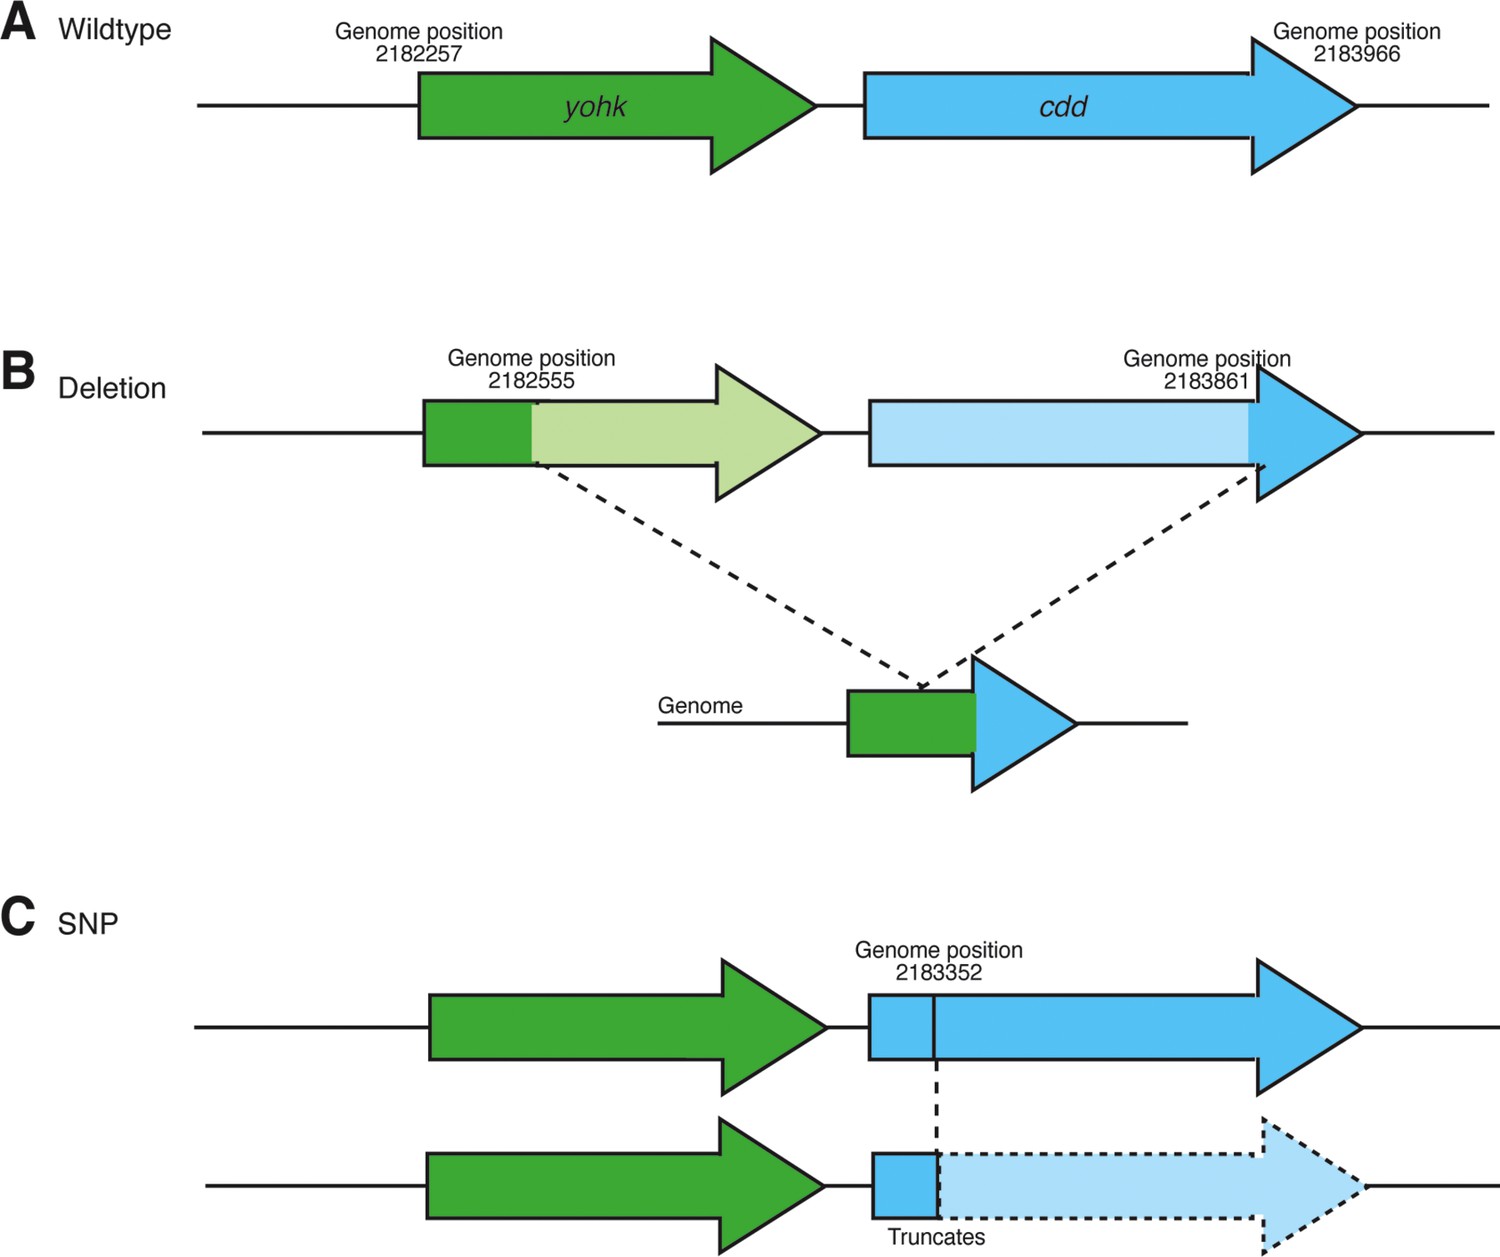
Schematic showing mutations detected in the cdd locus upon genome sequencing of all evolution lines at transfer 30 (∆RNR_T30_1000_L1–5, ∆RNR_T30_250_L1–5).
(A) Wild-type genomic region. (B) Deletion of cdd and upstream gene (yohk) occurs in seven lines (Supplementary file 1F and G). (C) SNP in cdd locus of ∆RNR_T30_250_L5 results in ORF truncation at genomic position 2,183,352, resulting in a stop codon at codon position 91 in cdd.
Figure 8—figure supplement 3
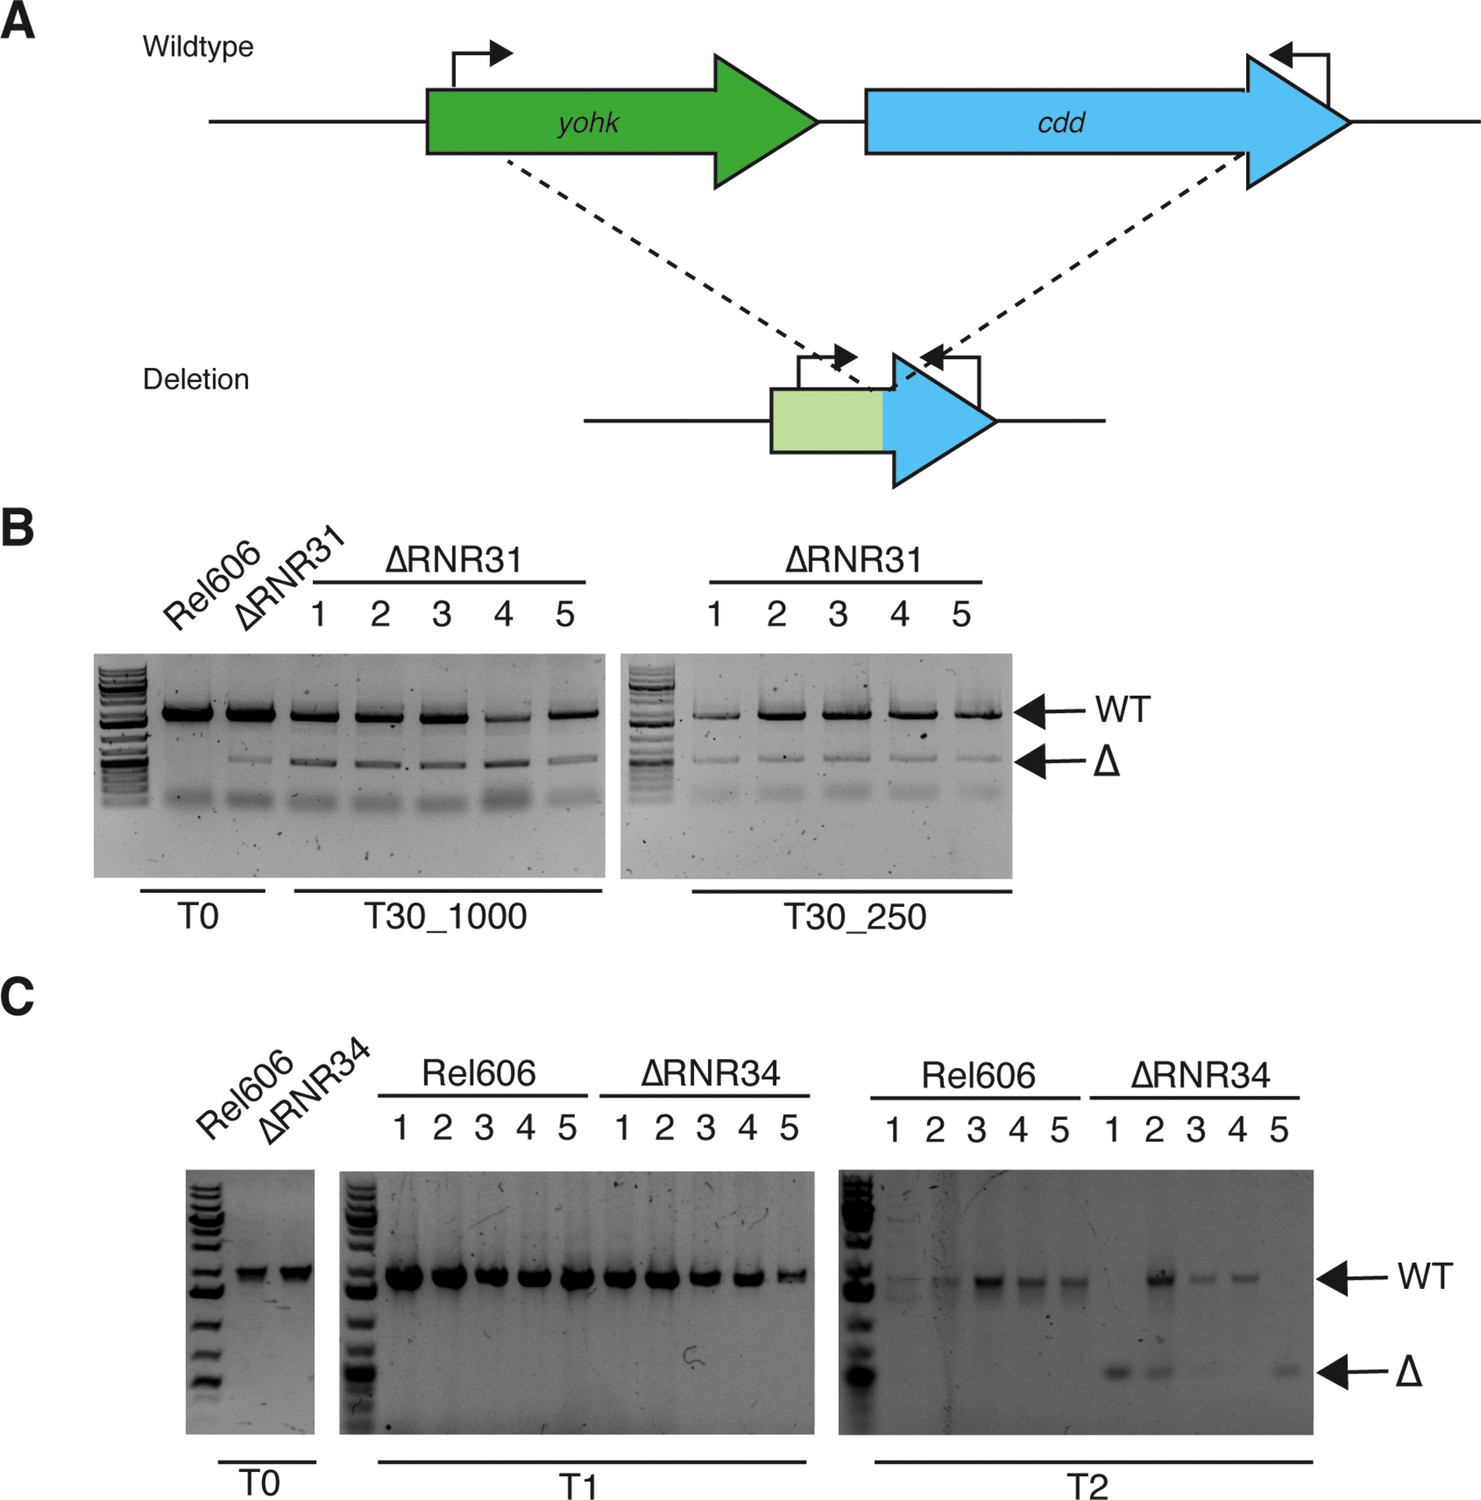
Genomic deletions of cdd in transfer 30 lines are also present in the ancestor but rapidly re-evolve under the same experimental conditions.
(A) Schematic indicating approximate position of primers. See Supplementary file 2 for primer sequences. (B) PCR shows cdd deletion in the ∆RNR31 (∆RNR_T0) population but not in wild-type. All 10 lines at T30 carry deletion as well as WT variant, suggesting that this deletion has not gone to fixation. (C) The population derived from another ∆RNR isolate (∆RNR34) lacks the cdd deletion (left panel). The cdd locus was monitored in the cell populations over two transfers. By the second transfer (T2), evidence of cdd deletion appeared in four lines (1–3, 5), indicating it is readily lost under the conditions of the evolution experiment. Lines grown in MOPS + 1% glucose + 250 μg/mL deoxyribonucleosides (dNs). Note: experiment terminated after two transfers due to COVID-related lockdown.
-
Figure 8—figure supplement 3—source data 1
This file contains unlabelled and labelled full gel pictures for Figure 8—figure supplement 3.
- https://cdn.elifesciences.org/articles/83845/elife-83845-fig8-figsupp3-data1-v2.zip
Figure 8—figure supplement 4
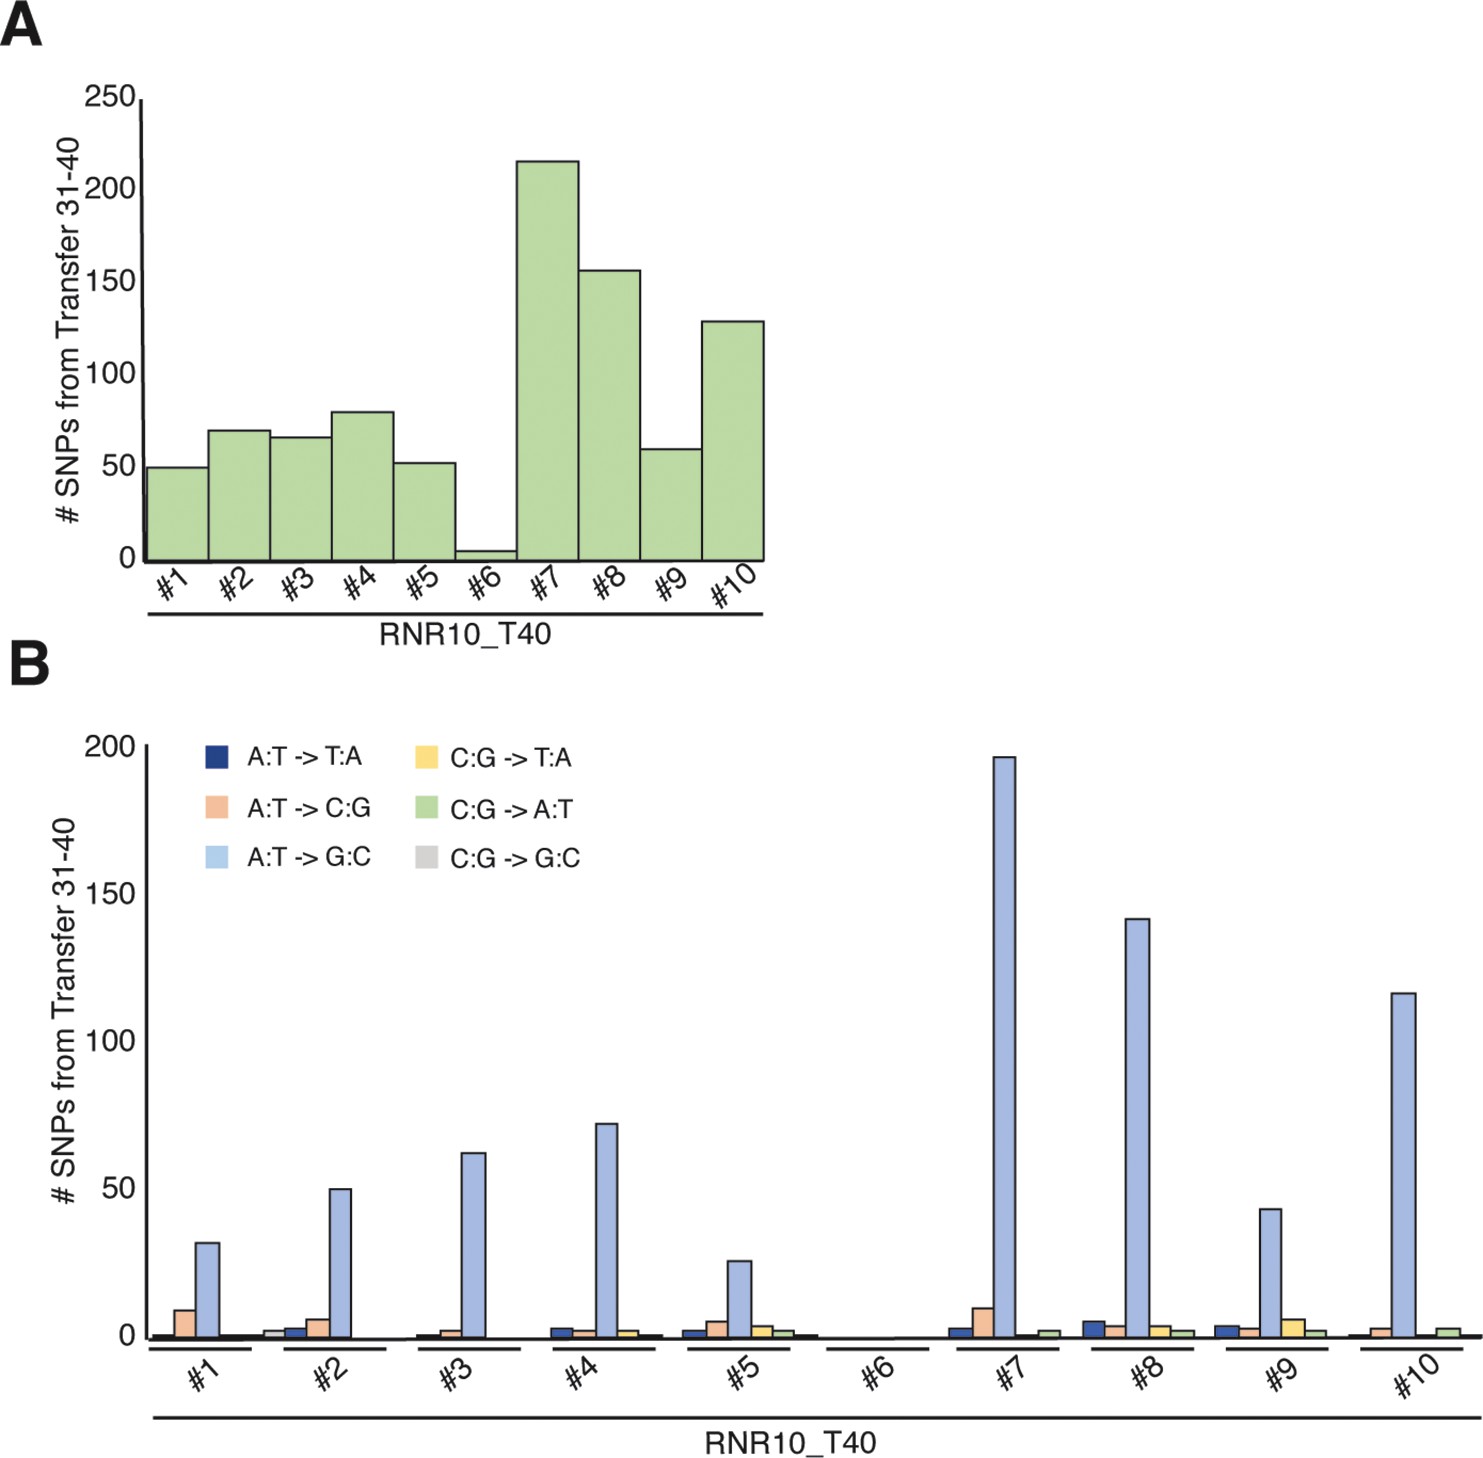
Overview of mutational changes after experimental evolution for 10 transfers (transfers 31–40).
(For a description of the lines, see Figure 5.) (A) Total SNPs present in each line at T40. (B) Types of mutations for all SNPs over the genome.
Figure 9
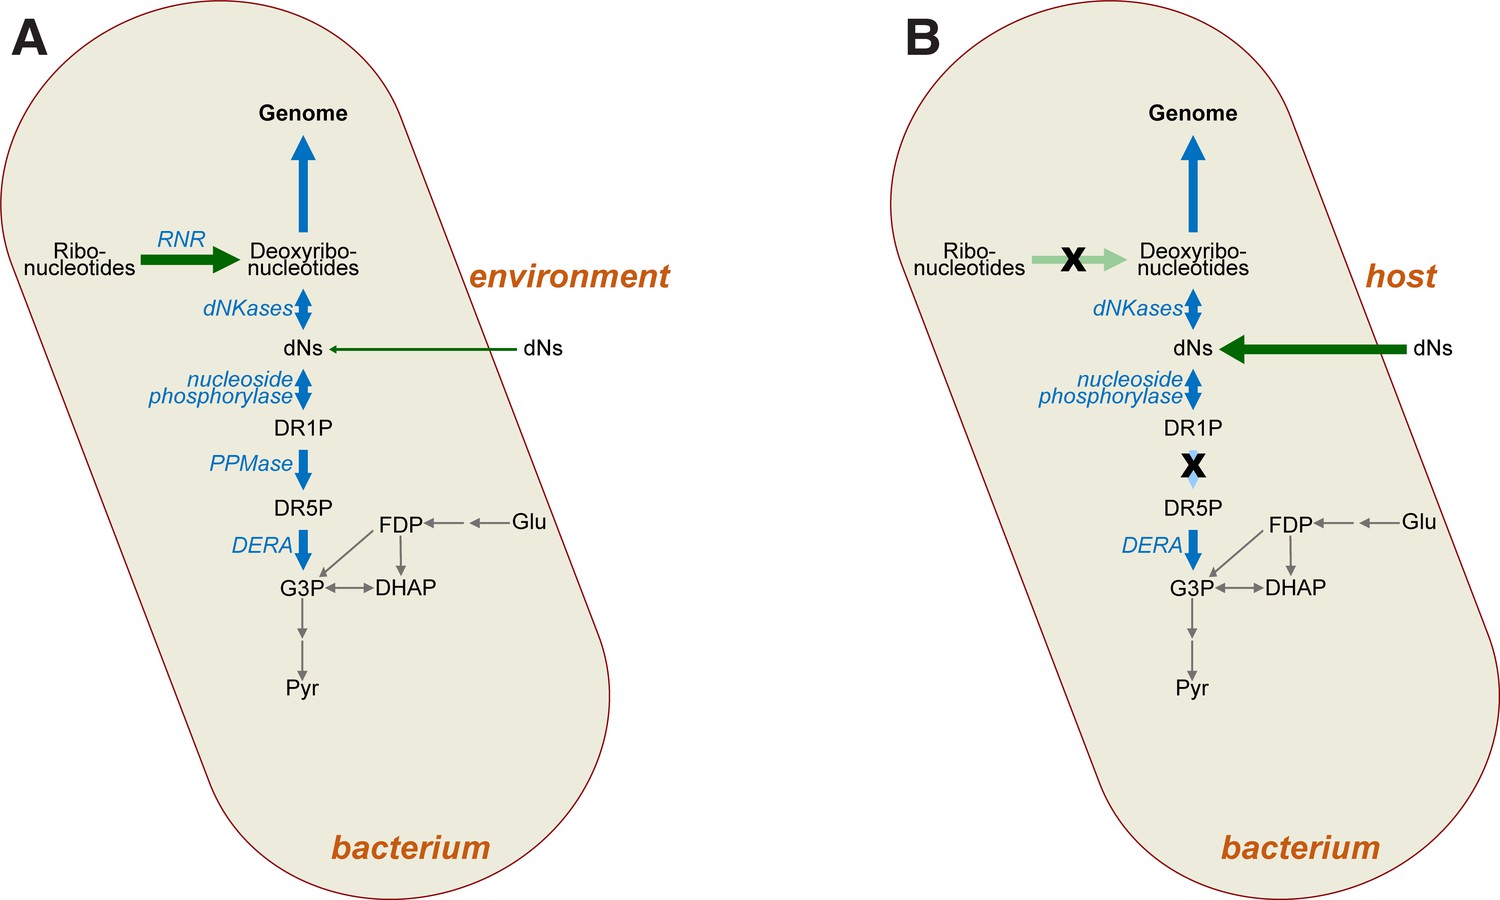
Impact of mutations on deoxyribonucleotide synthesis.
(A) Deoxyribonucleotides in free-living bacteria are primarily synthesised intracellularly via ribonucleotide reduction (RNR), with some uptake of deoxyribonucleosides (dNs) from the environment also possible in principle. Deoxyribonucleotides are required for genome synthesis, but may also be metabolised via the DERA pathway, the end product (G3P) of which feeds into glycolysis (grey arrows). (B) In intracellular bacteria lacking RNR (crossed-out light green arrow), deoxyribonucleotides must instead be derived from the host as dNs (dark green arrow). Loss of RNR leads to loss of phosphopentomutase (PPMase) activity (crossed-out light blue arrow), which prevents loss of dNs via glycolysis. Abbreviations: RNR—ribonucleotide reductase; dNs—deoxyribonucleosides; DR1P—2-deoxyribose 1-phosphate; DR5P—2-deoxyribose 5-phosphate; G3P—D-glyceraldehyde 3-phosphate; DHAP—dihydroxyacetone phosphate; Glu—glucose; FDP—fructose 1,6-diphosphate; Pyr—pyruvate, dNKases—deoxynucleotide kinases; DERA—deoxyriboaldolase.
Tables
Table 1
Genome sequencing of ∆RNR10_T40 lines identifies multiple mutations to deoB.
| Mutation | Location in ORF | Effect | Lines impacted |
|---|---|---|---|
| Substitution | 1057 (A→C) | AA substitution (T353P) | L1 L8 |
| Deletion | 583 (G(1)→G(0)) | ORF truncation (frameshift) | L2 |
| Deletion | 926 (G(4)→G(3)) | ORF truncation (frameshift) | L3 L5 L10 |
| Substitution | 932 (A→C) | AA substitution (H311P) | L4 |
| Substitution | 1147 (A→C) | AA substitution (T383P) | L6 |
Table 2
Predicted impact of observed deoB mutations on phosphopentomutase function.
| B. cereus PPMase* | E. coli PPMase† | L1, L8 | L2 | L4 | L6 | L3, L5, L10 |
|---|---|---|---|---|---|---|
| Active site residues | ||||||
| D13 | D10 | ✓ | ✓ | ✓ | ✓ | ✓ |
| T85 | T98 | ✓ | ✓ | ✓ | ✓ | ✓ |
| D156 | D173 | ✓ | ✓ | ✓ | ✓ | ✓ |
| D286 | D306 | ✓ | - | ✓ | ✓ | ✓ |
| H291 | H311 | ✓ | - | H311P | ✓ | - |
| A327 | D347 | ✓ | - | ✓ | ✓ | - |
| H328 | H348 | ✓ | - | ✓ | ✓ | - |
| H339 | H359 | ✓ | - | ✓ | ✓ | - |
| Non-active site residues | ||||||
| I333 | T353 | T353P | - | ✓ | ✓ | - |
| T365 | T383P | ✓ | - | ✓ | T383P | - |
-
*
PDB ID: 3M8W.
-
†
Homologous residues derived from multiple sequence alignment (Supplementary file 3).
Additional files
-
Supplementary file 1
Containing the following data, each in a separate sheet.
(A) E. coli strains; (B) primers; (C) mutations in ΔRNR ancestor; (D) DRNR cells are elongated relative to wild-type; (E) T30 SNPs; (F) mutations to the cdd gene in T30 lines; (G) independent SNPs in T30 lines that impact the same locus; (H) T40 SNPs; (I) independent SNPs in T40 lines that impact the same locus; (J) query sequences for blastp searches; (K) Blastp search results confirm absence of ribonucleotide reductases (RNRs) and PPM in species listed in Lundin et al., 2009; (L) Candidatus Ureaplasma intestinipullorum hits; (M) Candidatus Borreliella tachyglossi hits; (N) Buchnera comparative analysis.
- https://cdn.elifesciences.org/articles/83845/elife-83845-supp1-v2.xlsx
-
Supplementary file 2
dAK gene from M. mycoides (mm-dAK) codon-optimised for E. coli (GenScript).
- https://cdn.elifesciences.org/articles/83845/elife-83845-supp2-v2.zip
-
Supplementary file 3
Alignment of phosphopentomutases.
- https://cdn.elifesciences.org/articles/83845/elife-83845-supp3-v2.zip
-
MDAR checklist
- https://cdn.elifesciences.org/articles/83845/elife-83845-mdarchecklist1-v2.docx
Download links
A two-part list of links to download the article, or parts of the article, in various formats.
Downloads (link to download the article as PDF)
Open citations (links to open the citations from this article in various online reference manager services)
Cite this article (links to download the citations from this article in formats compatible with various reference manager tools)
Characterisation of an Escherichia coli line that completely lacks ribonucleotide reduction yields insights into the evolution of parasitism and endosymbiosis
eLife 12:e83845.
https://doi.org/10.7554/eLife.83845


