O-GlcNAc glycosylation orchestrates fate decision and niche function of bone marrow stromal progenitors
- Department of Integrative Biology and Physiology, University of Minnesota Medical School, United States
- Laboratory of Gastrointestinal Microbiology, Jiangsu Key Laboratory of Gastrointestinal Nutrition and Animal Health, College of Animal Science and Technology, Nanjing Agricultural University, China
- National Center for International Research on Animal Gut Nutrition, Nanjing Agricultural University, China
- Department of Medical Anatomical Sciences, College of Osteopathic Medicine of the Pacific, Western University of Health Sciences, United States
- Department of Biomedical Education and Anatomy, The Ohio State University College of Medicine, and Division of Biosciences, The Ohio State University College of Dentistry, United States
- Department of Cell and Molecular Pharmacology & Experimental Therapeutics, Medical University of South Carolina, United States
- Department of Pharmaceutical Chemistry, University of California, San Francisco, United States
- Division of Rheumatology, Department of Internal Medicine, Mayo Clinic, United States
- Department of Immunology, Mayo Clinic, United States
- Department of Developmental and Surgical Sciences, School of Dentistry, University of Minnesota, United States
- Center for Immunology, University of Minnesota Medical School, United States
Figures
Figure 1 with 1 supplement
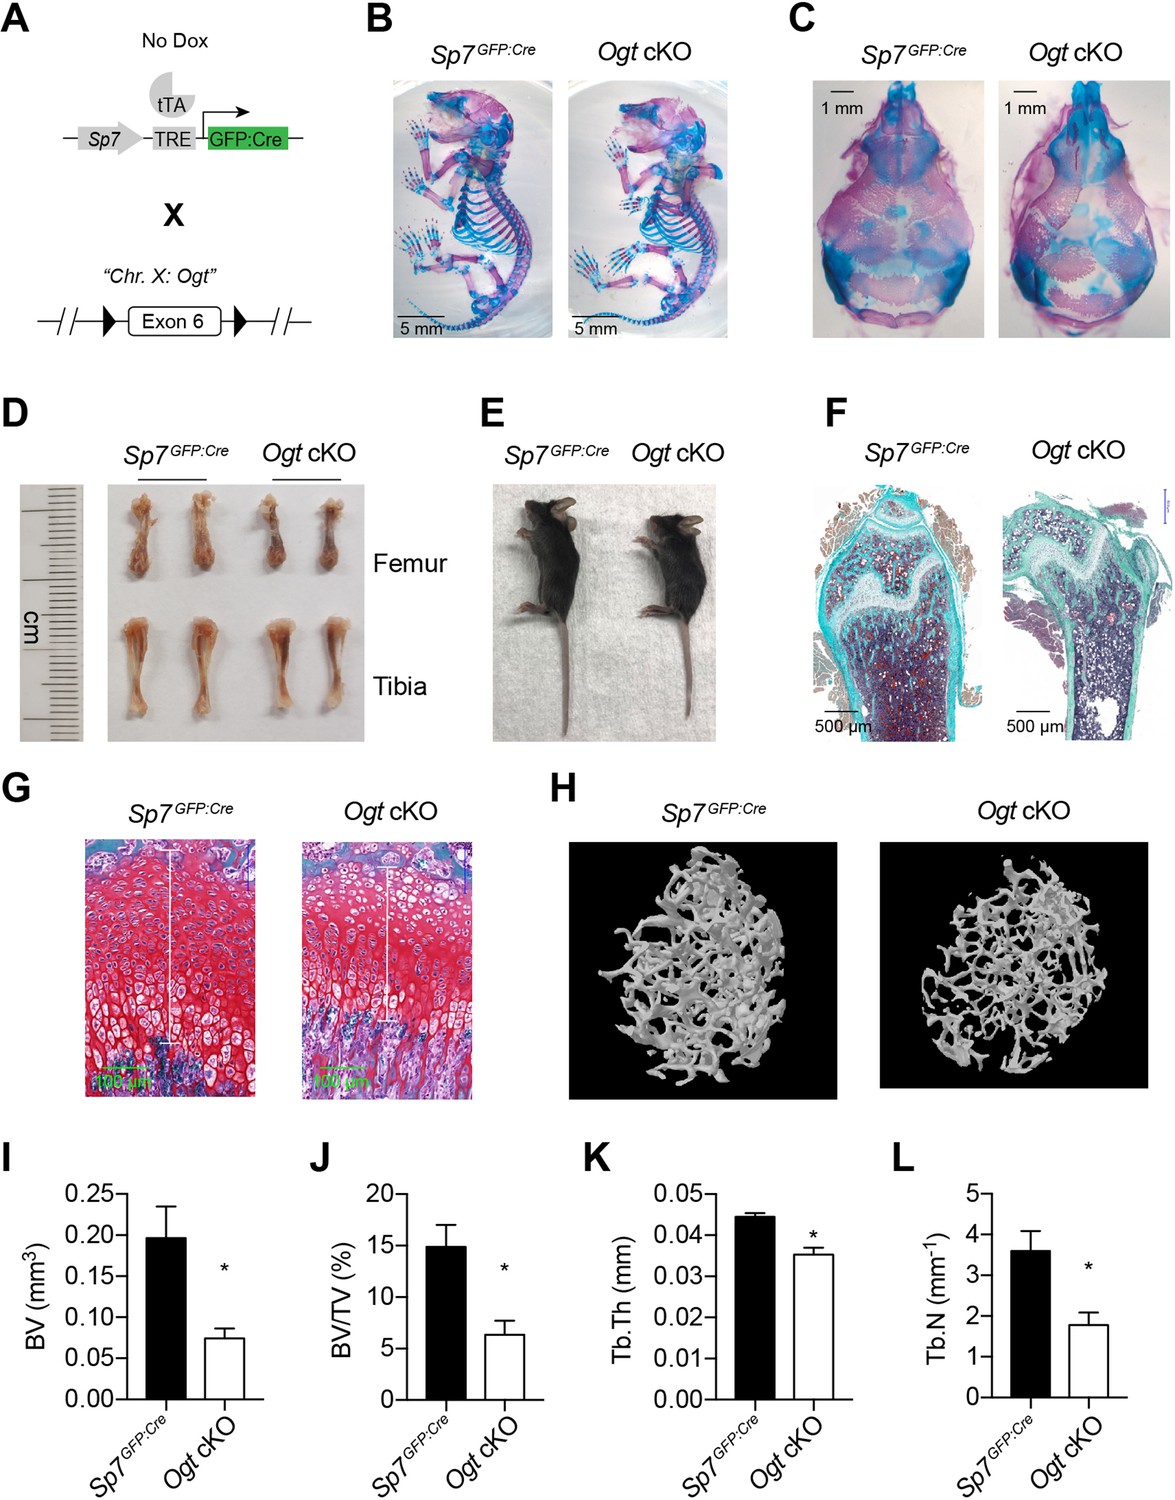
Impaired osteogenesis in Ogt cKO mice.
(A) Mating strategy to generate Ogt cKO mice. Note that the Ogt gene is located on Chr. X, thus males are hemizygous Ogtfl/Y. (B, C) Whole mount Alizarin red and Alcian blue staining of newborn mice. (D, E) Long bone length (D) and gross morphology of 4–6 weeks old mice. (F, G) Goldner’s trichrome (F) and Safranin O (G) staining of femurs from 4-week-old mice. (H–L) Micro-CT of 6-week-old mice (H, n=3–4). Bone volume (BV, I), BV/tissue volume ratio (BV/TV, J), trabecular thickness (Tb.Th, K), and trabecular number (Tb.N, L) were calculated. Data are presented as mean ± SEM. *, p<0.05 by unpaired student’s t-test.
Figure 1—figure supplement 1
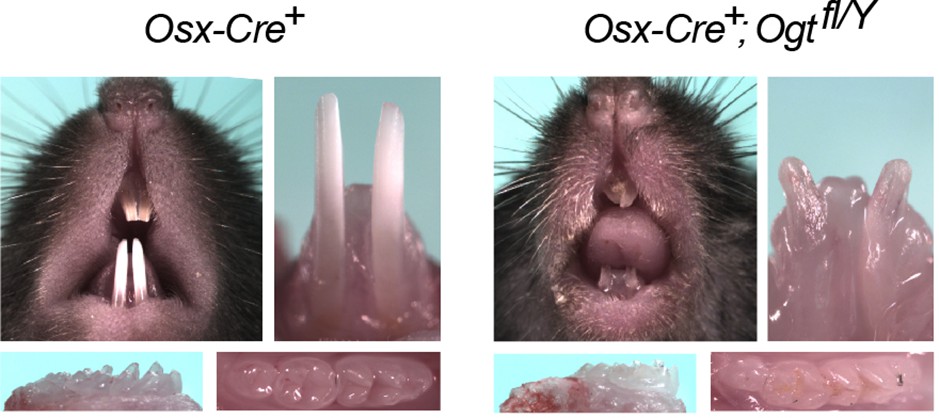
Dental defects of Ogt cKO mice.
Top: photographic analysis of incisor tooth development. Bottom: photographic analysis of molar tooth development.
Figure 2

RUNX2 O-GlcNAcylation is required for osteogenesis.
(A) Alkaline phosphatase (ALP) staining of control and Ogt cKO BMSCs differentiated to the osteogenic lineage. (B, C) Primary BMSCs, in the presence or absence of the OGT inhibitor OSMI-1, were induced for osteogenesis and stained for ALP (B) and Alizarin Red S (C). (D) Primary BMSCs were treated with PTH for the indicated time and subjected to Western blotting of total protein O-GlcNAcylation. (E) BMSCs were treated with PTH alone or together with OSMI-1, osteogenic differentiated, and stained for ALP (n=3). (G) Flag-tagged wildtype (WT) and O-GlcNAc mutant (3A) RUNX2 plasmids were overexpressed in HEK293 cells, and their O-GlcNAcylation was determined by Flag immunoprecipitation followed with O-GlcNAc western blot. (H) 6xOSE-luciferase activity in COS-7 cells transfected with WT or 3A-mutant RUNX2, in the presence or absence of the OGT inhibitor, OSMI-1. (I, J) C3H10T1/2 cells with lentiviral overexpression of RUNX2 were osteogenically differentiated and stained with ALP or Alizarin Red S (I). Expression of Bglap and Rankl was determined by RT-qPCR (J). Data are presented as mean ± SEM. *, p<0.05; **, p<0.01; and ***, p<0.001 by two-way ANOVA (H) or one-way ANOVA (J). Representative images from at least three biological replicates were shown in A, B, C, E, and I.
-
Figure 2—source data 1
Raw uncropped images for panel D.
- https://cdn.elifesciences.org/articles/85464/elife-85464-fig2-data1-v2.zip
-
Figure 2—source data 2
Raw uncropped images for panel G.
- https://cdn.elifesciences.org/articles/85464/elife-85464-fig2-data2-v2.zip
Figure 3
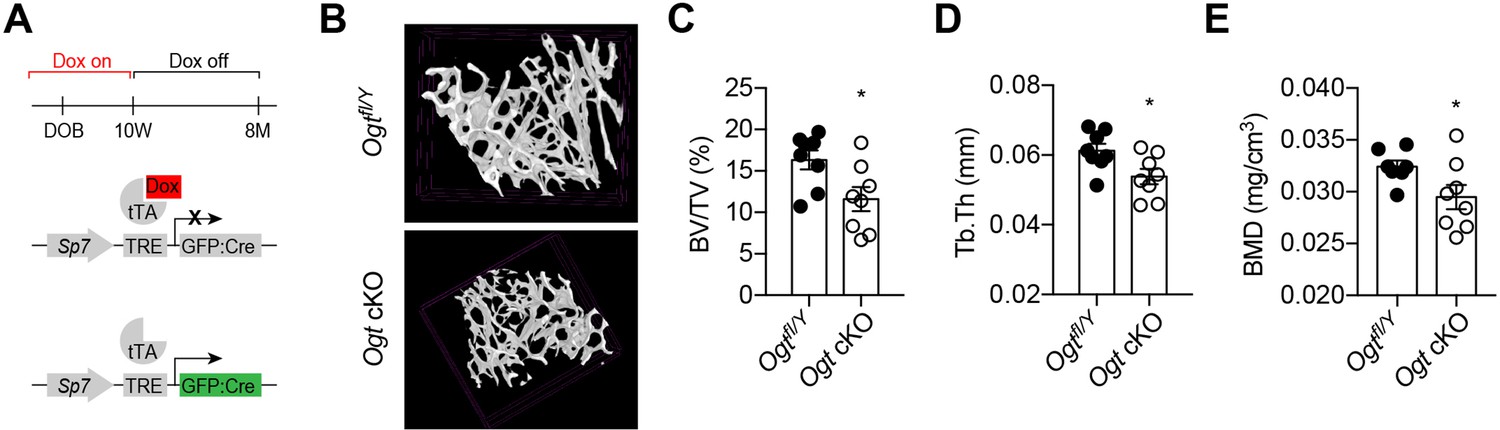
Adult-onset deletion of OGT impairs trabecular bone formation.
(A) Dox treatment timeline in Ogt cKO to achieve osteoblast-specific deletion of OGT. (B–D) Micro-CT (B) showing reduced bone volume/tissue volume (C), trabecular thickness (D), and trabecular bone mineral density (E). Data are presented as mean ± SEM.*, p<0.05 by unpaired student’s t-test.
Figure 4 with 3 supplements
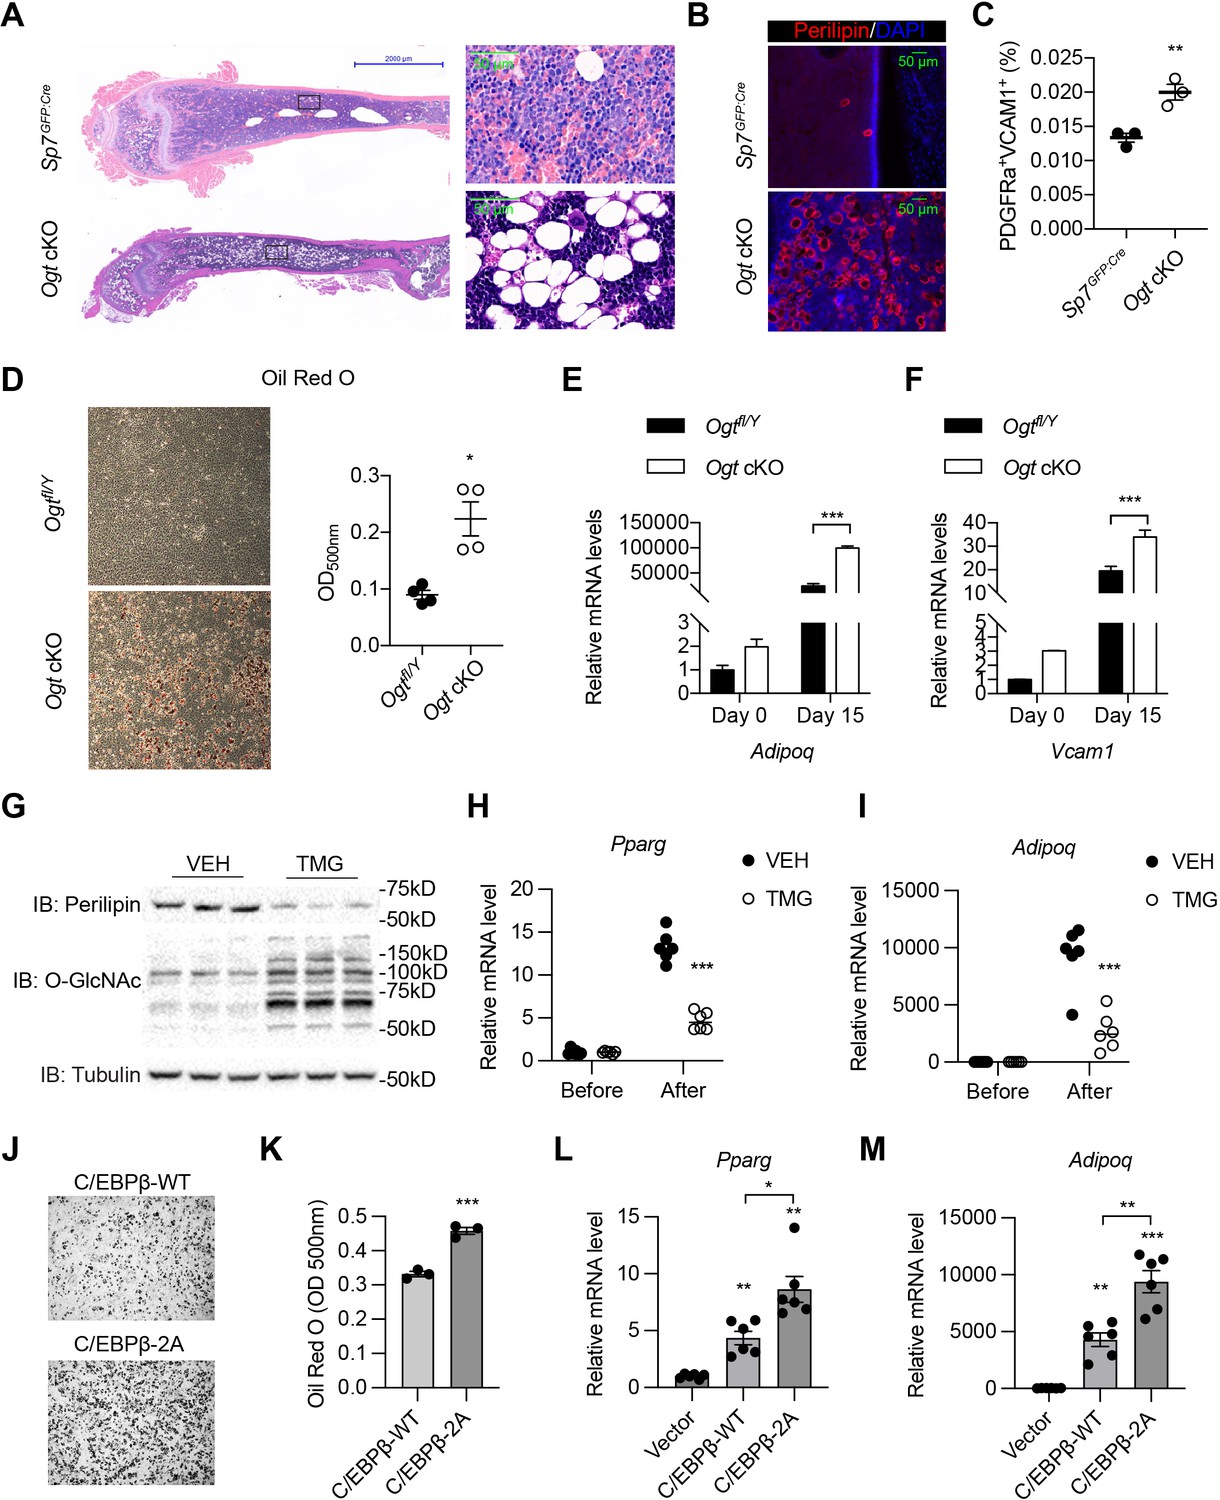
O-GlcNAcylation inhibits BM adipogenesis.
(A, B) H&E (A) and Perilipin immunofluorescent staining (B) on femur sections from 4-week-old mice. (C) Flow cytometric quantification of PDGFRa+VCAM1+ preadipocytes frequencies within the live BM cells (n=3). (D) Adipogenic differentiation of primary BMSCs from control and Ogt cKO mice. Lipid was stained with Oil Red O and quantified to the right (n=4). (E, F) Primary BMSCs were osteogenic differentiated for 0 or 15 days. Expression of Adipoq (E) and Vcam1 (F) genes was determined by RT-qPCR (n=3). (G–I) C3H10T1/2 cells, treated with or without TMG, were adipogenic differentiated. Western blotting for perilipin and O-GlcNAc of differentiated cells (G) and RT-qPCR for adipogenic marker Pparg (H) and Adipoq (I) expression. (J–M) Adipogenic differentiation of C3H10T1/2 cells infected with lentiviral C/EBPβ. Oil Red O was stained (J) and quantified (K). Pparg (L) and Adipoq (M) gene expression was determined by RT-qPCR. Data are presented as mean ± SEM.*, p<0.05; **, p<0.01; and ***, p<0.001 by unpaired student’s t-test (C, D, K), one-way ANOVA (L, M), and two-way ANOVA (E, F, H, I).
-
Figure 4—source data 1
Mass spectrometry search results of all protein modifications (Table S1) and PPARγ2 O-GlcNAc sites (Table S2).
- https://cdn.elifesciences.org/articles/85464/elife-85464-fig4-data1-v2.zip
-
Figure 4—source data 2
Raw uncropped images for panel G.
- https://cdn.elifesciences.org/articles/85464/elife-85464-fig4-data2-v2.zip
Figure 4—figure supplement 1
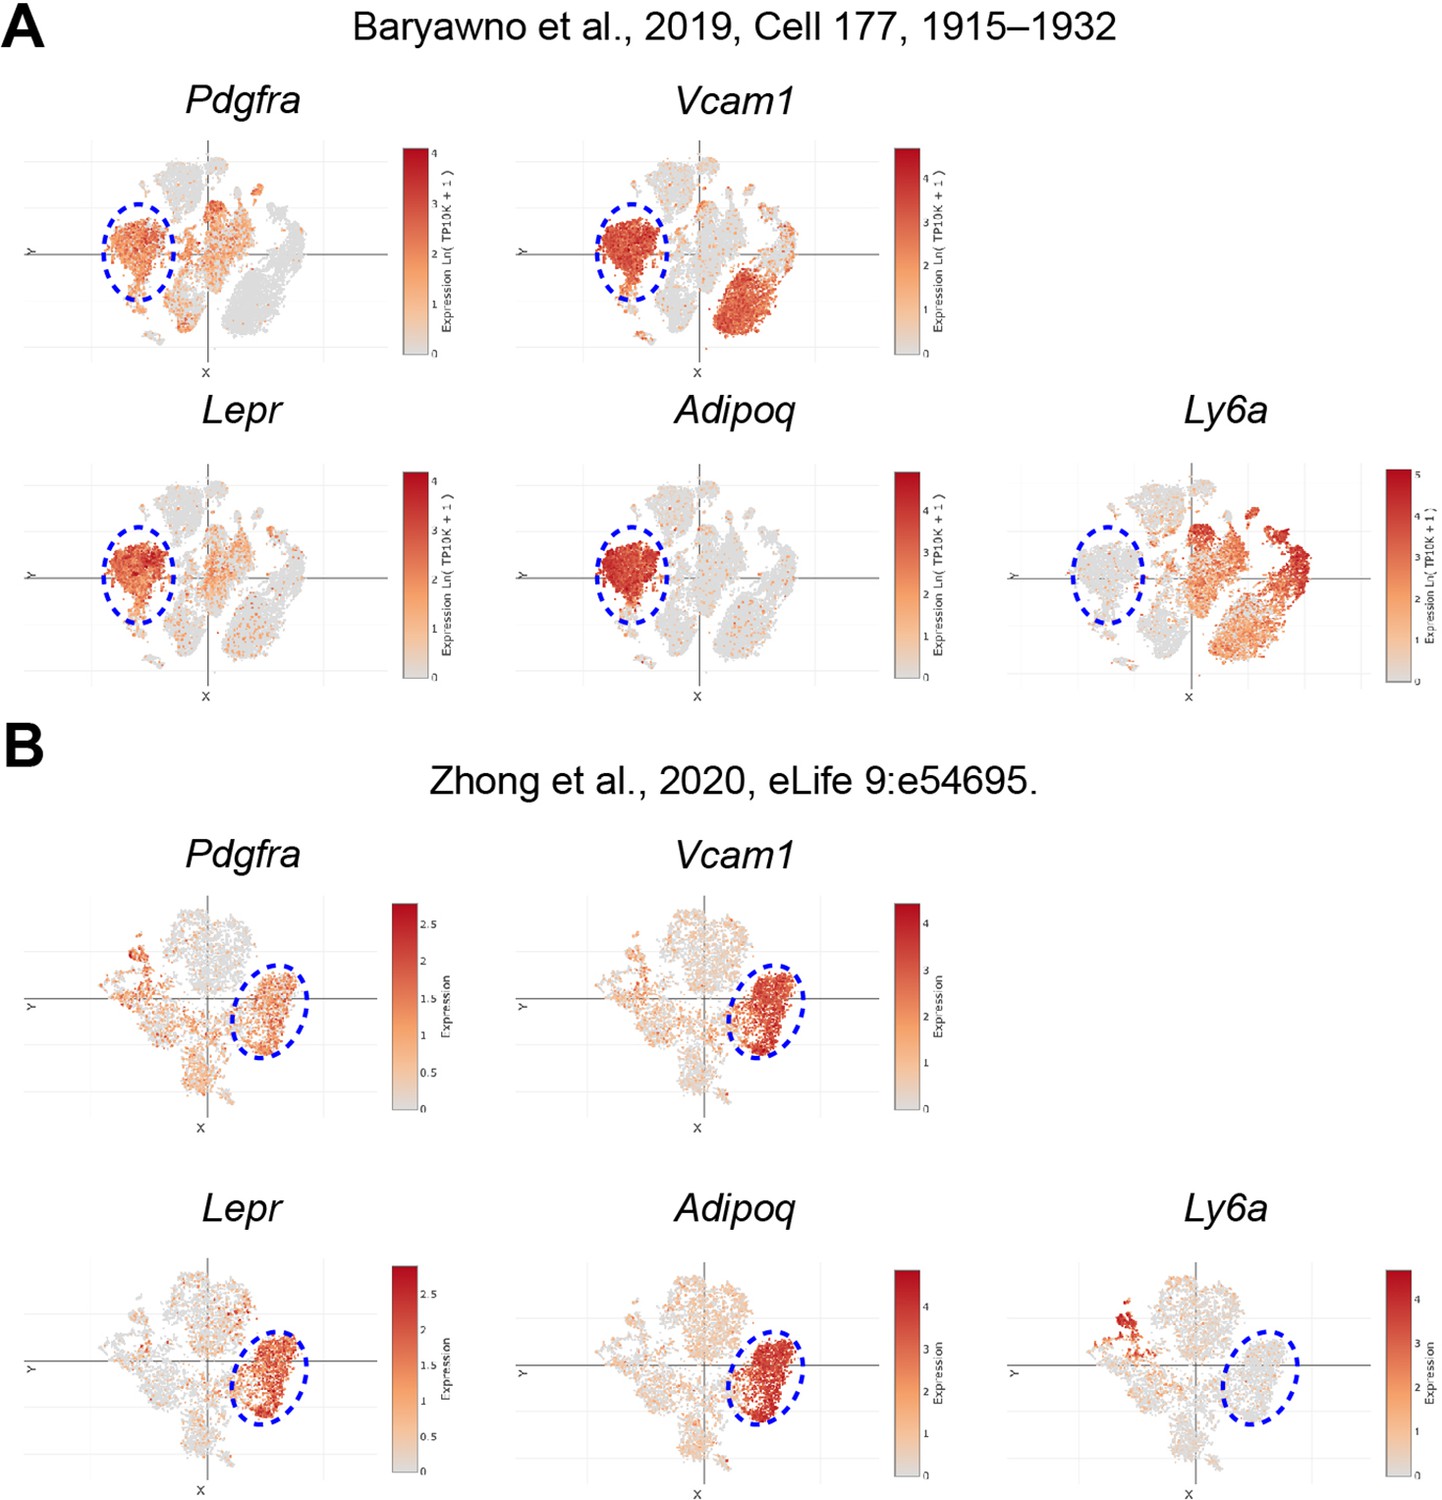
Pdgra+Vcam1+ cells as adipogenic progenitors.
Single-cell expression of Pdgfra, Vcam1, Lepr, Adipoq, and Ly6a genes in mouse BMSCs published by Baryawno et al. (A) and Zhong et al. (B) Data were visualized and plotted at Single Cell Portal (https://singlecell.broadinstitute.org/single_cell). Note that Ly6a (encoding Sca-1) marks more primitive mesenchymal stem cells, while Pdgfra, Vcam1, Lepr, and Adipoq collectively label the determined adipogenic precursors.
-
Figure 4—figure supplement 1—source data 1
Raw uncropped images for Figure 4—figure supplement 1B.
- https://cdn.elifesciences.org/articles/85464/elife-85464-fig4-figsupp1-data1-v2.zip
Figure 4—figure supplement 2
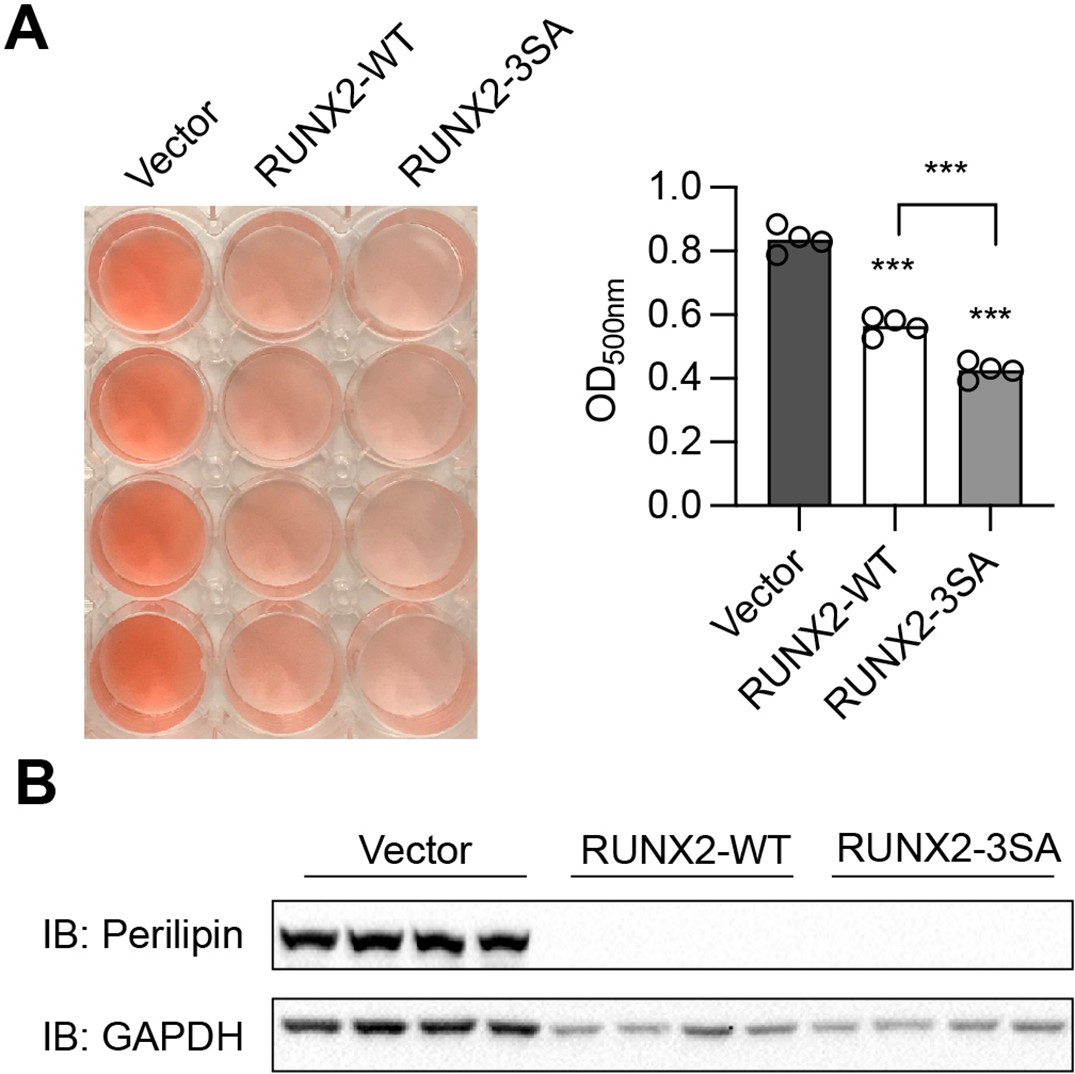
RUNX2 inhibits adipogenesis independently of O-GlcNAcylation.
C3H10T1/2 cells were infected with lentiviruses expressing WT- or O-GlcNAc-deficient (3SA)- RUNX2, then induced for adipogenic differentiation. Adipogenesis was quantified by Oil Red O staining (A) and Perilipin western blotting (B). Data are presented as mean ± SEM. ***, p<0.01 by one-way ANOVA.
Figure 4—figure supplement 3
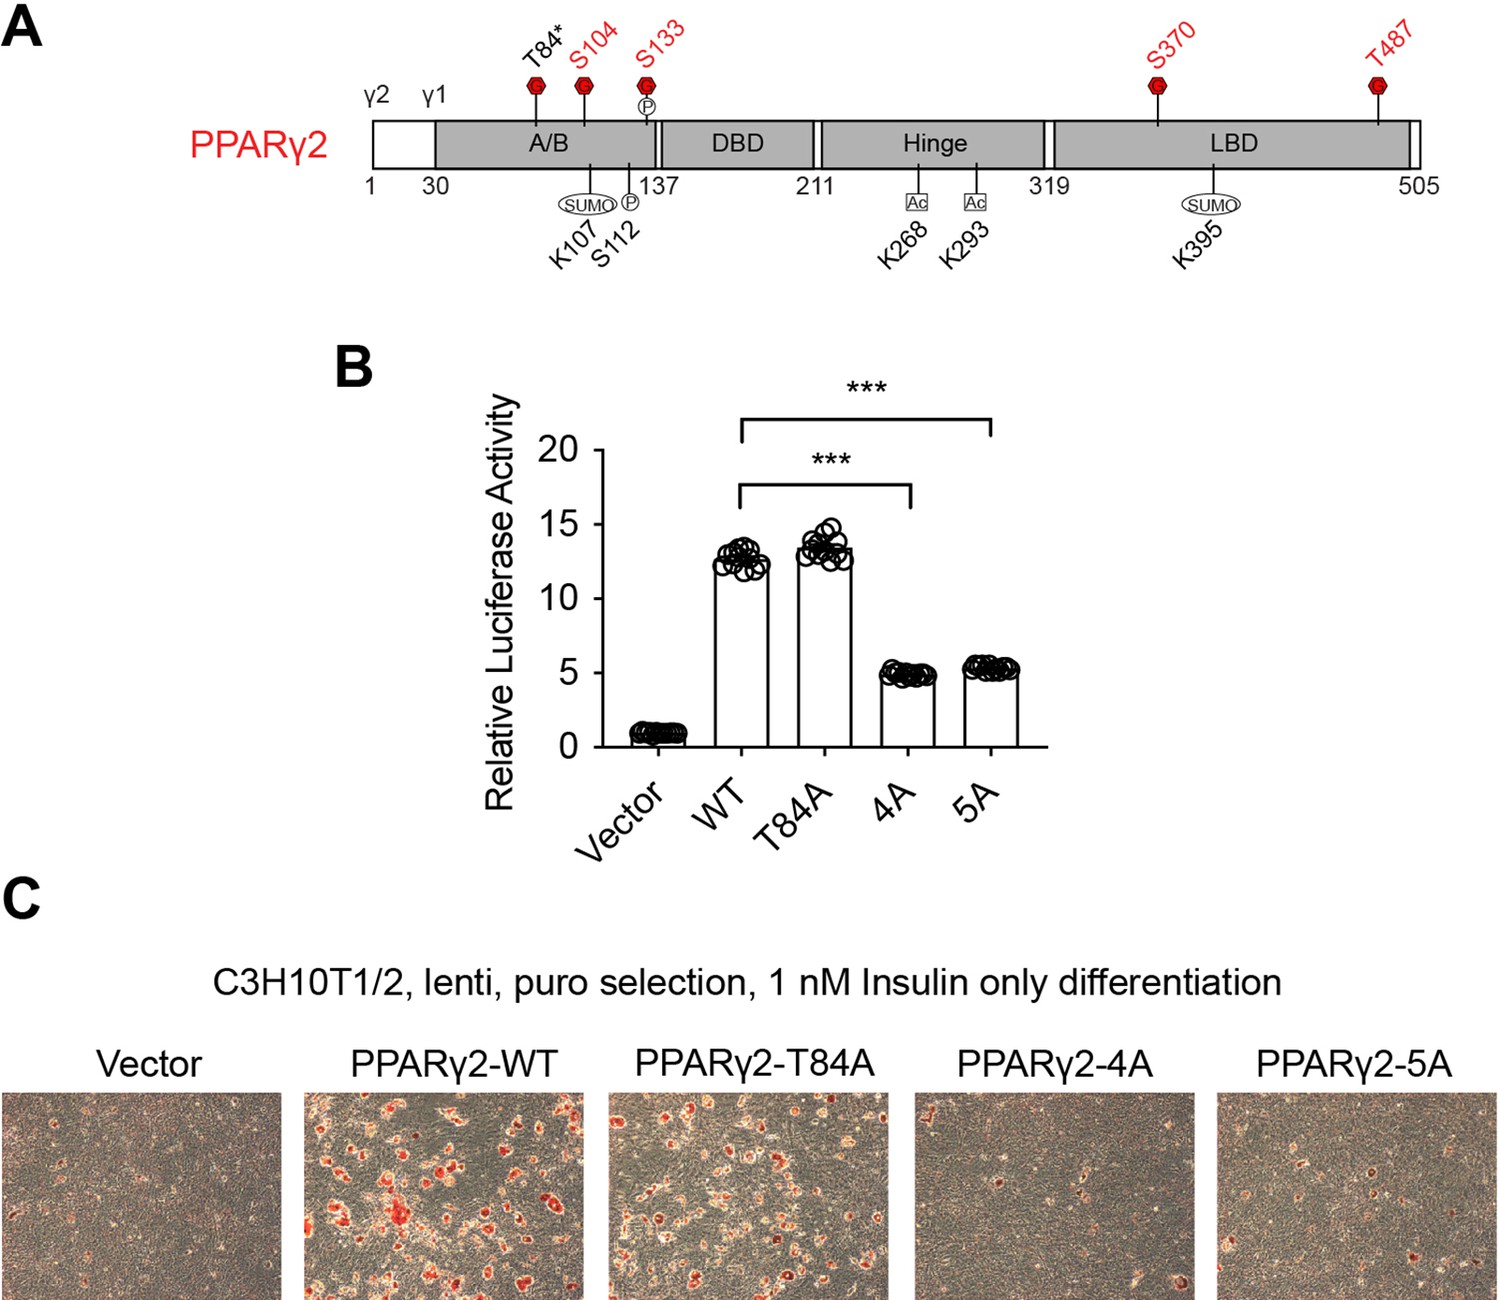
PPARγ2 O-GlcNAcylation is required for adipogenesis.
(A) PPARγ2 protein domains with the O-GlcNAc site shown in red. (P)hosphorylation, (SUMO)lation and (Ac)etylation sites were also shown. (B) Previously known (T84) and newly identified (S104, S133, S370, and T487) O-GlcNAc sites were mutated to alanine separately (T84A and 4A, respectively) or together (5A). PPRE-luciferase assay of PPARγ2 was performed. Data are presented as mean ± SEM. ***, p<0.01 by one-way ANOVA. (C) C3H10T1/2 cells were infected with lentiviral PPARγ2, induced to become adipocytes in the presence of only insulin, and stain with Oil Red O.
Figure 5 with 1 supplement
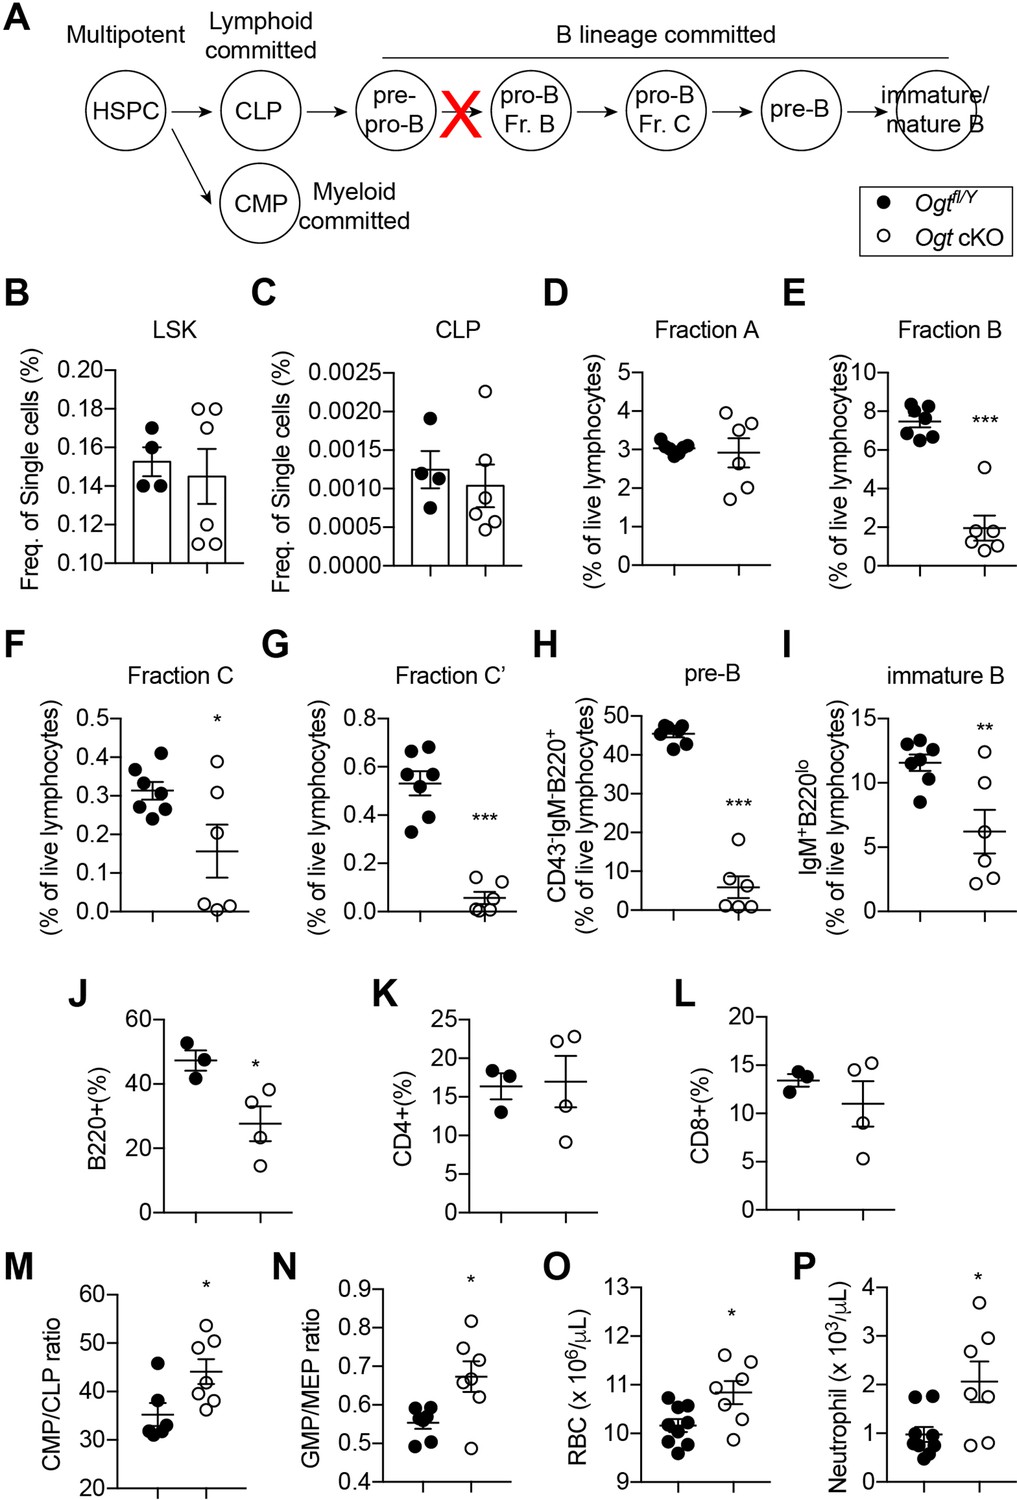
Impaired B lymphopoiesis and myeloid skewing in Ogt cKO mice.
(A) Schematic view of B cell development in the BM and blockade by stromal OGT deficiency (red X). (B–C) Flow cytometric quantification of LSK (B) and CLP (C) among live BM cells (n=4–6). (D–I) Flow cytometric quantification of fraction A (D), fraction B (E), fraction C (F), fraction C’ (G), fraction D (H), and immature B (I) frequencies among live BM lymphocytes (n=6–7). (J–L) Flow cytometric quantification of B220+ B cell (J), CD4+ T cell (K), and CD8+ T cell (L) percentages in the blood (n=3–4). (M, N) CMP/CLP ratio (M) and GMP/EMP ratio (N) in the BM (n=6–7). (O, P) Complete blood counting showing numbers of RBC (O) and neutrophil (P) (n=7–9). Data are presented as mean ± SEM. *, p<0.05; **, p<0.01; and ***, p<0.001 by unpaired student’s t-test.
-
Figure 5—source data 1
Antibodies used for flow cytometry.
- https://cdn.elifesciences.org/articles/85464/elife-85464-fig5-data1-v2.zip
Figure 5—figure supplement 1
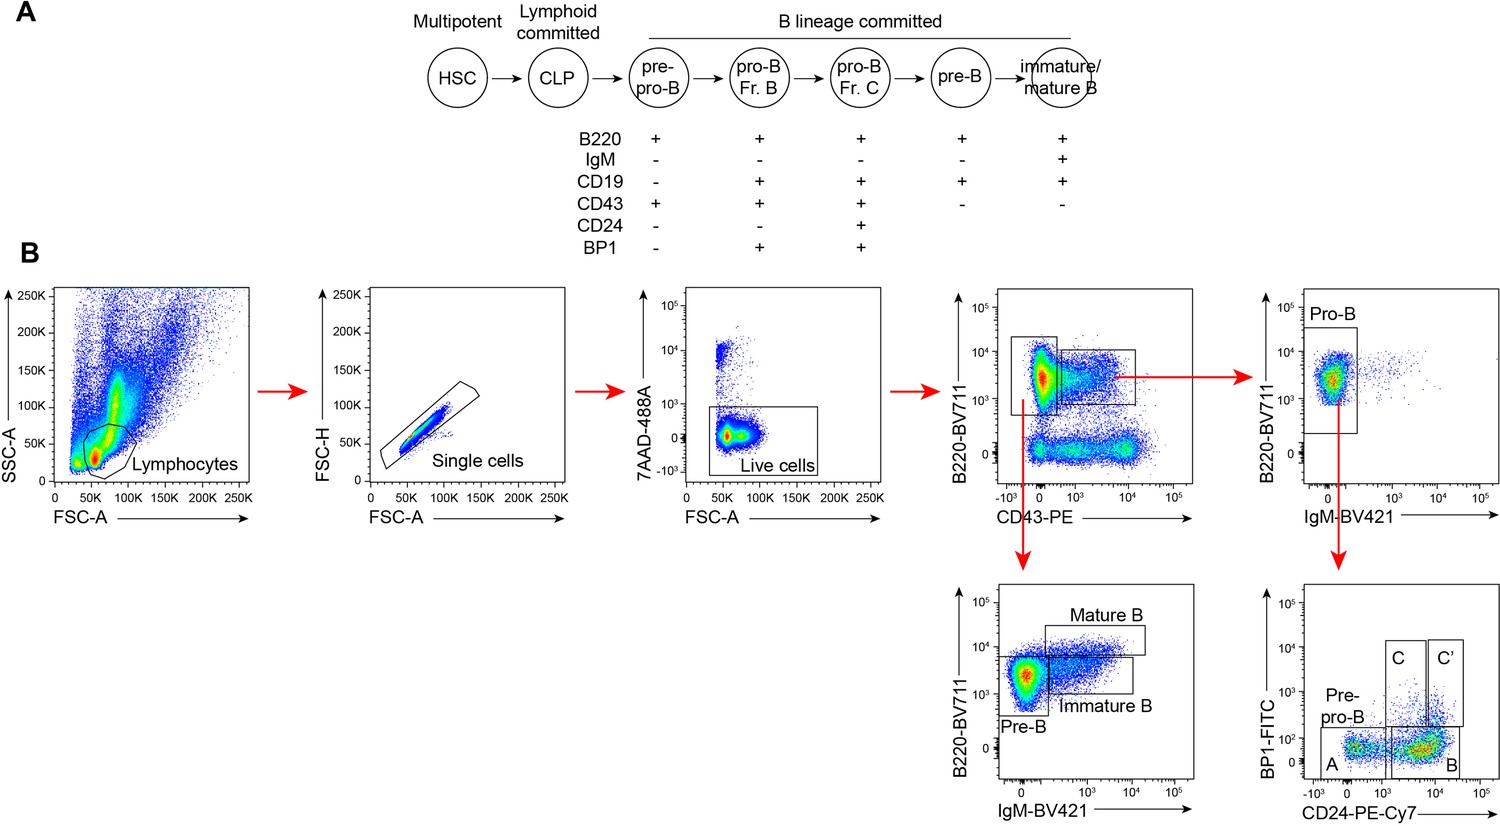
Flow cytometry of BM B cells.
(A) B cell lineage development and surface markers used for flow cytometry. (B) Gating strategy for B cell populations.
Figure 6
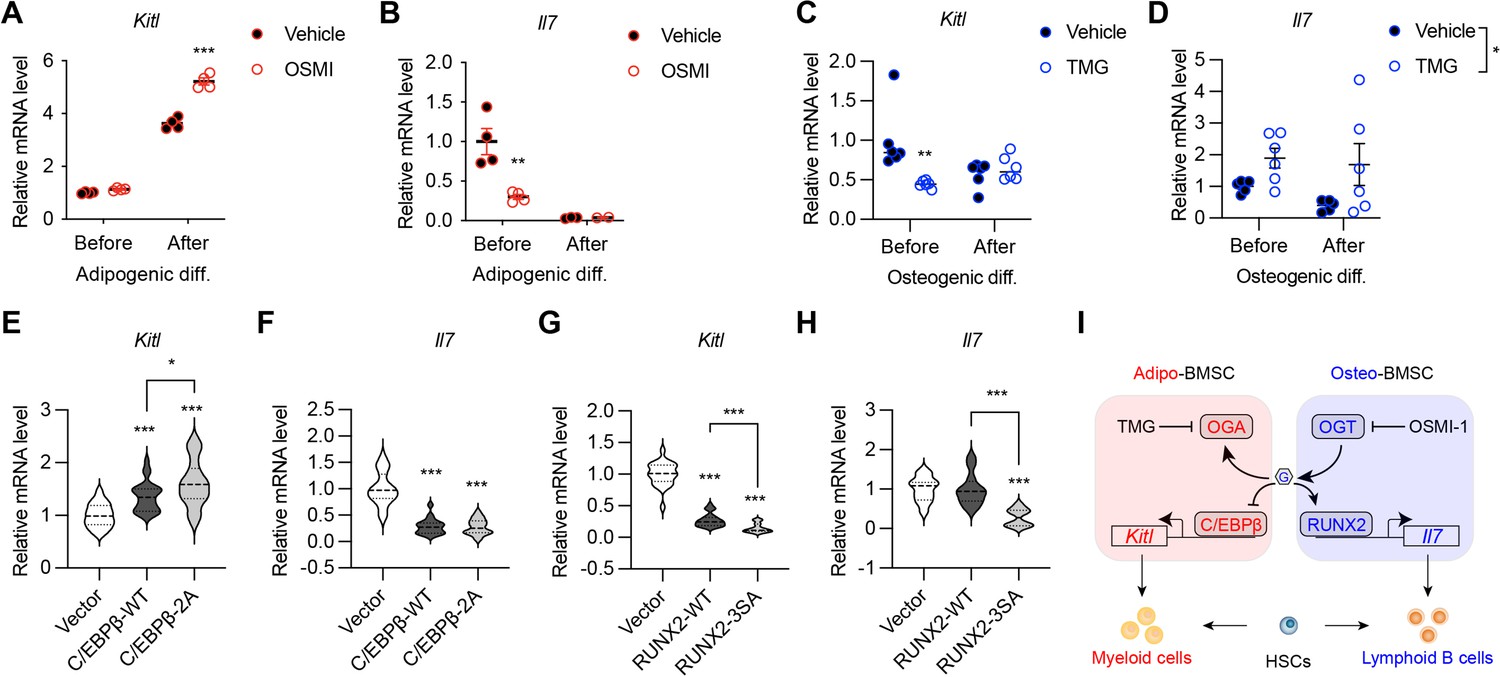
O-GlcNAc regulation of niche cytokine expression.
(A, B) C3H10T1/2 cells were treated with vehicle or OGT inhibitor OSMI and differentiated for adipocytes (n=4). Kitl (A) and Il7 (B) gene expression was determined by RT-qPCR. (C, D) C3H10T1/2 cells were treated with vehicle or OGA inhibitor TMG and induced for osteogenic differentiation (n=6). Kitl (C) and Il7 (D) gene expression was determined by RT-qPCR. (E–H) C3H10T1/2 cells were infected with lentiviruses expressing WT and O-GlcNAc-deficient C/EBPβ (E, F) or RUNX2 (G, H). Expression Kitl (E, G) and Il7 (F, H) was measured by RT-qPCR (n=6). (I) Proposed action of protein O-GlcNAcylation in regulating the BMSC niche function. Data are presented as mean ± SEM. *, p<0.05; **, p<0.01; ***, p<0.001 by two-way ANOVA (A–D) and one-way ANOVA (E–H).
-
Figure 6—source data 1
Sequences of oligos used for RT-qPCR.
- https://cdn.elifesciences.org/articles/85464/elife-85464-fig6-data1-v2.zip
Figure 7
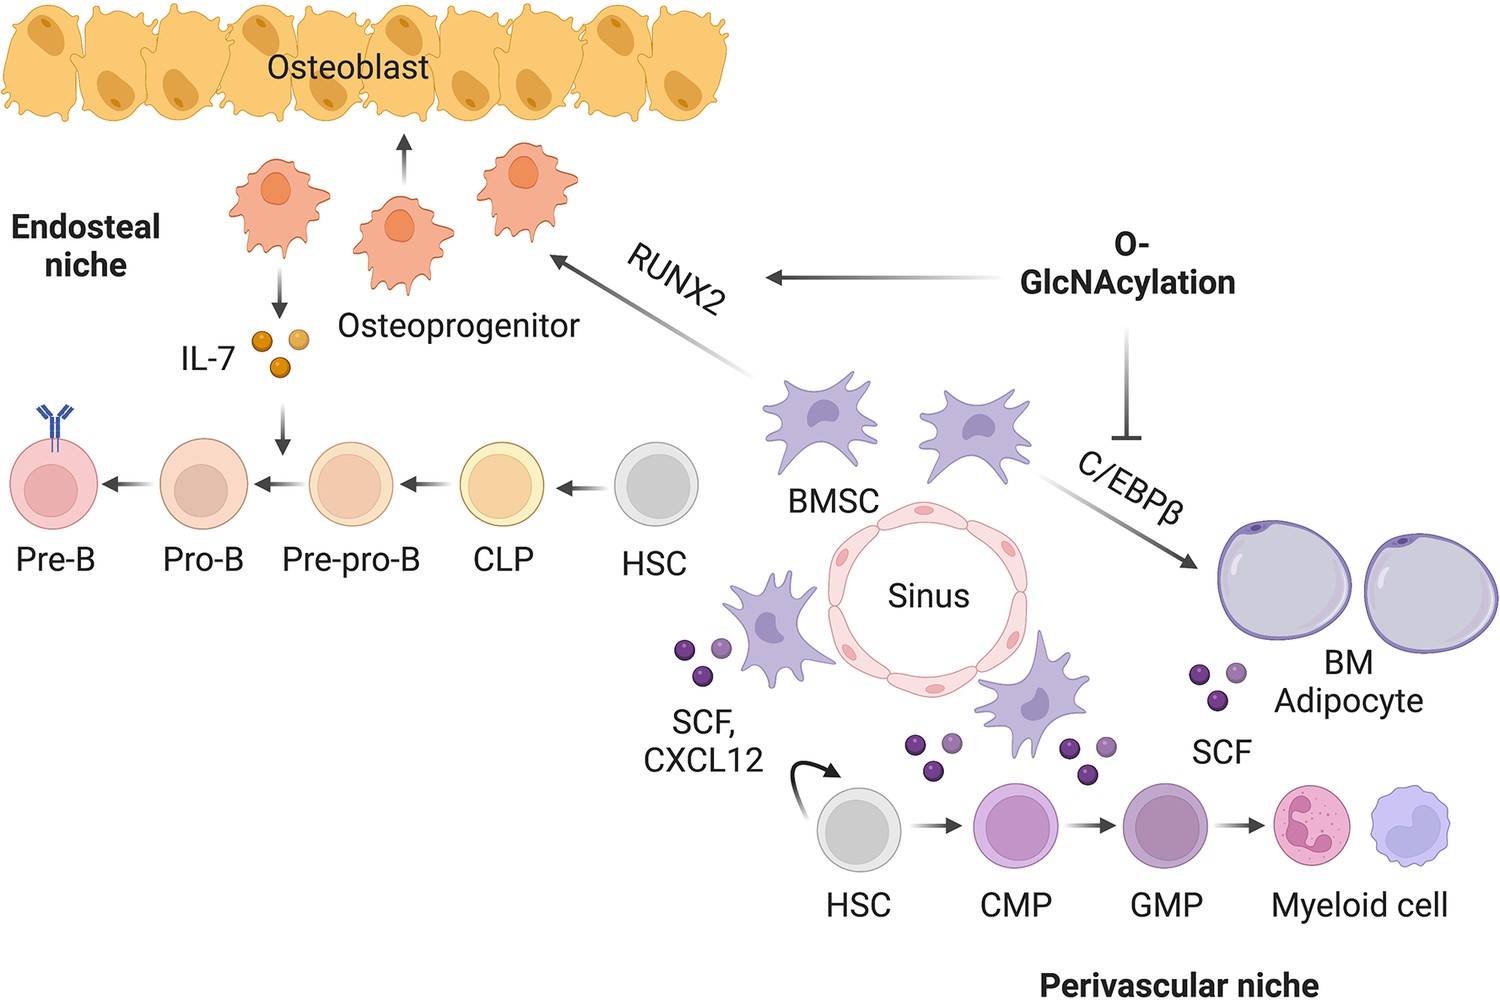
Working model of O-GlcNAc signaling in bone-BM development.
Author response image 1
Tables
Key resources table
| Reagent type (species) or resource | Designation | Source or reference | Identifiers | Additional information |
|---|---|---|---|---|
| Genetic reagent (Mus musculus) | Sp7GFP:Cre (B6.Cg-Tg(Sp7-tTA,tetO-EGFP/cre)1Amc/J) | Jackson Laboratory | RRID:IMSR_JAX:006361 | |
| Genetic reagent (Mus musculus) | Ogtfl/fl (B6.129-Ogttm1Gwh/J) | Jackson Laboratory | RRID:IMSR_JAX:004860 | |
| Cell line (Mus musculus) | Primary BMSC | This paper | From long bones of mouse | |
| Cell line (Mus musculus) | C3H10T1/2 | ATCC | CCL-226 | Verified by ATCC and tested negative for mycoplasma |
| Cell line (Homo sapiens) | HEK293FT | Invitrogen | R70007 | Verified by Invitrogen and tested negative for mycoplasma |
| Cell line (Cercopithecus aethiops) | COS7 | ATCC | CRL-1651 | Verified by ATCC and tested negative for mycoplasma |
| Transfected construct (Mus musculus) | 6xOSE2-luc | Phimphilai et al., 2006 | ||
| Transfected construct (Renilla reniformis) | pGL4-hRluc | Promega | #E688A | |
| Transfected construct (Mus musculus) | PPREx3-TK-luc | Addgene | #1015 | |
| Antibody | Anti-Perilipin (Rabbit monoclonal) | Cell Signaling Technology | 9349T | IF(1:200) |
| Antibody | Anti-B220 (Rat monoclonal) | Life Technologies | 67-0452-82 | FC(1:200) |
| Antibody | Anti-CD43 (Rat monoclonal) | BD Biosciences | 553271 | FC(1:200) |
| Antibody | Anti-CD24 (Rat monoclonal) | Biolegend | 101822 | FC(1:1000) |
| Antibody | Anti-Ly-51 (Rat monoclonal) | Biolegend | 108305 | FC(1:200) |
| Antibody | Anti-CD127 (Rat monoclonal) | Tonbo Biosciences | 20–1271 U100 | FC(1:200) |
| Antibody | Anti-CD25 (Rat monoclonal) | Life Technologies | 63-0251-82 | FC(1:200) |
| Antibody | Anti-CD19 (Rat monoclonal) | Biolegend | 115545 | FC(1:200) |
| Antibody | Biotin-conjugated lineage antibodies (Rat monoclonal) | Biolegend | 133307 | FC(1:200) |
| Antibody | Anti-CD4 (Rat monoclonal) | Biolegend | 100403 | FC(1:200) |
| Antibody | Anti-CD5 (Rat monoclonal) | Biolegend | 100603 | FC(1:200) |
| Antibody | Anti-CD8 (Rat monoclonal) | Biolegend | 100703 | FC(1:200) |
| Antibody | Anti-CD127-APC (Rat monoclonal) | eBioscience | 17-1271-82 | FC(1:100) |
| Antibody | Anti-c-Kit-APC-eFluor780 (Rat monoclonal) | eBioscience | 47-1171-82 | FC(1:400) |
| Antibody | Anti-Sca-1-Super Bright 436 (Rat monoclonal) | eBioscience | 62-5981-82 | FC(1:100) |
| Antibody | Anti-CD34-PE (Rat monoclonal) | Biolegend | 152204 | FC(1:100) |
| Antibody | Anti-FcγR-PerCP-eFluor710 (Rat monoclonal) | eBioscience | 46-0161-80 | FC(1:400) |
| Antibody | Anti-CD150-BV605 (Rat monoclonal) | Biolegend | 115927 | FC(1:100) |
| Antibody | Anti-CD48-BUV395 (Rat monoclonal) | BD Biosciences | 740236 | FC(1:100) |
| Antibody | Anti-CD45-BUV395 (Rat monoclonal) | BD Biosciences | 564279 | FC(1:400) |
| Antibody | Anti-Ter119-BV421 (Rat monoclonal) | Biolegend | 116234 | FC(1:400) |
| Antibody | Anti-CD31-BV421 (Rat monoclonal) | Biolegend | 102424 | FC(1:400) |
| Antibody | Anti-PDGFRa-Super Bright 600 (Rat monoclonal) | eBioscience | 63-1401-82 | FC(1:100) |
| Antibody | Anti-VCAM1-PE (Rat monoclonal) | Biolegend | 105713 | FC(1:100) |
| Recombinant DNA reagent | RUNX2-WT | This paper | pLV-EF1a-RUNX2-WT-IRES-Hygro | See Methods; available upon request |
| Recombinant DNA reagent | RUNX2-3A/ RUNX2-3SA | This paper | pLV-EF1a-RUNX2-3Mut-IRES-Hygro | See Methods; available upon request |
| Recombinant DNA reagent | PPARλ2-WT | This paper | pLVX- PPARλ2-WT-Puro | See Methods; available upon request |
| Recombinant DNA reagent | PPARλ2-T84A | This paper | pLVX- PPARλ2-T84A-Puro | See Methods; available upon request |
| Recombinant DNA reagent | PPARλ2-4A | This paper | pLVX- PPARλ2-4A-Puro | See Methods; available upon request |
| Recombinant DNA reagent | PPARλ2-5A | This paper | pLVX- PPARλ2-5A-Puro | See Methods; available upon request |
| Recombinant DNA reagent | C/EBPβ-WT | This paper | pCDH-CMV-Cebpb-WT-P2a-Puro | See Methods; available upon request |
| Recombinant DNA reagent | C/EBPβ–2A | This paper | pCDH-CMV-Cebpb-2MUT-P2a-Puro | See Methods; available upon request |
| Commercial assay or kit | Q5 Site-Directed Mutagenesis Kit | NEB | #E0554 | |
| Commercial assay or kit | Dual-Luciferase Assay System | Promega | E1910 | |
| Commercial assay or kit | Transporter 5 Transfection Reagent | Polysciences | 26008–1 A | |
| Chemical compound, drug | Parathyroid hormone (PTH) | Genscript | RP01001 | |
| Chemical compound, drug | OSMI-1 | Sigma | SML1621-5MG | |
| Chemical compound, drug | Thiamet-G (TMG) | Biosynth | MD08856 | |
| Chemical compound, drug | Doxycycline food | Bio-Serv | S3888 | |
| Chemical compound, drug | IBMX | CAYMAN | 13347 | |
| Chemical compound, drug | Dexamethasone | Sigma | D4902 | |
| Chemical compound, drug | Insulin | Sigma | 91077 C | |
| Chemical compound, drug | Rosiglitazone | Sigma | R2408-10MG | |
| Chemical compound, drug | Ascorbic acid | Sigma | A4403-100MG | |
| Chemical compound, drug | β-Glycerophosphate | Santa cruz | sc-220452 | |
| Software, algorithm | FlowJ | BD Life Sciences | V10 |
Additional files
Download links
A two-part list of links to download the article, or parts of the article, in various formats.
Downloads (link to download the article as PDF)
Open citations (links to open the citations from this article in various online reference manager services)
Cite this article (links to download the citations from this article in formats compatible with various reference manager tools)
O-GlcNAc glycosylation orchestrates fate decision and niche function of bone marrow stromal progenitors
eLife 12:e85464.
https://doi.org/10.7554/eLife.85464


