CaMKII autophosphorylation can occur between holoenzymes without subunit exchange
- Institute of Biology, Cellular Biophysics, Humboldt Universität zu Berlin, Germany
- Leibniz-Forschungsinstitut für Molekulare Pharmakologie, Germany
- Institute of Chemistry and Biochemistry, Freie Universität Berlin, Germany
- Helmholtz-Zentrum Berlin für Materialien und Energie, Macromolecular Crystallography, Germany
- Charité-Universitätsmedizin Berlin, Germany
- NeuroCure, Charité Universitätsmedizin, Germany
Figures
Figure 1 with 7 supplements
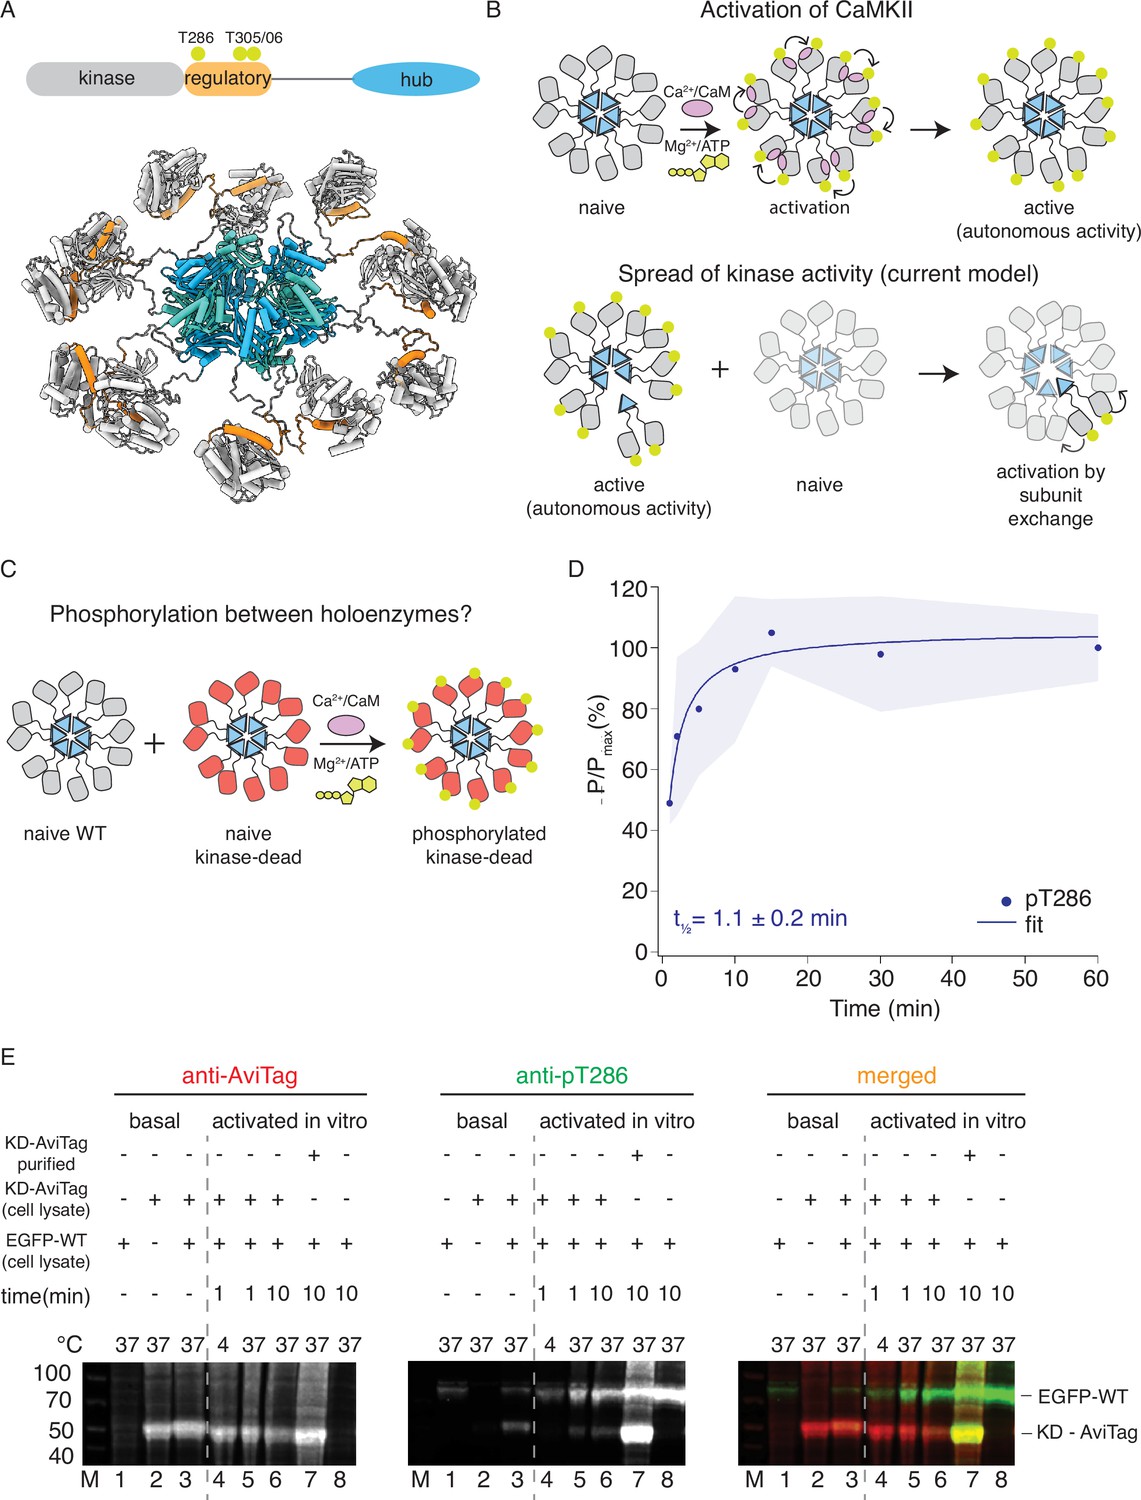
CaMKIIWT phosphorylates CaMKIIKD.
(A) Schematic representation of CaMKIIα domain arrangement (top). Yellow circles indicate phosphorylation sites. CaMKIIα holoenzyme structure (bottom, PDB:5u6y). (B) Cartoon representation of activation of CaMKII by calcium:calmodulin (top) and proposed mechanism for spread of kinase activity (bottom). Yellow circles indicate phosphorylation sites. (C) Schematic representation of experiment performed in panel (D). (D) Kinase activity of CaMKIIWT (10 nM) against CaMKIIKD (4 μM). Half-time of maximum phosphorylation (t1⁄2=1.1 ± 0.2 min) determined by western blot, using an antibody against pT286. These data were fit with a single component, see Figure 1—figure supplement 3 for a fit to a repeated experiment with two components. The shading represents standard deviation (SD) from the mean value of three technical replicates. (E) Kinase activity of EGFP-CaMKIIWT and CaMKIIKD-AviTag in HEK cells and HEK cell lysates. ‘Basal’: activity in cells; ‘activated in vitro’: activity in cell lysates supplemented with 1 μM purified Ca2+:CaM and 0.5 mM ATP:Mg2+. Lane 1 – autophosphorylation of EGFP-CaMKIIWT in singly transfected cells, lane 2 – autophosphorylation of CaMKIIKD-AviTag in singly transfected cells, lane 3 – autophosphorylation of EGFP-CaMKIIWT and CaMKIIKD-AviTag in co-transfected cells, lane 4 – stimulated kinase activity of EGFP-CaMKIIWT from lysate in lane 1 and CaMKIIKD-AviTag from lysate in lane 2, incubated together at 4 °C for 1 min, lane 5 - stimulated kinase activity of EGFP-CaMKIIWT from lysate in lane 1 and CaMKIIKD-AviTag from lysate in lane 2, incubated together at 37 °C for 1 min, lane 6 - stimulated kinase activity of EGFP-CaMKIIWT from lysate in lane 1 and CaMKIIKD-AviTag from lysate in lane 2, incubated together at 37 °C for 10 min, lane 7 - stimulated kinase activity of EGFP-CaMKIIWT from lysate in lane 1 and 8 μM purified CaMKIIKD-AviTag, incubated together at 37 °C for 10 min, lane 8 - stimulated kinase activity of EGFP-CaMKIIWT from lysate in lane 1 37 °C for 10 min.
-
Figure 1—source data 1
Uncropped blots used in panel Figure 1E.
- https://cdn.elifesciences.org/articles/86090/elife-86090-fig1-data1-v3.zip
Figure 1—figure supplement 1
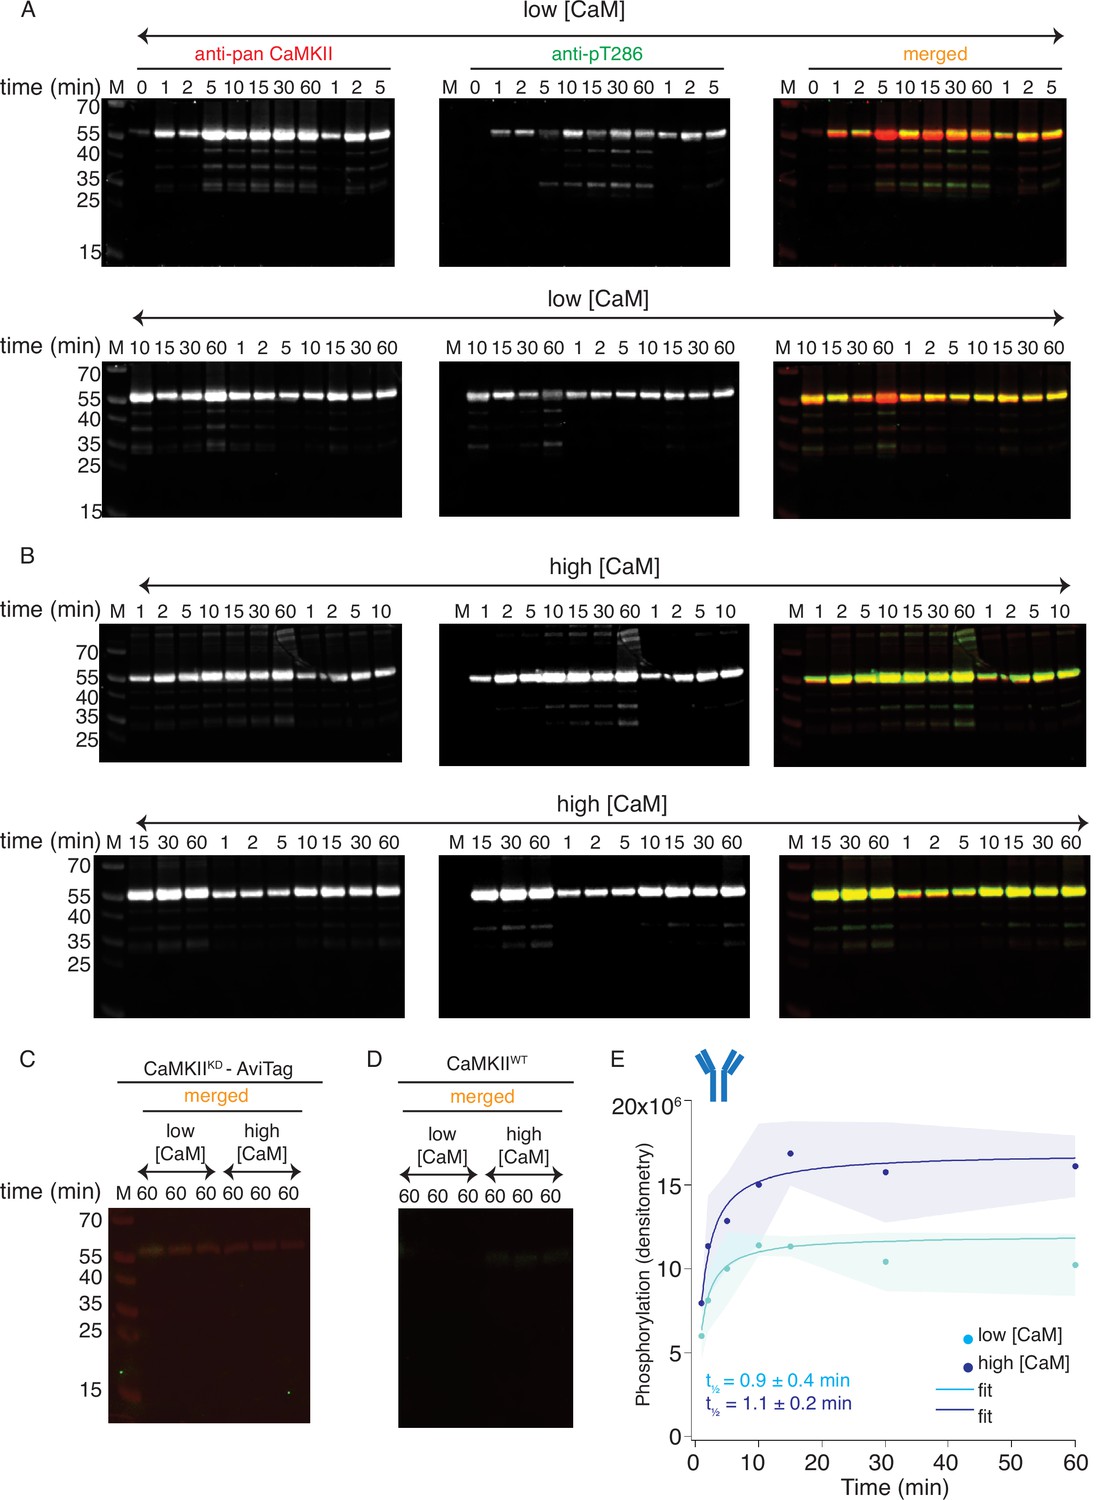
Western blot detection of CaMKIIKD phosphorylation by CaMKIIWT.
(A) Blots of pT286 detection on CaMKIIKD (4 μM) after phosphorylation with CaMKIIWT (10 nM) in the presence of ATP:Mg2+ and low Ca2+:CaM concentrations (100 nM). Each time point is done in triplicate. (B) Blots of pT286 detection on CaMKIIKD (4 μM), after phosphorylation with CaMKIIWT (10 nM) in the presence of ATP:Mg2+ and high Ca2+:CaM concentrations (2 μM). Each time point is done in triplicate. (C) Western blot showing there is no phosphorylation signal from pT286 antibody on CaMKIIKD (4 μM) when CaMKIIWT is omitted from the kinase reaction. (D) Western blot showing that 10 nM CaMKIIWT (as included on the gels in panels A and B) gives no phosphorylation signal from the pT286 antibody. (E) Raw densitometry data from blots in panels A and B fitted with Langmuir function. Half-maximum times for CaMKIIKD phosphorylation by CaMKIIWT under low Ca2+:CaM conditions is t1/2 = 0.9 ± 0.4 min, and under high Ca2+:CaM conditions is t1/2 = 1.1 ± 0.2 min. The shading represents standard deviation (SD) from the mean value of three technical replicates.
-
Figure 1—figure supplement 1—source data 1
Uncropped blots used for constructing the curves in Figure 1D and Figure 1—figure supplement 1E.
- https://cdn.elifesciences.org/articles/86090/elife-86090-fig1-figsupp1-data1-v3.zip
Figure 1—figure supplement 2
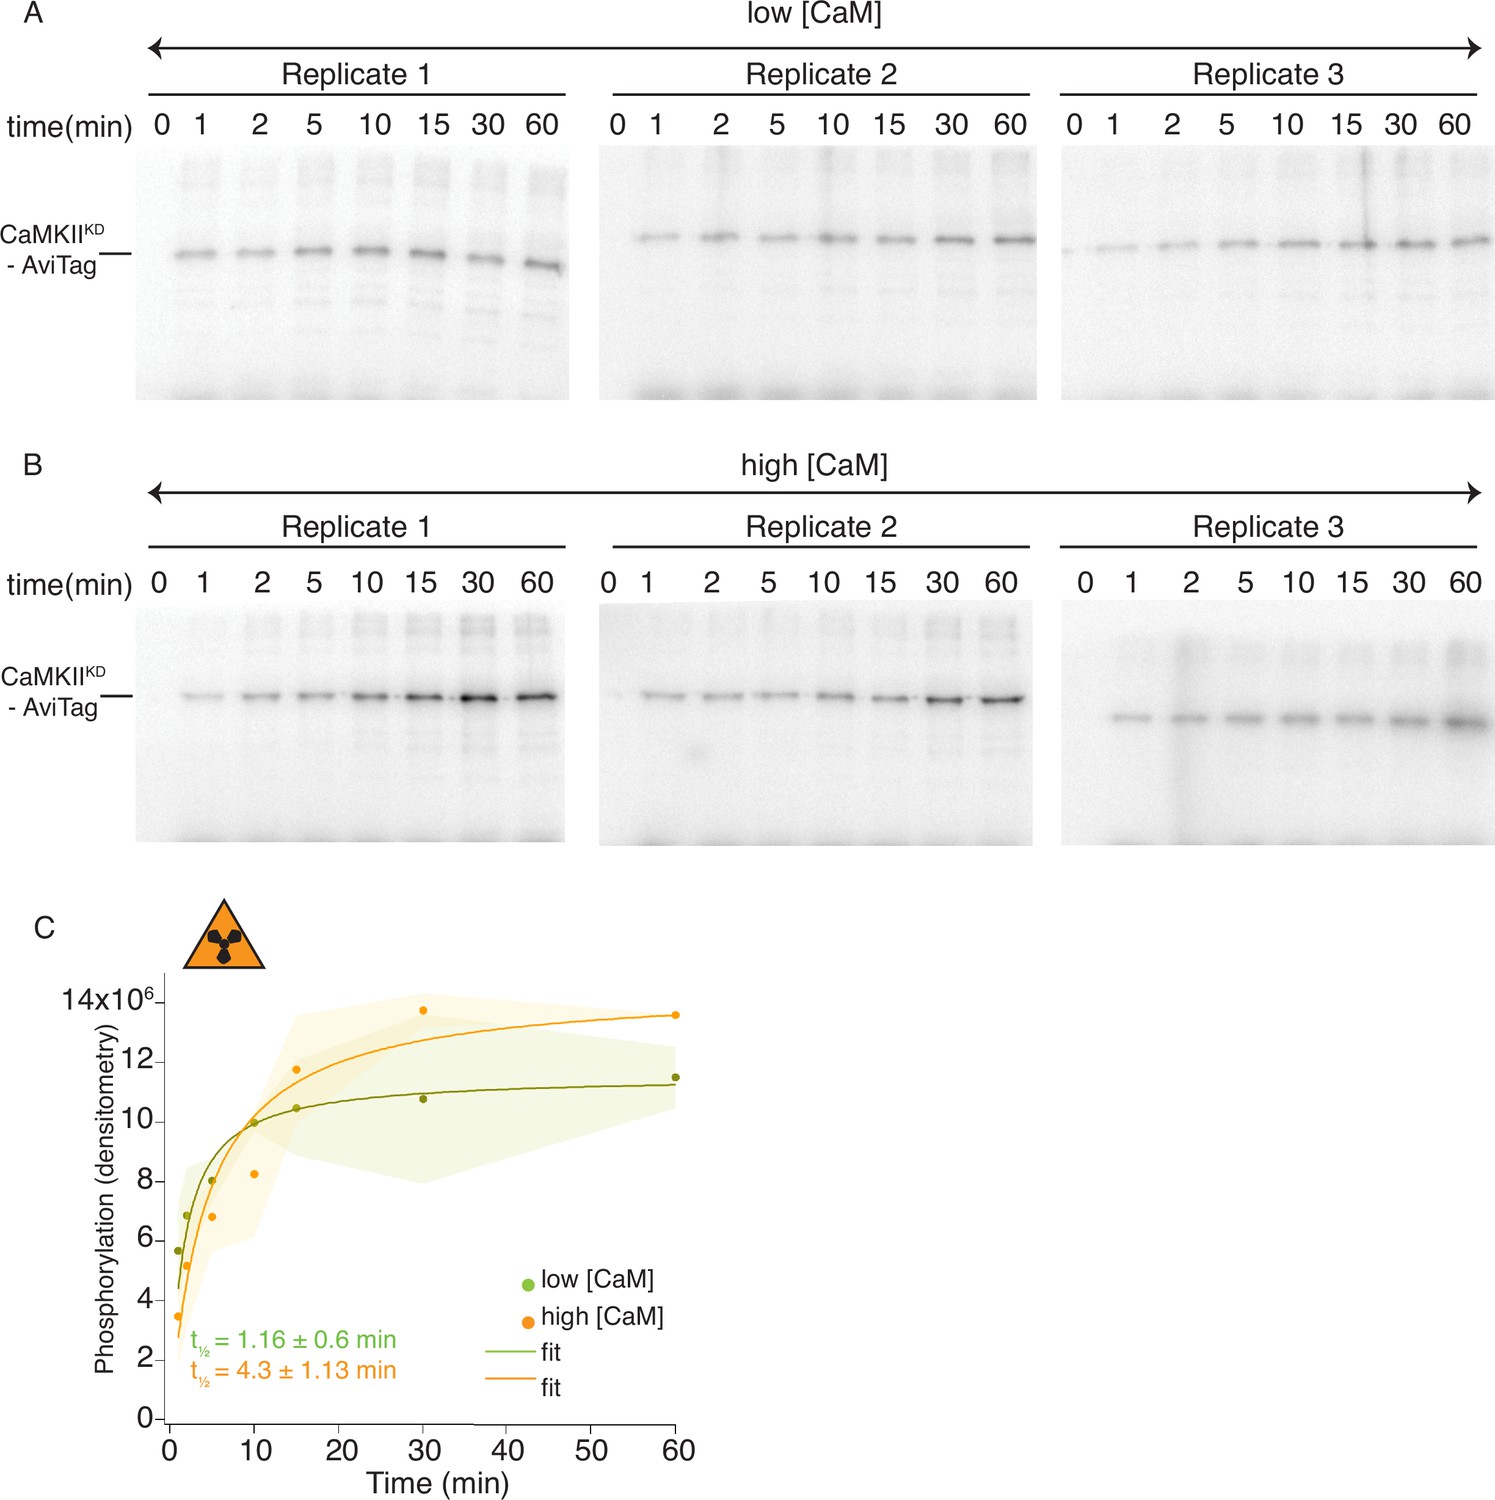
Radioactivity detection of CaMKIIKD phosphorylation by CaMKIIWT.
(A) Gels of CaMKIIKD phosphorylation detection in the presence of ATP:Mg2+ and low Ca2+:CaM concentrations (100 nM). Each time point is done in triplicates. (B) Gels of CaMKIIKD phosphorylation detection in the presence of ATP: Mg2+ and high Ca2+:CaM concentrations (2 μM). Each time point is done in triplicates. (C) Raw densitometry data from gels in A and B fitted with Langmuir function. Half-maximum times for CaMKIIKD phosphorylation by CaMKIIWT under low Ca2+:CaM conditions is t1/2 = 1.16 ± 0.6 min, and under high Ca2+:CaM conditions is t1/2 = 4.3 ± 1.13 min. The shading represents standard deviation (SD) from the mean value of three technical replicates.
-
Figure 1—figure supplement 2—source data 1
Uncropped gels used for constructing the curves in Figure 1—figure supplement 2C.
- https://cdn.elifesciences.org/articles/86090/elife-86090-fig1-figsupp2-data1-v3.zip
Figure 1—figure supplement 3
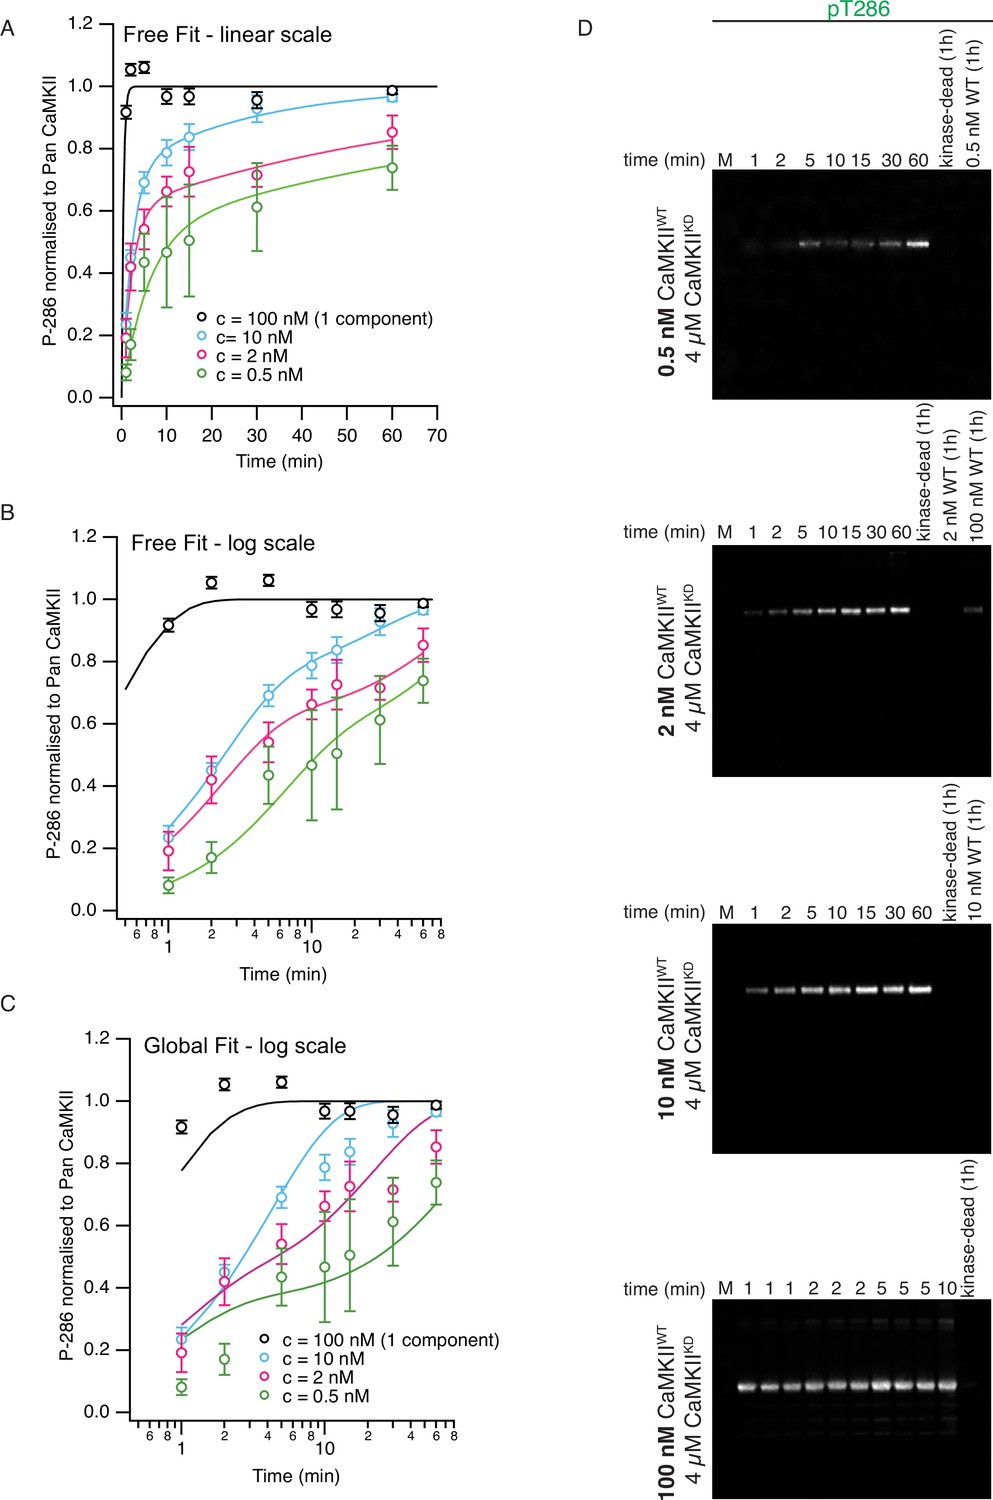
Phosphorylation of CaMKIIKD by CaMKIIWT is concentration-dependent.
(A) Graph showing dependence of CaMKIIKD phosphorylation on CaMKIIWT concentration on a linear timescale. Each fit used the two-component exponential function (see Materials and methods for details). In these ‘free fits’. the rates r1 and k2 were allowed to vary between the four fits (10 free parameters in all, including the amplitudes). Note that we repeated the experiments at 10 nM CaMKIIWT (essentially the same as Figure 1D). Because the phosphorylation reaction was so fast at 100 nM CamKIIWT, we fitted only a single component (phosphorylation rate was 2.5 min–1). Fit parameters (±1 SD) were as follows: 10 nM fit A1=0.27 ± 0.06; k2=0.043 ± 0.006 nM–1 min–1; r1 = 0.035 ± 0.009 min–12 nM fit A1=0.6 ± 0.1; k2=0.007 ± 0.003 nM–1 min–1; r1 = 0.44 ± 0.13 min–10.5 nM fit A1=0.5 ± 0.3; k2=0.02 ± 0.03 nM–1 min–1; r1 = 0.17 ± 0.11 min–1 Same free fit as panel (B) on a logarithmic timescale to reveal the two components. (C) Global fit (5 free parameters) using common values of rates r1 and k2 for each curve. r1=0.41 min–1 and k2=0.017 nM–1 min–1. For the 100 nM fit, the amplitude A1 was set to zero. Note that at 100 nM, the first order rate k2 * 100 nM is about 3 x faster (1.7 min–1) than the rate estimated for concentration-independent phosphorylation. (D) Representative western blots of the time course of phosphorylation on T286 of CaMKIIKD by CaMKIIWT at different concentrations (concentrations of proteins used is indicated on the left side of each panel). Lanes which are marked with ‘kinase-dead (1 hr)' show that no pT286 signal can be detected on CaMKIIKD (4 µM) after 1 hr of incubation without CaMKIIWT. Lanes labeled with concentration of CaMKIIWT demonstrate that the wild-type protein is invisible for anti-pT286 antibody at the reaction amounts loaded on these gels for all except for 100 nM WT lane, where a phosphorylation signal is detected after 1 h of incubation of CaMKIIWT with activation stimuli, but without CaMKIIKD. However, the signal is about 20% of the signal detected on CaMKIIKD after 1 hr. The bottom blot shows pT286 detection of triplicate reactions at 1, 2, 5 and a single reaction at 10 min. The other blots used to construct the curves in (A–C) are in Figure 1—figure supplements 4–7.
-
Figure 1—figure supplement 3—source data 1
Uncropped blots of examples of immunoblotting used to construct curves in Figure 1—figure supplement 3A–C.
- https://cdn.elifesciences.org/articles/86090/elife-86090-fig1-figsupp3-data1-v3.zip
Figure 1—figure supplement 4
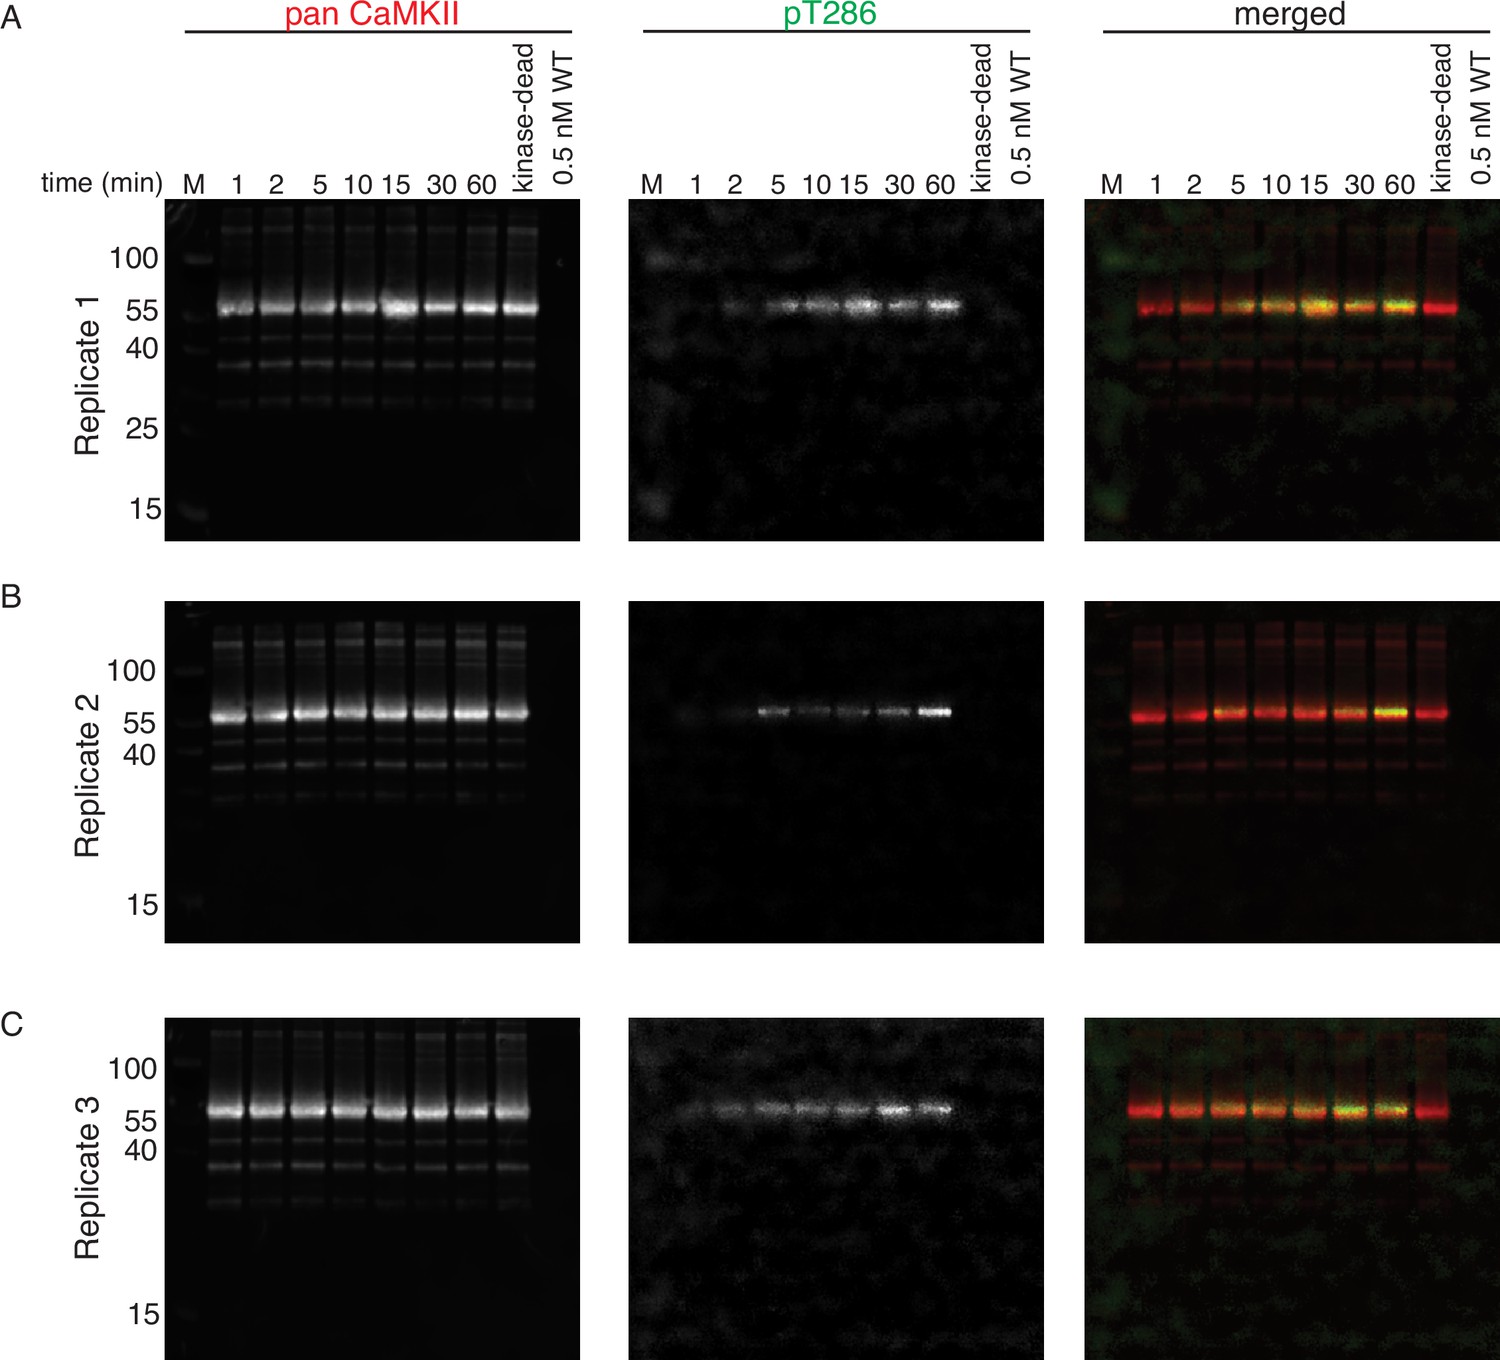
Phosphorylation of CaMKIIKD by 0.5 nM CaMKIIWT.
(A) Replicate 1 showing western blot detection of phosphorylation development on T286 of CaMKIIKD over the course of 60 min catalyzed by 0.5 nM CaMKIIWT. Left panel is showing detection of CaMKII by anti-pan CaMKII antibody. Middle panel is showing detection of pT286 signal on CaMKII by anti-pT286 antibody. Right panel is showing merged signal of pan-CaMKII and pT286 signal. Lane labeled with ‘kinase-dead’ is showing that although CaMKIIKD can be detected by pan antibody, the signal on T286 (middle panel) is absent after 60 min of the kinase reaction, when CaMKIIWT is excluded from the reaction. Lane labeled with ‘0.5 nM WT’ demonstrates that the wild-type protein is invisible for anti-pan and anti-pT286 antibodies after 60 min of kinase reaction without CaMKIIKD at the protein amount loaded on this gel. (B) Replicate 2 showing western blot detection of phosphorylation development on T286 of CaMKIIKD over the course of 60 min catalyzed by 0.5 nM CaMKIIWT. The labeling of the blots is the same like in (A). (C) Replicate 3 showing western blot detection of phosphorylation development on T286 of CaMKIIKD over the course of 60 min catalyzed by 0.5 nM CaMKIIWT. The labeling of the blots is the same like in (A) and (B).
-
Figure 1—figure supplement 4—source data 1
Uncropped blots used for constructing the curves in Figure 1—figure supplement 3A–C for 0.5 nM CaMKIIWT.
- https://cdn.elifesciences.org/articles/86090/elife-86090-fig1-figsupp4-data1-v3.zip
Figure 1—figure supplement 5
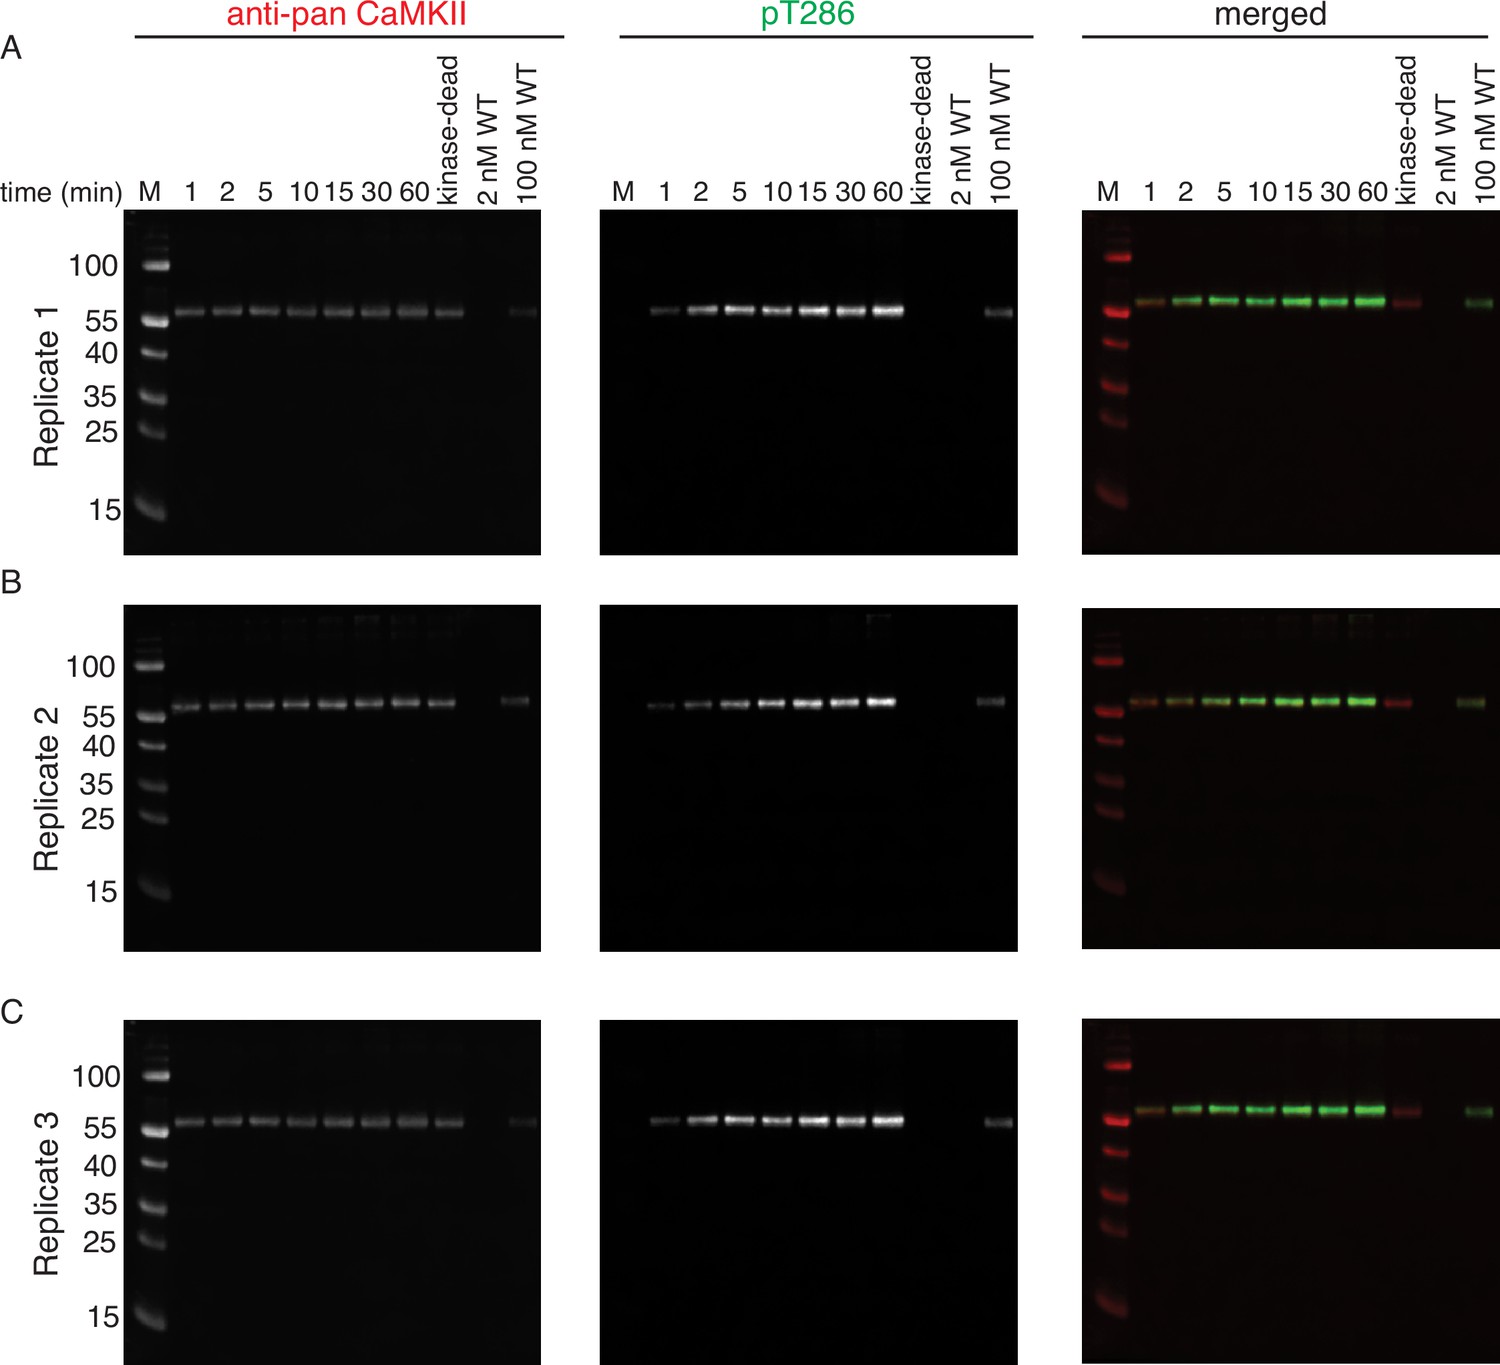
Phosphorylation of CaMKIIKD by 2 nM CaMKIIWT.
(A) Replicate 1 showing western blot detection of phosphorylation development on T286 of CaMKIIKD over the course of 60 min catalyzed by 2 nM CaMKIIWT. Left panel shows detection of CaMKII by anti-pan CaMKII antibody. Middle panel shows detection of pT286 signal on CaMKII by anti-pT286 antibody. Right panel shows merged signal of pan-CaMKII and pT286 signal. Lane labeled with ‘kinase-dead’ shows that although CaMKIIKD can be detected by pan antibody, the signal on T286 (middle panel) is absent after 60 min of the kinase reaction, when CaMKIIWT is excluded from the reaction. Lane labeled with ‘2 nM WT’ demonstrates that the wild-type protein is invisible for anti-pan and anti-pT286 antibodies after 60 min of kinase reaction without CaMKIIKD at the protein amount loaded on this gel. Lane labeled with ‘100 nM WT’ demonstrates that the wild-type protein is somewhat visible for anti-pan and anti-pT286 antibodies after 60 min of kinase reaction without CaMKIIKD at the protein amount loaded on this gel, but this signal represents about 20% of the pT286 signal coming from reactions incubated with CaMKIIKD. (B) Replicate 2 showing western blot detection of phosphorylation development on T286 of CaMKIIKD over the course of 60 min catalyzed by 2 nM CaMKIIWT. The labeling of the blots is the same as in (A). (C) Replicate 3 showing western blot detection of phosphorylation development on T286 of CaMKIIKD over the course of 60 min catalyzed by 2 nM CaMKIIWT. The labeling of the blots is the same as in (A) and (B).
-
Figure 1—figure supplement 5—source data 1
Uncropped blots used for constructing the curves in Figure 1—figure supplement 3A–C for 2 nM CaMKIIWT.
- https://cdn.elifesciences.org/articles/86090/elife-86090-fig1-figsupp5-data1-v3.zip
Figure 1—figure supplement 6
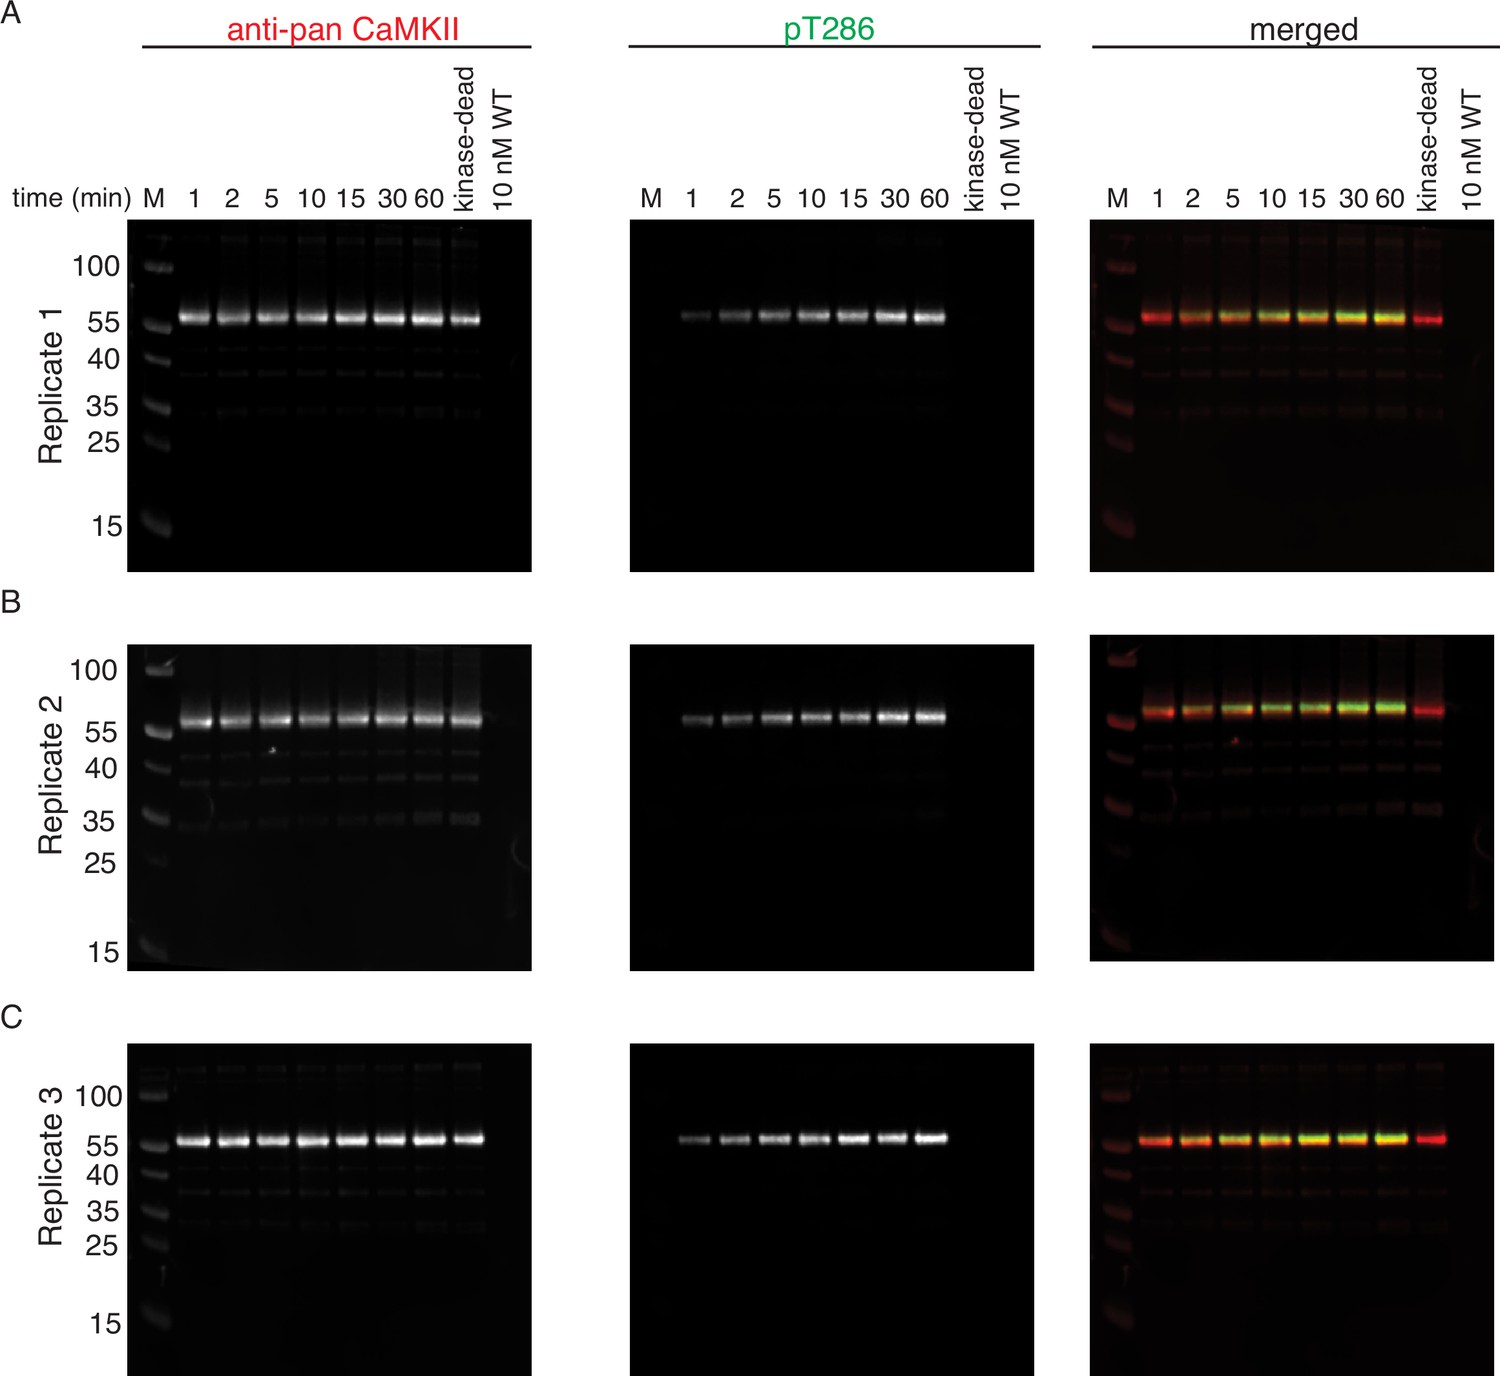
Phosphorylation of CaMKIIKD by 10 nM CaMKIIWT.
(A) Replicate 1 showing western blot detection of phosphorylation development on T286 of CaMKIIKD over the course of 60 min catalyzed by 10 nM CaMKIIWT. Left panel shows detection of CaMKII by anti-pan CaMKII antibody. Middle panel shows detection of pT286 signal on CaMKII by anti-pT286 antibody. Right panel shows merged signal of pan-CaMKII and pT286 signal. Lane labeled with ‘kinase-dead’ is showing that although CaMKIIKD can be detected by pan antibody, the signal on T286 (middle panel) is absent after 60 min of the kinase reaction, when CaMKIIWT is excluded from the reaction. Lane labeled with ‘10 nM WT’ demonstrates that the wild-type protein is invisible for anti-pan and anti-pT286 antibodies after 60 min of kinase reaction without CaMKIIKD at the protein amount loaded on this gel. (B) Replicate 2 showing western blot detection of phosphorylation development on T286 of CaMKIIKD over the course of 60 min catalyzed by 10 nM CaMKIIWT. The labeling of the blots is the same as in (A). (C) Replicate 3 showing western blot detection of phosphorylation development on T286 of CaMKIIKD over the course of 60 min catalyzed by 10 nM CaMKIIWT. The labeling of the blots is the same as in (A) and (B).
-
Figure 1—figure supplement 6—source data 1
Uncropped blots used for constructing the curves in Figure 1—figure supplement 3A–C for 10 nM CaMKIIWT.
- https://cdn.elifesciences.org/articles/86090/elife-86090-fig1-figsupp6-data1-v3.zip
Figure 1—figure supplement 7
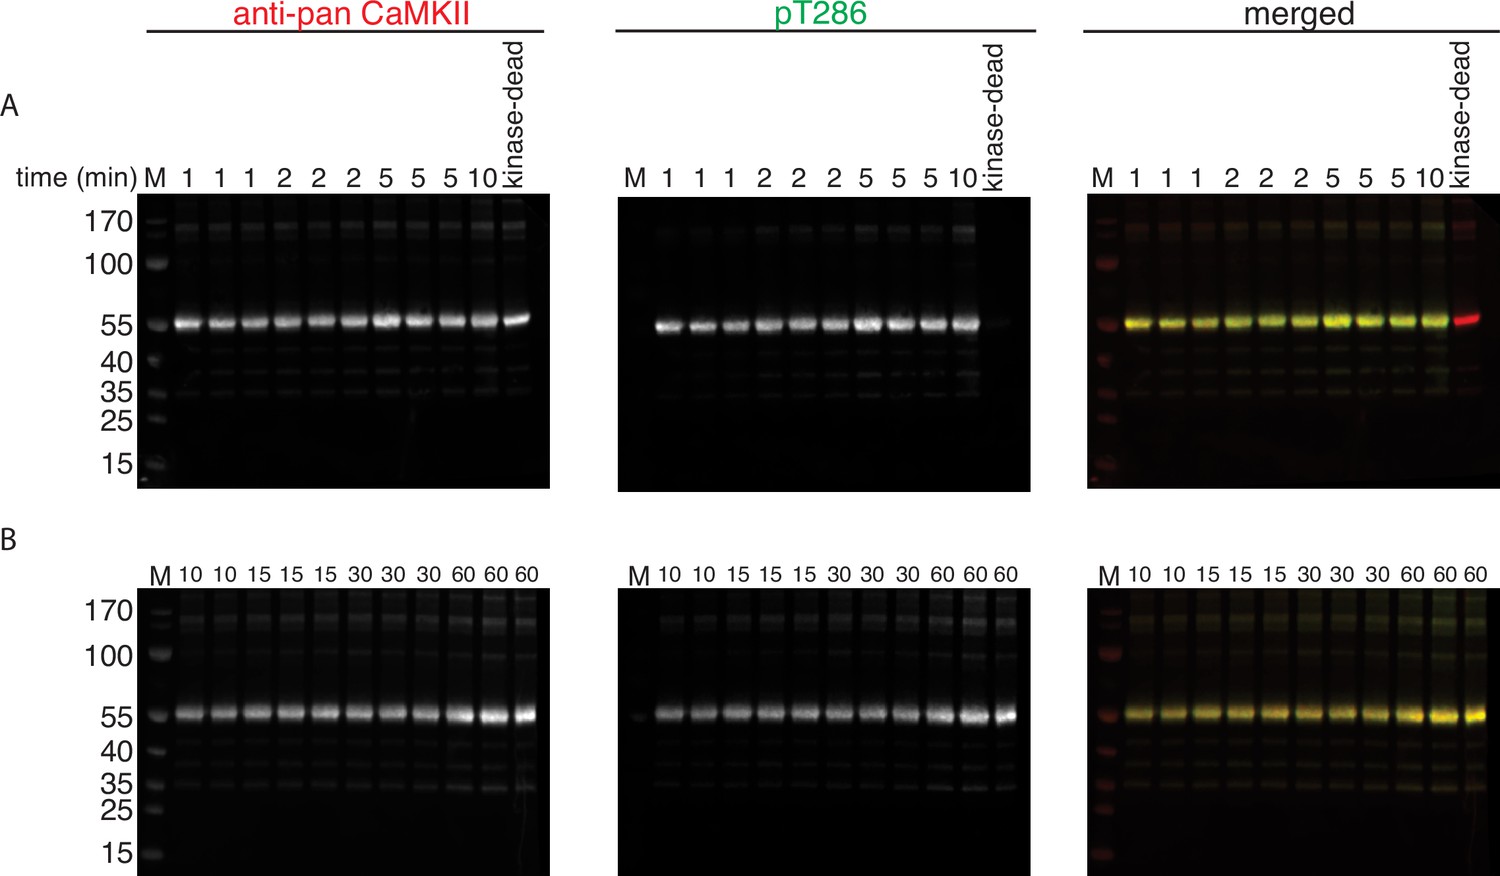
Phosphorylation of CaMKIIKD by 100 nM CaMKIIWT.
(A) Western blot detection of phosphorylation development on T286 over time when CaMKIIKD is incubated with 100 nM CaMKIIWT. Reaction at each time point is done in triplicate. The triplicates for 1, 2, and 5 min were loaded one after another on the same gel. Lane labeled with ‘10’ is a single reaction at 10 min time point. Lane labeled with ‘kinase-dead’ is showing that although CaMKIIKD can be detected by pan antibody, the signal on T286 (middle panel) is absent after 60 min of the kinase reaction, when CaMKIIWT is excluded from the reaction. (B) Western blot detection of phosphorylation development on T286 over time when CaMKIIKD is incubated with 100 nM CaMKIIWT. Reaction at each time point is done in triplicate. The duplicate for 10 min time point and then triplicates for 15, 30, and 60 min were loaded one after another on the same gel.
-
Figure 1—figure supplement 7—source data 1
Uncropped blots used for constructing the curves in Figure 1—figure supplement 3A–C for 100 nM CaMKIIWT.
- https://cdn.elifesciences.org/articles/86090/elife-86090-fig1-figsupp7-data1-v3.zip
Figure 2 with 3 supplements
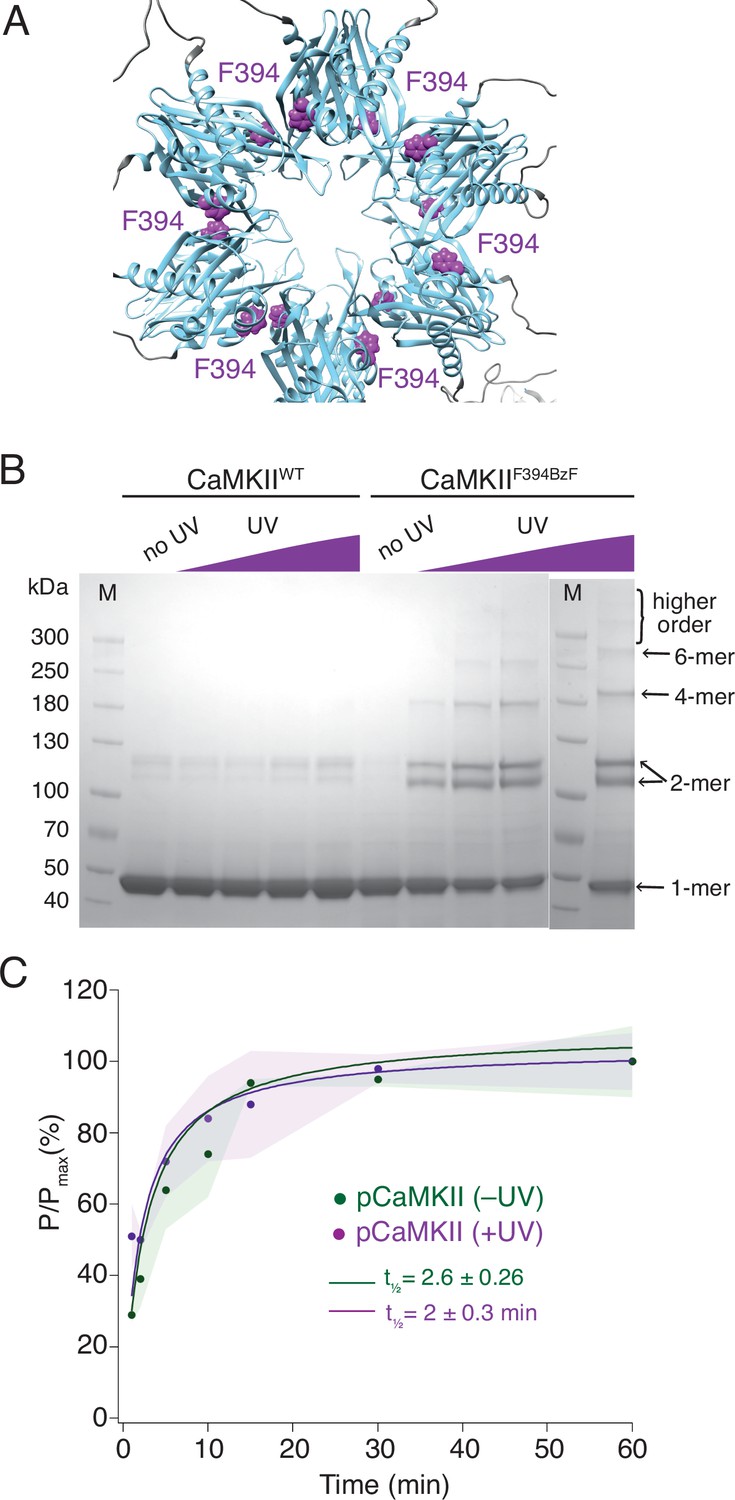
Crosslinking CaMKII subunits in the hub domain does not change the rates of trans-autophosphorylation.
(A) Position of F394 residue (purple) in the hub domain of CaMKIIα (PDB: 5u6y), showing orientation towards the interface between adjacent hub domains within one hub ring. (B) Coomassie stained gel of UV-induced crosslinking of CaMKIIF394BzF (right) to higher order oligomers, and CaMKIIWT (left) as a control. Purple ramp indicates increasing UV exposure. (C) Kinase activity of UV treated (+UV) and untreated (-UV) CaMKIIF394BzF against CaMKIIKD - AviTag. Phosphorylation was measured as incorporation of radioactive AT32P at phosphorylation sites on CaMKIIKD -AviTag (pCaMKII). Half-times of maximum phosphorylation are determined to t1⁄2=2.6 ± 0.3 min for untreated and t1⁄2=2 ± 0.3 min for UV treated CaMKIIF394BzF. The shading represents standard deviation (SD) from the mean value of three technical replicates.
-
Figure 2—source data 1
Uncropped Coomassie stained gels used in panel Figure 2B.
- https://cdn.elifesciences.org/articles/86090/elife-86090-fig2-data1-v3.zip
Figure 2—figure supplement 1
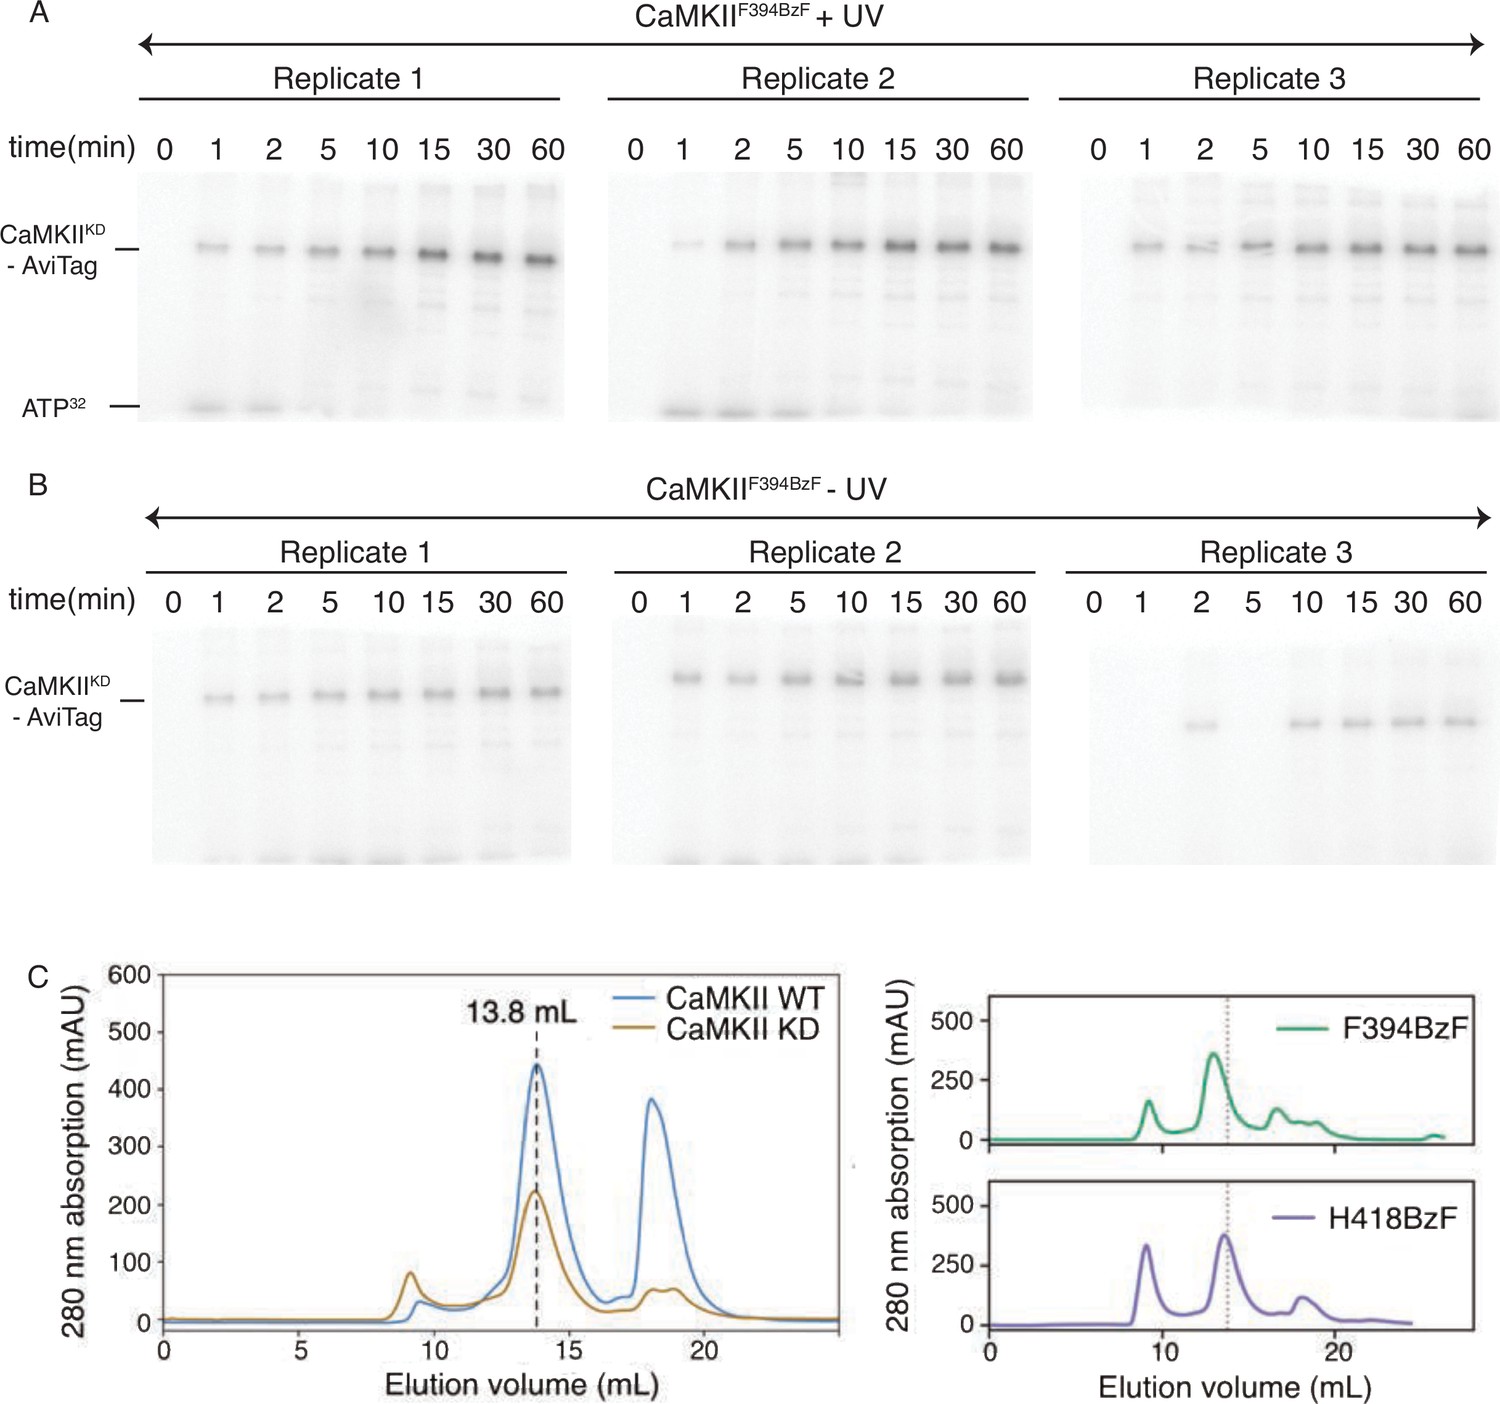
Properties of CaMKIIF394BzF: kinase activity and size exclusion chromatography.
(A) Gels of CaMKIIKD phosphorylation detection by UV treated CaMKIIF394BzF. Each time point is done in triplicates. These data are used for Figure 2C. (B) Gels of CaMKIIKD phosphorylation detection by untreated CaMKIIF394BzF. Each time point is done in triplicates. These data are used for Figure 2C. (C) Size exclusion chromatography (Superose 6 10/300 increase column) of CaMKII wild-type and mutants used in this study. Dashed lines indicate the peak elution volume for wild-type (Ve = 13.8 mL).
-
Figure 2—figure supplement 1—source data 1
Uncropped images of radioactive gels used to construct the curves in Figure 2C.
- https://cdn.elifesciences.org/articles/86090/elife-86090-fig2-figsupp1-data1-v3.zip
Figure 2—figure supplement 2
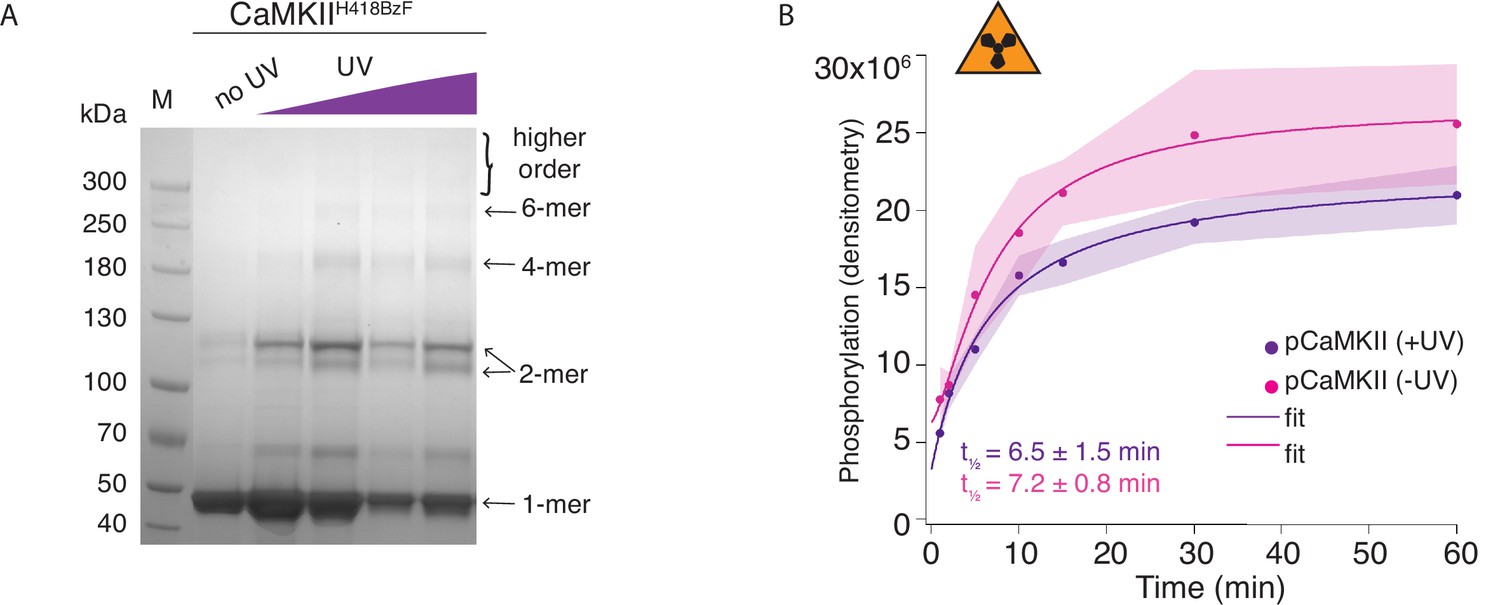
Hub domain mutant CaMKIIH418BzF phosphorylates CaMKIIKD irrespective of crosslinking.
(A) Coomassie stained gel showing UV-dependent oligomerization of CaMKIIH418BzF. (B) Phosphorylation of CaMKIIKD by UV-treated or -untreated CaMKIIH418BzF. Langmuir fit determined half-maximum times of phosphorylation t1⁄2 = 7.2 ± 0.8 min for untreated CaMKIIH418BzF and t1⁄2 = 6.5 ± 1.5 min for UV-treated CaMKIIH418BzF.
-
Figure 2—figure supplement 2—source data 1
Uncropped images of Coomassie stained and radioactive gels used to construct the curves in Figure 2—figure supplement 2B.
- https://cdn.elifesciences.org/articles/86090/elife-86090-fig2-figsupp2-data1-v3.zip
Figure 2—figure supplement 3
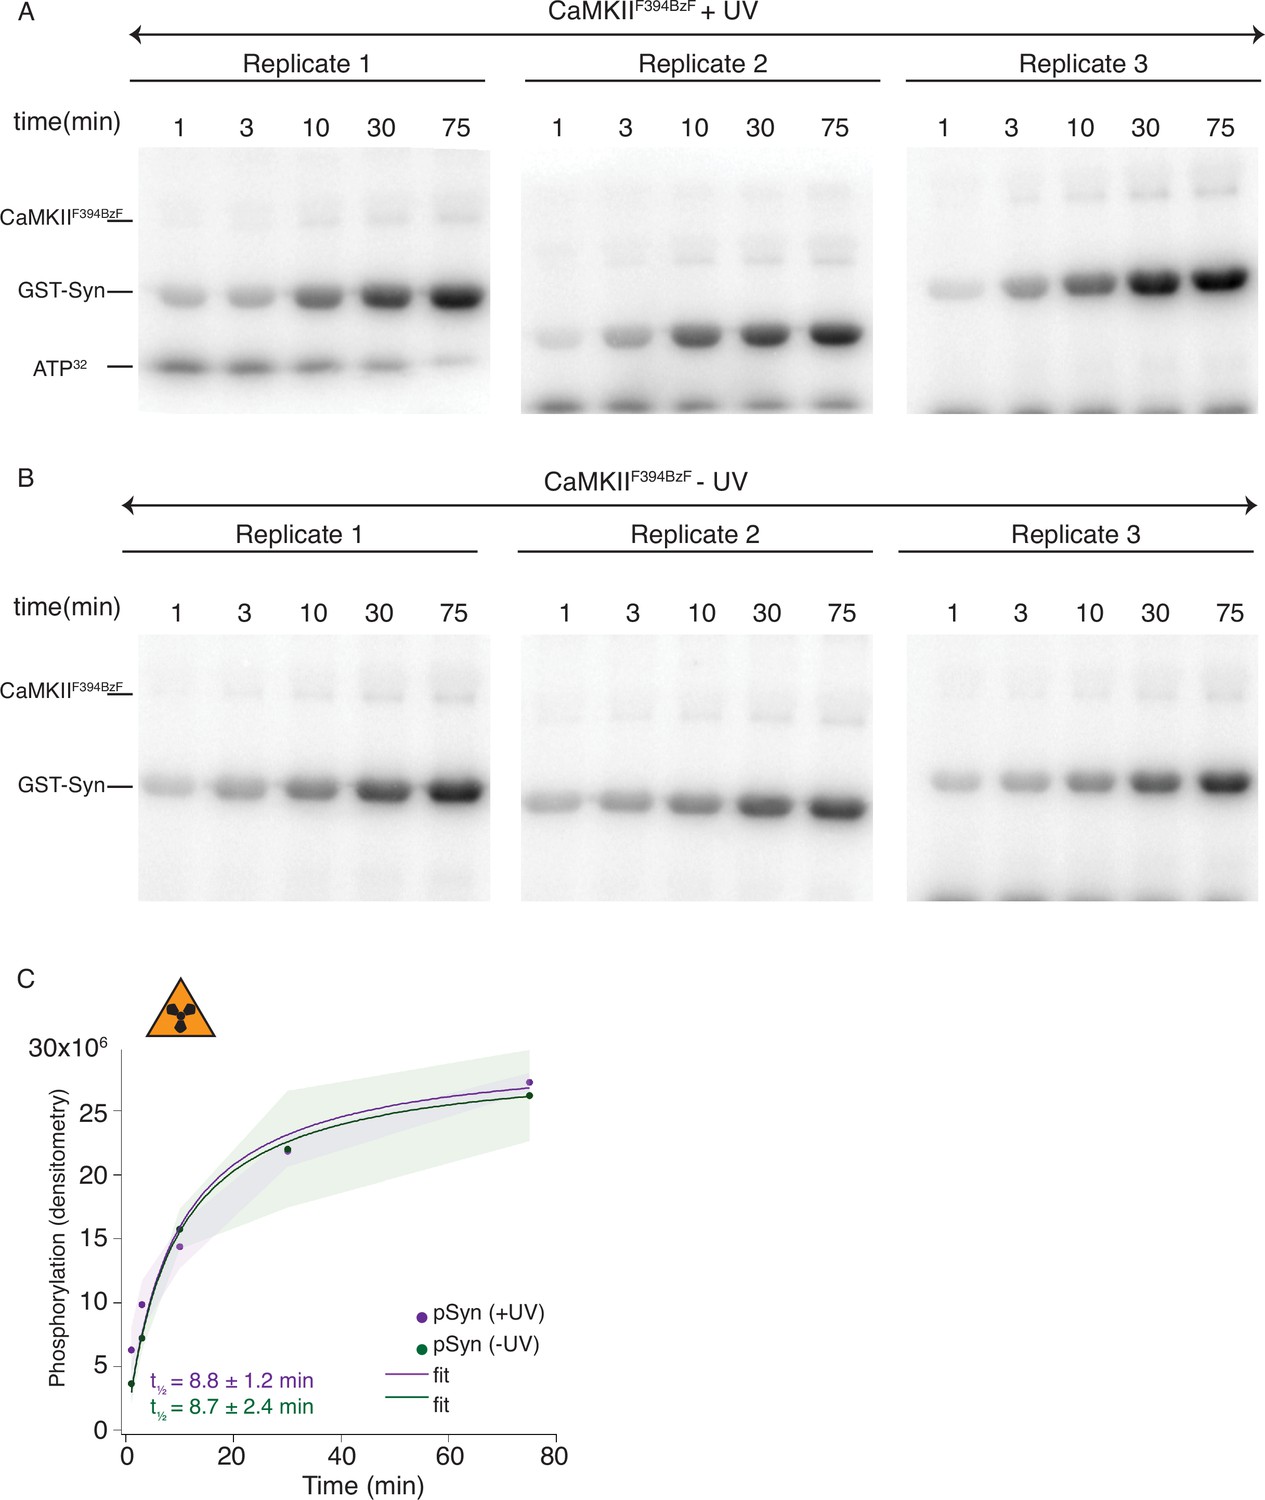
Radioactivity detection of substrate phosphorylation by CaMKIIF394BzF.
(A) Gels of CaMKII substrate (GST-Syn) phosphorylation by UV-treated CaMKIIF394BzF. Each time point is done in triplicate. (B) Gels of CaMKII substrate (GST-Syn) phosphorylation by control CaMKIIF394BzF (no UV treatment). Each time point is done in triplicate. (C) Phosphorylation of GST-Syn by UV-treated or -untreated CaMKIIF394BzF. Langmuir fit determined half-maximum times of GST-Syn phosphorylation t1⁄2 = 8.7 ± 2.4 min for untreated CaMKIIF394BzF and t1⁄2 = 8.8 ± 1.2 min for UV-treated CaMKIIF394BzF. The shading represents standard deviation (SD) from the mean value of three technical replicates.
-
Figure 2—figure supplement 3—source data 1
Uncropped images of radioactive gels used in Figure 2—figure supplement 3.
- https://cdn.elifesciences.org/articles/86090/elife-86090-fig2-figsupp3-data1-v3.zip
Figure 3 with 1 supplement
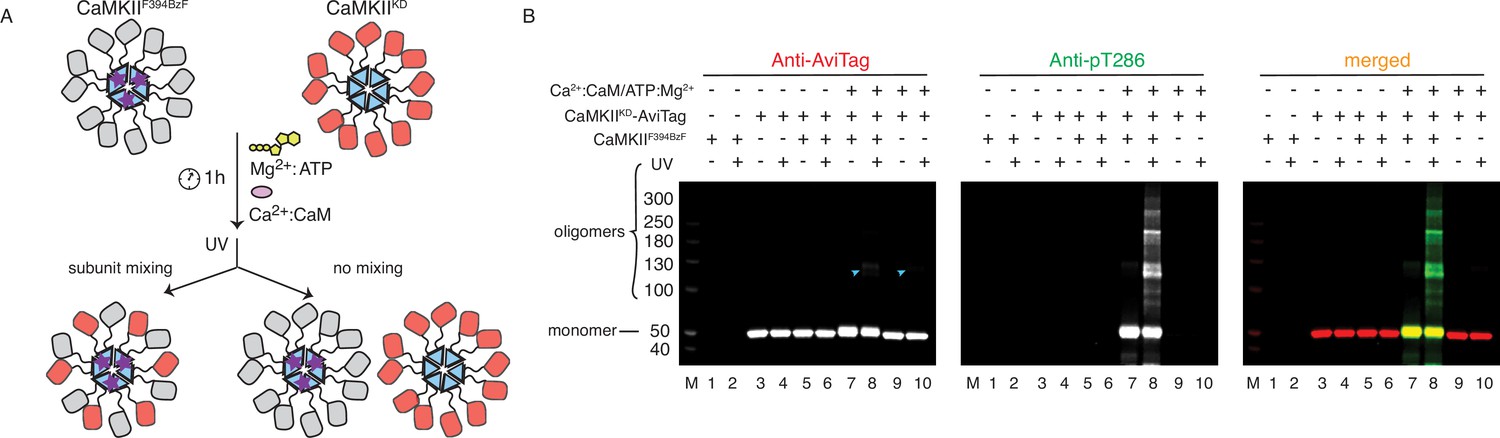
CaMKII holoenzymes do not mix during activation.
(A) Schematic representation of the experiment performed in panel (B) and possible outcomes. (B) Western blot detection of potential CaMKIIKD-AviTag incorporation in CaMKIIF394BzF holoenzymes. Lane 1 – CaMKIIF394BzF, lane 2 - CaMKIIF394BzF treated with UV, lane 3 - CaMKIIKD-AviTag, lane 4 - CaMKIIKD-AviTag treated with UV, lane 5 - CaMKIIF394BzF incubated with CaMKIIKD-AviTag, lane 6 - CaMKIIF394BzF incubated with CaMKIIKD-AviTag, then UV treated, lane 7 - CaMKIIF394BzF incubated with CaMKIIKD-AviTag and activation stimuli (Ca2+:CaM and Mg2+:ATP), lane 8 - CaMKIIF394BzF incubated with CaMKIIKD-AviTag and activation stimuli (Ca2+:CaM and Mg2+:ATP), then UV treated, lane 9 - CaMKIIKD-AviTag incubated with activation stimuli (Ca2+:CaM and Mg2+:ATP), lane 10 - CaMKIIKD-AviTag incubated with activation stimuli (Ca2+:CaM and Mg2+:ATP), then UV treated. Blue arrowheads indicate nonspecific, UV-induced, dimerization of CaMKIIKD-AviTag, independent of BzF.
-
Figure 3—source data 1
Uncropped blots used in panel Figure 3B.
- https://cdn.elifesciences.org/articles/86090/elife-86090-fig3-data1-v3.zip
Figure 3—figure supplement 1
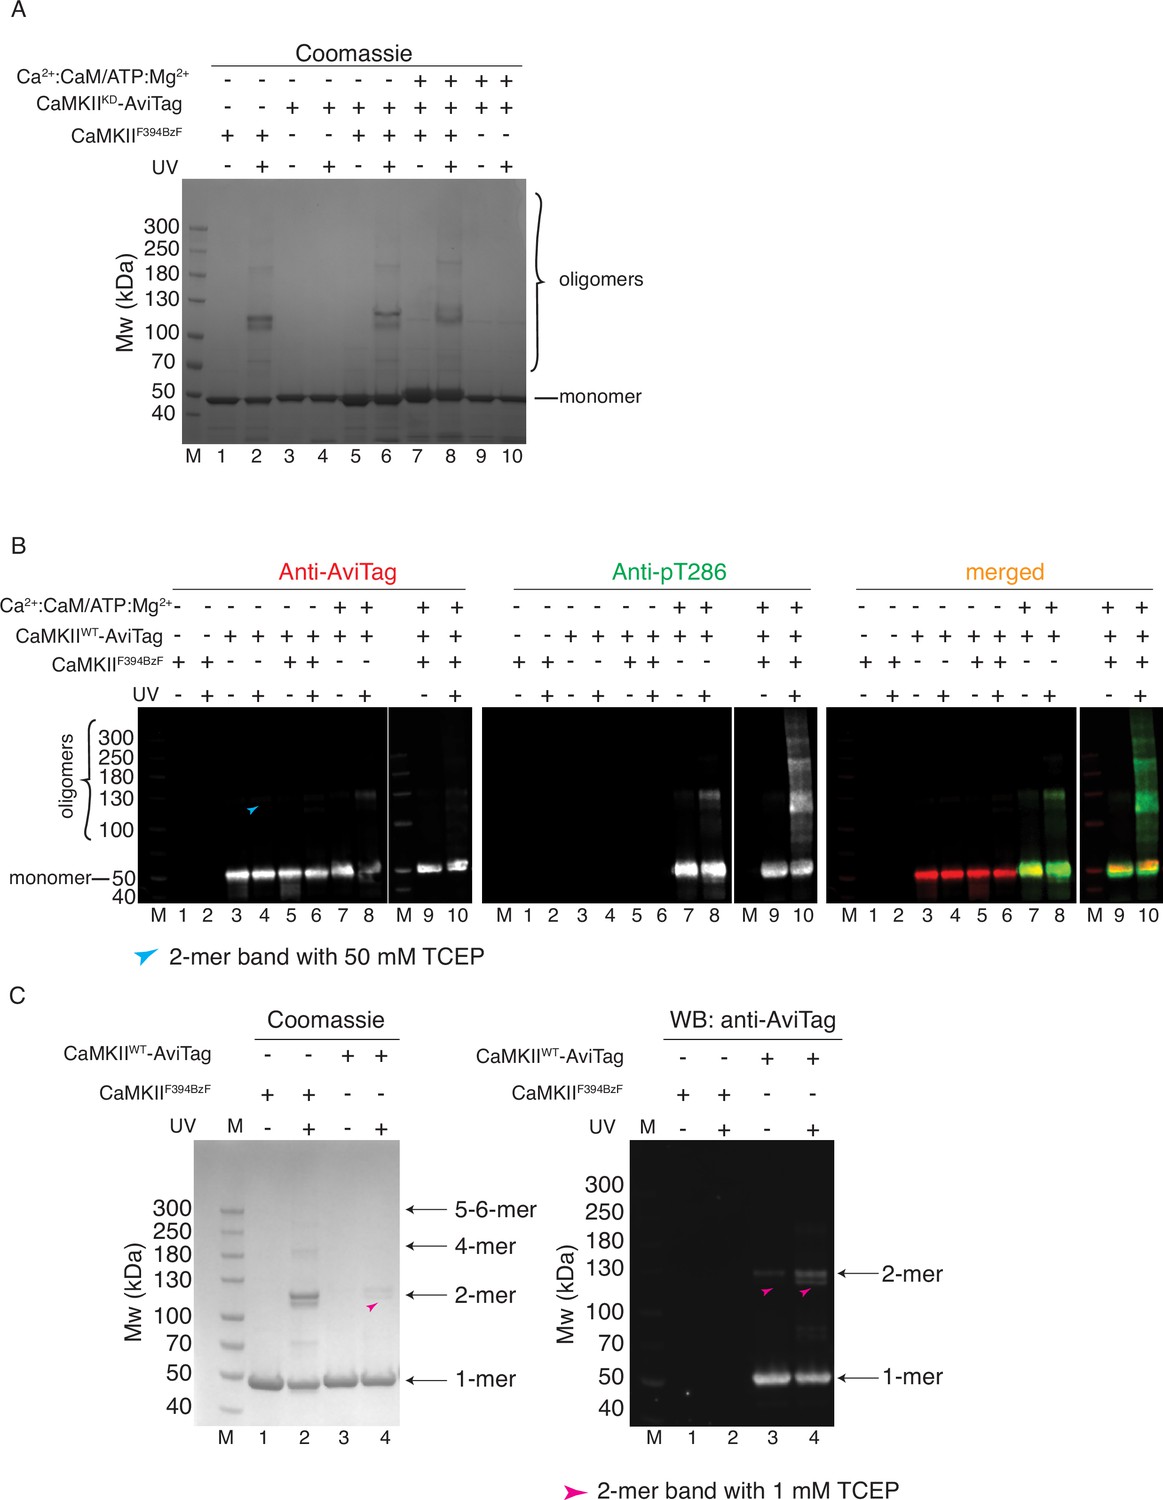
CaMKII holoenzymes do not mix during activation.
(A) Coomassie stained gel of CaMKIIF394BzF and CaMKIIKD crosslinking used in Figure 3B. (B) Western blot detection of potential CaMKIIWT-AviTag incorporation in CaMKIIF394BzF holoenzymes. Blue arrowhead indicates a UV-induced, BzF-independent dimeric band of CaMKIIWT in the presence of 50 mM TCEP. (C) Crosslinking of CaMKIIF394BzF and CaMKIIWT-AviTag in the presence of 1 mM TCEP. Magenta arrowheads in lanes 3 and 4 indicate UV-induced, BzF-independent dimeric bands of CaMKIIWT, which are more abundant here than under conditions in panel B.
-
Figure 3—figure supplement 1—source data 1
Uncropped Coomassie stained gels and blots used in Figure 3—figure supplement 1.
- https://cdn.elifesciences.org/articles/86090/elife-86090-fig3-figsupp1-data1-v3.zip
Figure 4 with 2 supplements
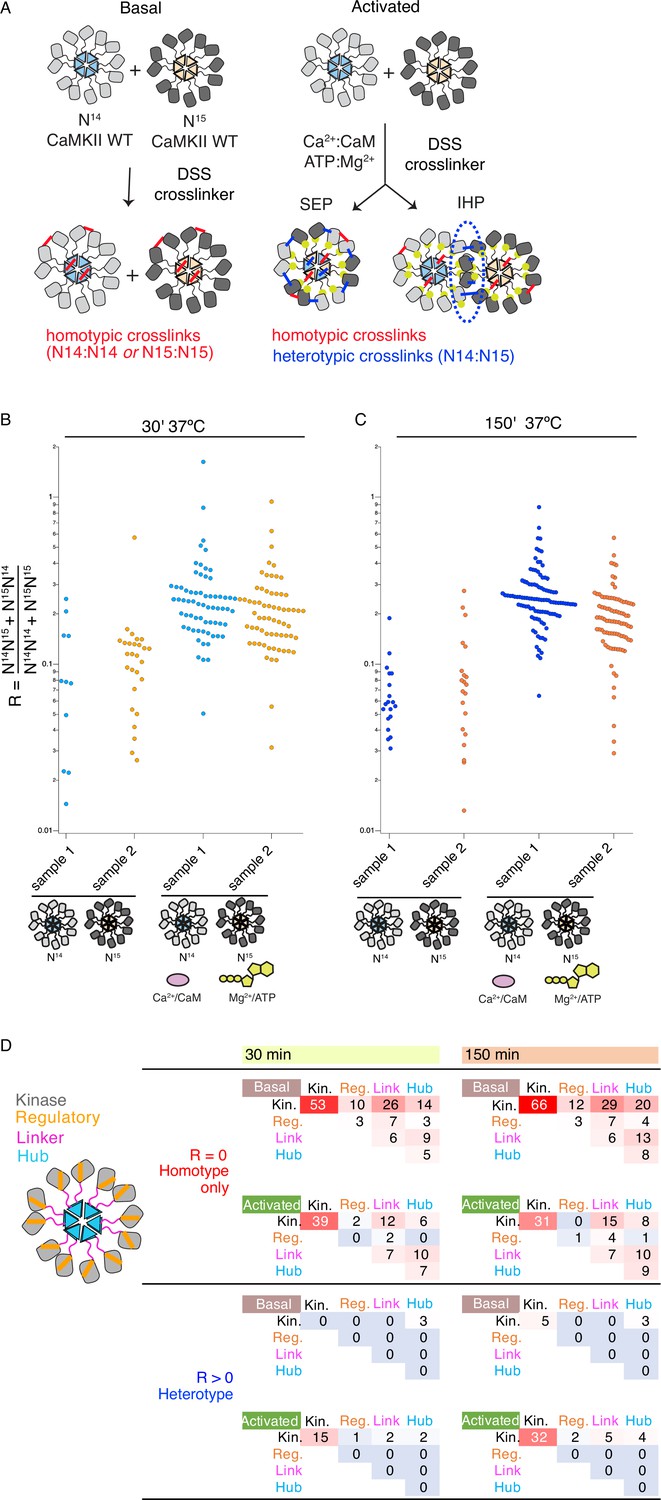
Crosslinking mass spectrometry reveals inter-holoenzyme kinase domain contacts during activation.
(A) Schematic representation of crosslinking experiments and expected outcomes. In the case of subunit exchange, a flat profile of intersubunit crosslinks is expected, whereas for inter-holoenzyme phosphorylation, a bias towards kinase domain crosslinks is expected. (B) Heterotypic interactions plotted as R values of two independent replicates in basal and activating conditions. Incubation time was 30 min, prior to addition of DSS crosslinker. (C) As for panel (B) but with incubation time of 150 min prior to addition of DSS crosslinker. (D) Heat map indicating the number of homotypic (upper) and heterotypic (lower) crosslinks by domain under basal and activating conditions, after 30 and 150 min of incubation. Only peptides that were identified in both samples for each condition were counted in the heat map.
Figure 4—figure supplement 1
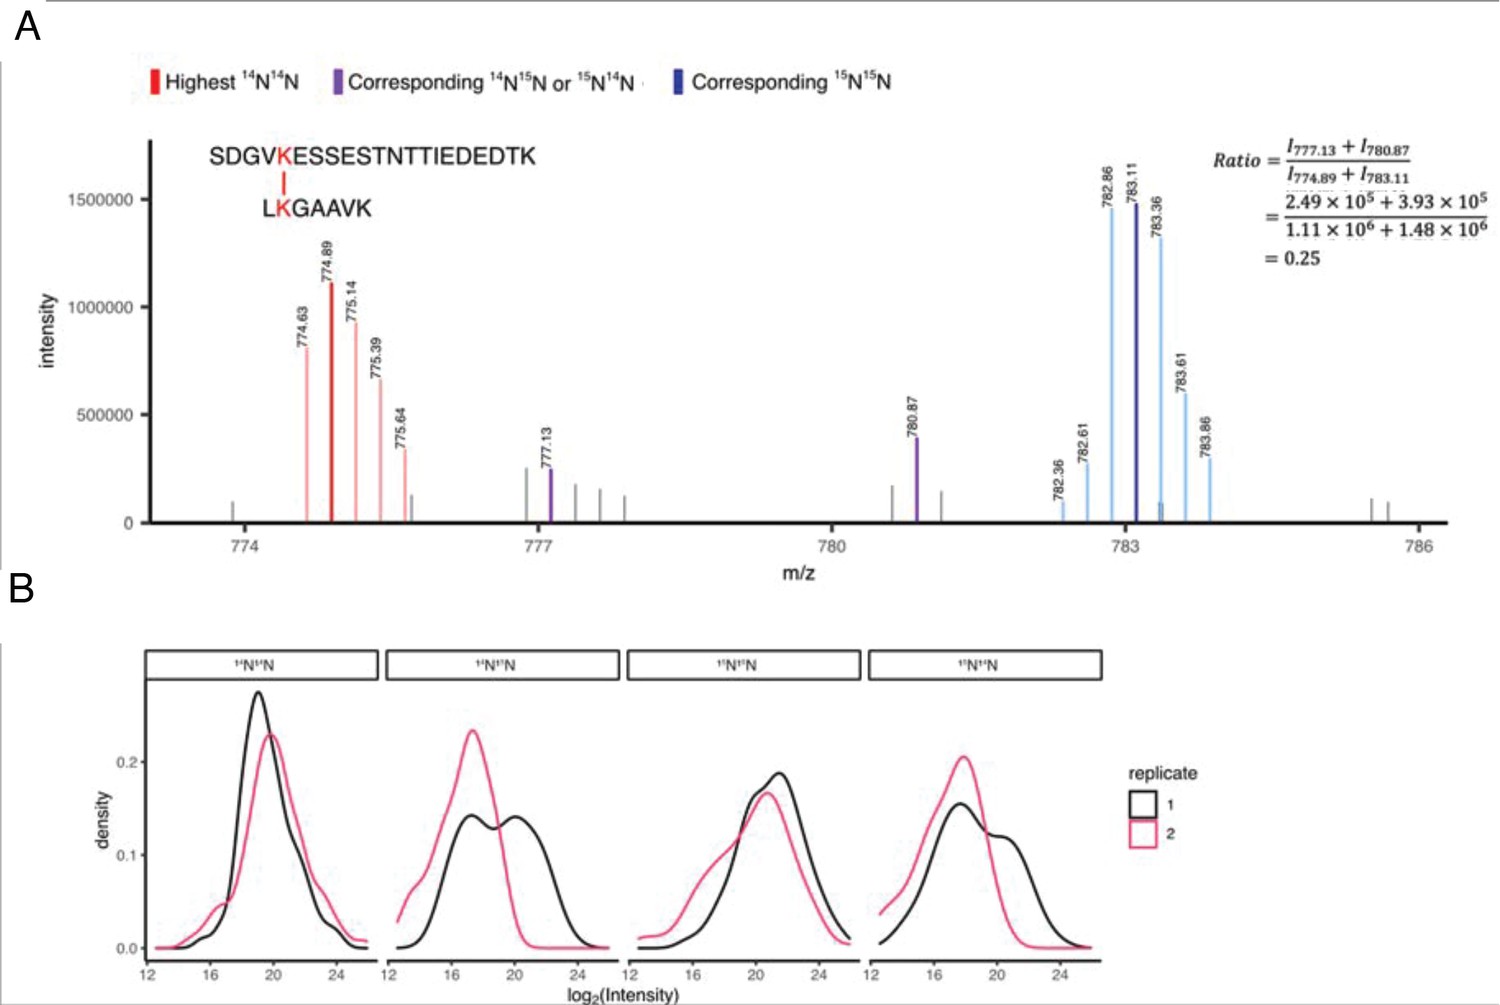
XL-MS identifies interactions of CaMKII holoenzymes.
(A) Zoomed-in exemplary MS1 spectrum showing uni-isotopic (homotypic) and mixed-isotopic (heterotypic) crosslinks. The ratio of mixed-isotopic and uni-isotopic crosslinks is calculated using the intensities of the highest intense peak in each isotopic distribution. (B) The MS1 intensity distribution of the most intense peak of all four isotopic distributions (i.e. 14N14N, 14N15N, 15N14N, 15N15N) showing good reproducibility over replicates.
Figure 4—figure supplement 2
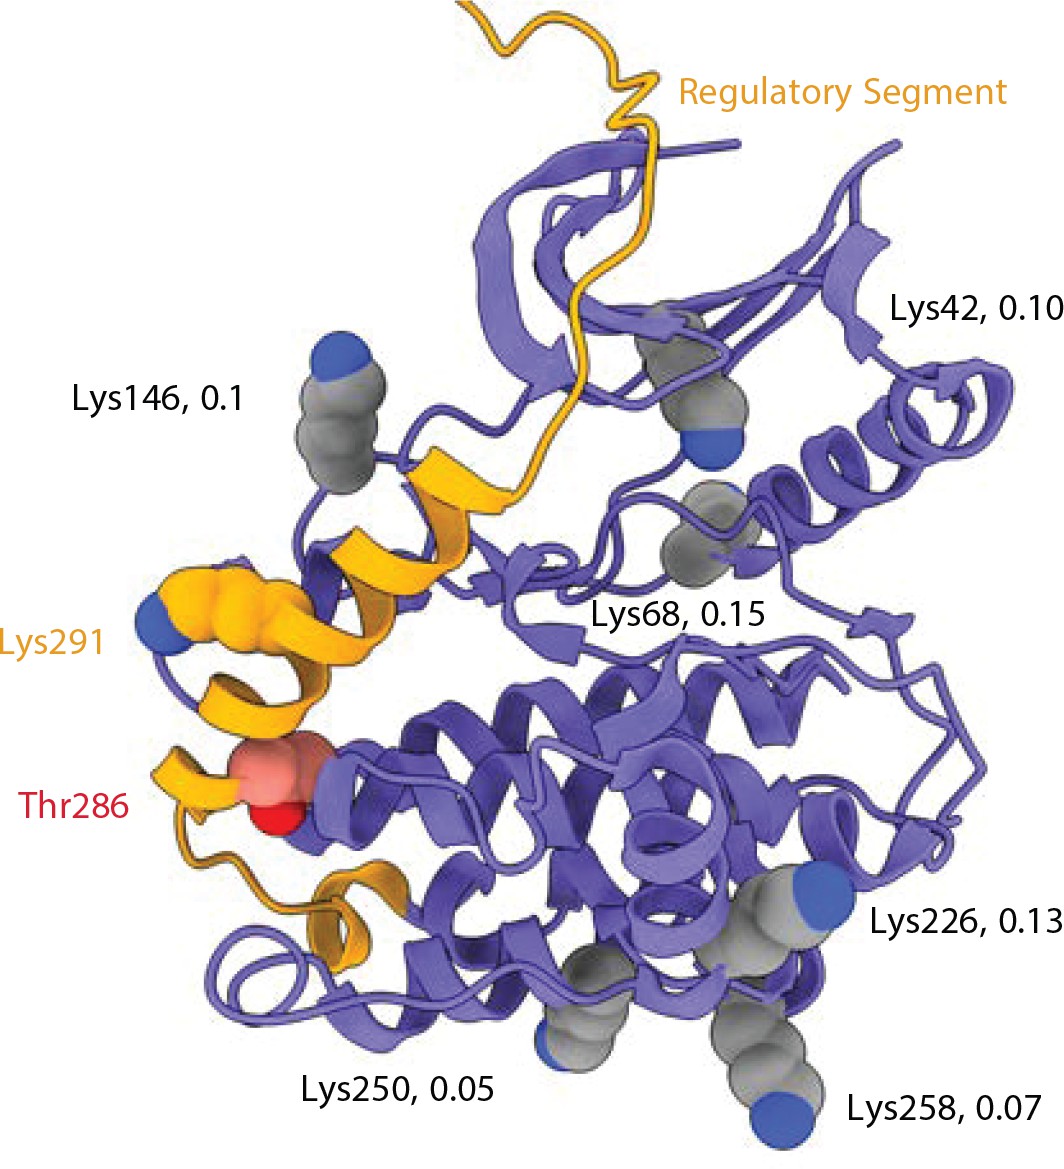
Crosslinking sites involving pT286 peptides from mixed isotypes.
Kinase domain (from the 5u6y PDB structure) with regulatory domain (orange) docked. 6 Lysine residues that gave heterotypic crosslinked peptides including P-Thr286 (DSS link to Lys291) are indicated as spheres. The detection ratio (heterotypic to homotypic mass spectra intensity) for each crosslinked interaction is indicated.
Figure 5 with 1 supplement
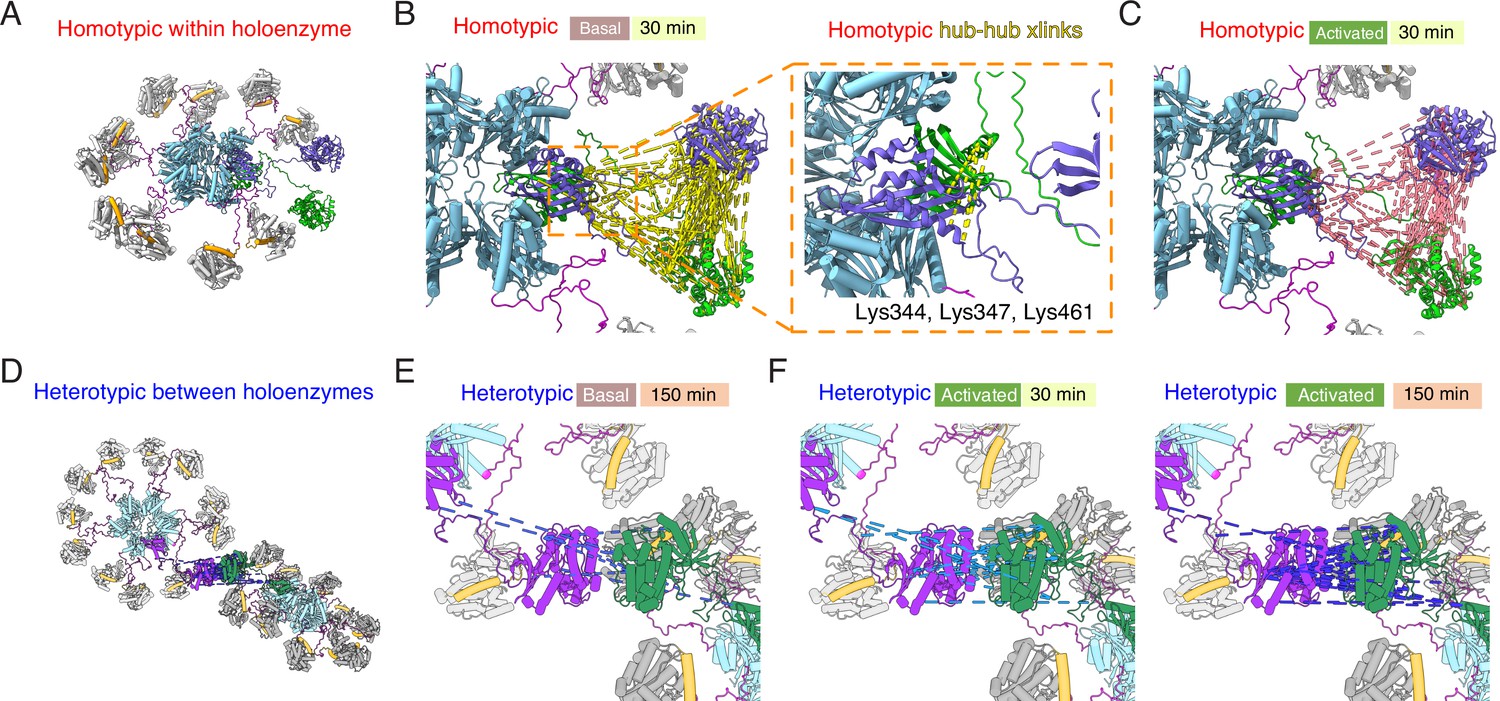
Mapping crosslinks onto holoenzyme structure.
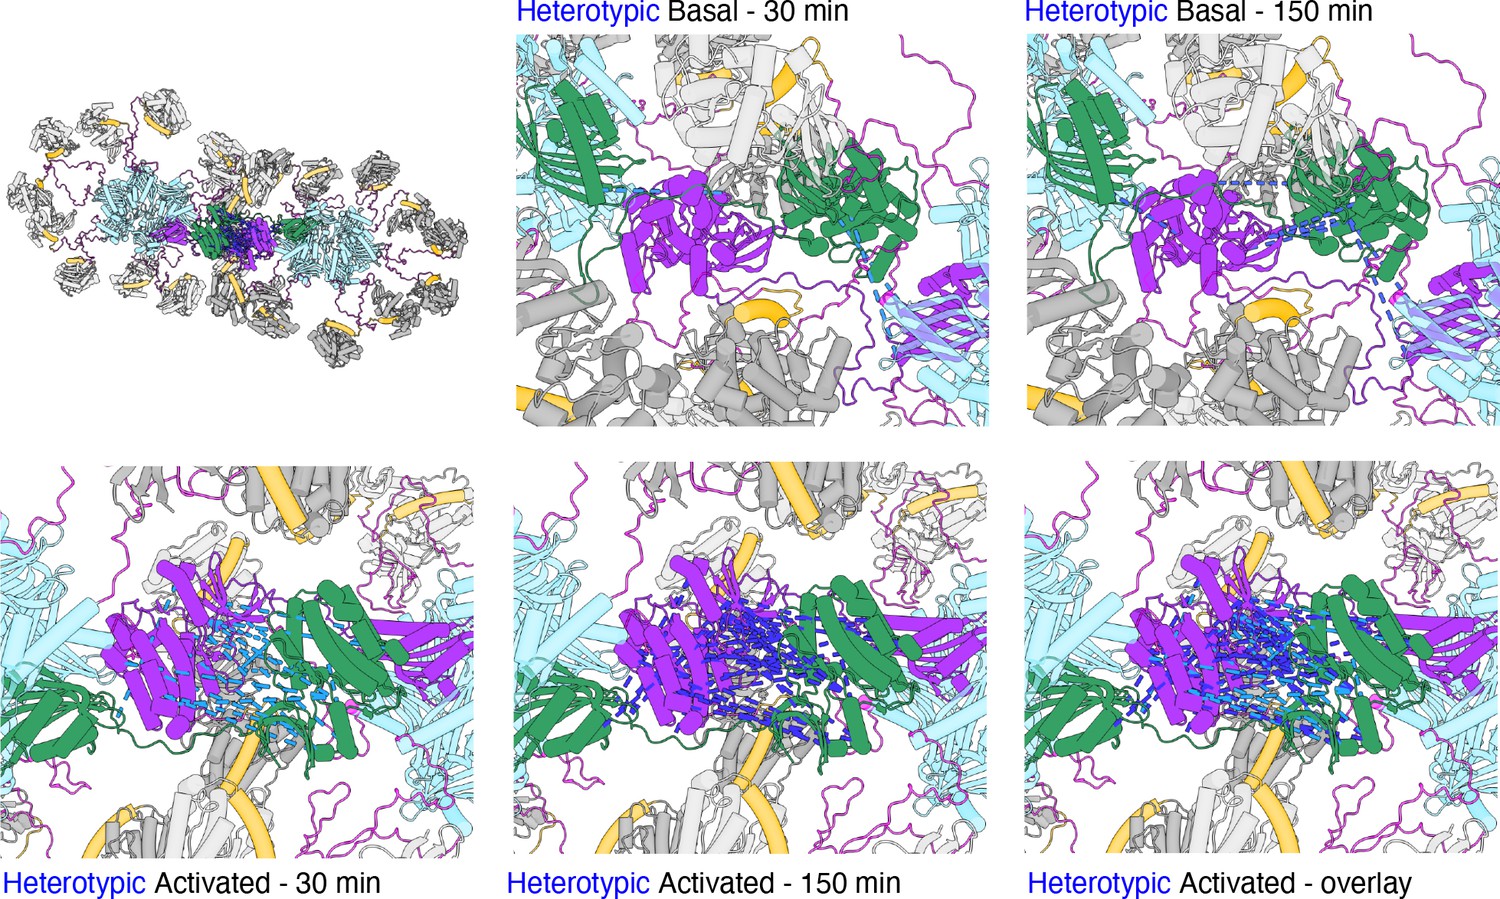
(A) Holoenzyme structure with two neighboring subunits (green and purple) indicated (PDB: 5u6y). Hub domain is in light blue, regulatory segment (docked) in orange. (B) Basal crosslinks between homo-isotypes (30 min incubation, 136 crosslinks as dashed yellow lines) plotted onto the holoenzyme as intersubunit interactions. Inset shows the 5 homo-isotopic crosslinks found for interactions between neighboring hub domains. (C) Crosslinks between homo-isotypes in activated conditions (30 min, 85 crosslinks as pink dashed lines) showed a similar pattern to the basal condition. (D) Two holoenzymes arranged to allow kinase-kinase contacts to form (between green and purple subunits). (E) Sparse heterotypic crosslinks (8 in total, blue dashed lines) in the basal condition after 150 min. All heterotypic crosslinks involve the kinase domain. (F) In activating conditions, 15 heterotypic kinase-kinase interactions were detected after 30 min (out of 20 total). Over 150 min activation, 32 heterotypic kinase-kinase interactions were found (out of 43 total).
Figure 5—figure supplement 1
Hypothetical close mode of holoenzyme interaction from MS crosslinks.
Heterotypic DSS crosslinks between kinase domains have plausible lengths (less than 20 Å) when one kinase domain from a holoenzyme is interdigitated into the structure of another holoenzyme. Hub domains are in light blue, regulatory domains (docked) in orange. Docking was done by hand to minimize clashes (see text for details).
Figure 6 with 2 supplements
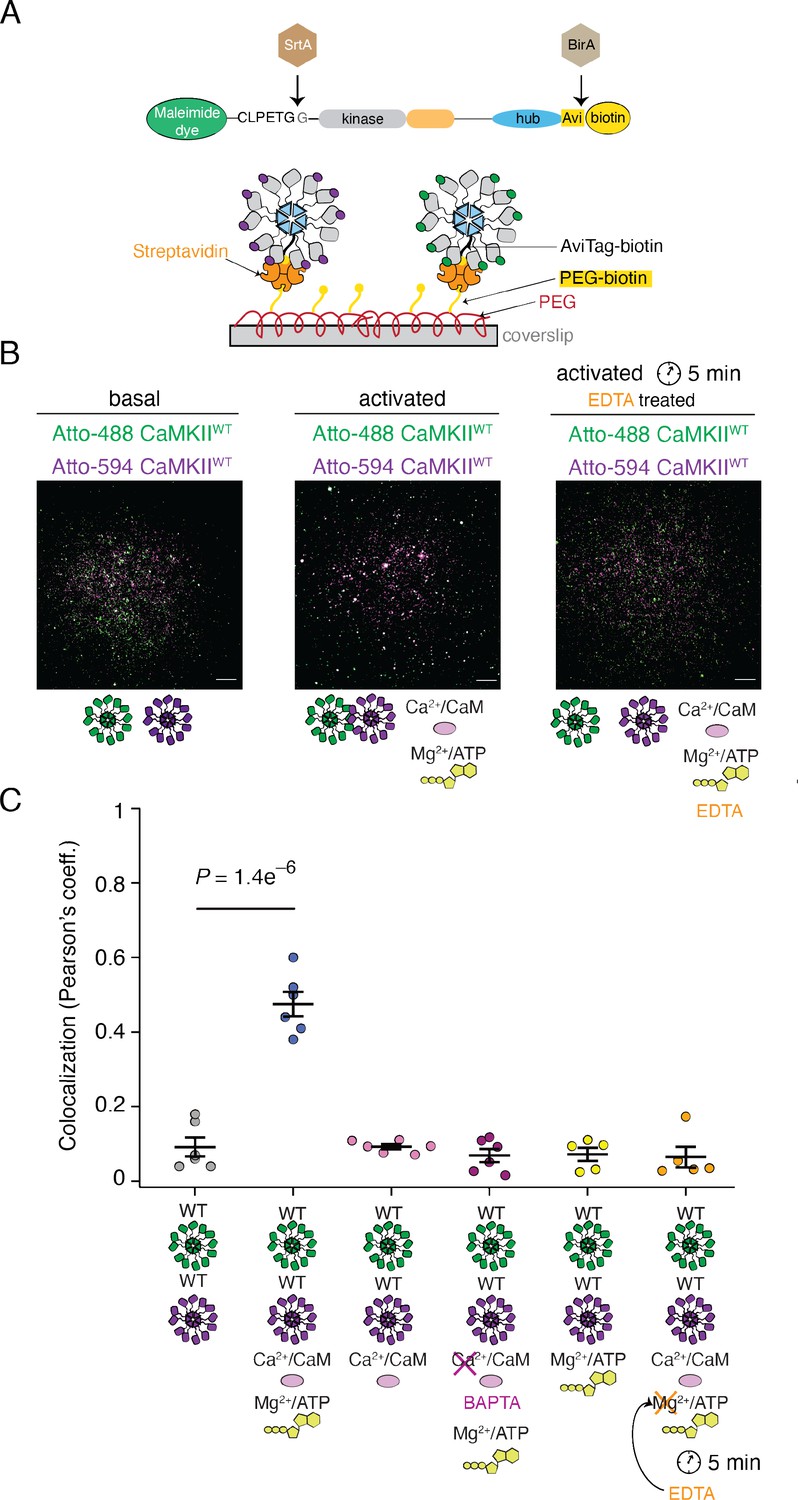
Reversible activity-dependent colocalization of CaMKII holoenzymes.
(A) Schematic representation of CaMKII in vitro enzymatic labeling with maleimide dyes and biotin, and TIRF experimental set-up. (B) Representative TIRF images of unactivated (basal) CaMKIIWT sample (left), activated CaMKIIWT sample (middle), and CaMKIIWT sample first activated and then quenched with EDTA (right). Raw, unprocessed, images are shown. (C) Summary of colocalization analysis (Pearson coefficient) for TIRF images for CaMKII under different conditions. Statistical significance was calculated using a multi-comparison test (Dunnett test) with α=0.05. Mean and standard deviation of the mean are indicated. Each condition was done at least two times on different days, with different protein preps. Five ROIs coming from different slides were selected for analysis for each condition. Scale bar: 10 µm.
Figure 6—figure supplement 1
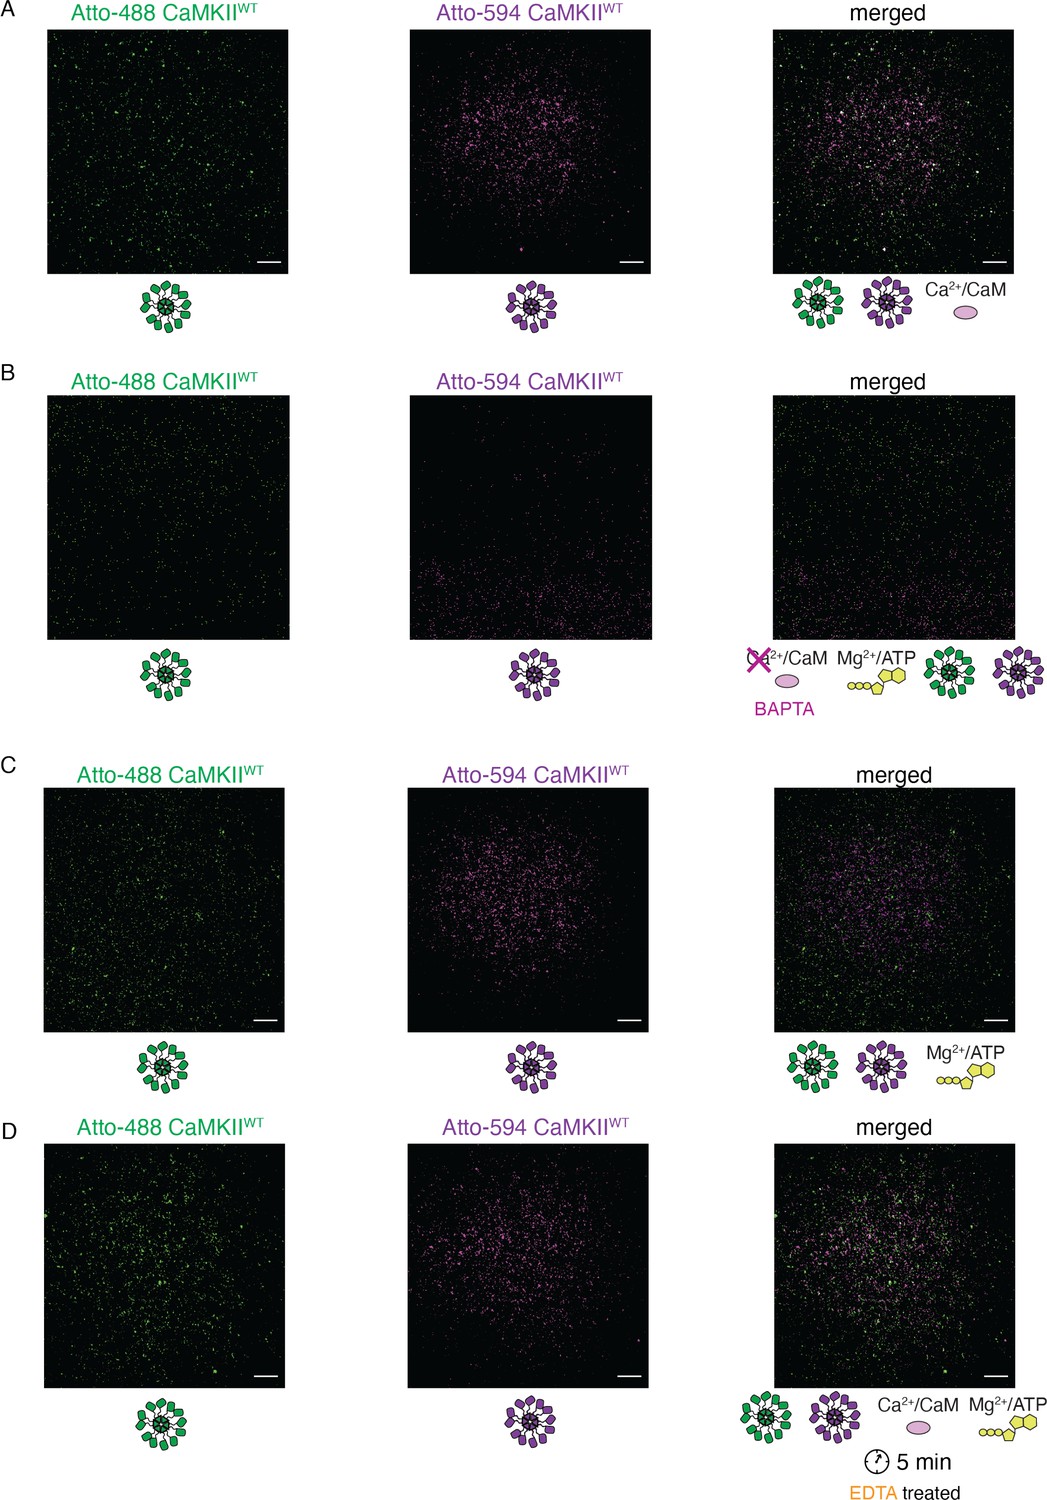
Activation stimuli are necessary for CaMKIIWT holoenzyme colocalization.
(A) Absence of colocalization between differently labeled CaMKIIWT holoenzymes in the absence of Mg2+:ATP. (B) Absence of colocalization between differently labeled CaMKIIWT holoenzymes upon chelation of Ca2+ by BAPTA. (C) Absence of colocalization between differently labeled CaMKIIWT holoenzymes in the absence of CaM. (D) Absence of colocalization between differently labeled CaMKIIWT holoenzymes incubated first in activating conditions, and following later chelation of Mg2+ by EDTA. Scale bar: 10 µm.
Figure 6—figure supplement 2
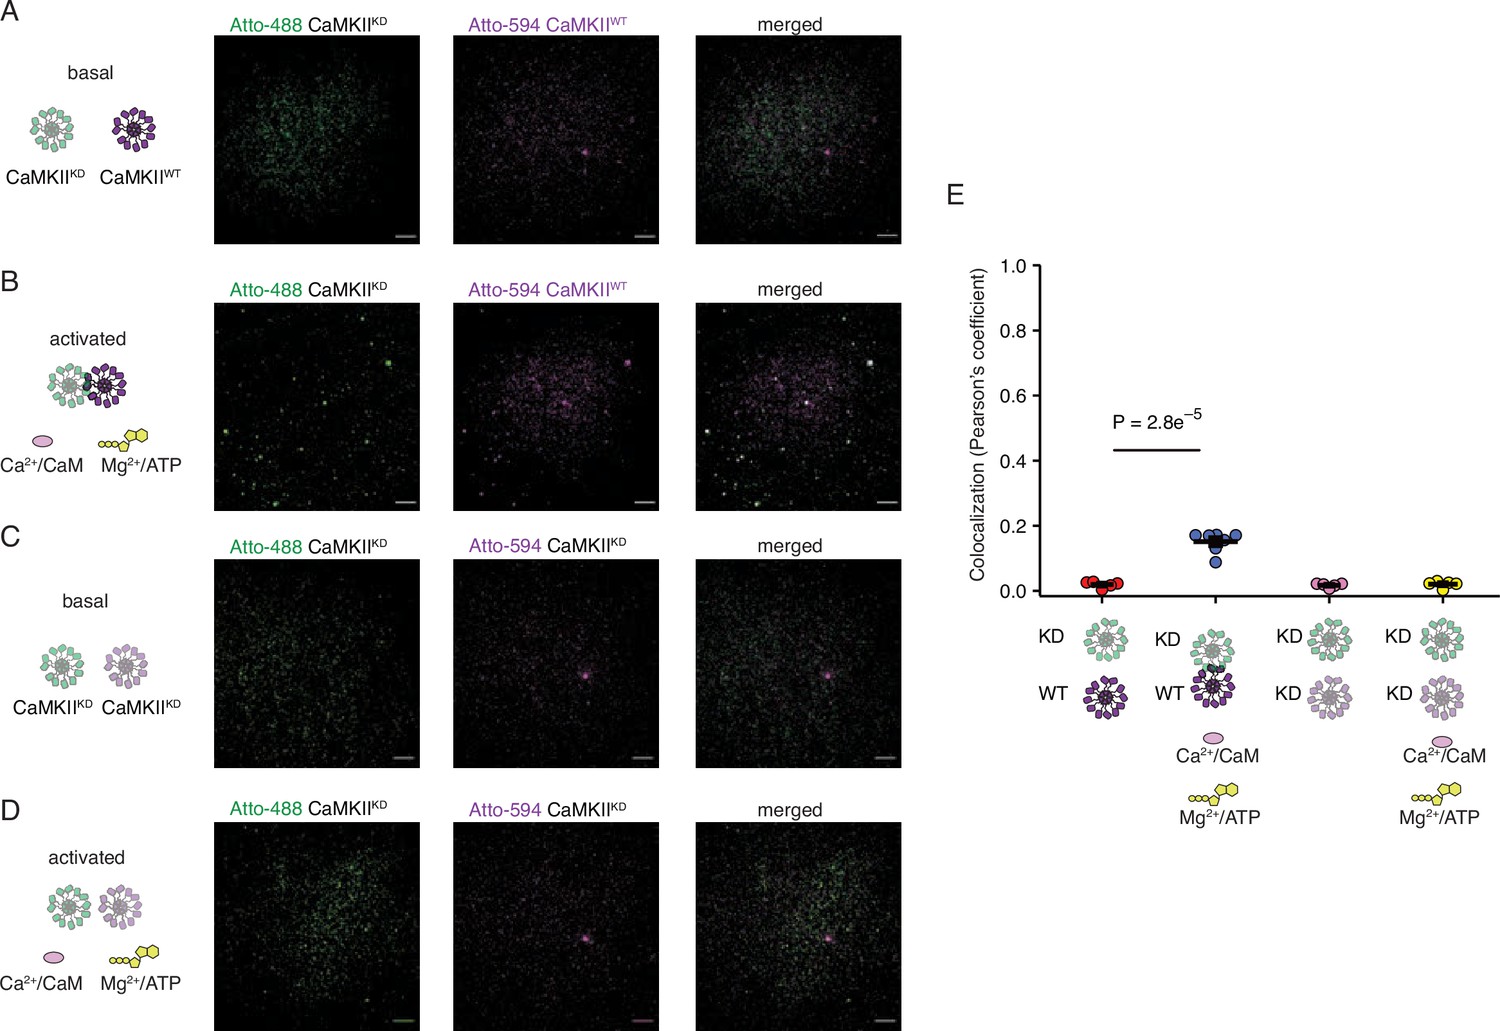
CaMKIIKD holoenzymes cluster only in the presence of activated CaMKIIWT holoenzymes.
(A) Absence of colocalization between CaMKIIKD and CaMKIIWT in basal conditions. (B) Colocalization of CaMKIIKD and CaMKIIWT upon activation. (C) Absence of colocalization between differently labeled CaMKIIKD in basal conditions. (D) Absence of colocalization between differently labeled CaMKIIKD in activating conditions. (E) Summary of colocalization analysis. Probability of no difference from Dunnett’s multiple comparison test. Scale bar: 10 µm.
Figure 7 with 2 supplements
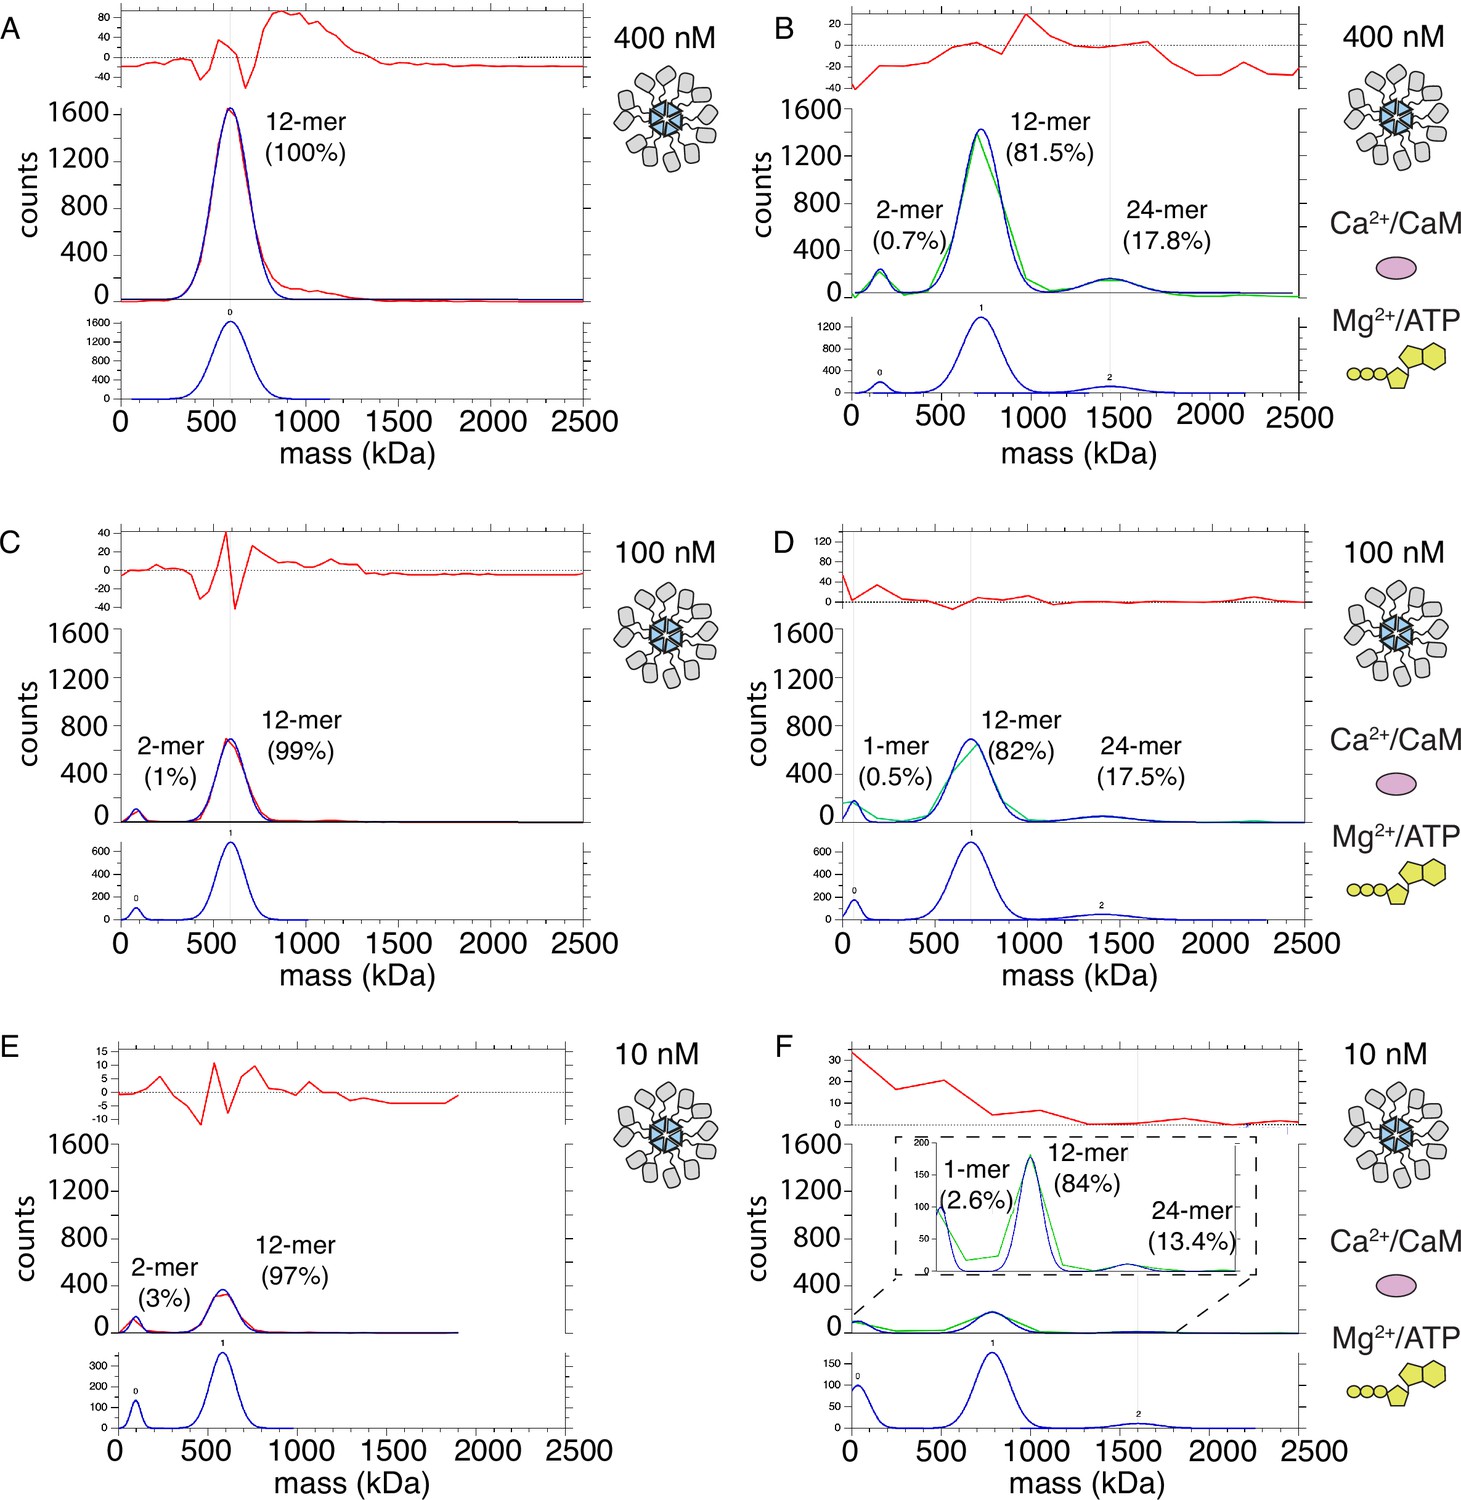
Mass photometry detects clusters of holoenzymes forming upon activation.
(A) Mass distribution of 400 nM CaMKIIWT under basal conditions (red curve). Blue curve is multi- Gaussian fit (shown separately on lower graph). Red curve in upper graph is the fit residual. (B) Mass distribution of 400 nM CaMKIIWT under activating conditions (green curve), with multi- Gaussian fit in blue (peaks numbered in lower graph). (C) Mass distribution of 100 nM CaMKIIWT under basal conditions (red curve). (D) Mass distribution of 100 nM CaMKIIWT under activating conditions (green curve). (E) Mass distribution of 10 nM CaMKIIWT under basal conditions (red curve). (F) Mass distribution of 10 nM CaMKIIWT under activating conditions (green curve). Inset shows fit on expanded scale.
Figure 7—figure supplement 1
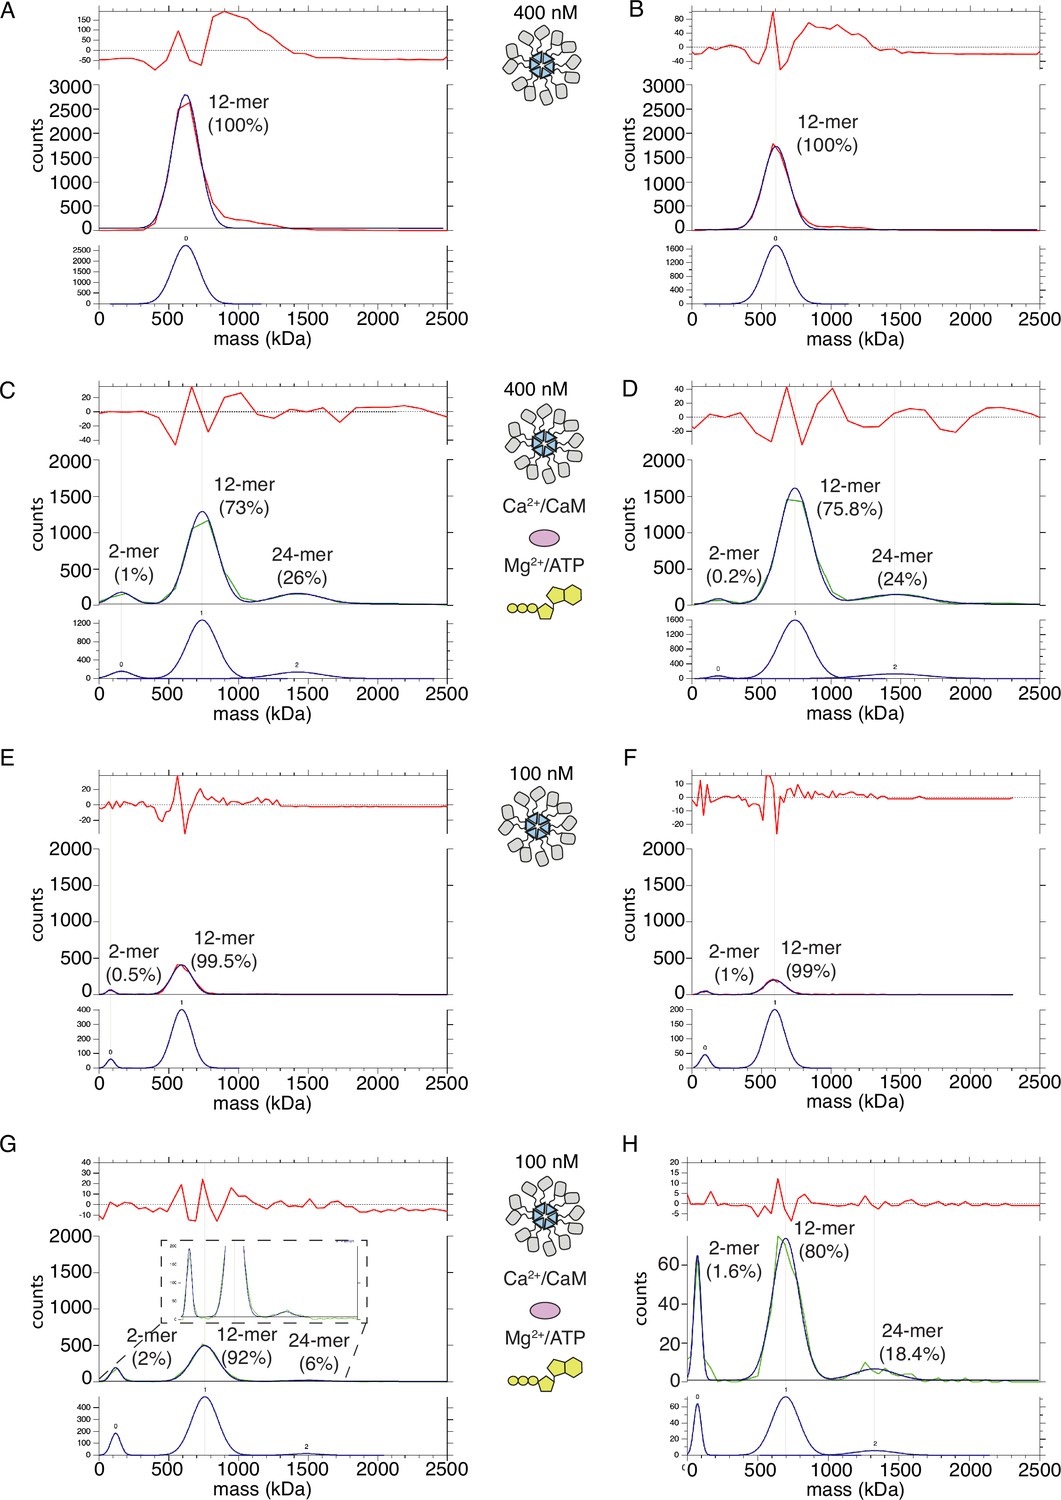
CaMKIIWT forms higher order clusters during activation.
(A) Two replicates of the particle mass distribution of 400 nM CaMKIIWT under basal conditions (red curve). Blue curve is multi-Gaussian fit (shown separately on lower graph). Red curve in upper graph is the fit residual. (B) Two replicates of the particle mass distribution of 400 nM CaMKIIWT under activating conditions (green curve). (C) Two replicates of the particle mass distribution of 100 nM CaMKIIWT under basal conditions (red curve). (D) Two replicates of the particle mass distribution of 100 nM CaMKIIWT under activating conditions (green curve).
Figure 7—figure supplement 2
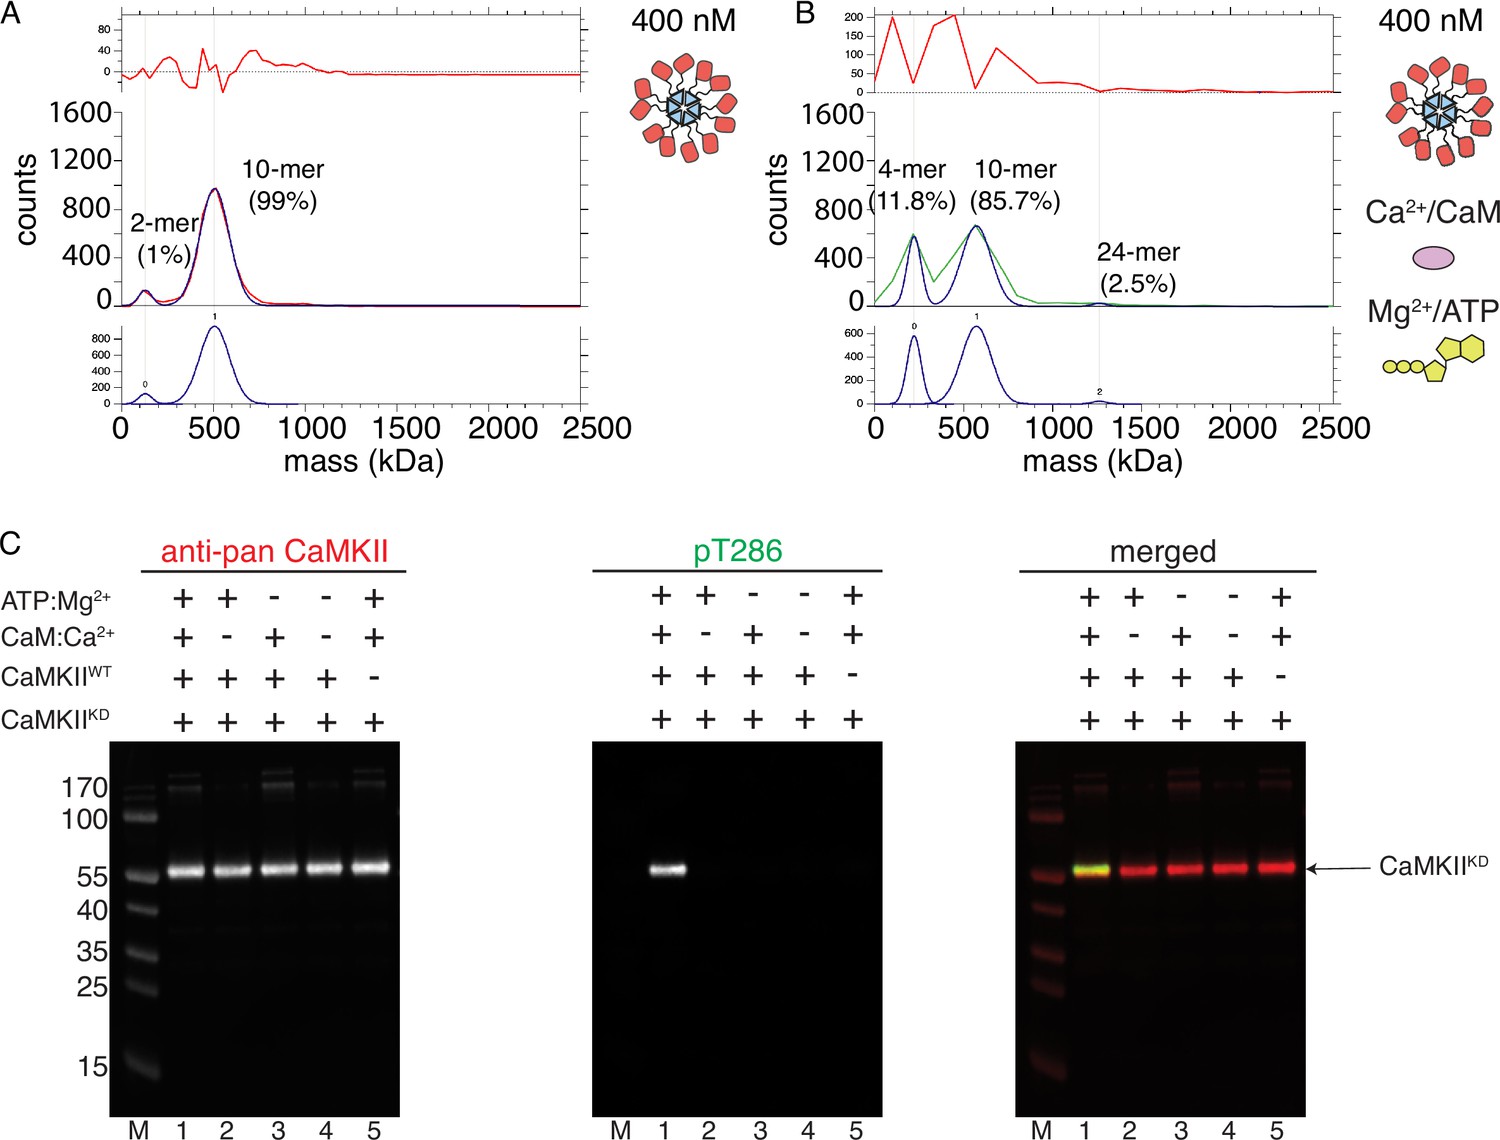
CaMKIIKD fails to form higher order clusters during activation.
(A) Particle mass distribution of 400 nM CaMKIIKD under basal conditions. (B) Particle mass distribution of 400 nM CaMKIIKD under activating conditions. (C) Western blot detection of pT286 on CaMKIIKD-AviTag. Left blot – detection of total CaMKII, middle blot – detection of phosphorylation on T286, right blot – merged signals of total CaMKII and pT286. Lane 1–4 µM CaMKIIKD-AviTag, 10 nM CaMKIIWT, 2 µM Ca2+CaM, 100 µM ATP:Mg2+; Lane 2–4 µM CaMKIIKD-AviTag, 10 nM CaMKIIWT, 100 µM ATP:Mg2+; Lane 3–4 µM CaMKIIKD-AviTag, 10 nM CaMKIIWT, 2 µM Ca2+CaM; Lane 4–4 µM CaMKIIKD-AviTag, 10 nM CaMKIIWT; Lane 5–4 µM CaMKIIKD-AviTag, 2 µM Ca2+CaM, 100 µM ATP:Mg2+.
-
Figure 7—figure supplement 2—source data 1
Uncropped blots used in Figure 7—figure supplement 2C.
- https://cdn.elifesciences.org/articles/86090/elife-86090-fig7-figsupp2-data1-v3.zip
Additional files
-
Supplementary file 1
Crosslinked peptides identified by MS X-linking.
(A) Homotypic crosslinks (basal, 30 min). (B) Homotypic crosslinks (basal, 150 min). (C) Heterotypic crosslinks (basal, 30 min). (D) Heterotypic crosslinks (basal, 150 min). (E) Homotypic crosslinks (activated, 30 min). (F) Homotypic crosslinks (activated, 150 min). (G) Heterotypic crosslinks (activated, 30 min). (H) Heterotypic crosslinks (activated, 150 min) (I) pT286 Heterotypic peptides (30 min). (J) pT286 Heterotypic peptides (150 min).
- https://cdn.elifesciences.org/articles/86090/elife-86090-supp1-v3.pdf
-
MDAR checklist
- https://cdn.elifesciences.org/articles/86090/elife-86090-mdarchecklist1-v3.pdf
Download links
A two-part list of links to download the article, or parts of the article, in various formats.
Downloads (link to download the article as PDF)
Open citations (links to open the citations from this article in various online reference manager services)
Cite this article (links to download the citations from this article in formats compatible with various reference manager tools)
CaMKII autophosphorylation can occur between holoenzymes without subunit exchange
eLife 12:e86090.
https://doi.org/10.7554/eLife.86090


