Low-level repressive histone marks fine-tune gene transcription in neural stem cells
- Life Sciences Institute, University of Michigan-Ann Arbor, United States
- Centre for Neural Circuits and Behaviour, University of Oxford, United Kingdom
- Department of Biomolecular Chemistry, University of Wisconsin-Madison, United States
- Department of Cell and Developmental Biology, University of Michigan Medical School, United States
- Division of Genetic Medicine, Department of Internal Medicine, University of Michigan Medical School, United States
- Rogel Cancer Center, University of Michigan Medical School, United States
Figures
Figure 1 with 1 supplement
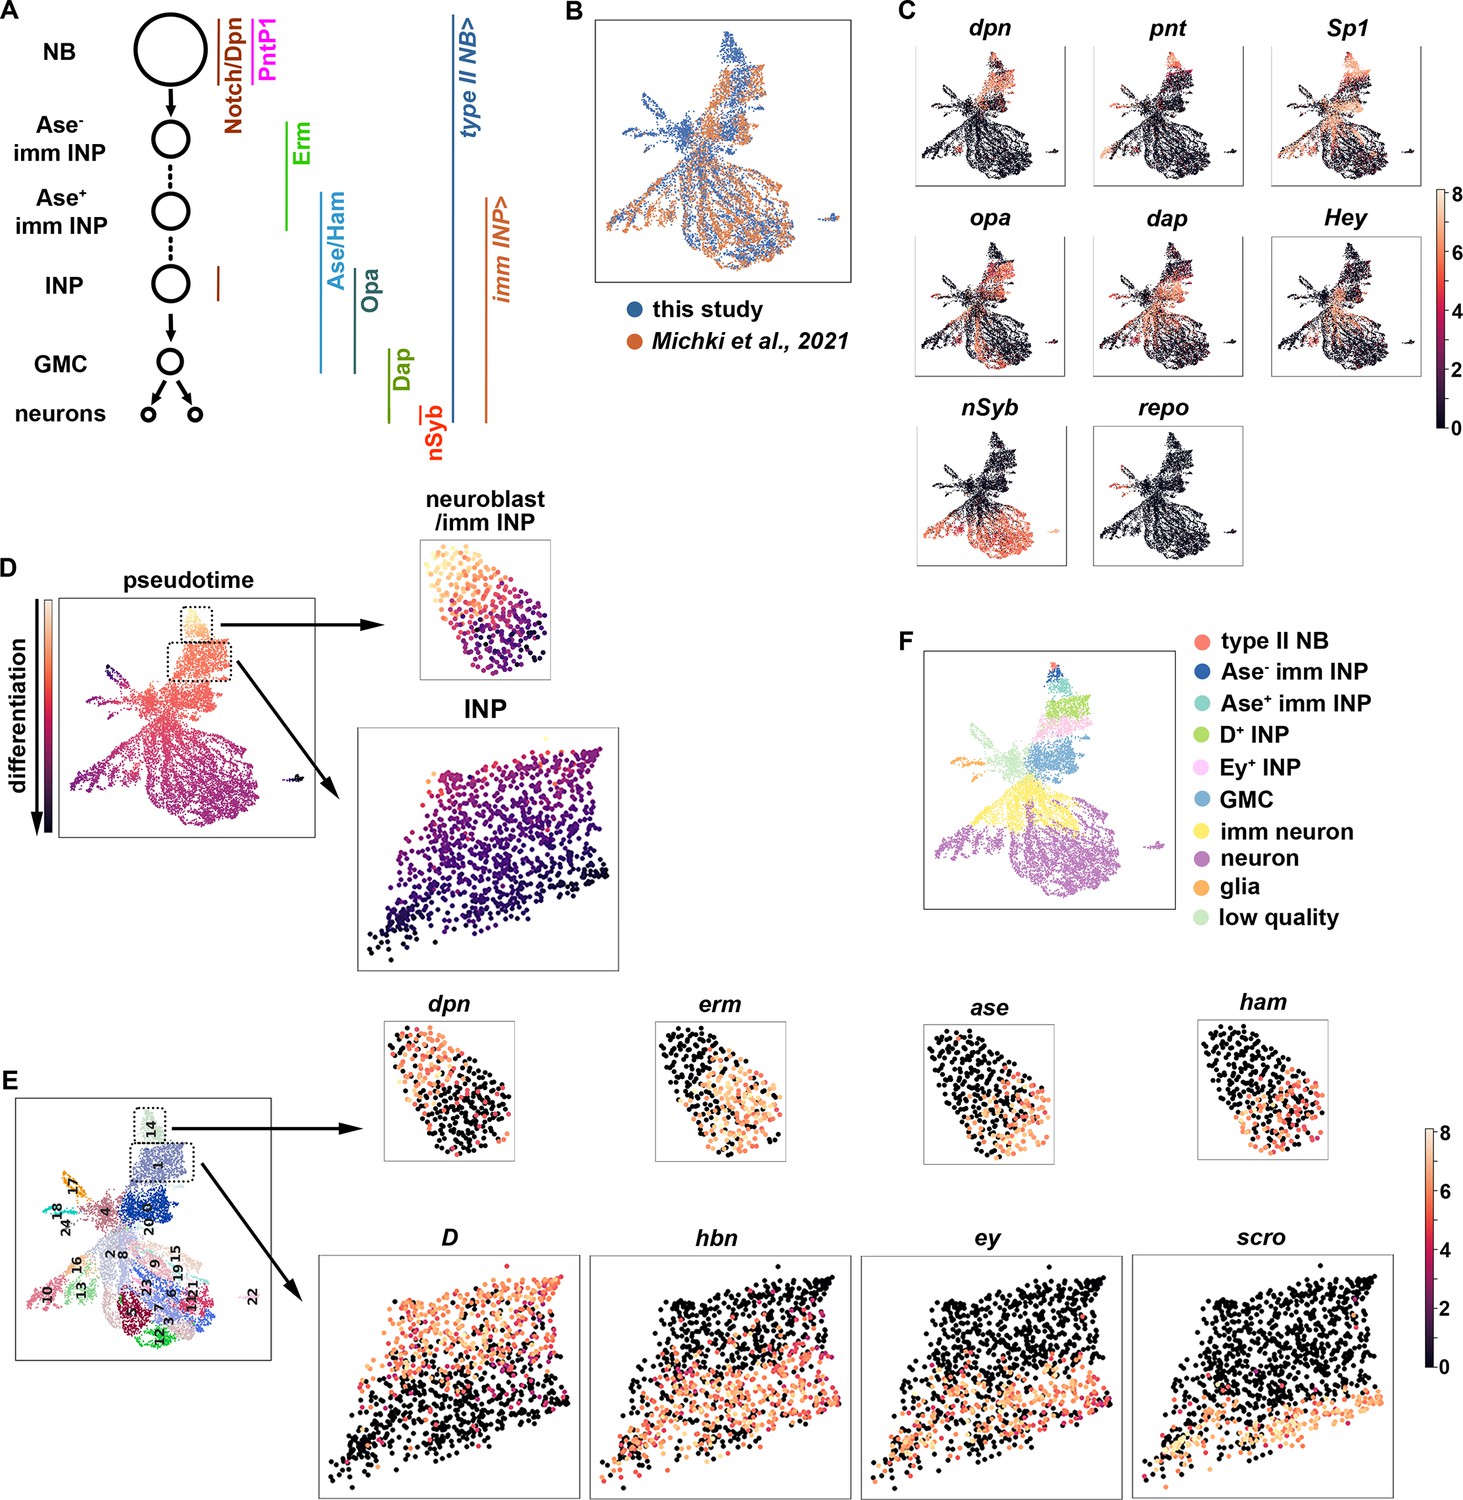
A single-cell gene expression atlas of type II neuroblast lineages.
(A) Summary illustration of gene and Gal4 driver expression patterns in the type II neuroblast lineage. The type II NB Gal4 driver: Wor-Gal4,Ase-Gal80. imm INP driver: R9D11-Gal4. (B) Harmonization of the scRNA-seq dataset from the entire type II neuroblast (NB) lineage generated in this study (blue) and our previously published scRNA-seq dataset which were limited to INPs and their progeny (orange). The genotype of larval brains used for scRNA-seq in this study: UAS-dcr2; Wor-Gal4, Ase-Gal80; UAS-RFP::stinger. (C) UMAPs of known cell-type-specific marker genes. Color intensity indicated scaled (log1p) gene expression value. (D) Pseudotime analysis starting from cells enriched for dpn, pnt, and RFP transcripts. (E) Left: Leiden clustering of the scRNA-seq atlas. Right: Representative UMAPs of dynamically expressed transcription factors from clusters 14 (NBs and immature INPs) and 1 (INPs). Color intensity indicated scaled (log1p) gene expression value. (F) Annotated gene expression atlas of a wild-type type II neuroblast lineage.
Figure 1—figure supplement 1

Quality control data for the scRNA-seq atlas.
(A) The expression pattern of the type II NB Gal4 driver (Wor-Gal4,Ase-Gal80) used in fluorescently labeling and sorting cell types in the type II neuroblast lineage. RFP is detectable in the nuclei of all type II neuroblasts and their progeny. (B) Violin plots showing (Top) number of genes or (Bottom) mitochondrial UMI percentage for Leiden clusters shown in 1 F. Clusters with low number of genes and higher mitochondrial UMI percentage suggest low-quality or dying cells.
Figure 2 with 1 supplement
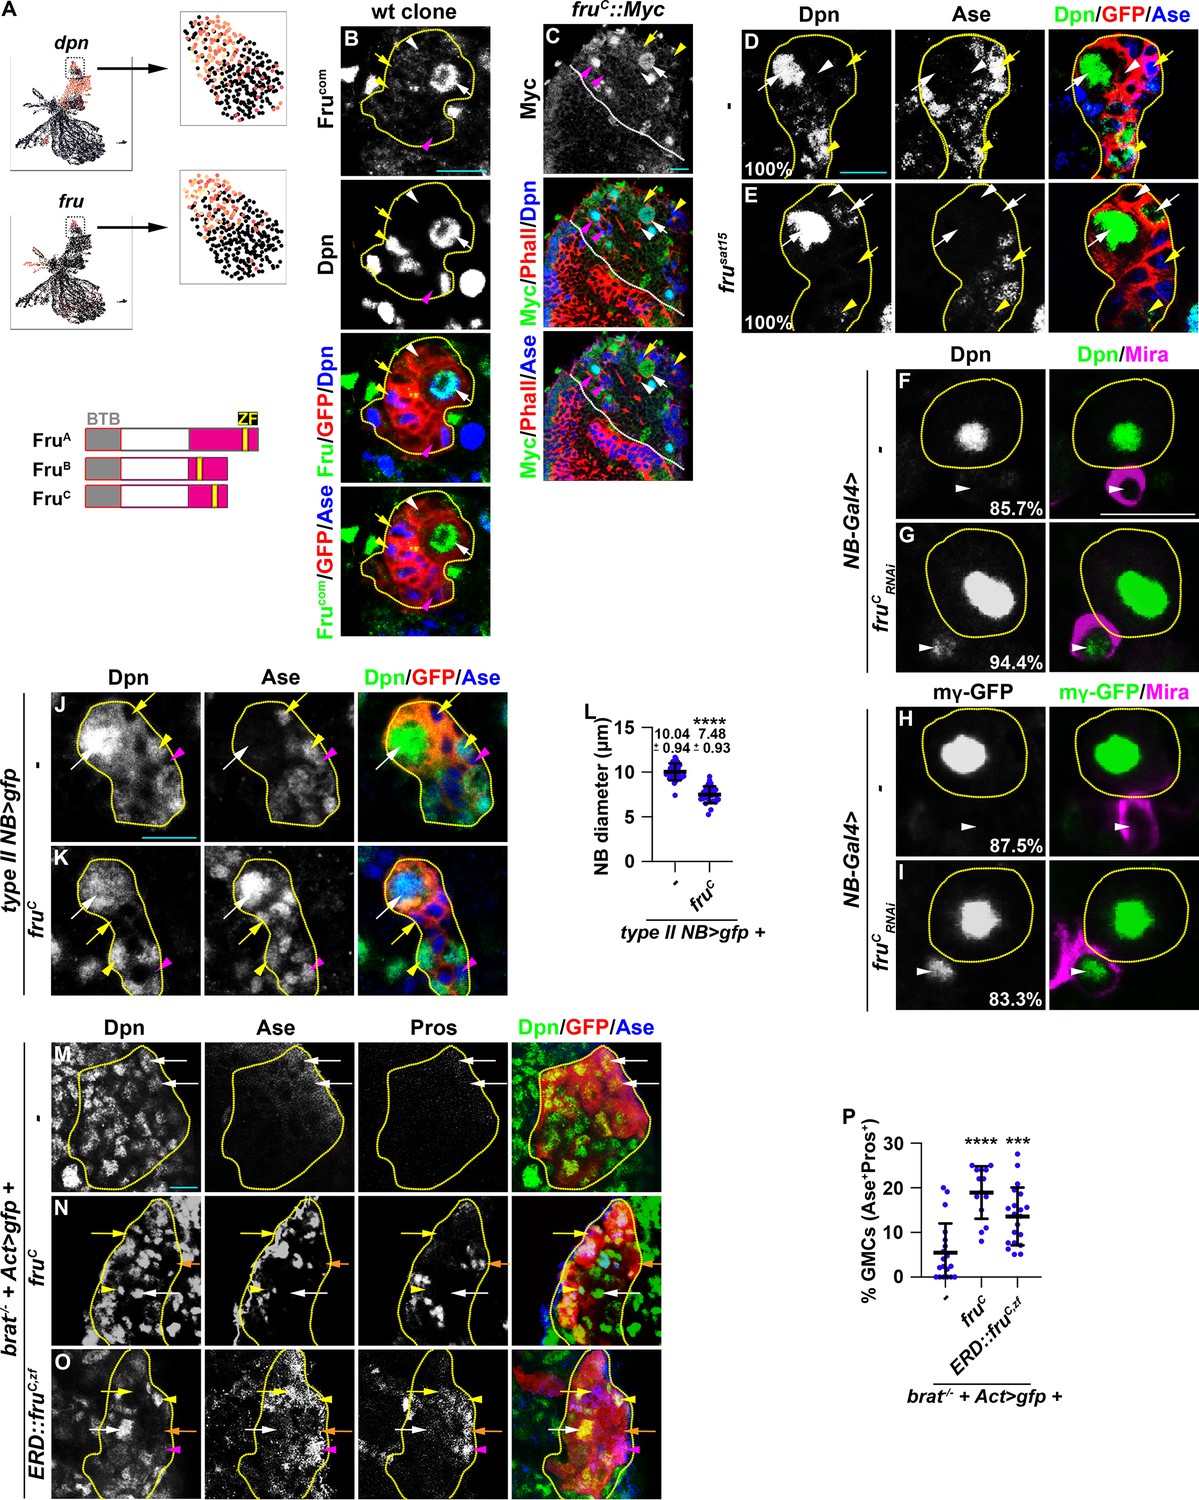
Fruc functions through transcriptional repression to regulate stemness gene expression.
(A) Top: fru and dpn mRNAs are highly enriched in neuroblasts in cluster 14 of the scRNA-seq dataset, but only dpn mRNAs are detected in INPs in cluster 1. Bottom: Domains in Fru protein isoforms. ZF: zinc-finger DNA-binding domain. (B) Fru protein is detected in the neuroblast but not in INPs in a GFP-marked type II neuroblast lineage clone. The genotype used in this experiment is Elav-Gal4,UAS-mCD8::GFP,hs-flp; FRT82B,Tub-Gal80/FRT82B. (C) Endogenously expressed FruC tagged by a Myc epitope (fruC::Myc) is detected in type I and II neuroblasts but not in their differentiating progeny. (D–E) Immature INPs in GFP-marked wild-type type II neuroblast clones never show detectable Dpn expression (100%). 1–2 Ase- immature INP per fru-null (frusat15) type II neuroblast clone show detectable Dpn expression (100%). The genotype in this experiment is Elav-Gal4,UAS-mCD8::GFP,hs-flp; FRT82B,Tub-Gal80/FRT82B,fruSat15. (F–I) The newborn immature INP marked by cortical Miranda staining show undetectable Dpn and E(spl)mγ::GFP expression in the majority of wild-type clones (85.7%). Reducing fruC function leads to ectopic Dpn and E(spl)mγ::GFP expression in the newborn immature INP in most type II neuroblast lineages (94.4%). NB-Gal4: Wor-Gal4. (J–L) Type II neuroblasts overexpressing Fruc display characteristics of differentiation including a reduced cell diameter and aberrant Ase expression. Quantification of the cell diameter is shown in L. (type II NB>: Wor-Gal4, Ase-Gal80). (M–P) Overexpressing full-length Fruc or a constitutive transcriptional repressor form of FruC (Fruc,zf::ERD) is sufficient to partially restore differentiation in brat-null type II neuroblast clones (brat11/Df(2 L)Exel8040,hs-flp; Act5C-Gal4>FRT > FRT>UAS-GFP/UAS-fruC or ERD::fruC,zf). The percentage of GMCs per clone is shown in P. Yellow dashed line encircles a type II neuroblast lineage. White dotted line separates optic lobe from brain. white arrow: type II neuroblast; white arrowhead: Ase- immature INP; yellow arrow: Ase+ immature INP; yellow arrowhead: INP; magenta arrow: type I neuroblast; magenta arrowhead: GMC. Scale bars: 10 μm. p-values: ***<0.0005, and ****<0.00005.
Figure 2—figure supplement 1

FruA and FruB are ubiquitously expressed in neuroblast lineages.
(A) Endogenously expressed FruA::Myc or (B) FruB::Myc are ubiquitously detected in type I & II neuroblasts or their differentiating progeny. White dotted line separates the optic lobe from the brain. White dashed line separates brain from the optic lobe. white arrow: type II neuroblast; white arrowhead: Ase- immature INP; yellow arrow: Ase+ immature INP; yellow arrowhead: INP; magenta arrow: type I neuroblast; magenta arrowhead: GMC.
Figure 3 with 1 supplement
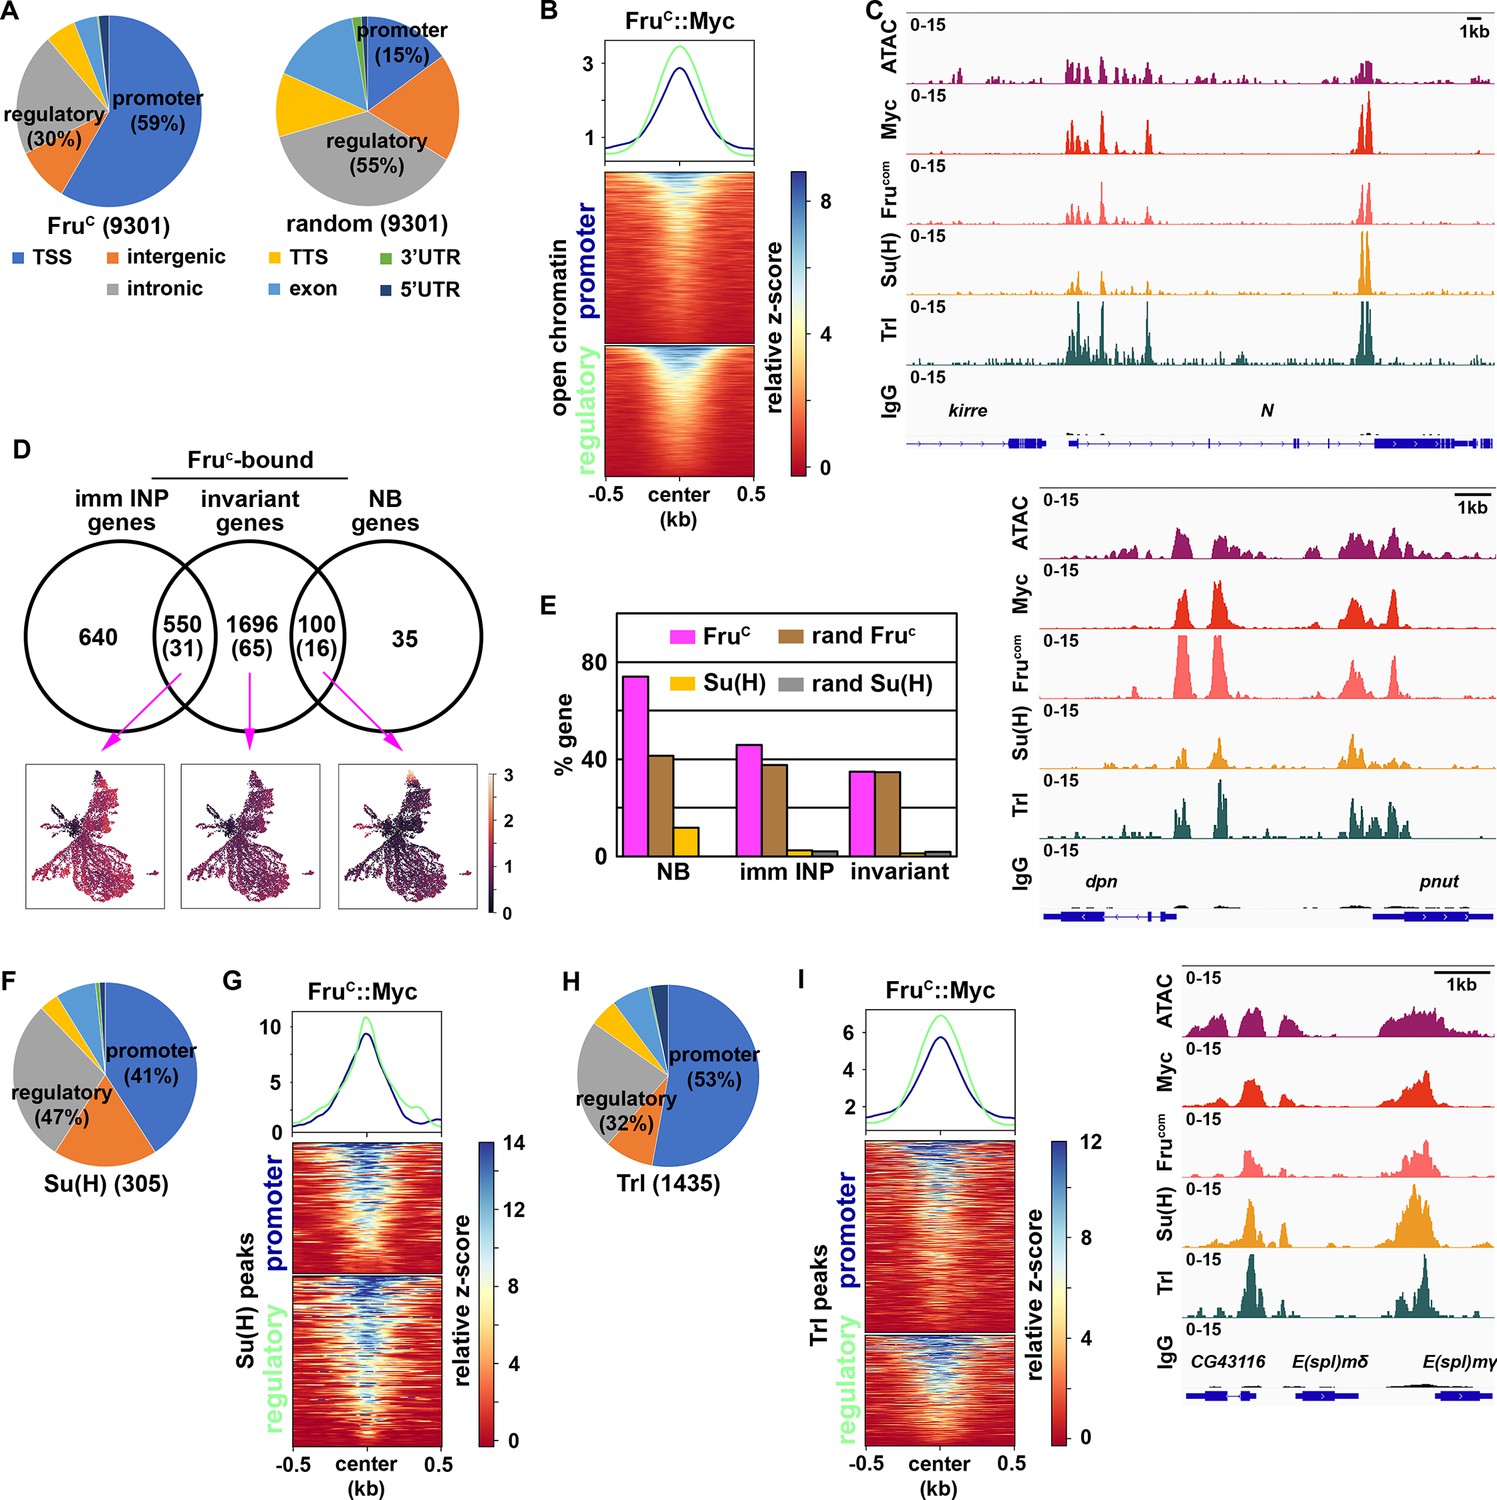
Fruc preferentially binds regulatory elements of genes uniquely expressed in neuroblasts.
(A) Genomic binding distribution of FruC-bound peaks (total # of peaks shown in parentheses) from CUT&RUN or random (set of Fruc peaks shuffled to randomly determined places in the genome) in type II neuroblast-enriched chromatin from brat-null brains (brat11/Df(2L)Exel8040). Fruc preferentially binds promoters. (B) Heatmap is centered on promoters or regulatory regions showing accessible chromatin as defined by ATAC-seq with 500 bp flanking regions and ordered by signal intensity of Fruc::Myc binding. (C) Representative z score-normalized genome browser tracks showing regions with accessible chromatin (ATAC-seq) and bound by Fruc::Myc (detected by the Myc antibody or FruCOM antibody), Su(H), Trl, or IgG at Notch, dpn, and E(spl)mγ loci. (D) Genes in cluster 14 from the scRNA-seq dataset were separated into neuroblast-enriched genes (right), immature INP-enriched genes (left), and invariant genes. The middle circle is the set of genes bound by Fruc or Su(H) (shown in parentheses). UMAPs show gene enrichment score for Fruc-bound genes uniquely expressed in neuroblasts (right), uniquely expressed in immature INPs (left), and ubiquitously expressed (invariant genes) (middle). (E) Percentage of genes defined in D bound by either Fruc, Su(H), random Fruc peaks, or random Su(H) peaks (set of Su(H) peaks shuffled to randomly determined places in the genome). (F–G) Genomic binding distribution of identified Su(H)-bound peaks (total # of peaks shown in parentheses) from CUT&RUN in type II neuroblast-enriched chromatin. Heatmap is centered on promoters or regulatory regions and ordered by signal intensity of Su(H) binding. (H–I) Genomic binding distribution of identified Trl-bound peaks (total # of peaks shown in parentheses) from CUT&RUN in type II neuroblast-enriched chromatin. Heatmap is centered on promoters or regulatory regions and ordered by signal intensity of Trl binding.
Figure 3—figure supplement 1
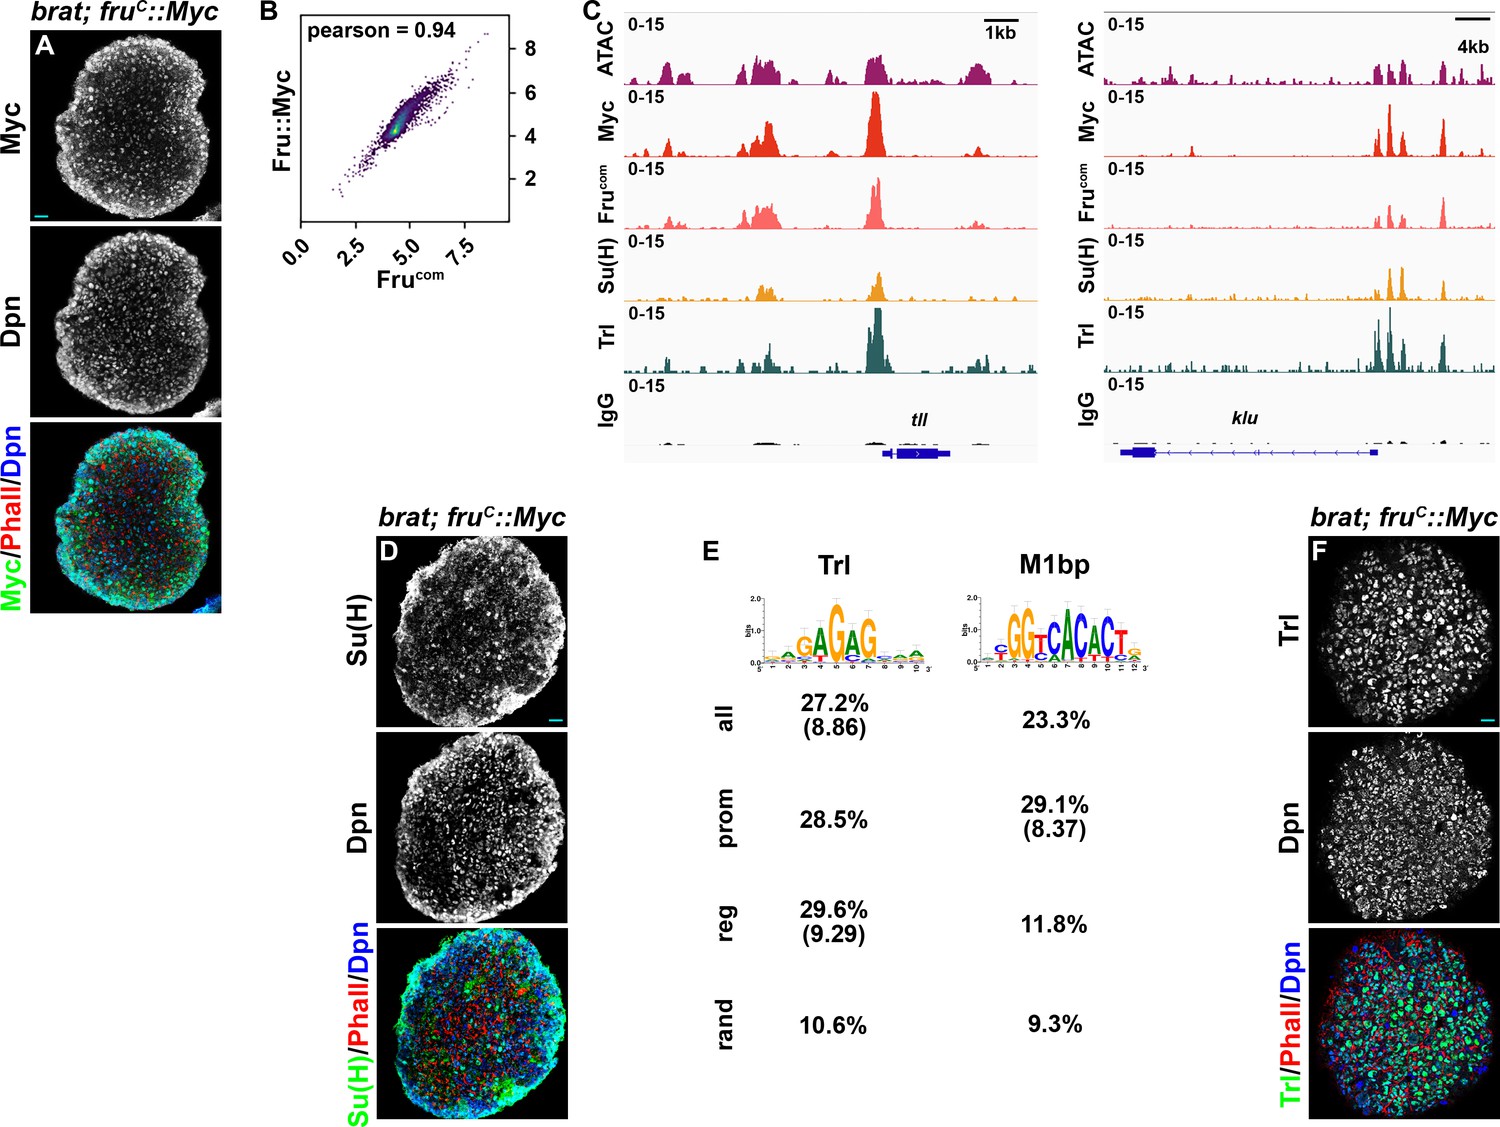
Quality control for determining FruC-, Su(H)- and Trl-binding using CUT&RUN.
(A) FruC::Myc is detected in all type II neuroblasts (marked by Dpn expression) in brat-null (brat11/Df(2L)Exel8040) brains homozygous for the fruC::Myc knock-in allele. (B) Genome-wide occupancy of FruC::Myc in 10 kb regions in type II neuroblasts determined by the Myc antibody and Frucom antibody are highly correlated. (C) Representative z score-normalized genome browser tracks showing chromatin accessibility (ATAC-seq) and regions bound by Fruc::Myc, FruCOM, Su(H), Trl, or IgG at tll and klu loci. (E) Top motifs identified by iCisTarget from 200 bp regions centered on fruc peak summits. Trl was identified as a top motif using all peaks or only regulator peaks, with NES scores shown in parentheses. M1BP was identified as a top motif using promoter peaks, with NES scores shown in parentheses. The percent of all, promoter, regulatory, or random peaks containing at least one motif was calculated by finding the corresponding motif distribution in the genome with HOMER. (D) Su(H) or (F) Trl is detected in all type II neuroblasts (marked by Dpn expression) in brat-null brains homozygous for the fruC::Myc knock-in allele. Scale bars: 10 μm.
Figure 4 with 1 supplement
Reduced fru function increases Notch pathway gene transcription.
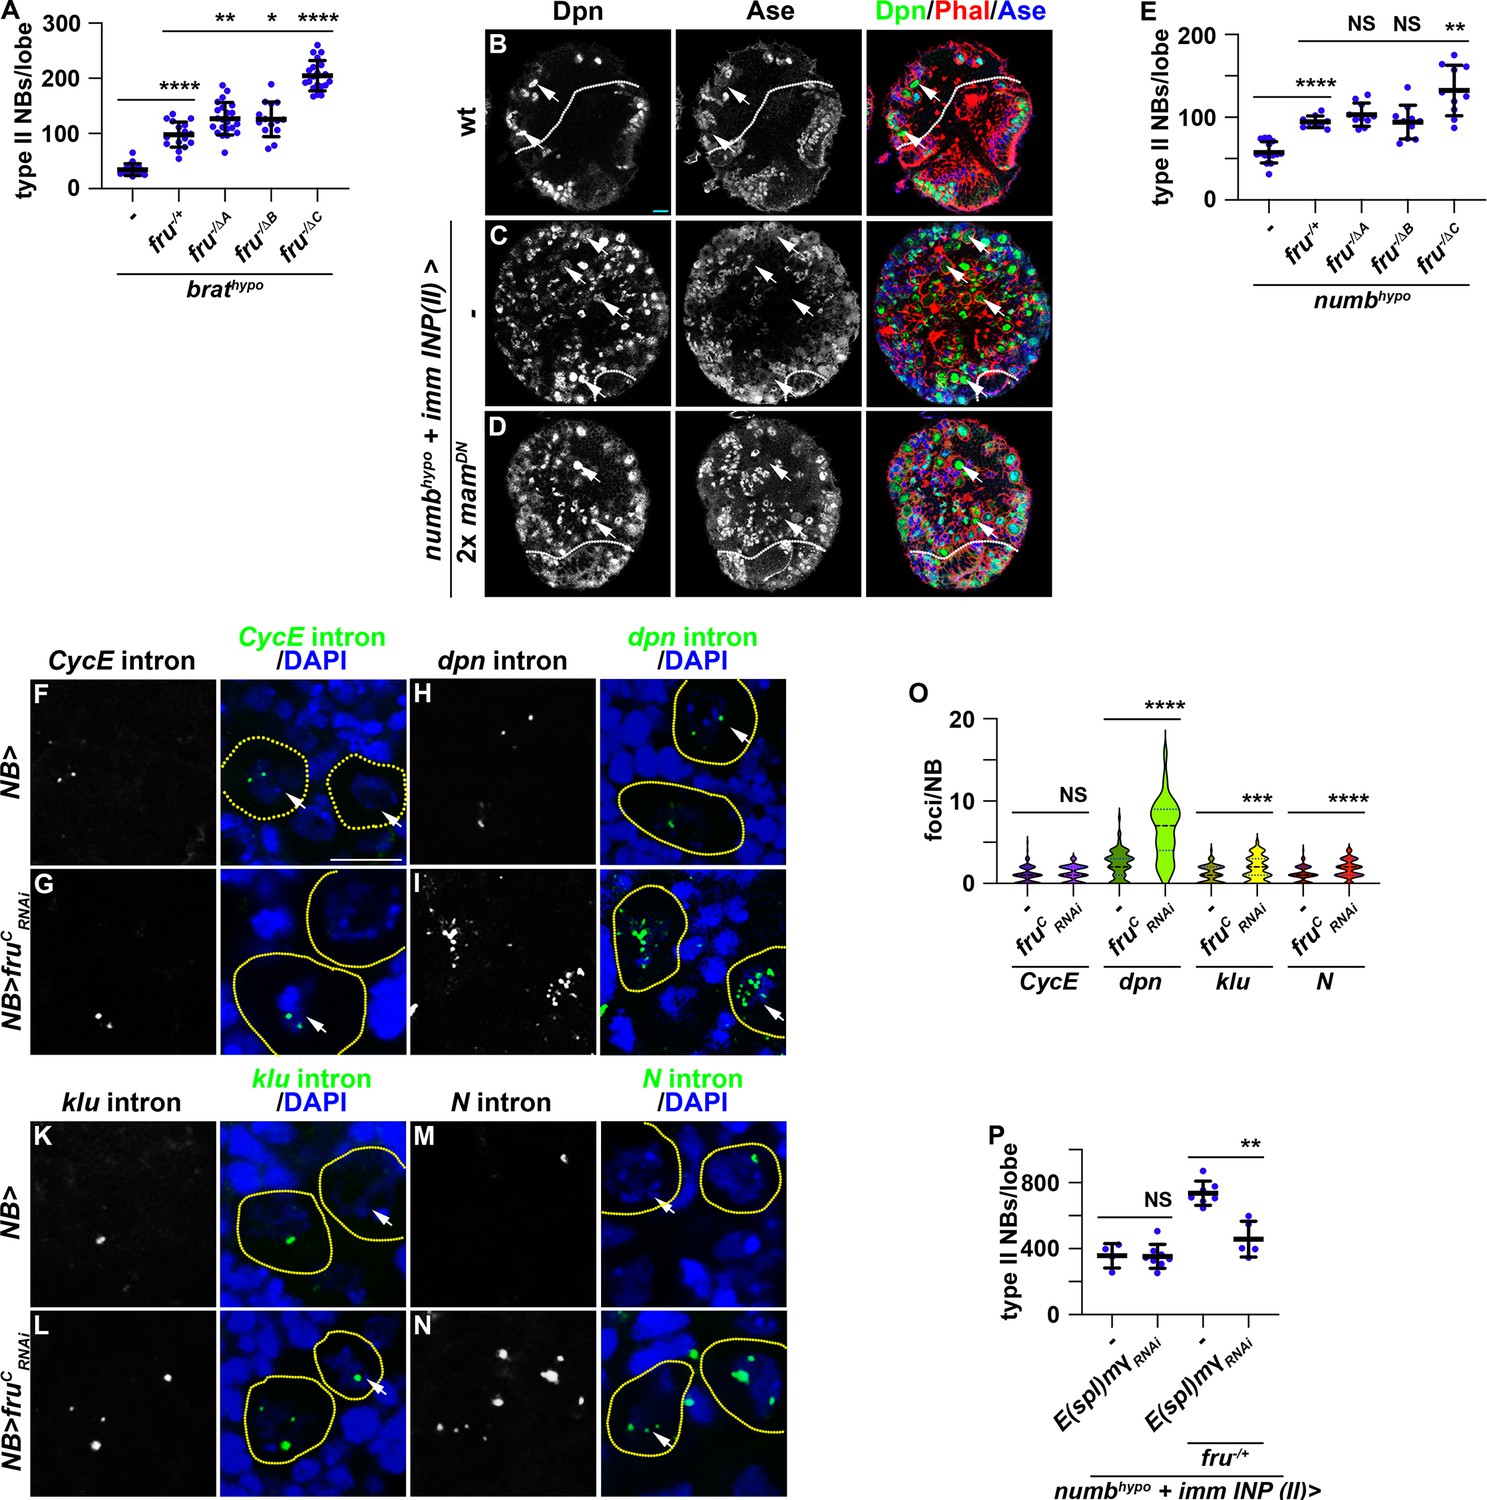
(A) Loss of fruC function (fruΔC/Aj96u3) enhances the supernumerary neuroblast phenotype in brathypo (bratDG19310/11) brains heterozygous for a fru deletion (fruAj96u3/+), but loss of fruA (fruΔA/Aj96u3) or fruB (fruΔB/Aj96u3) function does not. (B–D) Overexpressing two copies of dominant-negative mam transgenes in immature INPs partially suppresses the supernumerary neuroblast phenotype in numbhypo (numbex112/15) brains. The genotype used in this experiment is numbEx112/R9D11-Gal4,numb15 or numbEx112/R9D11-Gal4,numb15; UAS-mamDN/UAS-mamDN. (E) Loss of fruC function (fruΔC/Aj96u3) enhances the supernumerary neuroblast phenotype in numbhypo brains heterozygous for a fru deletion (fruAj96u3/+), but loss of fruA (fruΔA/Aj96u3) or fruB (fruΔB/Aj96u3) function does not. (F–N) sm-FISH using intron probes confirms increased Notch and Notch target gene (dpn and klu) transcription in fruC-mutant neuroblasts comparing with control neuroblasts. CycE nascent transcripts serve as a control because CycE is not a Notch target gene, and CycE transcription is unaffected by fruC knockdown. The genotype used in this experiments is Wor-Gal4 or Wor-Gal4/UAS-fruCRNAi (O) Quantification of Notch, dpn, klu and CycE nascent transcript foci in control versus fruC-mutant neuroblasts. sm-FISH signals were counted in 8 dorsal-most neuroblasts (>6 μm in diameter) per brain lobe. CycE: 1±0.97 (n=128 neuroblasts) in control; 1.16±0.91 (n=96 neuroblasts) in fruCRNAi. dpn: 2.33±1.65 (n=88 neuroblasts) in control; 6.52±3.55 (n=104 neuroblasts) in frucRNAi. klu: 1.12±1.01 (n=80 neuroblasts) in control; 1.79±1.43 (n=112 neuroblasts) in frucRNAi. Notch: 1.06±0.88 (n=112 neuroblasts) in control; 1.77±1.07 (n=104 neuroblasts) in frucRNAi. (P) Knocking down E(spl)mγ function by RNAi in immature INPs suppresses increased supernumerary formation in numbhypo brains heterozygous for fru while having no effect on numbhypo brains alone. The genotypes used in this experiment are numbEx112/R9D11-Gal4,numb15; UAS-E(spl)mγRNAi/+ or numbEx112/R9D11-Gal4,numb15; UAS-E(spl)mγRNAi/fruAj96u3/+. White dashed line separates brain from the optic lobe. Yellow dashed line encircles a neuroblast. white arrow: type II neuroblast. Scale bars: 10 μm. p-value: NS: non-significant, *<0.05, **<0.005, ***<0.0005, and ****<0.00005.
Figure 4—figure supplement 1
Loss of fruC function enhances supernumerary neuroblast formation in brathypo and numbhypo brains.
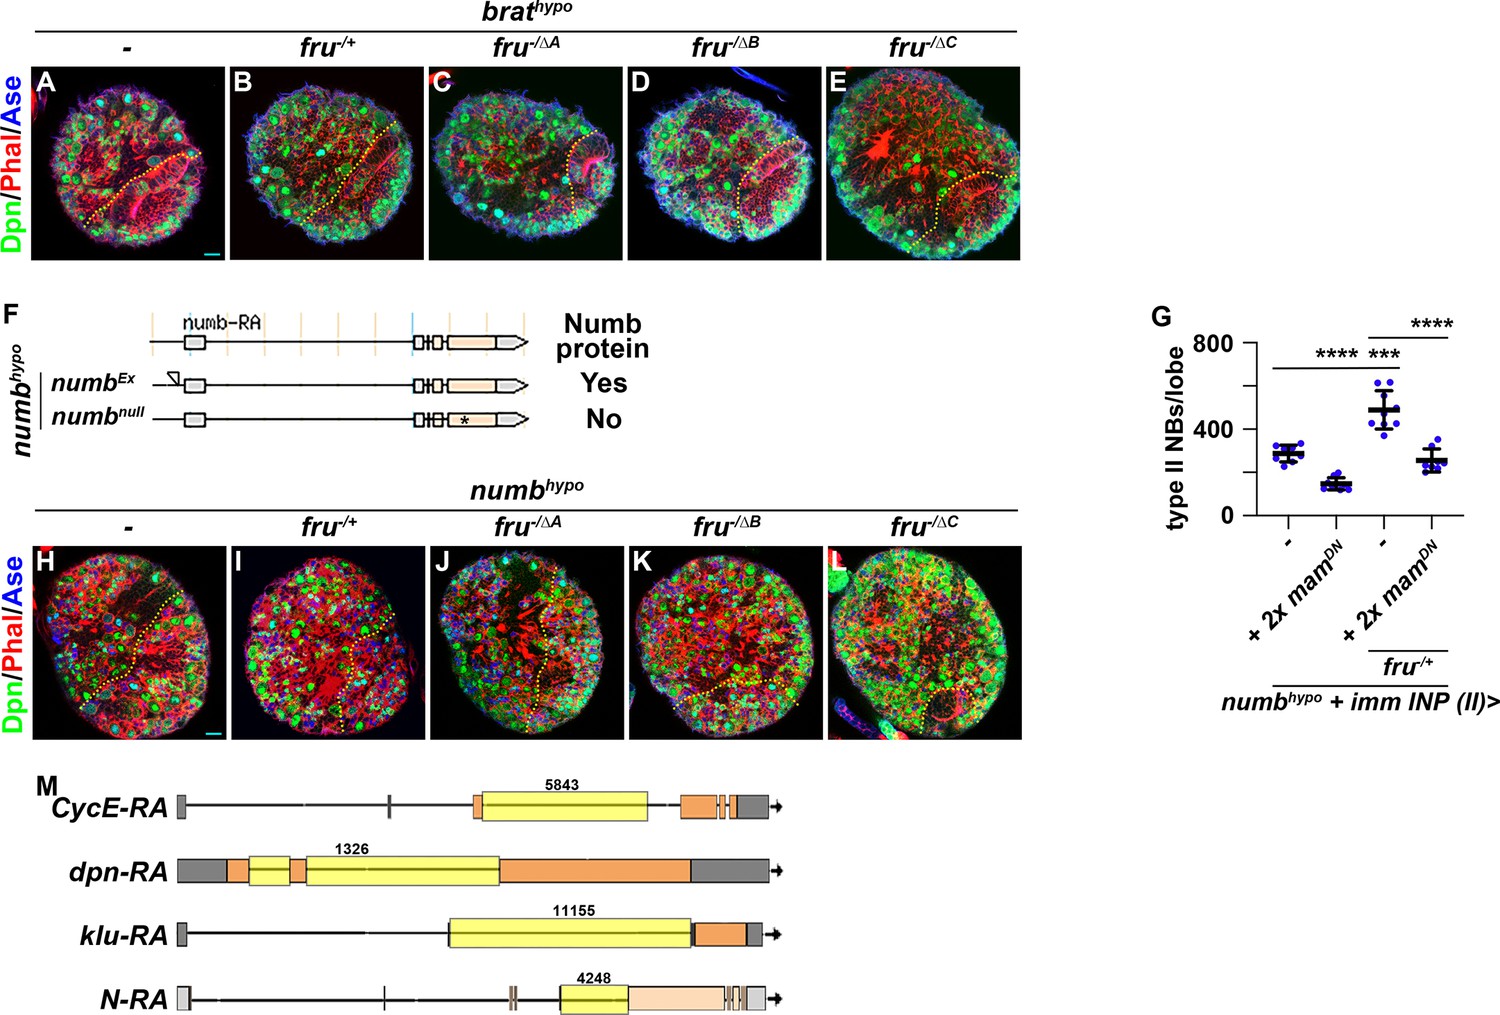
(A–E) Representative images of brathypo (brat bratDG19310/11) brains alone, heterozygous for a fru deletion (fruAj96u3/+) or homozygous mutant for a specific fru isoform (fruΔA/Aj96u3, fruΔB/Aj96u3 or fruΔC/Aj96u3). (F) The numbEx allele was generated by imprecisely excising the numbNP2301 transposable element inserted in the 5’-regulatory region of numb. Numb protein remains detectable in numbEx homozygous neuroblasts, but is undetectable in numb-null neuroblasts. (G) Quantification of total type II neuroblasts per brain lobe in numbhypo larvae alone or heterozygous for a fru deletion that overexpress two copies of UAS-mamDN transgenes in immature INPs. The genotype used in this experiment is numbEx112/R9D11-Gal4,numb15, numbEx112/R9D11-Gal4,numb15; UAS-mamDN/UAS-mamDN, numbEx112/R9D11-Gal4,numb15; fruAj96u3/+ or numbEx112/R9D11-Gal4,numb15; fruAj96u3/UAS-mamDN. (H–L) Representative images of numbhypo (numbex112/15) brains alone, heterozygous for a fru deletion (fruAj96u3/+) or homozygous mutant for a specific fru isoform (fruΔA/Aj96u3, fruΔB/Aj96u3 or fruΔC/Aj96u3). (M) The CycE, dpn, klu, and N isoform used for generating intron probes used in sm-FISH experiment shown in Figure 4F–O. The intron used for probe generation is highlighted. Yellow dashed line separates brain from the optic lobe. p-value: ***<0.0005, and ****<0.00005.
Figure 5 with 1 supplement
Low levels of H3K27me3 are enriched in FruC-bound regions.
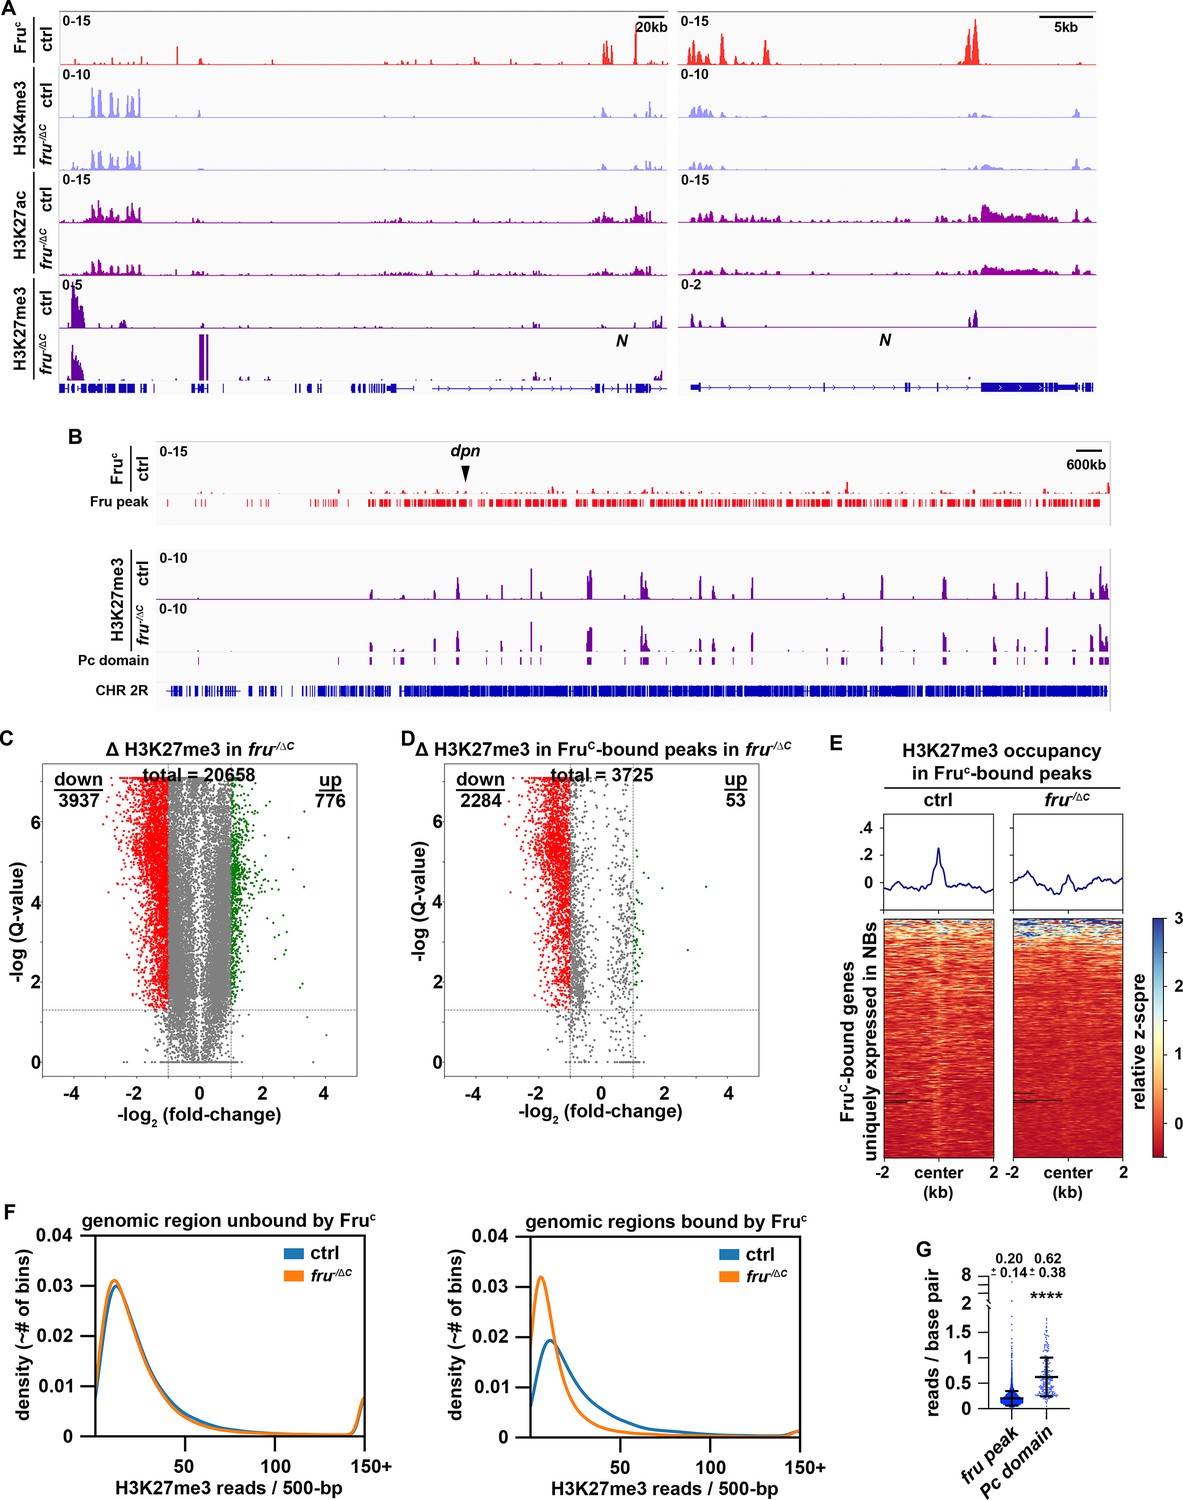
(A) Representative z score-normalized genome browser tracks showing FruC-binding and the enrichment of H3K4me3, H3K27ac, and H3K27me3 at the Notch locus in type II neuroblasts in control (brat11/Df(2L)Exel8040) or fruC-null (brat11/Df(2L)Exel8040; fruΔC/Aj96u3) brains. Left: Zoomed-out images showing nearest heterochromatin domains. Right: Zoomed-in images showing enrichment of histone marks in FruC-bound regions. (B) Representative z score-normalized genome browser track showing FruC-binding and the H3K27me3 throughout the chromosome arm 2 R in type II neuroblasts in control or fruC-null brains. Fru peaks are shown along with Pc domain regions called on data using similar strategy as previously used to call canonical Pc domains (Brown et al., 2018). (C) Volcano plot showing fold-change of H3K27me3 signal in overall genomic regions in fruC-null brains versus control brains. (D) Volcano plot showing fold-change of H3K27me3 signal in regions bound by Fruc in fruC-null brains versus control brains. (E) Heatmaps are centered on Fruc summits with 2 kb flanking regions in genes uniquely transcribed in type II neuroblasts in control or fruC-null brains and ordered by signal intensity of H3K27me3 enrichment calculated from TMM-normalized tracks. (F) Left: Density plots showing proportion of all 500 bp regions in the genome not bound by Fruc covered by different amounts of H3K27me3 reads in fruC-null brains vs control brains. Right: Density plots showing proportion of all 500 bp Fruc bound regions covered by different amounts of H3K27me3 reads in fruC-null brains vs control brains. (G) Dotplot representing coverage of each Fruc peak not in Pc domains vs coverage of each Pc domain. The horizontal line in the volcano plot represents -log10(0.05)=1.301. All genes above this line have a FDR <0.05.
Figure 5—figure supplement 1
Levels of active histone marks are unchanged FruC-bound regions.
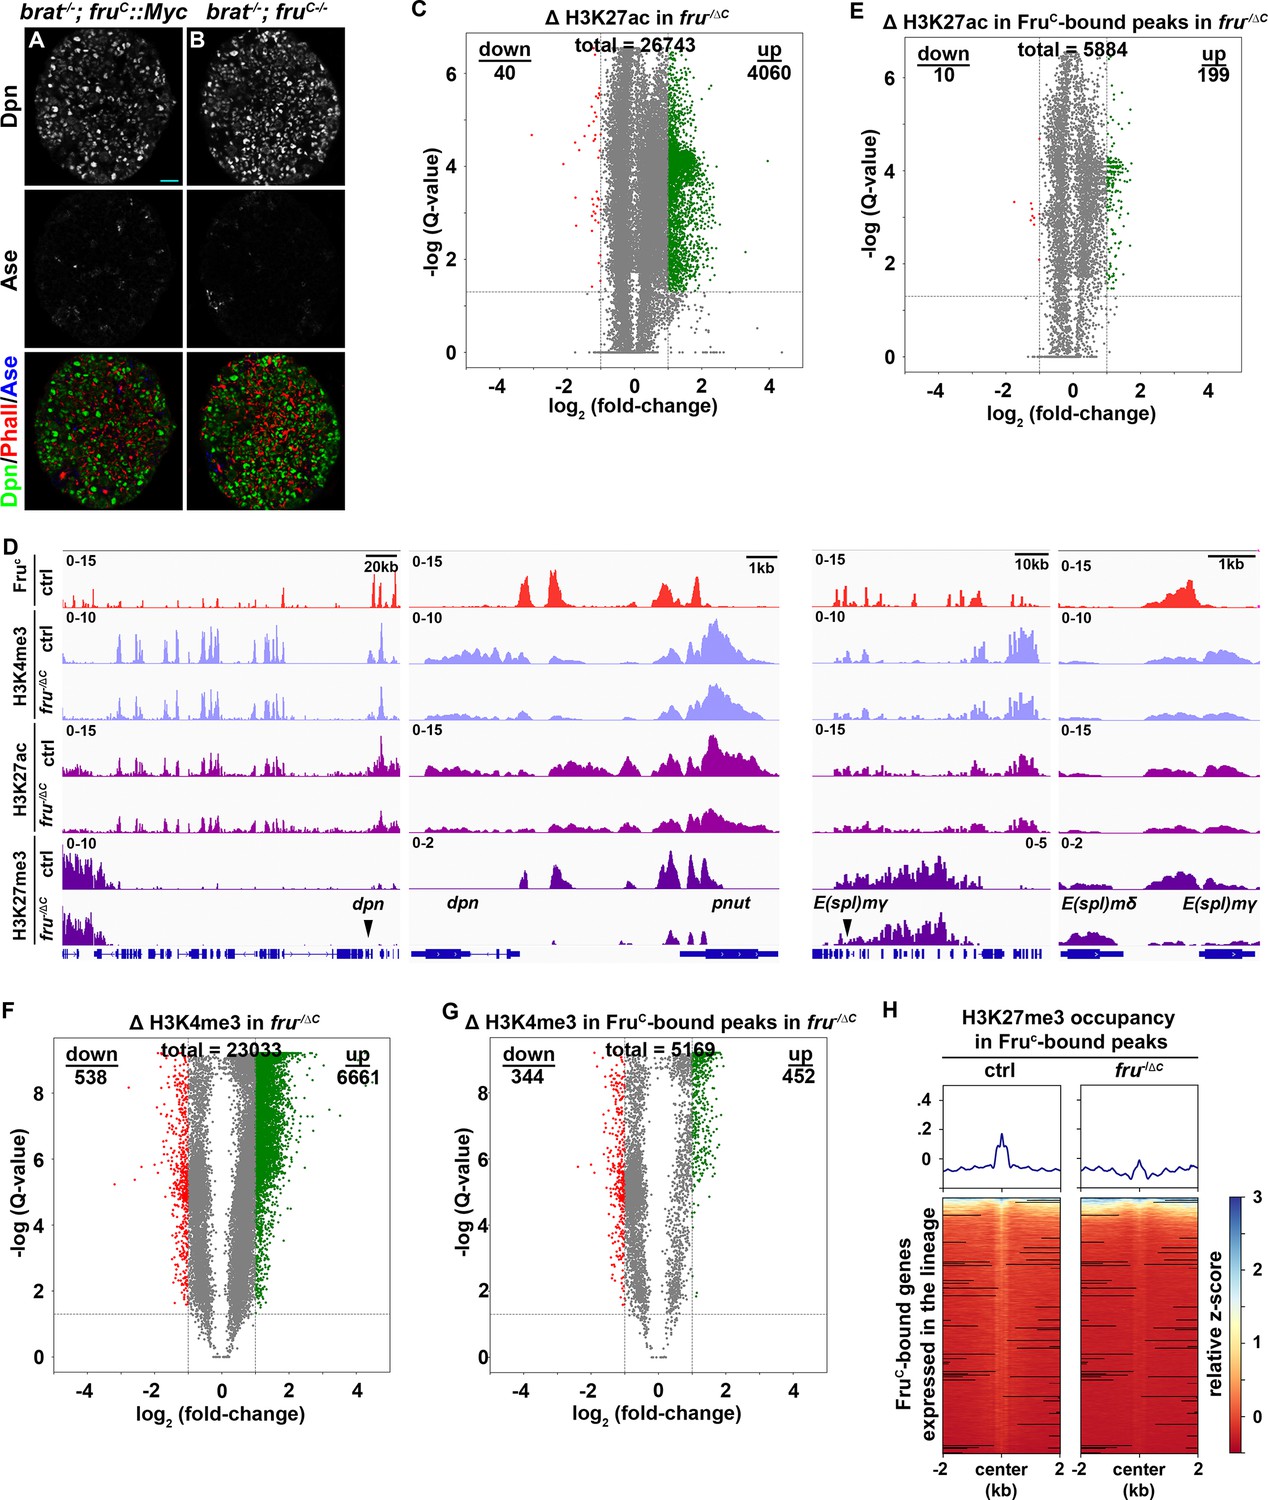
(A–B) Loss of fruC function does not further exacerbate the supernumerary neuroblast phenotype in brat-null brains. Scale bars: 10 μm. (C) Volcano plot showing fold-change of H3K27ac signal in overall genomic regions in fruC-null brains versus control brains. (D) Volcano plot showing fold-change of H3K27ac signal in regions bound by Fruc in fruC-null brains versus control brains. (E) Representative z score-normalized genome browser tracks showing FruC-binding and the enrichment of H3K4me3, H3K27ac, and H3K27me3 in dpn and E(spl)mγ loci in type II neuroblasts in control (brat11/Df(2L)Exel8040) or fruC-null (brat11/Df(2L)Ex040; fruΔC/Aj96u3) brains. Left: Zoomed-out images showing nearest heterochromatin domains. Right: Zoomed-in images showing enrichment of histone marks in FruC-bound regions. (F) Volcano plot showing fold-change of H3K4me3 signal in overall genomic regions in fruC-null brains versus control brains. (G) Volcano plot showing fold-change of H3K4me3 signal in regions bound by Fruc in fruC-null brains versus control brains. (H) Heatmaps are centered on Fruc summits with 2 kb flanking regions in genes transcribed throughout the type II neuroblast lineage in control or fruC-null brains and ordered by signal intensity of H3K27me3 enrichment calculated from TMM-normalized tracks. The horizontal line in the volcano plot represents -log10(0.05)=1.301. All genes above this line have a FDR <0.05.
Figure 6
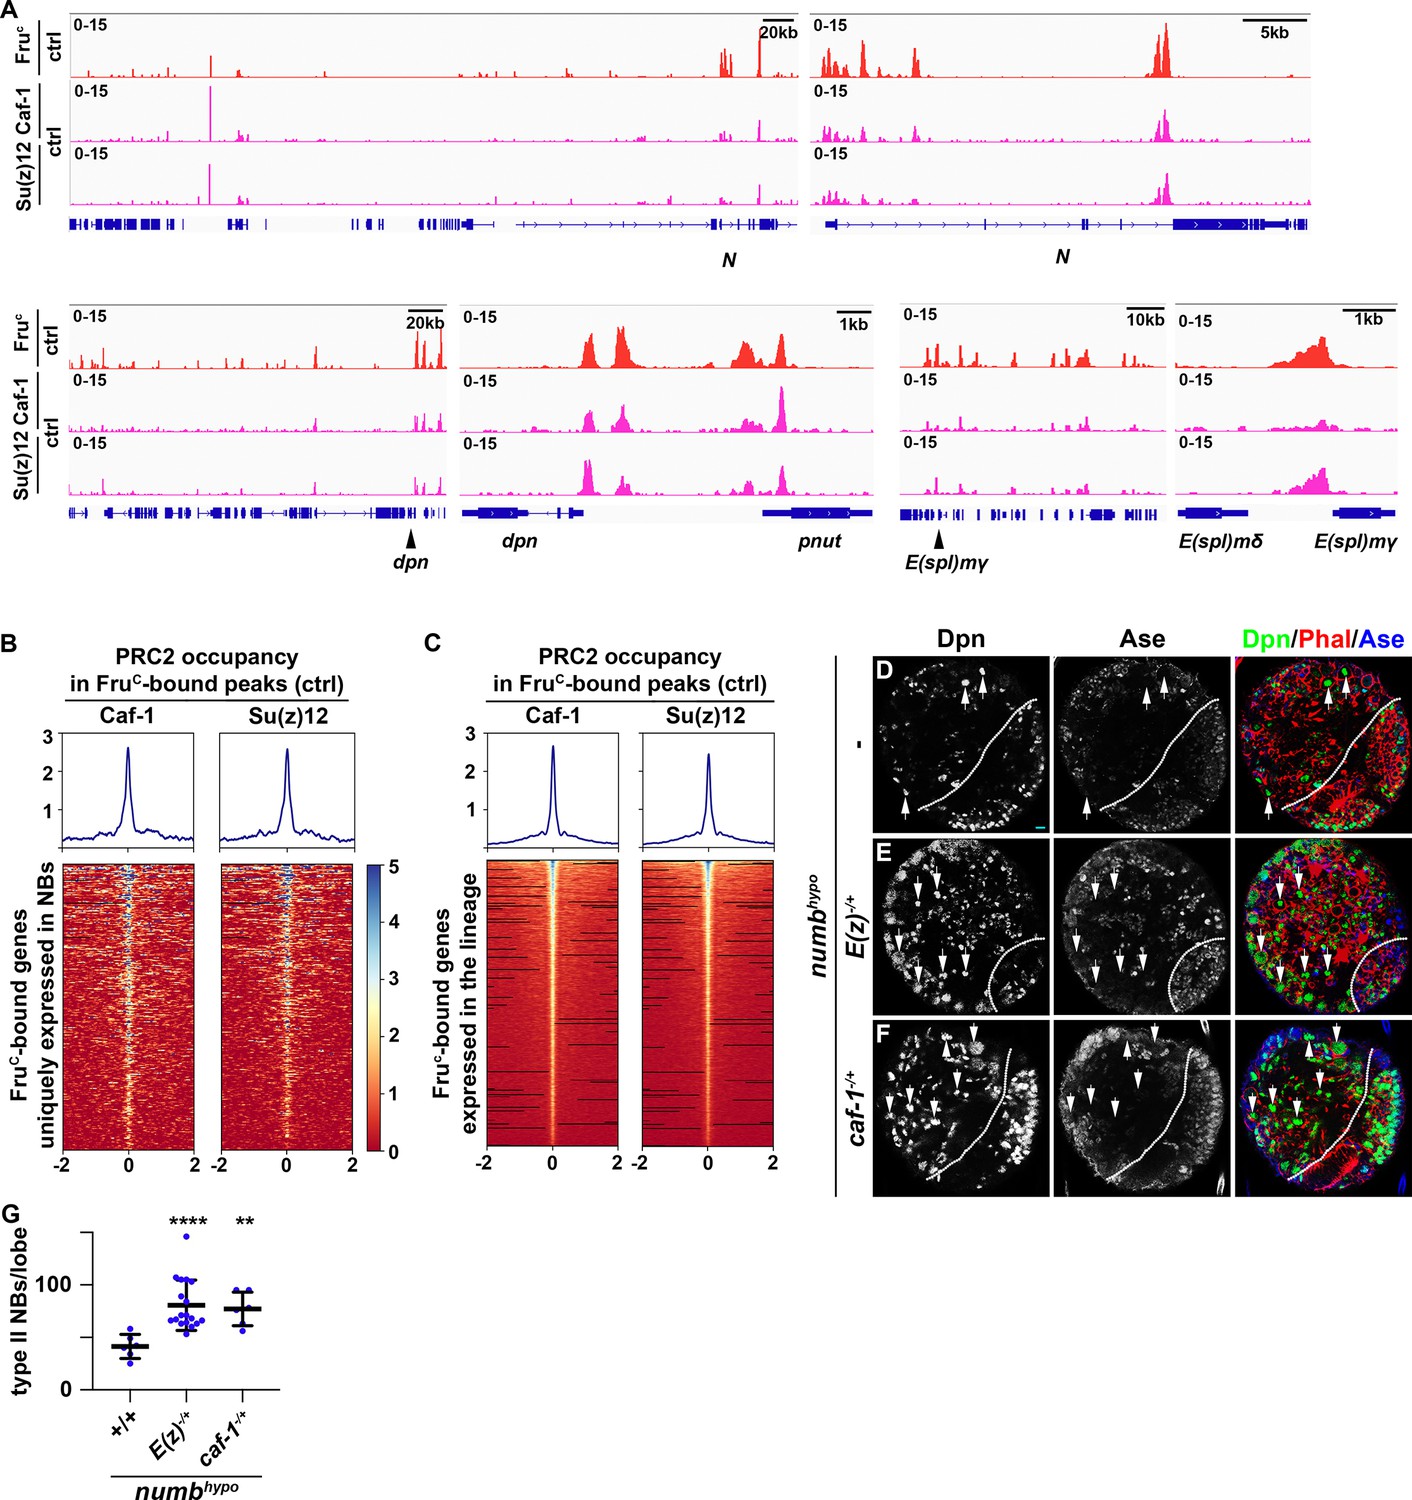
PRC2 subunits bind a high percentage of neuroblast-specific genes.
(A) Representative z score-normalized genome browser tracks showing regions bound by FruC, Su(z)12, and Caf-1 in type II neuroblasts in control (brat11/Df(2L)Exel8040) brains. Left: Zoomed-out images of the loci. Right: Zoomed-in images showing enrichment of PRC2 subunits in FruC-bound regions. (B–C) Heatmaps are centered on Fruc summits with 2 kb flanking regions in genes uniquely transcribed in type II neuroblasts in control brains and ordered by average signal intensity of Caf-1 and Su(z)12. Heatmap intensity is calculated from z score-normalized tracks. (D–F) The heterozygosity of E(z) (E(z)731/+) or Caf-1 (Caf-1short/+) enhances the supernumerary neuroblast phenotype in numbhypo (numbex112/15) brains. (G) Quantification of total type II neuroblasts per brain lobe in numbhypo (numbex112/15) brain alone or heterozygous for E(z) (E(z)731/+) or Caf-1 (Caf-1short/+).Scale bars: 10 μm.
Figure 7
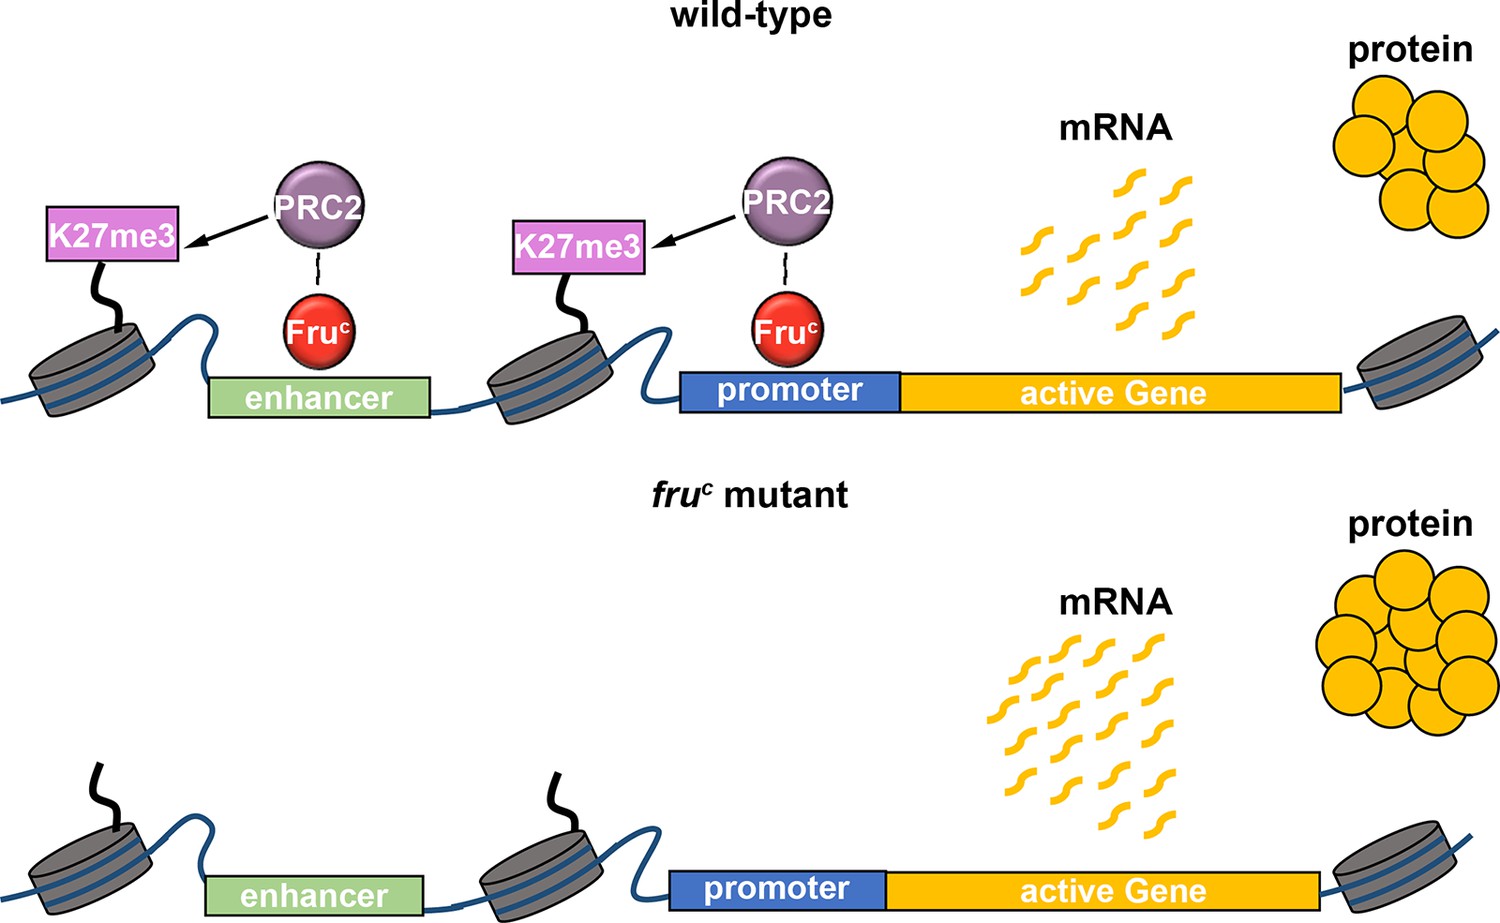
FruC likely functions together with PRC2 to dampen the expression of stemness genes by promoting low levels of H3K27me3 at their cis-regulatory elements.
Loss of fruC functions leads to reduced repressive histone marks and increased stemness gene expression in neuroblasts.
Tables
Key resources table
| Reagent type (species) or resource | Designation | Source or reference | Identifiers | Additional information |
|---|---|---|---|---|
| Genetic reagent (D. melanogaster) | P{GawB}numbNP2301 | Kyoto Drosophila Stock Center | 104153 | |
| Genetic reagent (D. melanogaster) | numbex115 | This study | see "Fly genetics and transgenes" in Material and Methods | |
| Genetic reagent (D. melanogaster) | fruA::Myc | von Philipsborn et al., 2014 | ||
| Genetic reagent (D. melanogaster) | fruB::Myc | von Philipsborn et al., 2014 | ||
| Genetic reagent (D. melanogaster) | fruC::Myc | von Philipsborn et al., 2014 | ||
| Genetic reagent (D. melanogaster) | brat11 | Arama et al., 2000 | stock #: 97265 | |
| Genetic reagent (D. melanogaster) | bratDG19310 | Xiao et al., 2012 | ||
| Genetic reagent (D. melanogaster) | Df(2 L)Exel8040 | Bloomington Drosophila Stock Center | stock #: 7847 | |
| Genetic reagent (D. melanogaster) | numb15 | Berdnik et al., 2002 | ||
| Genetic reagent (D. melanogaster) | frusat15 | Ito et al., 1996 | ||
| Genetic reagent (D. melanogaster) | fruAJ96u3 | Song et al., 2002 | ||
| Genetic reagent (D. melanogaster) | fruΔA | Neville et al., 2014 | ||
| Genetic reagent (D. melanogaster) | fruΔB | Neville et al., 2014 | ||
| Genetic reagent (D. melanogaster) | fruΔC | Billeter et al., 2006 | ||
| Genetic reagent (D. melanogaster) | E(z)731 | Anderson et al., 2011 | ||
| Genetic reagent (D. melanogaster) | Caf-1short | Anderson et al., 2011 | ||
| Genetic reagent (D. melanogaster) | UAS-fruC::Myc | This study | see "Fly genetics and transgenes" in Material and Methods | |
| Genetic reagent (D. melanogaster) | UAS-fruC::ERD::Myc | This study | see "Fly genetics and transgenes" in Material and Methods | |
| Genetic reagent (D. melanogaster) | UAS-dcr2; Wor-Gal4, Ase-Gal80; UAS-Stinger::RFP | Reichardt et al., 2018 | ||
| Genetic reagent (D. melanogaster) | P{GawB}elavC155, P{UAS-mCD8::GFP.L}Ptp4ELL4, P{hsFLP}1 | Bloomington Drosophila Stock Center | stock #: 5146 | |
| Genetic reagent (D. melanogaster) | P{GAL4-Act5C(FRT.CD2).P}S | Bloomington Drosophila Stock Center | stock #: 4780 | |
| Genetic reagent (D. melanogaster) | y[1] w[*]; P{ry[+t7.2]=neoFRT}82B P{w[+mC]=tubP-GAL80}LL3 | Bloomington Drosophila Stock Center | stock #: 5135 | |
| Genetic reagent (D. melanogaster) | w[1118]; P{y[+t7.7] w[+mC]=GMR9D11-GAL4}attP2 | Bloomington Drosophila Stock Center | stock #: 40731 | |
| Genetic reagent (D. melanogaster) | UAS-E(spl)mγRNAi | Bloomington Drosophila Stock Center | stock #: 25978 | |
| Antibody | anti-GFP (chicken polyclonal) | Aves Labs | Cat# GFP-1010 RRID:AB_2307313 | IF (1:2000) |
| Antibody | anti-Ase (rabbit polyclonal) | Weng et al., 2010 | IF (1:400) | |
| Antibody | anti-FruCOM (rabbit polyclonal) | Ito et al., 2012 | IF (1:500) CUT-&-RUN (1 μl) | |
| Antibody | anti-Trl (rabbit polyclonal) | Judd et al., 2021 | IF (1:500) CUT-&-RUN (1 μl) | |
| Antibody | anti-cMyc (mouse polyclonal) | Sigma | SKU: M4439 | IF (1:200) |
| Antibody | anti-Su(H) (mouse polyclonal) | Santa Cruz | SKU: 398453 | IF (1:100), |
| Antibody | anti-Pros (mouse monoclonal) | Lee et al., 2006a | IF (1:500) | |
| Antibody | anti-dpn (rat monoclonal, ascite) | Weng et al., 2010 | IF (1:1000) | |
| Antibody | anti-Mira (rat monoclonal) | Lee et al., 2006a | IF (1:100) | |
| Antibody | anti-cMyc (goat polyclonal) | Abcam | Cat#: ab9132 | CUT-&-RUN (1 μl) |
| Antibody | anti-Caf-1 (rabbit polyclonal) | Tyler et al., 1996 | CUT-&-RUN (1 μl) | |
| Antibody | anti-Su(z)12 (rabbit polyclonal) | Loubière et al., 2016 | CUT-&-RUN (1 μl) | |
| Antibody | anti-IgG (rabbit polyclonal) | EpiCypher | CUT-&-RUN (1 μl) | |
| Antibody | anti-H3K9me3 (rabbit polyclonal) | Abcam | Cat#: ab8898 | CUT-&-RUN (1 μl) |
| Antibody | anti-H3K4me3 (rabbit polyclonal) | Active Motif | Cat#: 39159 | CUT-&-RUN (1 μl) |
| Antibody | anti-H3K27me3 (rabbit polyclonal) | Sigma Aldrich | Cat#: 07–449 | CUT-&-RUN (1 μl) |
| Antibody | anti-H3K27ac (rabbit polyclonal) | Active Motif | Cat#: 39136 | CUT-&-RUN (1 μl) |
| Chemical compound | Rhodamine Phalloidin | Invitrogen | Cat#: R415 | IF (1:100) |
| Chemical compound | Alexa Fluor Plus 405 Phalloidin | Invitrogen | Cat#: A30104 | |
| Chemical compound | DRAQ5 | Abcam | Cat#: ab108410 | |
| Chemical compound | Papain | Millipore Sigma | Cat#: P4762-25MG | |
| Chemical compound | Collagenase type I | Millipore Sigma | Cat#: SCR103 | |
| Chemical compound | E-64 | Millipore Sigma | Cat#: E3132-1MG | |
| Chemical compound | Fetal Bovine Serum | Millipore Sigma | Cat#: F0926-50ML | |
| Chemical compound | Schneider’s Media | Millipore Sigma | Cat#: S0146-500ML | |
| Chemical compound | ProLong Gold Antifade Mountant | Invitrogen | Cat#: P36930 | |
| Chemical compound | ProLong Gold Antifade Mountant with DNA Stain DAPI | Invitrogen | Cat#: P36935 | |
| Chemical compound | Agencourt AMPure XP - 5 mL | Beckman Coulter | Cat#: A63880 | |
| Chemical compound | Sodium butyrate | Sigma Aldrich | Cat#: B5887 | |
| Commercial assay or kit | 10x chromium v3 single-cell gene expression kit | 10x Genomics | Cat# 1000154 | |
| Commercial assay or kit | B1-labeled HCR RNA-FISH intron probe (Notch) | Molecular Instruments, Inc | dm6, chrX: 3159233–3163479 | |
| Commercial assay or kit | B1-labeled HCR RNA-FISH intron probe (dpn) | Molecular Instruments, Inc | dm6, chr2R: 8230502–8231599 & 8231694–8231923 | |
| Commercial assay or kit | B1-labeled HCR RNA-FISH intron probe (klu) | Molecular Instruments, Inc | dm6, chr3L: 10985072–10996227 | |
| Commercial assay or kit | B1-labeled HCR RNA-FISH intron probe (CycE) | Molecular Instruments, Inc | dm6, chr2L: 15731785–15737628 | |
| Commercial assay or kit | HCR RNA-FISH amplifiers | Molecular Instruments, Inc | ||
| Commercial assay or kit | CUTANA ChIC/CUT&RUN Kit | Epicypher | SKU: 14–1048 | |
| Commercial assay or kit | NEBNext Ultra II DNA Library Prep Kit for Illumina | New England Biolabs | Cat#: E7645L | |
| Commercial assay or kit | NEBNext Multiplex Oligos for Illumina (96 Unique Dual Index Primer Pairs) | New England Biolabs | Cat#: E6440L | |
| Software, algorithm | Script Files | This Study | GITHUB | |
| Software, algorithm | Cell Ranger (6.0.1) | 10x Genomics | RRID:SCR_017344 | |
| Software, algorithm | Fiji/ImageJ | Schindelin et al., 2012 | RRID:SCR_002285 https://fiji.sc/ | |
| Software, algorithm | scanpy scRNA-seq analysis software | Wolf et al., 2018 | RRID:SCR_018139 | |
| Software, algorithm | Harmony | Korsunsky et al., 2019 | ||
| Software, algorithm | Bioinfokit | Renesh Bedre, 2020, March 5 | ||
| Software, algorithm | Matplotlib | https://zenodo.org/badge/ https://doi.org/10.5281/zenodo.592536.svg | RRID:SCR_008624 | |
| Software, algorithm | Seaborn | https://doi.org/10.21105/joss.03021 | RRID:SCR_018132 | |
| Software, algorithm | FastQC | Wingett and Andrews, 2018 | RRID:SCR_014583 | |
| Software, algorithm | cutadapt | Martin, 2011 | RRID: SCR_011841 | |
| Software, algorithm | Samtools | Li et al., 2009 | RRID: SCR_002105 | |
| Software, algorithm | MACS2 | Zhang et al., 2008 | RRID: SCR_013291 | |
| Software, algorithm | CUT-RUNTools-2.0 | Yu et al., 2021 | ||
| Software, algorithm | bedtools | Quinlan and Hall, 2010 | RRID: SCR_008848 | |
| Software, algorithm | HOMER | Heinz et al., 2010 | RRID: SCR_010881 | |
| Software, algorithm | deeptools | Ramírez et al., 2016 | RRID: SCR_016366 | |
| Software, algorithm | Integrative Genomics Viewer | Robinson et al., 2011 | RRID: SCR_011793 | |
| Software, algorithm | GoPeaks | Yashar et al., 2022 | ||
| Software, algorithm | SICER | Zang et al., 2009 | RRID:SCR_010843 | |
| Software, algorithm | featureCounts | Liao et al., 2014 | RRID: SCR_012919 | |
| Software, algorithm | EdgeR | Robinson et al., 2010 | RRID: SCR_012802 | |
| Software, algorithm | diffReps | Shen et al., 2013 | RRID:SCR_010873 | |
| Software, algorithm | iCisTarget | Imrichová et al., 2015 | ||
| Software, algorithm | XSTREME | Grant and Bailey, 2021 | RRID:SCR_001783 | |
| Software, algorithm | LAS AF | Leica Microsystems | RRID:SCR_013673 |
Additional files
-
Supplementary file 1
Raw data and statistics for all quantified data.
- https://cdn.elifesciences.org/articles/86127/elife-86127-supp1-v2.xlsx
-
Supplementary file 2
Differential gene expression values for Neuroblasts vs immature INPs from scRNA-seq.
- https://cdn.elifesciences.org/articles/86127/elife-86127-supp2-v2.xlsx
-
MDAR checklist
- https://cdn.elifesciences.org/articles/86127/elife-86127-mdarchecklist1-v2.docx
Download links
A two-part list of links to download the article, or parts of the article, in various formats.
Downloads (link to download the article as PDF)
Open citations (links to open the citations from this article in various online reference manager services)
Cite this article (links to download the citations from this article in formats compatible with various reference manager tools)
Low-level repressive histone marks fine-tune gene transcription in neural stem cells
eLife 12:e86127.
https://doi.org/10.7554/eLife.86127


