Gradients of glucose metabolism regulate morphogen signalling required for specifying tonotopic organisation in the chicken cochlea
- Centre for Craniofacial and Regenerative Biology, Faculty of Dentistry Oral and Craniofacial Sciences, King's College London, United Kingdom
- Research Department of Structural and Molecular Biology, University College London, United Kingdom
- National Institute on Deafness and Other Communication Disorders, National Institutes of Health, United States
Figures
Figure 1
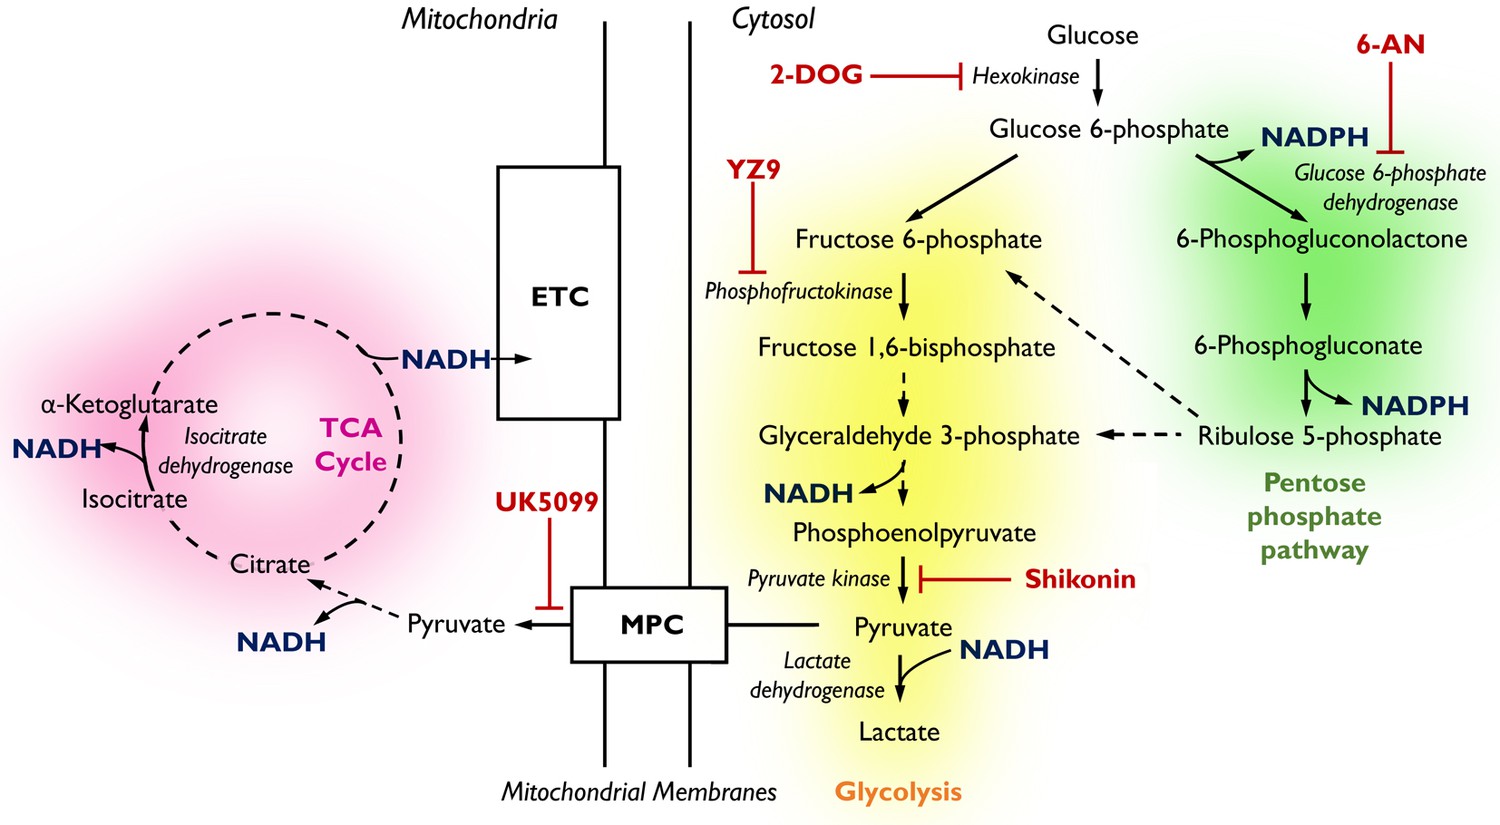
Pathways of glucose catabolism regulating cellular NADPH/NADH.
(pink mitochondrial OXPHOS) – Glucose metabolism in mitochondria. Following its conversion from glucose during glycolysis, pyruvate is transported into the mitochondria via the mitochondrial pyruvate carrier (MPC) and enters the tricarboxylic acid (TCA) cycle. Its sequential oxidation provides reducing equivalents in the form of NADH to the electron transport chain (ETC), driving ATP production by oxidative phosphorylation (OXPHOS). (yellow glycolysis) – Cytosolic glucose flux via the main branch of glycolysis. In this process, one molecule of glucose is anaerobically converted into two molecules of pyruvate to yield two molecules of ATP. Lactate dehydrogenase (LDH) acts to maintain the pool of NAD+ necessary for glycolysis to take place by oxidising NADH upon the reduction of pyruvate to lactate. (green pentose phosphate pathway) – Cytosolic glucose flux into the oxidative branch of the pentose phosphate pathway (PPP). Running parallel to glycolysis, the PPP branches off at glucose 6-phosphate (G6P) generating NADPH and ribose 5-phosphate (R5P). PPP shuttles carbons back into the main glycolytic pathway at glyceraldehyde 3-phosphate and fructose 1,6-bisphosphate. Different pathways of glucose flux can be targeted for pharmacological intervention. Inhibitors for various metabolic branch points are indicated in red (UK5099, YZ9, 2-DOG, 6-AN, Shikonin).
Figure 2
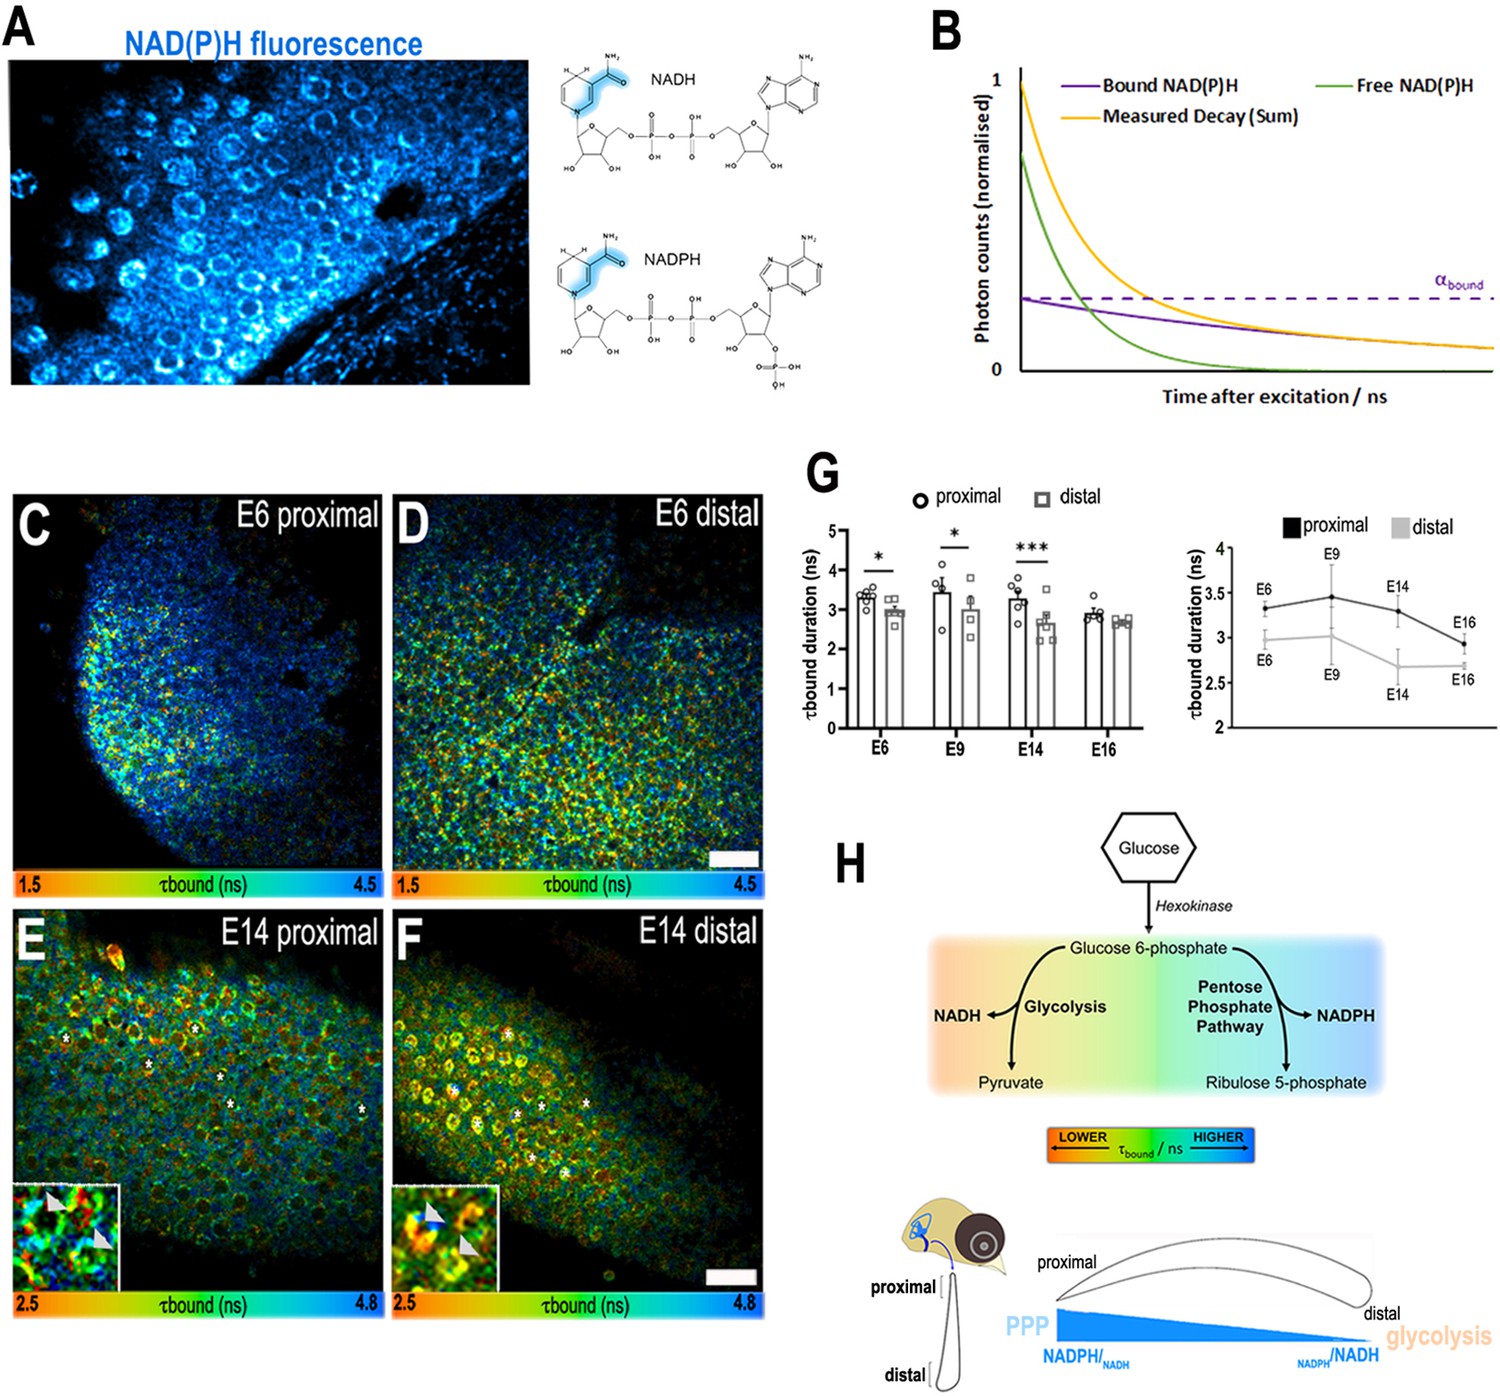
A proximal-to-distal metabolic gradient in the developing chick cochlea.
(A) Two-photon fluorescence image showing NAD(P)H in a live basilar papilla (BP) explant at E14 and the origin of inherent fluorescence at the nicotinamide ring. (B) NAD(P)H fluorescence lifetime imaging microscopy (FLIM) resolves two components corresponding to freely diffusing (shorter lifetime, τfree) and enzyme bound (longer lifetime, τbound). Changes in τbound imply changes in the specific enzymes to which NAD(P)H is binding and, therefore, the metabolic state of the cell. The proportion of the total NAD(P)H population that is bound to enzymes, labelled αbound, determines the relative contribution of the two species immediately after excitation. (C–F) FLIM images of the bound NAD(P)H fluorescence lifetime signal τbound in the proximal and distal BP regions at E6 and E14. White asterisks indicate the hair cells (HCs). Higher magnification images highlight the differences in τbound between proximal and distal HCs at E14 (arrowheads). (G) Quantification of τbound during development shows a shift from NADPH to NADH producing pathways. Line graphs highlight differences in τbound between proximal (black) and distal (grey) BP regions throughout development. Scale bars = 50 μm. Data are mean ± standard error of the mean (SEM); E6: n = 6, E9: n = 4, E14: n = 6, and E16: n = 5 biological replicates. *p < 0.05, ***p < 0.001 two-way analysis of variance (ANOVA). (H) Schematic of the chick BP, indicating the proximal and distal regions. Proposed gradient in cellular NADPH/NADH and thus glucose flux along the developing BP. Bottom schematic depicts interpretation of the τbound lifetime signal reported by NAD(P)H FLIM along the proximal-to-distal axis. The gradient in τbound duration reflects differences in fate of glucose catabolism. Short lifetimes (orange) indicate NADH production and therefore glucose flux through the main glycolytic pathway. Longer lifetimes (blue) indicate NADPH production and glucose catabolism in the pentose phosphate pathway (PPP). Differences in the τbound lifetime duration thereby confer differences in the catabolic fate of glucose.
Figure 3 with 5 supplements
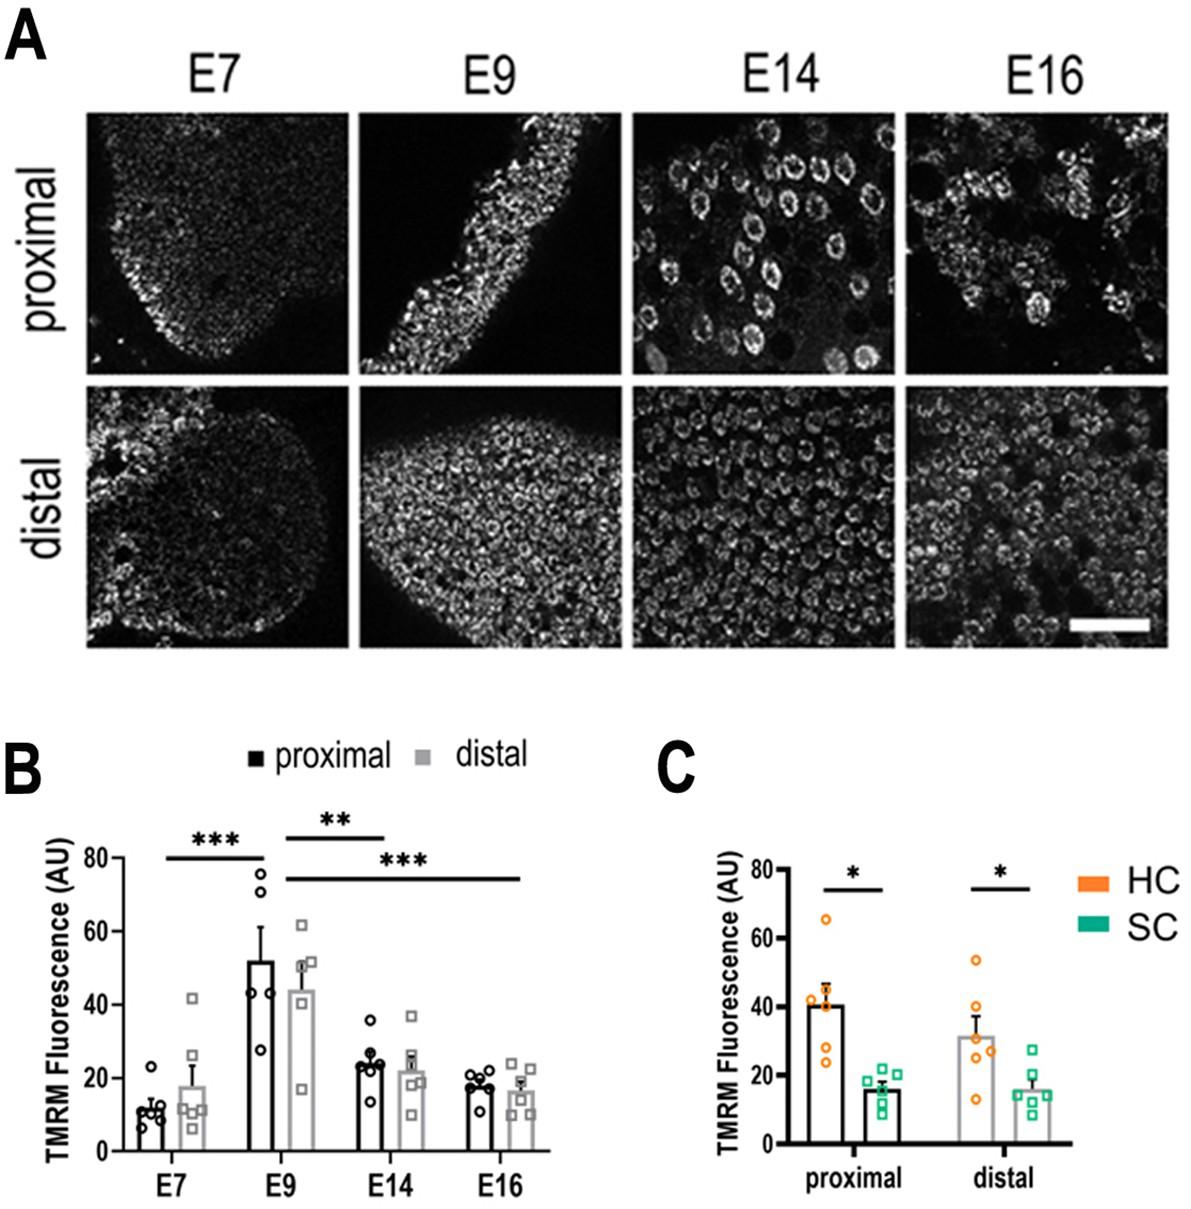
Live imaging of mitochondrial metabolism in hair cells (HCs) and supporting cells (SCs) at different positions along the tonotopic axis.
(A) Mitochondrial membrane potential measured using tetramethyl-rhodamine-methyl-ester (TMRM) in single z-planes from image stacks in the proximal and distal regions of live basilar papilla (BP) explants. (B) TMRM fluorescence indicates a significant increase in mitochondrial activity between E7 and E9, followed by significant decrease between E9 and E14. (C) Differences in mitochondrial activity (TMRM fluorescence) between HCs and SCs along the tonotopic axis at E14. Data are mean ± standard error of the mean (SEM). **p > 0.01, ***p < 0.001 for proximal and distal regions two-way analysis of variance (ANOVA). E7: n = 6, E9: n = 5, E14: n = 6, E16: n = 6 biological replicates. HCs versus SCs n = 6 biological replicates *p > 0.05 two-way ANOVA. Scale bar = 40 μm.
Figure 3—figure supplement 1
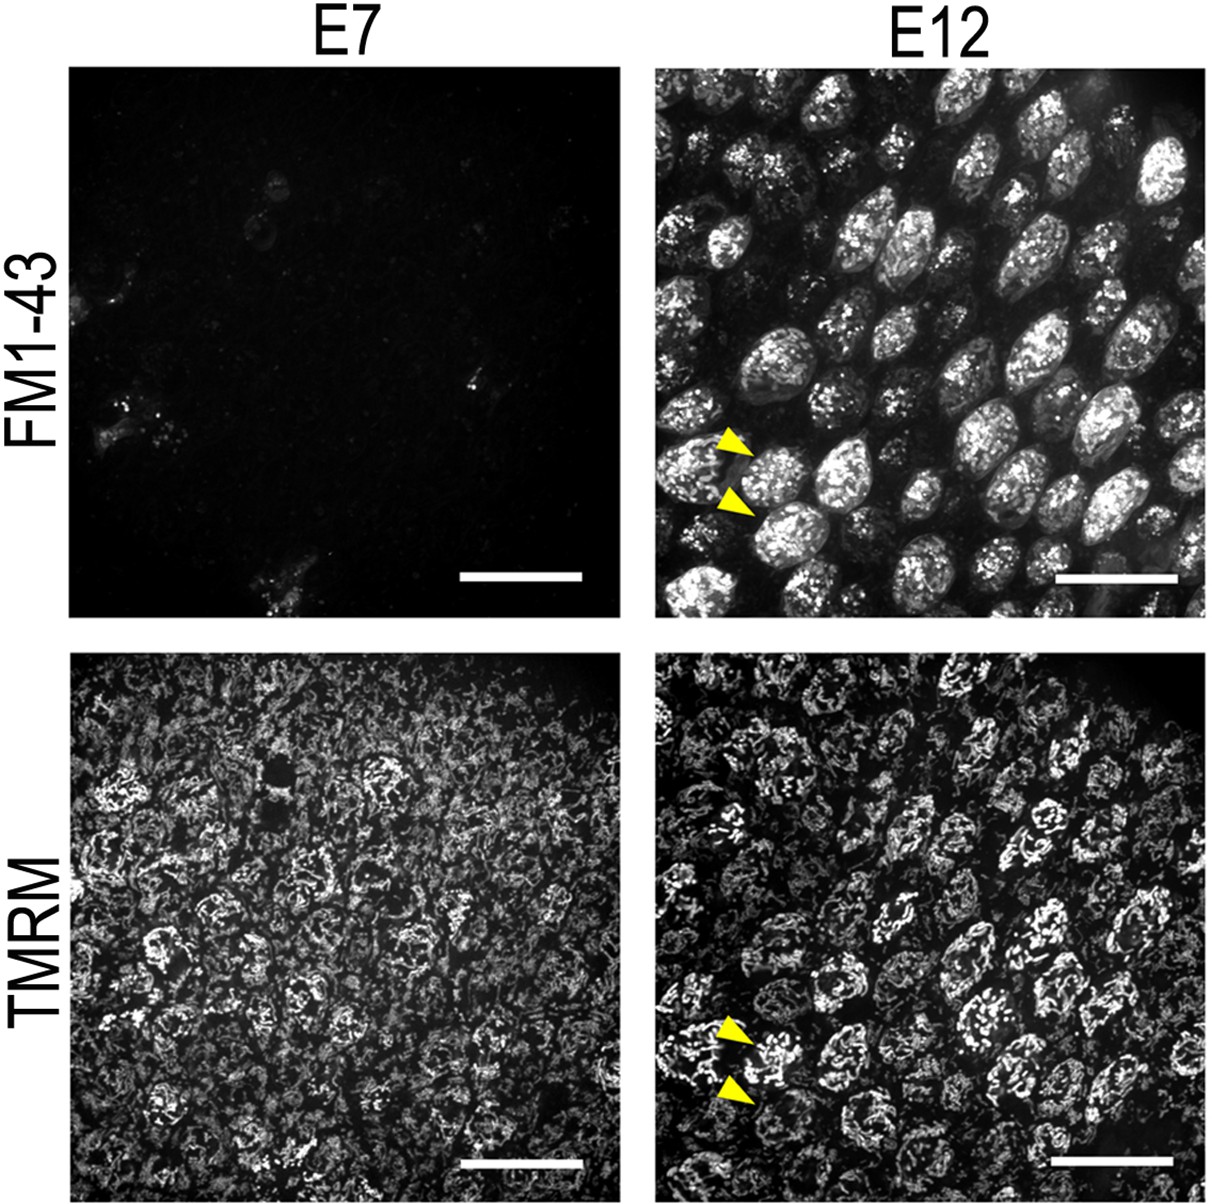
Tetramethyl-rhodamine-methyl-ester (TMRM) fluorescence intensity is not dependent on uptake via the hair cell (HC) transduction channel.
Live basilar papilla (BP) explants at E7 and E12 dual loaded with the permeant MET channel blocker FM1-43 (top) and the mitochondrial membrane potential dye TMRM (bottom). FM1-43 provides a measure of HC transduction channel activity. Yellow arrows show that the differences in TMRM fluorescence do not arise from variation in HC transduction channel activity. Scale bars are 20 μm.
Figure 3—figure supplement 2
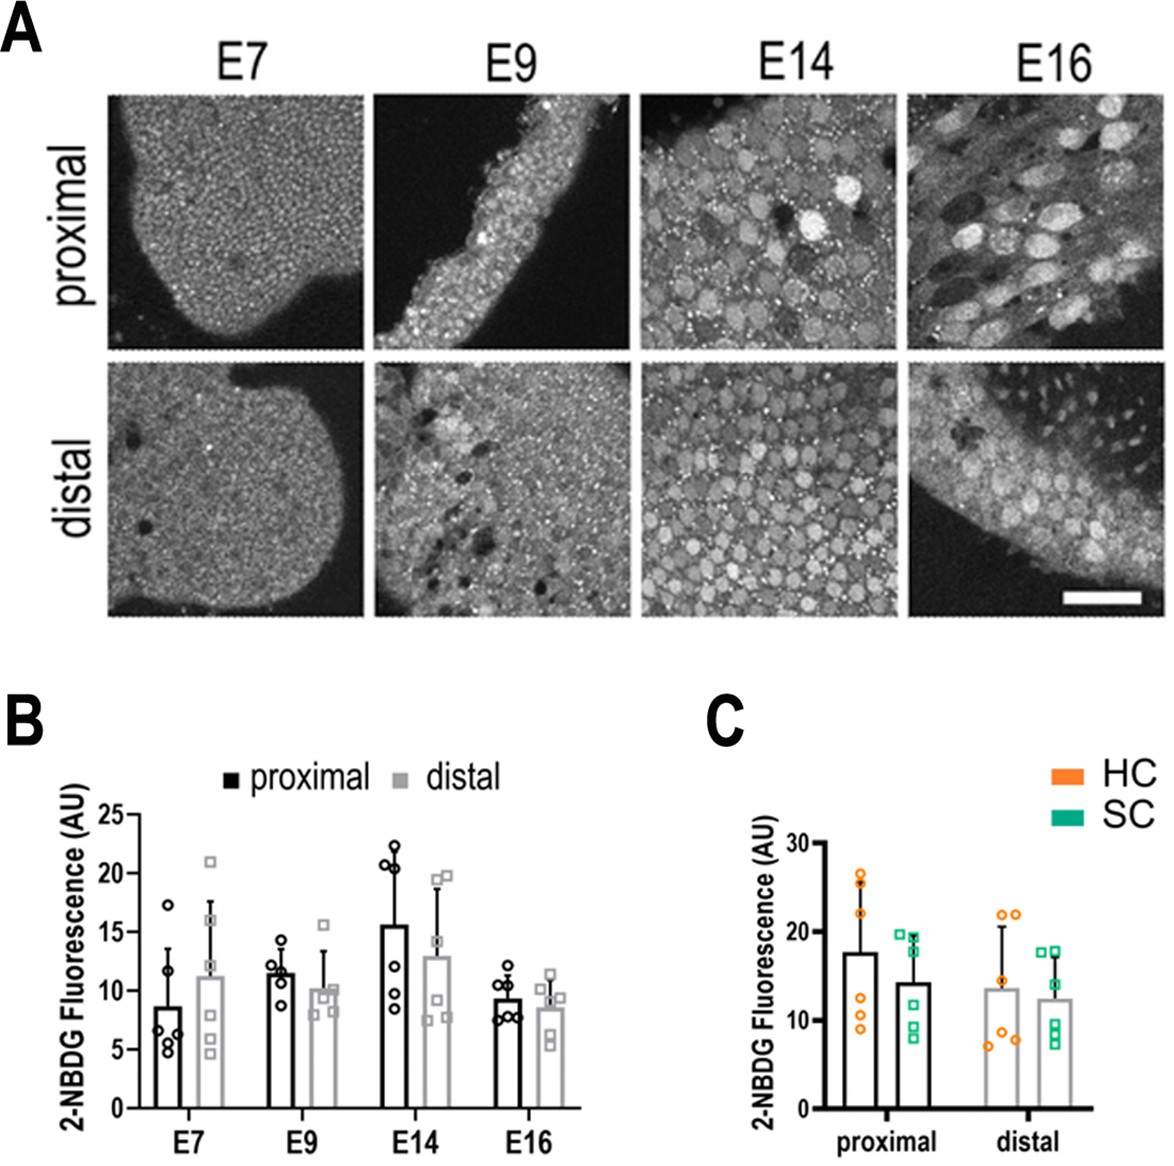
Live imaging of glucose uptake in hair cells (HCs) and supporting cells (SCs) at different positions along the tonotopic axis.
(A) 2-NBDG labelling in live basilar papilla (BP) explants shows no difference in glucose uptake along the proximal-to-distal axis or between cell types during development. 2-NBDG is a fluorescent glucose analogue which enters cells via GLUT transporters in the plasma membrane and is then phosphorylated by Hexokinase (HK) the first rate-limiting step in glycolysis (Figure 1). 2-NBDG fluorescence therefore reflects the rate of cellular glucose uptake, which can be correlated with its consumption. For instance, tumour cells with elevated glucose metabolism via the Warburg effect exhibit elevated 2-NBDG uptake (Yamada et al., 2007). (B) Quantification of glucose uptake during development measured from the same explants as indicated in Figure 3. (C) 2-NBDG fluorescence in HCs (orange bars) and SCs (green bars) at E14. Data are mean ± standard error of the mean (SEM). p > 0.05 for proximal and distal regions two-way analysis of variance (ANOVA). E7: n = 6, E9: n = 5, E14: n = 6, E16: n = 6 biological replicates. HCs versus SCs n = 6 biological replicates p > 0.05 two-way ANOVA. Scale bars = 40 μm.
Figure 3—figure supplement 3
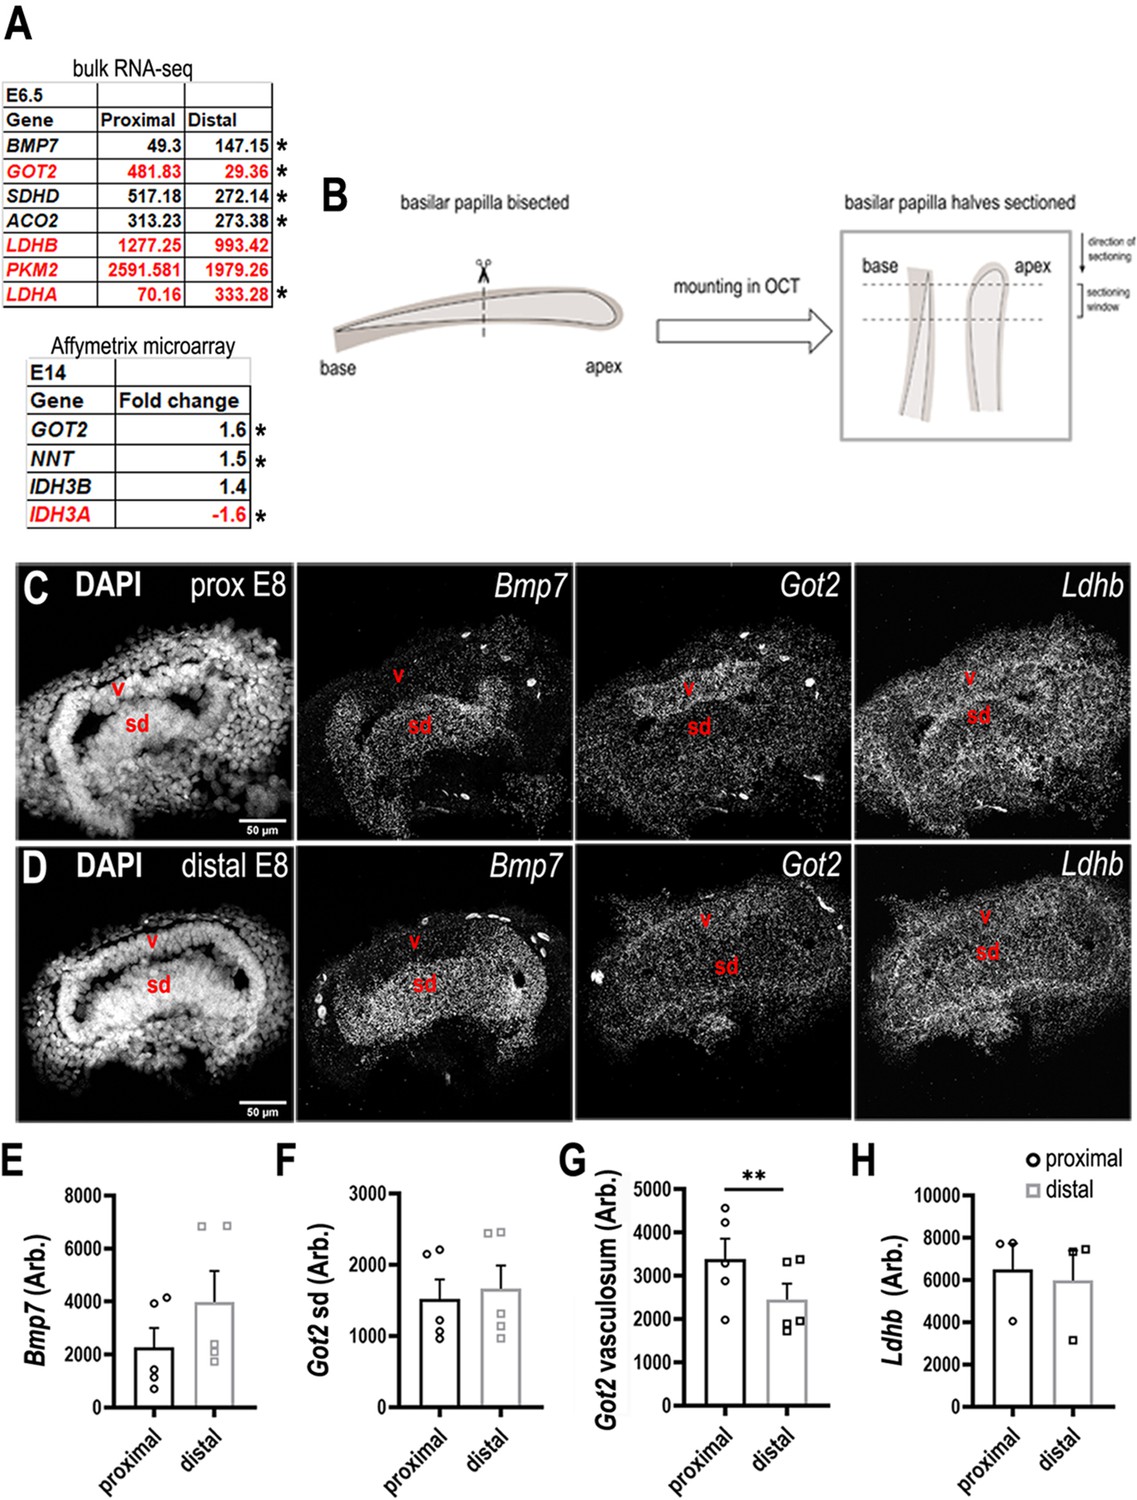
Differential expression of metabolic enzymes along the tonotopic axis of the chick basilar papilla (BP).
(A, top) Metabolic genes with differential expression between proximal and distal BP regions. Data show normalised RPKM values in the proximal and distal BP regions at E6. (A, bottom) Affymetrix microarray data showing the fold change in expression of each transcript at the proximal compared to the distal region of the BP at E14. (B) Sectioning protocol used to collect samples from proximal and distal regions at E8. Proximal and distal tissue used for RNA scope was collected and processed simultaneously from within the same BP. (C, D) RNA scope analysis of genes encoding metabolic regulatory proteins in the developing BP identified in A. Images show gene expression in comparative cross-sections from proximal and distal BP regions at E8. Bmp7 expression was used as a control for tonotopic identity as we know it is expressed in a distal-to-proximal gradient. (E–H) Quantification of RNA scope fluorescence in the BP at proximal and distal regions. The sensory domain (sd) and tegmentum vasculosum (v) were identified morphologically using the DAPI (4′,6-diamidino-2-phenylindole) channel. Bmp7 – Bone morphogenetic protein 7, Got2 – Glutamic-Oxaloacetic Transaminase 2, Sdhd – Succinate dehydrogenase complex subunit D, Aco2 – Aconitase 2, Ldhb – Lactate dehydrogenase beta, Pkm2 – Pyruvate kinase M2, Ldha – Lactate dehydrogenase alpha, Nnt – Nicotinamide Nucleotide Transhydrogenase, Idh3b – Isocitrate dehydrogenase beta, Idh3a – Isocitrate dehydrogenase alpha. Transcripts annotated red indicates those involved in regulating cellular NADPH/NADH. Data are mean ± standard error of the mean (SEM), * p< 0.05, **p < 0.001 two-way analysis of variance (ANOVA).
-
Figure 3—figure supplement 3—source data 1
This source data contains the vaules for affymetrix and bulk RNA-seq analysis at E6.5 and E14.
- https://cdn.elifesciences.org/articles/86233/elife-86233-fig3-figsupp3-data1-v2.xlsx
Figure 3—figure supplement 4
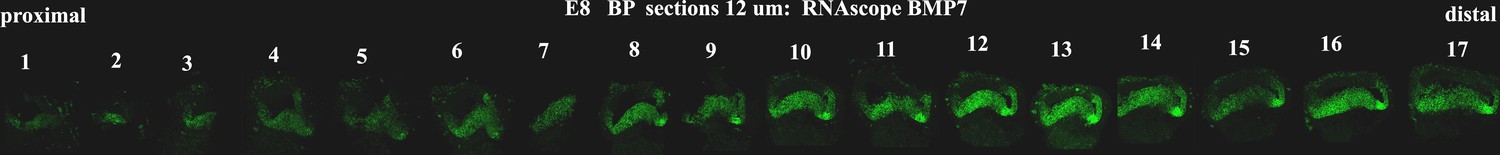
Tonotopic expression of Bmp7 along the developing basilar papilla (BP).
RNA scope anlysis of Bmp7 in cross-sections show tonotopic expression along the proximal-to-distal axis at E8.
Figure 3—figure supplement 5
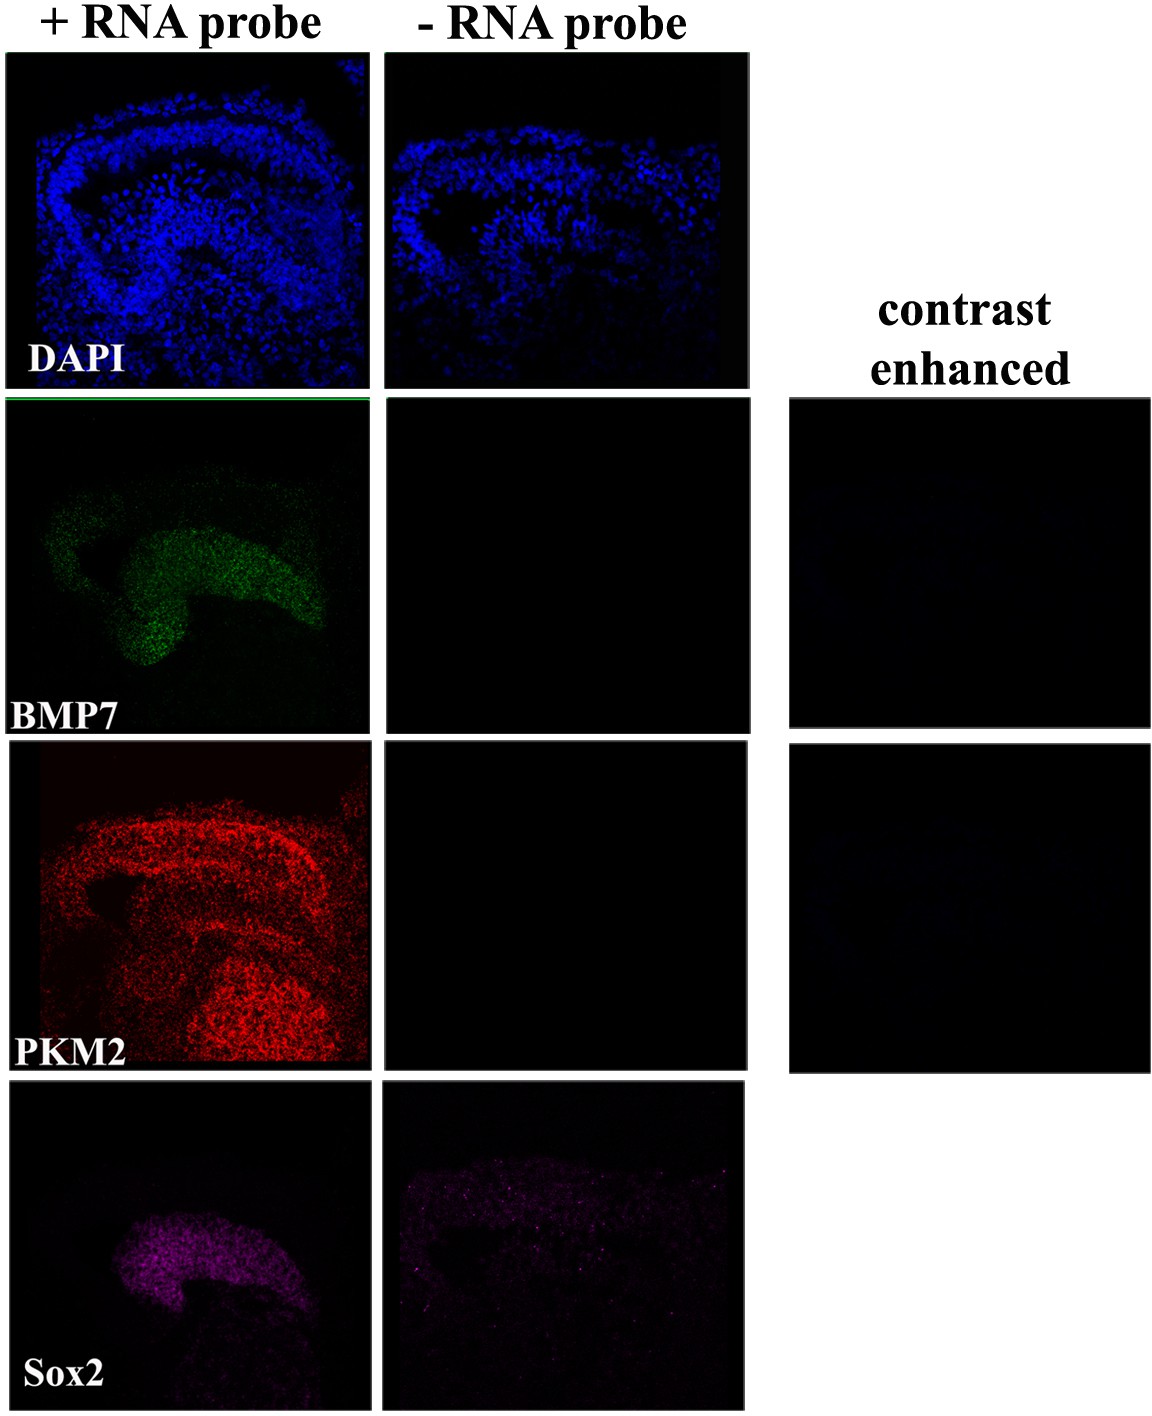
Negative controls for RNA scope analysis.
Images show the RNA scope signal in basilar papilla (BP) cross-sections in the presence and absence of RNA scope probes for Bmp7, Pkm2, and Sox2.
Figure 4 with 3 supplements
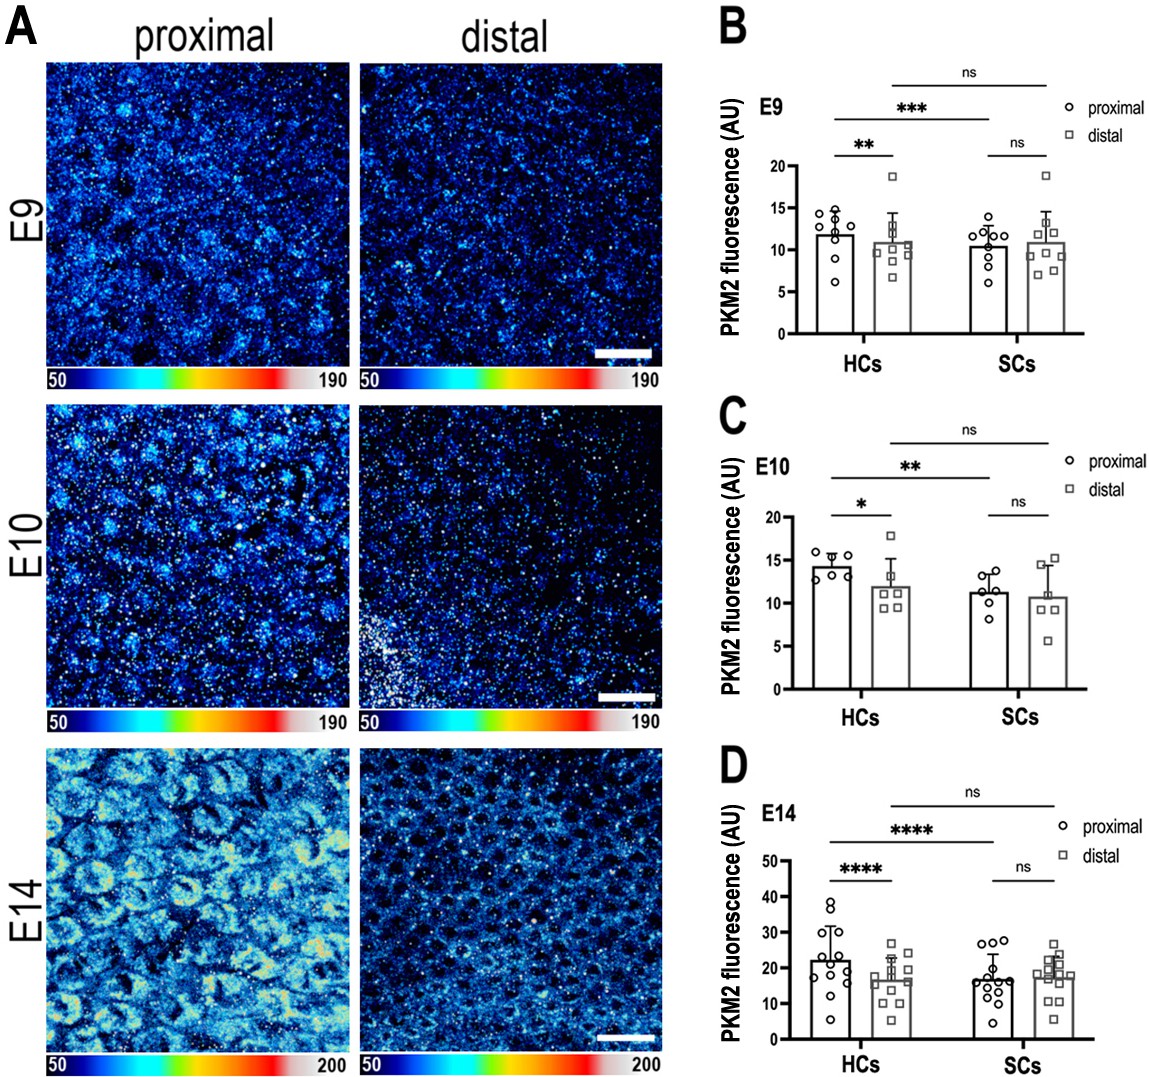
The metabolic gatekeeper Pkm2 is expressed in a tonotopic gradient during basilar papilla (BP) development.
(A) BP whole-mounts labelled for the metabolic enzyme Pkm2 in proximal and distal regions throughout development (E9, E10, and E14). Images show Pkm2 expression at the level of the hair cell (HC) nuclei. Epithelial z-position was determined using Phalloidin and Calbindin staining within the same preparation (images not shown). (B–D) Quantification of Pkm2 fluorescence intensity in proximal and distal BP regions at E9, E10, and E14. HC and supporting cell (SC) regions of interest (ROIs) were determined using Phalloidin and Calbindin staining within the same preparation. Data are mean ± standard error of the mean (SEM). E9: n = 9, E10: n = 6, E14: n = 13 independent biological replicates. *p = <0.05, **p = <0.01, ***p = <0.001, ****p = <0.0001 two-way analysis of variance (ANOVA). Scale bars are 20 μm.
Figure 4—figure supplement 1
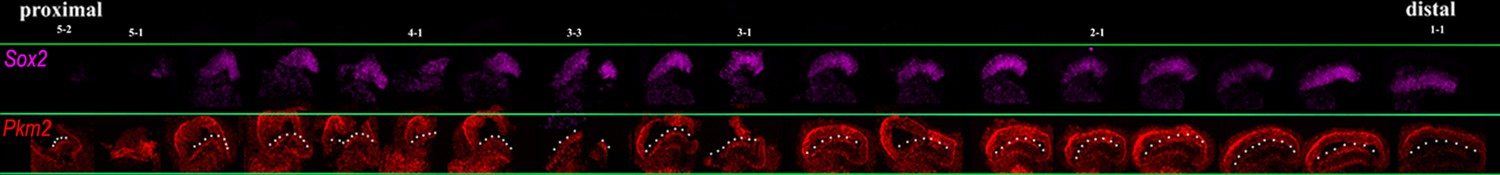
Proximal-to-distal expression of Sox2 and Pkm2 at E8.
Images show cross-sections of the chick basilar papilla (BP) at E8 indicating expression of Sox2 and Pkm2 along the proximal-to-distal axis. White dashed line indicates the prosensory region.
Figure 4—figure supplement 2
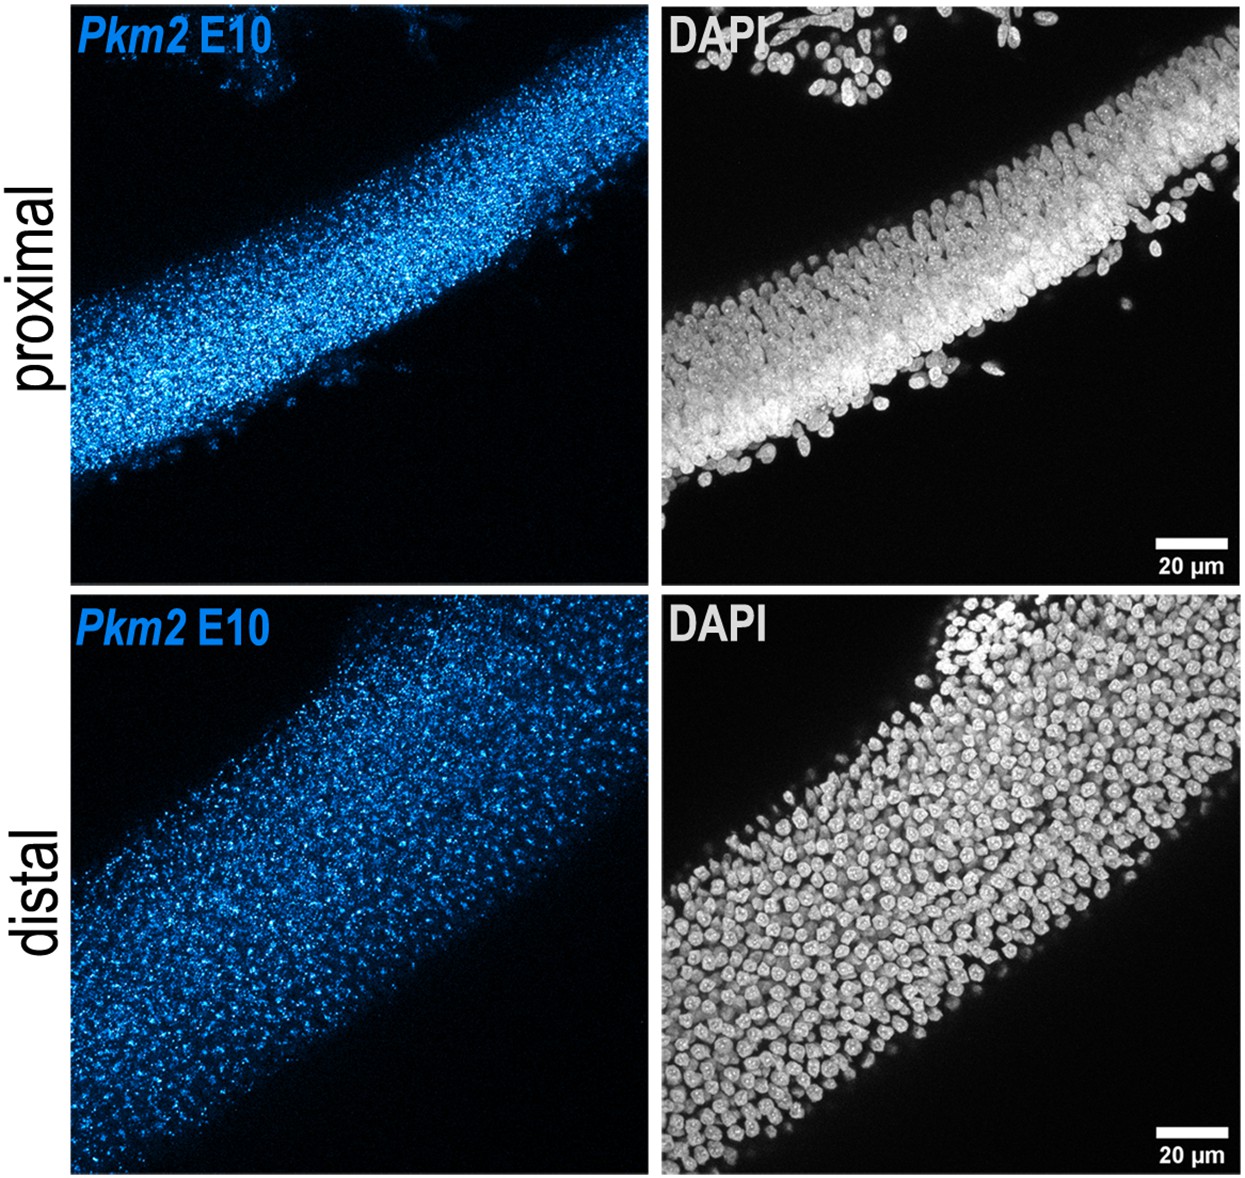
Tonotopic expression of Pkm2 in the developing basilar papilla (BP).
RNA scope analysis of Pkm2 expression in BP whole-mounts from the proximal and distal regions at E10. Data are representative of four independent biological replicates.
Figure 4—figure supplement 3
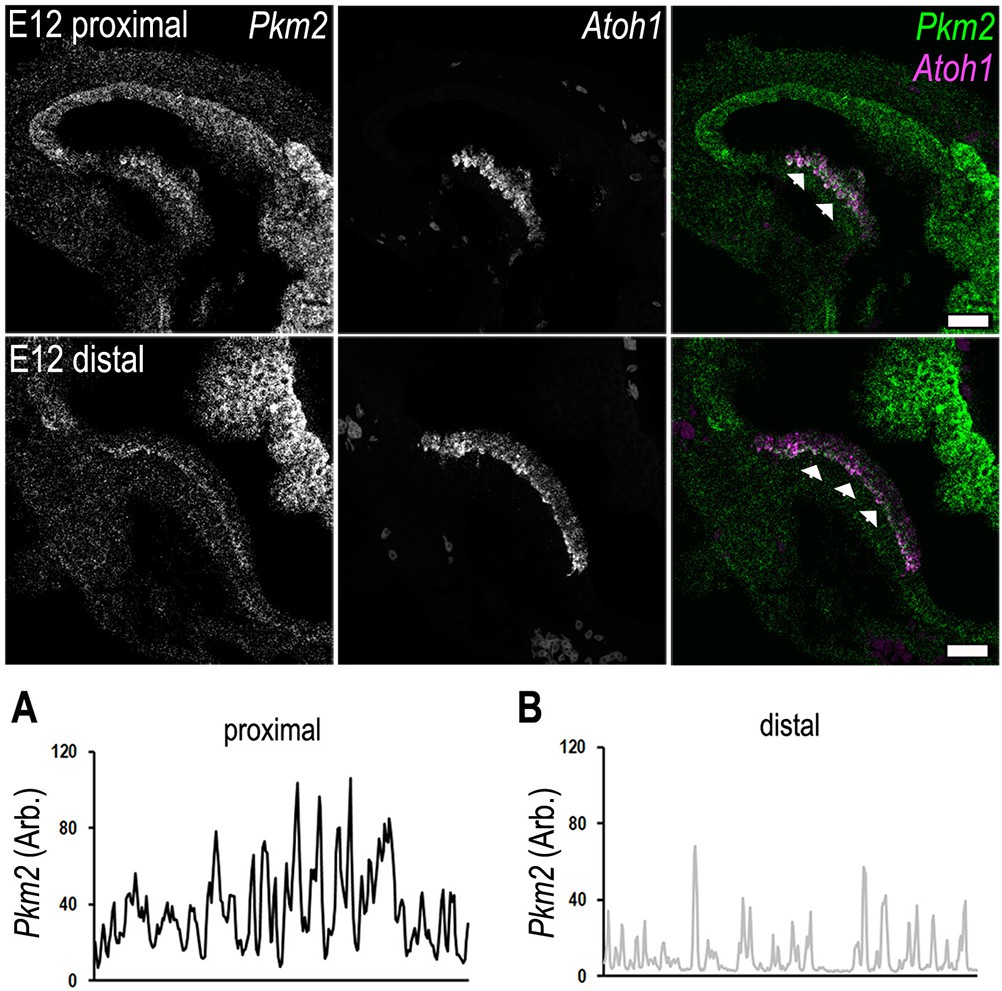
Tonotopic expression of Pkm2 and Atoh1 in the developing basilar papilla (BP).
RNA scope analysis of Pkm2 and the hair cell-specific transcription factor Atoh1 in BP whole-mounts of the proximal and distal regions at E12. Data are representative of three independent biological replicates. (A, B) Line scan analysis along the prosensory region in the proximal and distal regions highlighting differences in Pkm2 fluorescence intensity. Scale bar is 20 μm. Data are representative of three biological replicates.
Figure 5 with 3 supplements
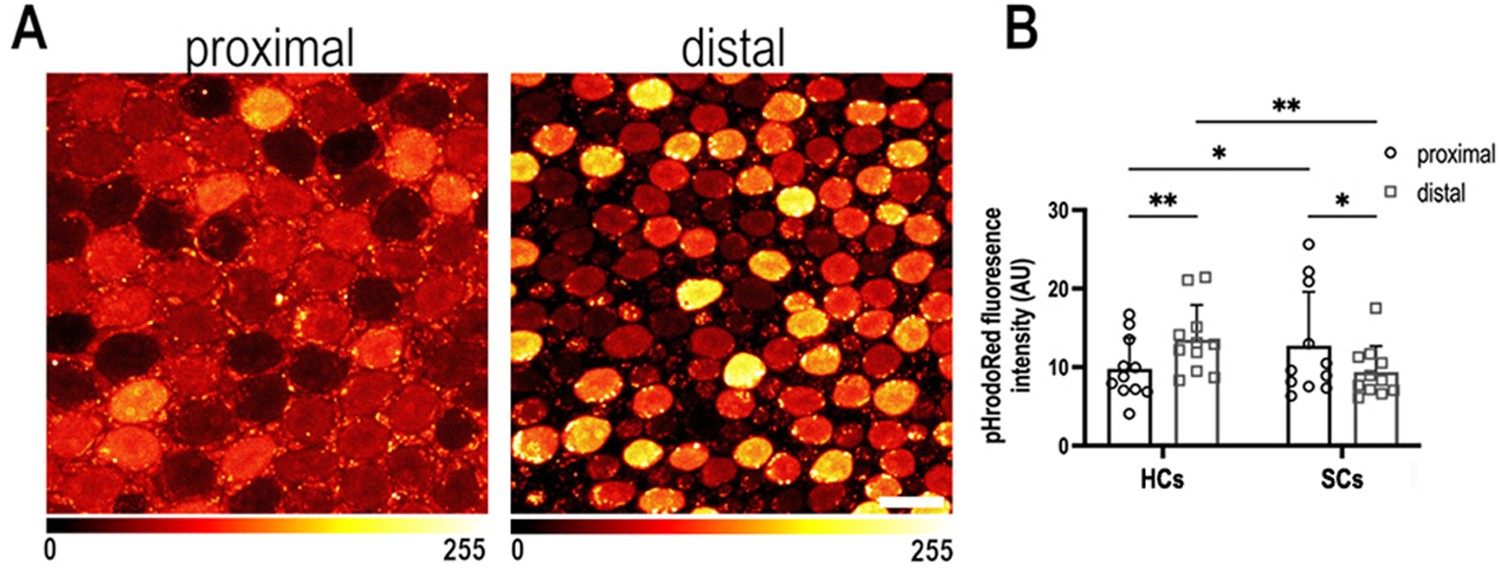
Intracellular pH varies as a function of frequency position during early basilar papilla (BP) development.
(A) Intracellular pH, reported by pHrodo Red fluorescence intensity, in the proximal and distal BP regions at E9. High fluorescence indicates acidic pH and low fluorescence a more alkaline pH. (B) Mean pHrodo Red fluorescence in measured from hair cells (HCs) and supporting cells (SCs) in proximal and distal frequency BP regions. Note the proximal-to-distal gradient in intracellular pH. Data are mean ± standard error of the mean (SEM) from 11 independent biological replicates for HCs and 12 independent biological replicates for SCs. *p = <0.05, **p = <0.01 two-way analysis of variance (ANOVA). Scale bar is 10 μm.
Figure 5—figure supplement 1
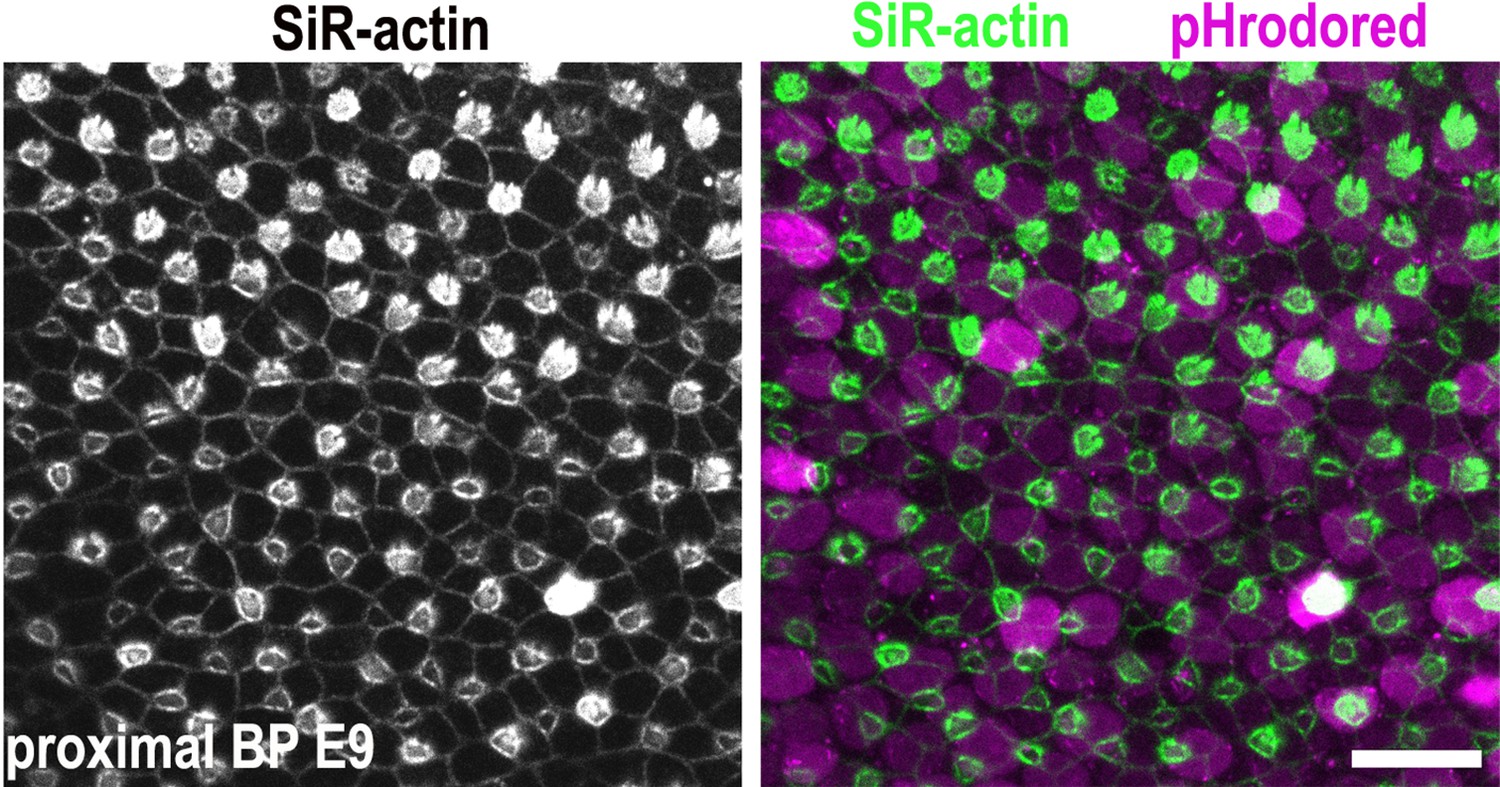
Generating hair cell (HC) and supporting cell (SC) analysis masks.
Images show z-projections of basilar papilla (BP) explants dual loaded with pHrodo Red and SiR-actin. The stereocilial bundles at the epithelial surface were used to differentiate between HCs and SCs when generating analysis masks.
Figure 5—figure supplement 2
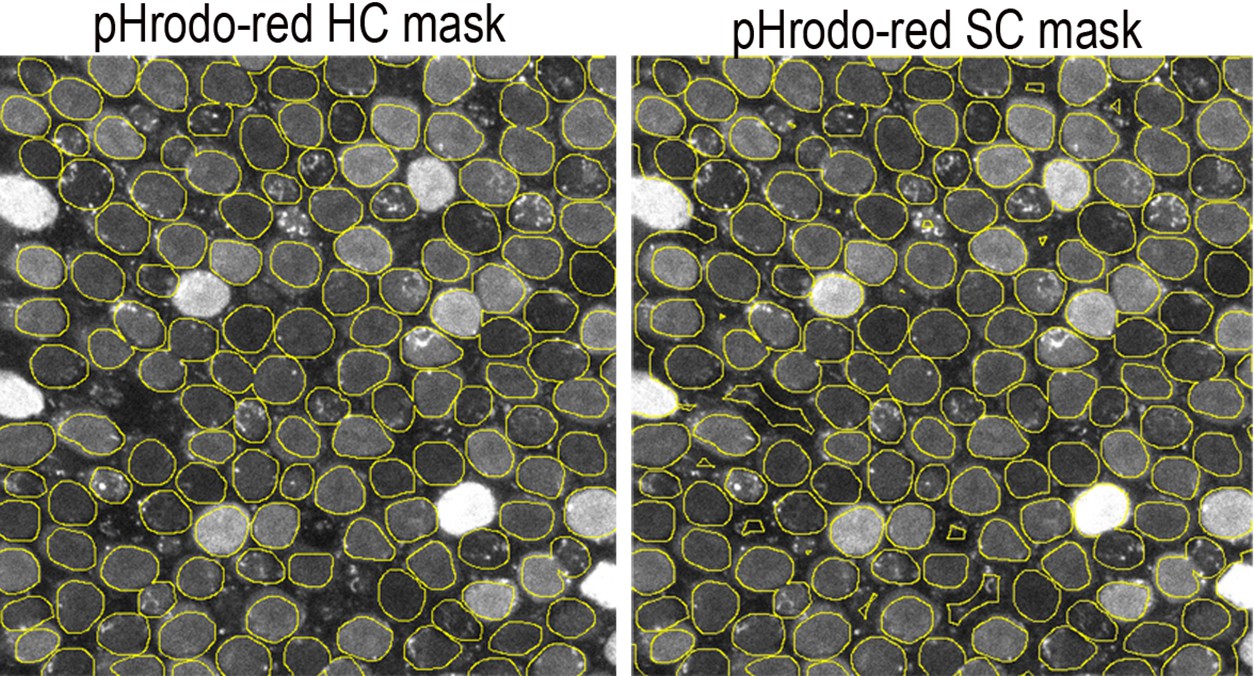
Hair cell (HC) and supporting cell (SC) masks used for quantification of pHrodo Red fluorescence.
HC fluorescence was measured from within the regions of interest (ROIs) (yellow circles). SC fluorescence was measured from inverse masks generated using the HC ROIs. SC signal was assumed to originate from the areas outside of the defined HC ROIs. The presence of a stereociliary bundle as reported by the SiR-actin was used to differentiate between HCs and SCs.
Figure 5—figure supplement 3
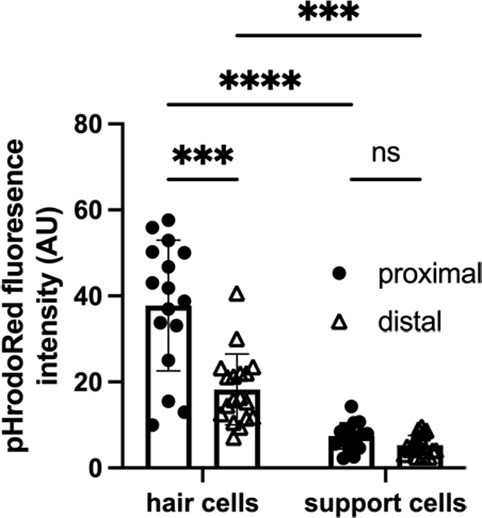
pHrodo Red fluorescence along the tonotopic axis of the chick basilar papilla (BP) at E14.
Quantification of mean pHrodo Red fluorescence in hair cells (HCs) and supporting cells (SCs) from proximal and distal BP regions at E14 shows a reverse gradient to that reported by the indicator at early developmental stages. Data are mean ± standard error of the mean (SEM) from 16 independent biological replicates. ***p = <0.001, ****p = <0.0001 two-way analysis of variance (ANOVA).
Figure 6 with 3 supplements
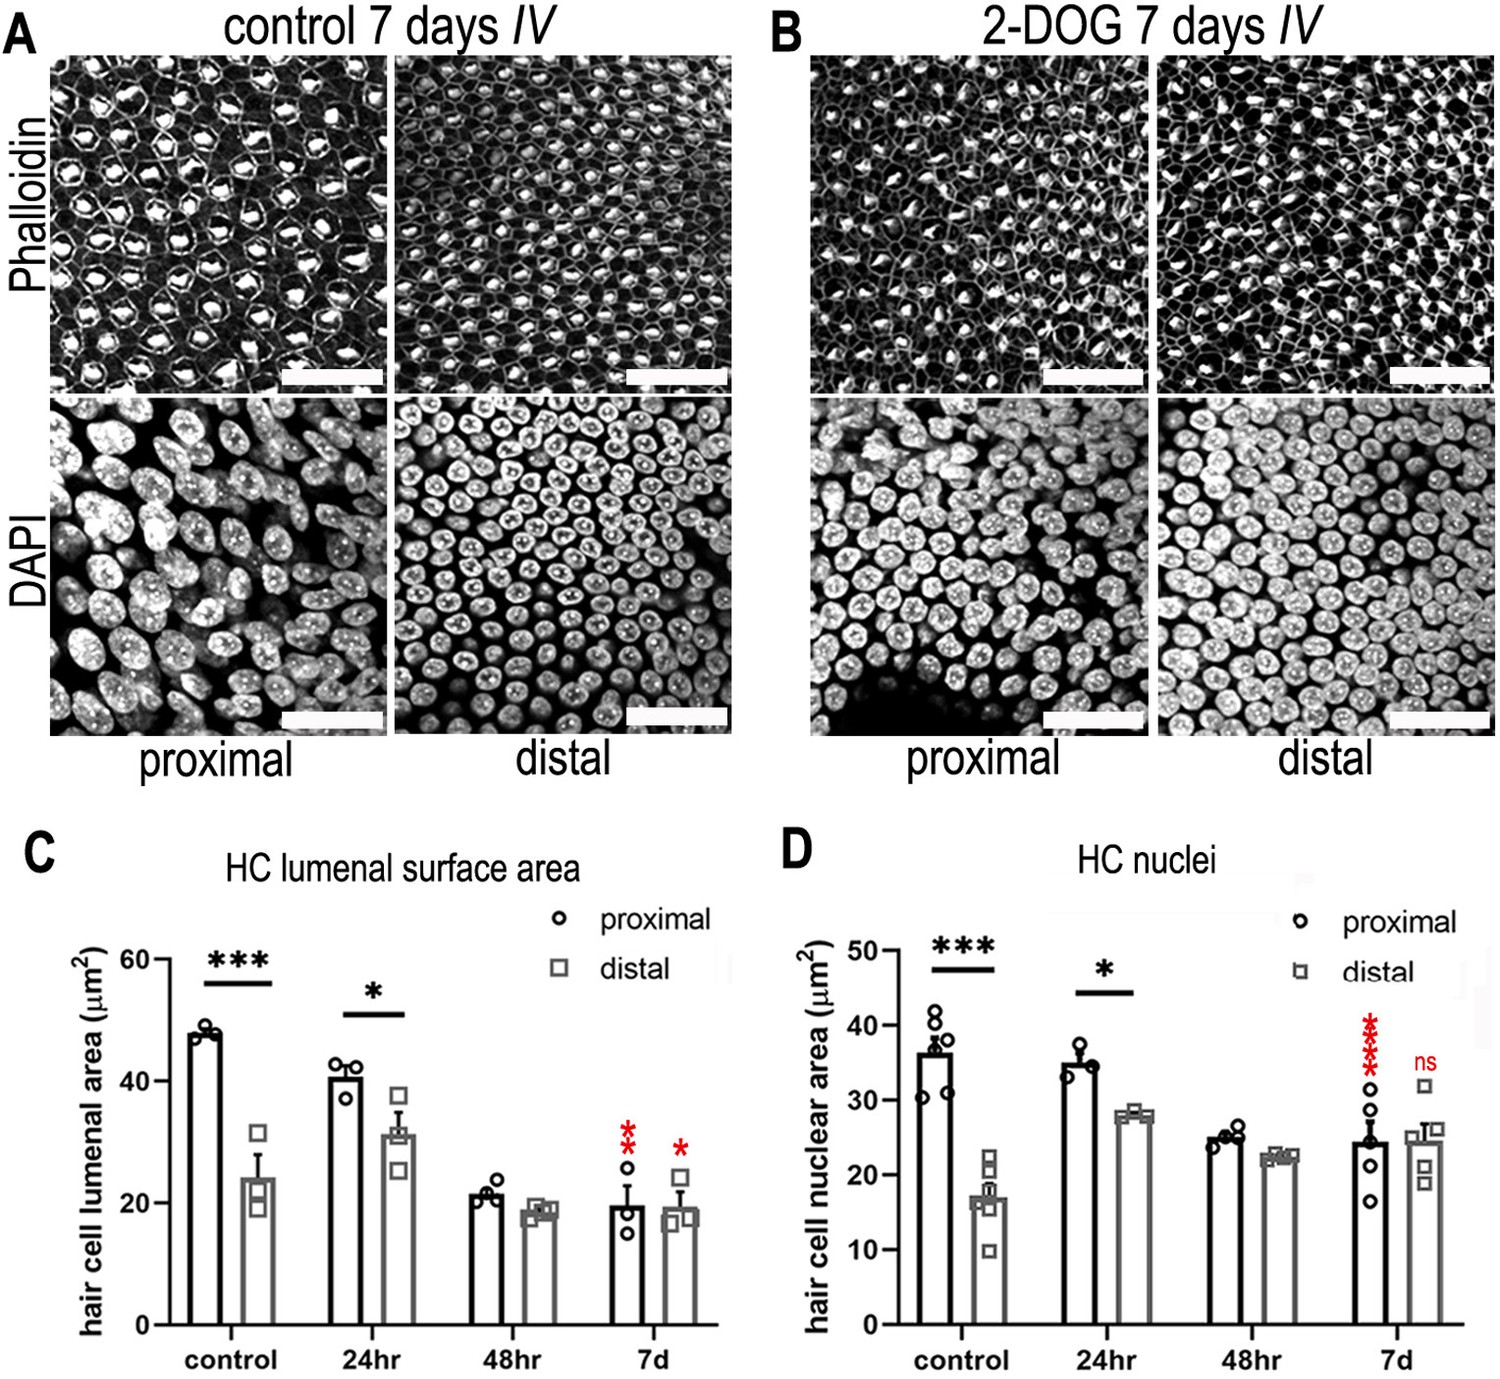
Blocking cytosolic glucose metabolism at key stages of cochlear development induces distal-like phenotypes in the proximal basilar papilla (BP).
(A, B) Maximum z-projections of BP explants showing Phalloidin and DAPI staining in the proximal and distal regions. Explants were maintained from E6.5 for 7 days in vitro (equivalent to E13.5) in either control medium or medium supplemented with 2 mM 2-deoxy-D-glucose (2-DOG) + 5 mM sodium pyruvate (NaP). Phalloidin staining depicts differences in hair cell (HC) morphology between proximal and distal regions and DAPI indicates the gradient in HC size. (C) HC lumenal surface area measured in 2500 μm2 regions of interest (ROIs) in the proximal (black bars) and distal (grey bars) BP regions for all culture conditions. In controls, mean lumenal surface decreases progressively from the proximal-to-distal region. This gradient is abolished if glucose catabolism is blocked with 2-DOG between E6.5 and E13.5. 2-DOG caused a significant decrease in HC size in the proximal but not distal region. 2-DOG treatments were reduced to 24 or 48 hr to identify the developmental time window during which glycolysis takes effect. Following wash-out of 2-DOG after 24 hr, explants developed with normal HC positional identity. Explants treated with 2-DOG for 48 hr showed no recovery of positional identity following wash-out indicated by the flattening of HC morphology along the BP. (D) Quantification of HC nuclei area in the same 2500 μm2 ROI areas. Treatment with 2-DOG induced similar, yet less pronounced effects to those seen at the HC cuticular plate. Data are mean ± standard error of the mean (SEM). *p < 0.05, ***p < 0.001 two-way analysis of variance (ANOVA). Controls; n = 6; controls LSA; n = 3; 2-DOG, n = 5; 24 2-DOG, n = 3; and 48 hr 2-DOG, n = 3 biological replicates. Red stars indicate two-way ANOVA tests between proximal control and proximal 2-DOG and distal control and distal 2-DOG conditions. To ensure adequate substrate supply to the tricarboxylic acid (TCA) cycle, 2-DOG-treated explants were supplemented with NaP. G6P – glucose 6-phosphate, F6P – fructose 6-phosphate, F16BP – fructose 1,6-bisphosphate, 2-DOG – 2-deoxyglucose. Scale bars are 20 μm.
Figure 6—figure supplement 1
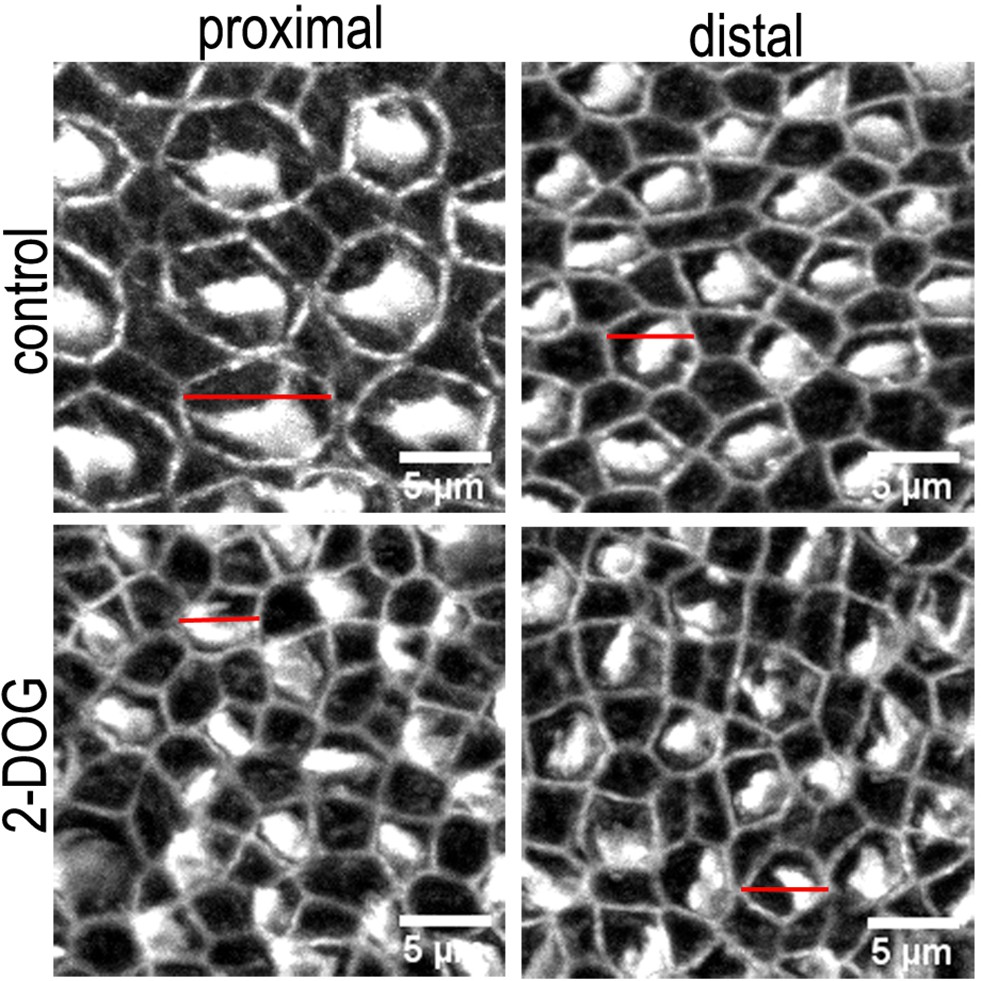
Morphological differences in the hair cell (HC) bundle and cuticular plate region in basilar papilla (BP) explants treated with control or 2-deoxy-D-glucose (2-DOG) containing medium.
Images are maximum z-projections of Phalloidin stained BP explants from the proximal and distal BP regions. Explants were maintained from E6.5 for 7 days in vitro (equivalent to E13.5) in either control medium or that supplemented with 2 mM 2-DOG + 5 mM sodium pyruvate (NaP). Phalloidin staining depicts differences in HC lumenal surface area and gross bundle morphology between proximal and distal regions. Red lines indicate the size difference in HC lumenal surface area between control and 2-DOG-treared cultures.
Figure 6—figure supplement 2
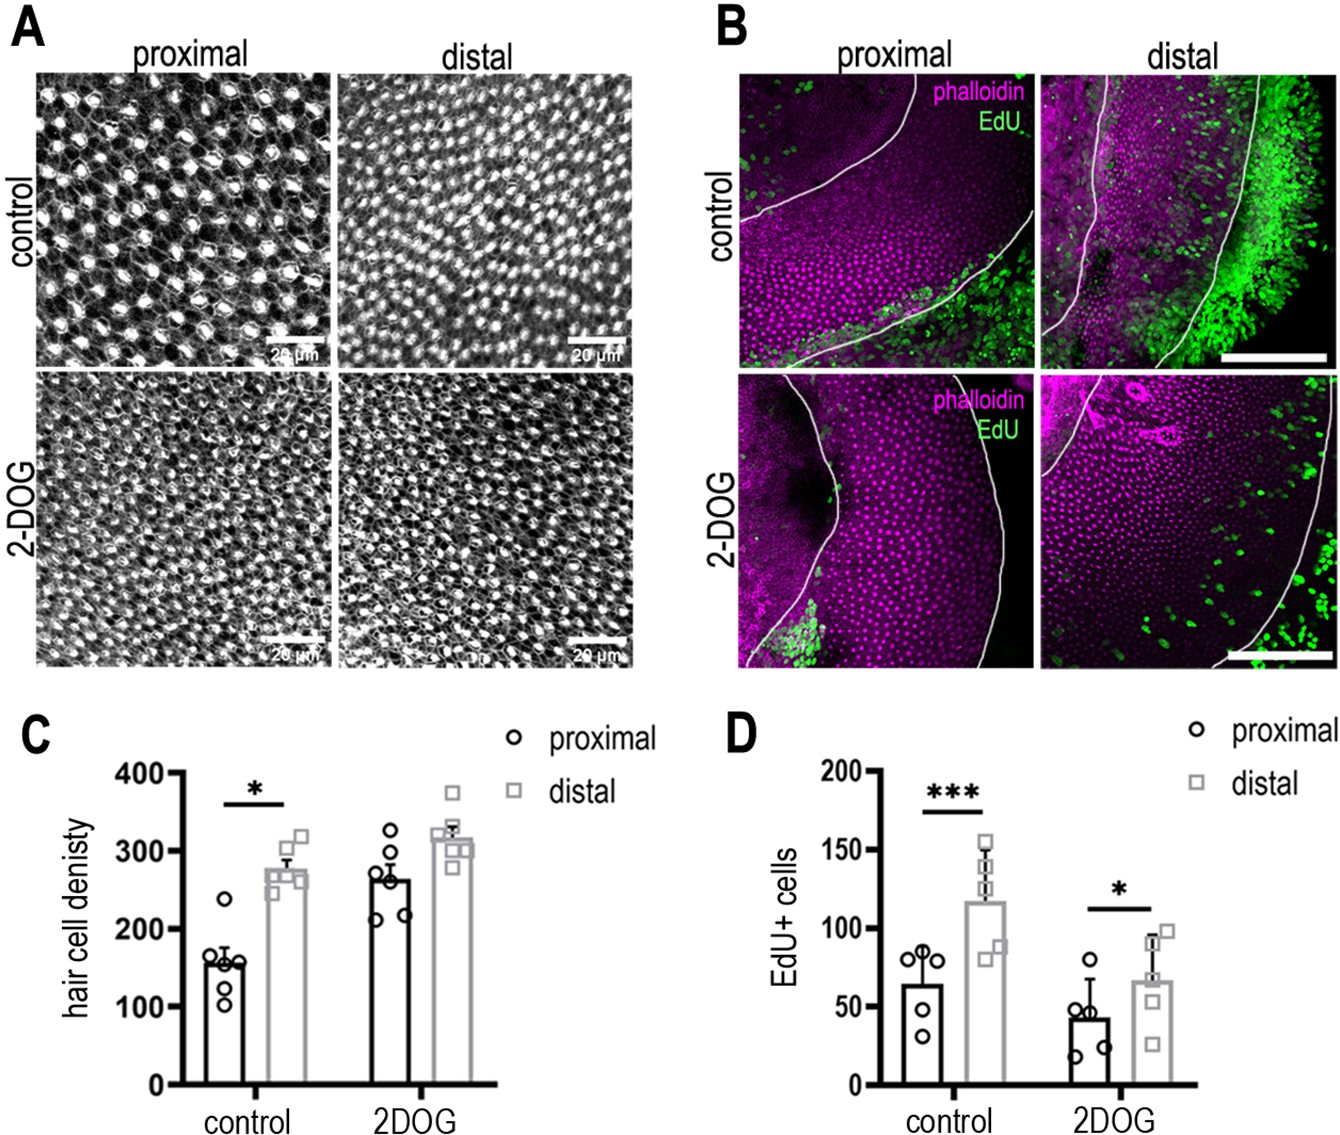
2-Deoxy-D-glucose (2-DOG) increases hair cell (HC) density in the proximal basilar papilla (BP) region independently of proliferation.
(A) Phalloidin staining indicating HC density in the proximal and distal BP regions in control (top) and 2-DOG-treated (bottom) explants. (B) Maximum z-projections of proximal and distal regions from Phalloidin (magenta) and the 5-ethynyl-2′-deoxyuridine (EdU) (green) stained BPs. Explant cultures were established at E8 and maintained for 48 hr in vitro in control medium + EdU or medium containing EdU + 2 mM 2-DOG and 5 mM sodium pyruvate. Proliferation was consistently reduced in 2-DOG-treated explants. (C) Quantification of HC density in proximal and distal BP regions counted from 100 mm2 regions of interest (ROIs) in each region. (D) EdU counts from 100 mm2 ROIs in proximal and distal BP regions in control and 2-DOG-treated cultures. Data mean ± standard error of the mean (SEM). *p < 0.05, ***p < 0.001 two-way analysis of variance (ANOVA). Control: n = 5 biological replicates, 2-DOG: n = 5 biological replicates. EdU: control n = 5 independent biological replicates; 2-DOG EdU n = 5, 2-DOG HC density n = 6 independent biological replicates. White lines outline the regions of BP sensory epithelium.
Figure 6—figure supplement 3
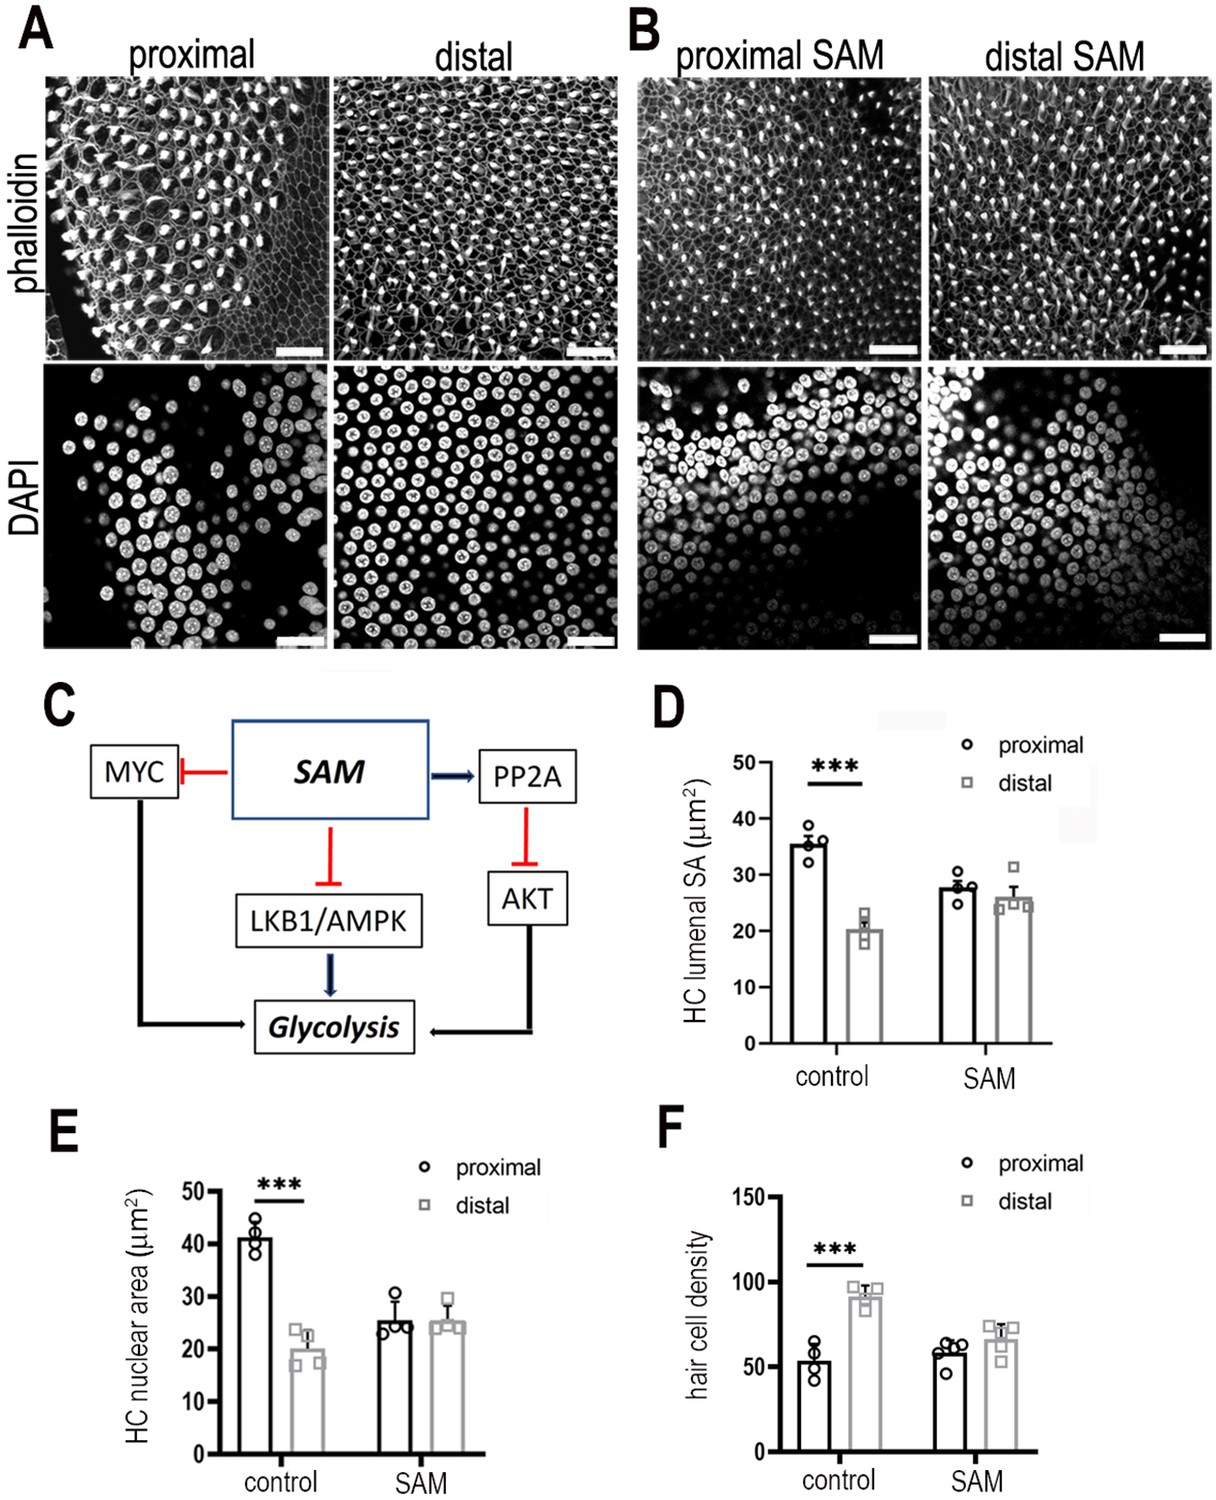
Modulating S-adenosyl methionine during development abolishes the gradient in hair cell morphology along the tonotopic axis of the basilar papilla (BP).
(A, B) Images are maximal z-projections of proximal and distal regions from BP explants maintained for 7 days in vitro in control medium or medium containing 50 μM SAM. Phalloidin staining (A, B, top panels) shows the BP surface and hair cell lumenal surface areas and DAPI staining (A, B, bottom panels) shows the hair cell size and density along the proximal-to-distal axis. (C) Schematic showing how increasing SAM levels indirectly modulates cytosolic glycolytic flux. (D–F) Treatment of explants with SAM from E6.5 for 7 days in vitro abolished the normal gradient in hair lumenal surface area, nuclear area and cell density along the tonotopic axis. This effect was most pronounced in the proximal compared to distal region. All metrics were quantified from 2500 μm2 regions of interest (ROIs) in the proximal (black bars) and distal (grey bars) BP regions of control and SAM-treated explants SA = surface area. Data are mean ± standard error of the mean (SEM). ***p = <0.001 two-way analysis of variance (ANOVA). Controls: n = 4 and SAM: n = 4 biological replicates. Scale bars are 20 μm. MYC – MYC Proto-Oncogene (basic helix–loop–helix transcription factor), SAM – S-adenosyl methionine, PP2A – protein phosphatase 2, AKT – Akt serine/threonine kinase family, LKB1/AMPK – serine threonine kinase pathway in volved in metabolic regulation.
Figure 7 with 2 supplements
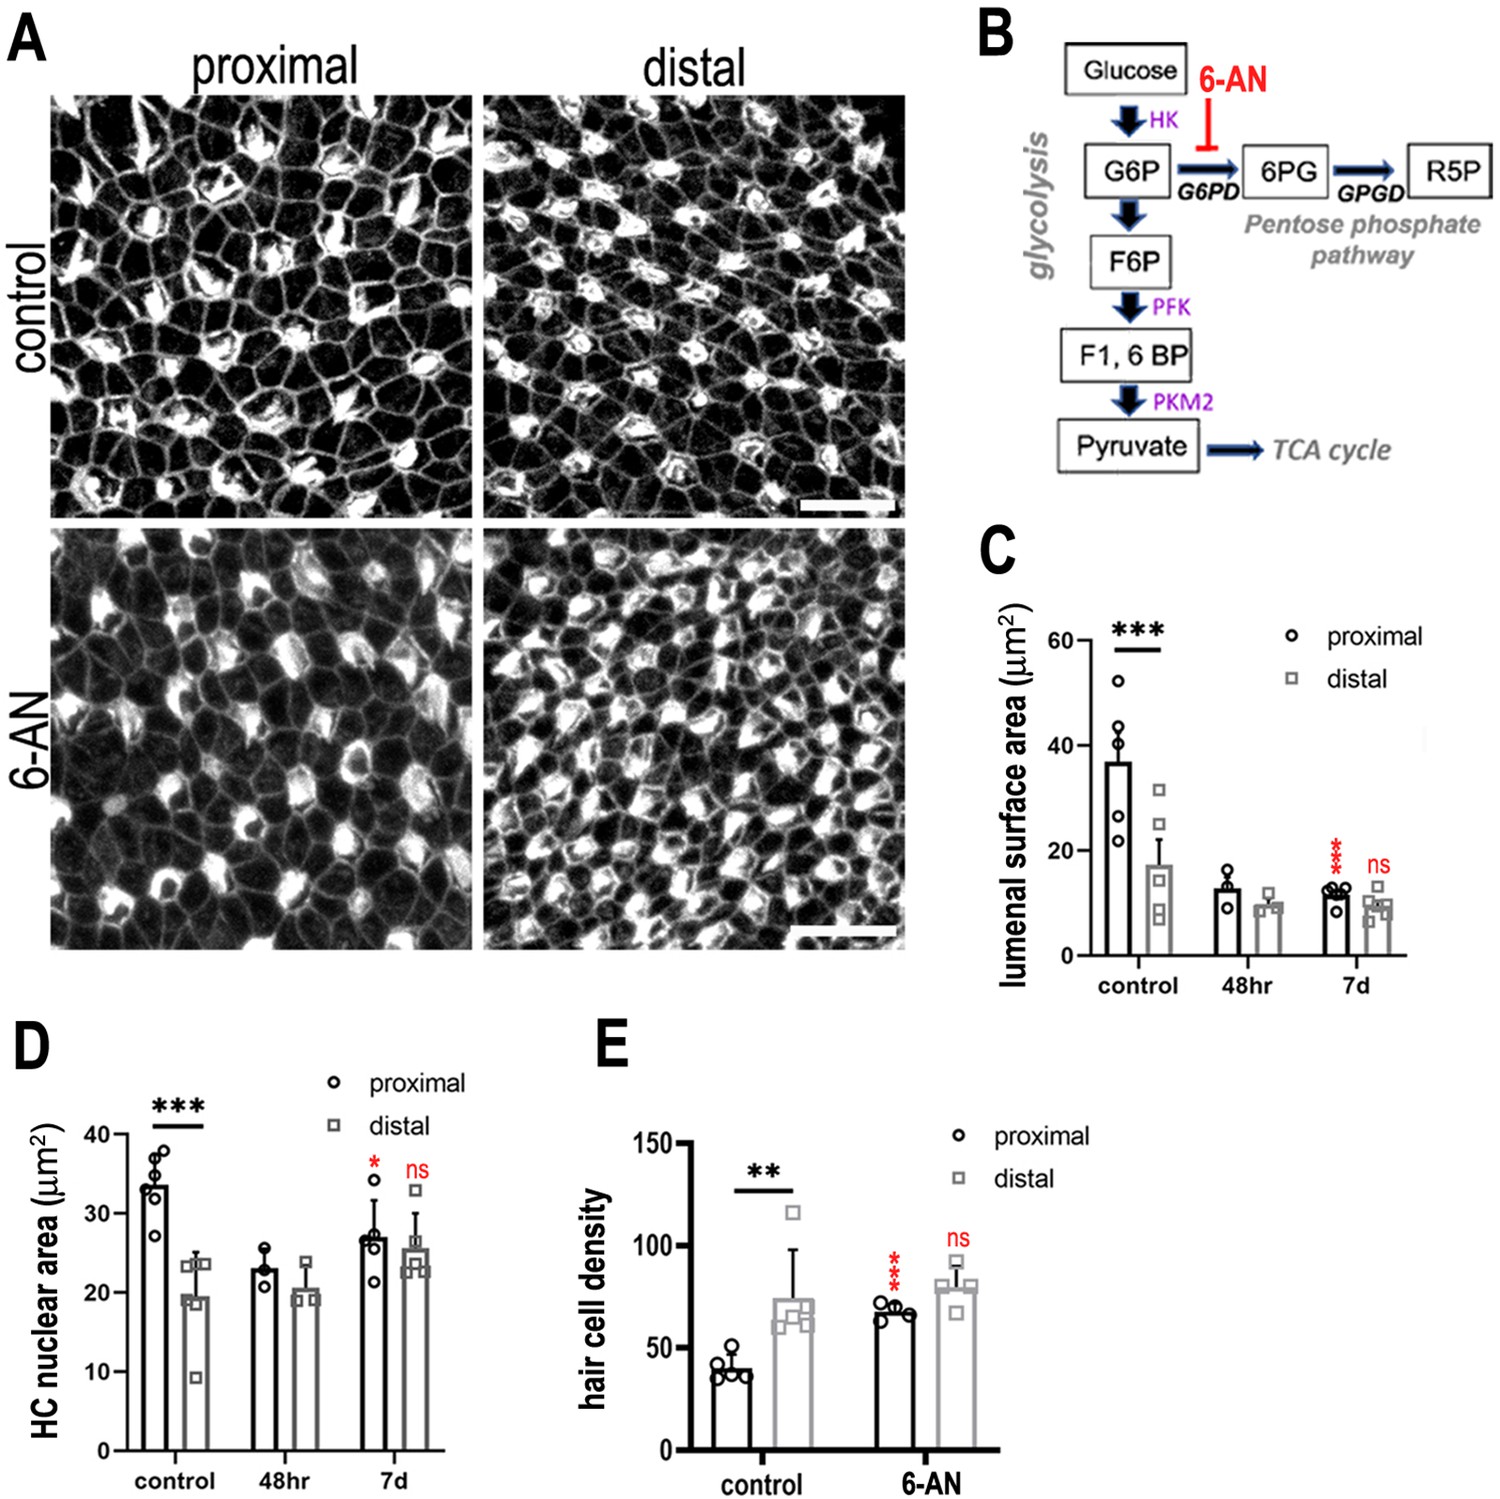
Glucose flux through the pentose phosphate pathway modulates hair cell development and positional identity along the tonotopic axis of the basilar papilla (BP).
(A, B) Maximal z-projections of BP explants cultured from E6.5 for 7 days in vitro with control medium or medium containing 2 μM 6-aminonicotinamide (6-AN). Images show the epithelial surface in proximal and distal BP regions stained with Phalloidin. (C) Treatment of explants with 6-AN, a specific blocker of flux through the pentose phosphate pathway, caused a significant reduction in proximal compared to distal hair cell lumenal surface area. (D, E) Quantification of hair cell luminal surface area, nuclear area and cell density in defined 2500 μm2 regions of interest (ROIs) from the proximal (black bars) and distal (grey bars) BP regions. Data are mean ± standard error of the mean (SEM). **p = <0.01, ***p = <0.001 two-way analysis of variance (ANOVA). Nuclei: controls n = 6, 48 hr n = 3, 7 days n = 5; LAS: controls n = 5, 48 hr n = 3, 7 days n = 5; cell density: controls n = 5, 7 days n = 4. Independent biological replicates. Red stars indicate statistical significance for proximal and distal regions when compared between control and 6-AN conditions. Scale bars are 10 μm. G6P – glucose 6-phosphate, F6P – fructose 6-phosphate, F16BP – fructose 1,6-bisphosphate.
Figure 7—figure supplement 1
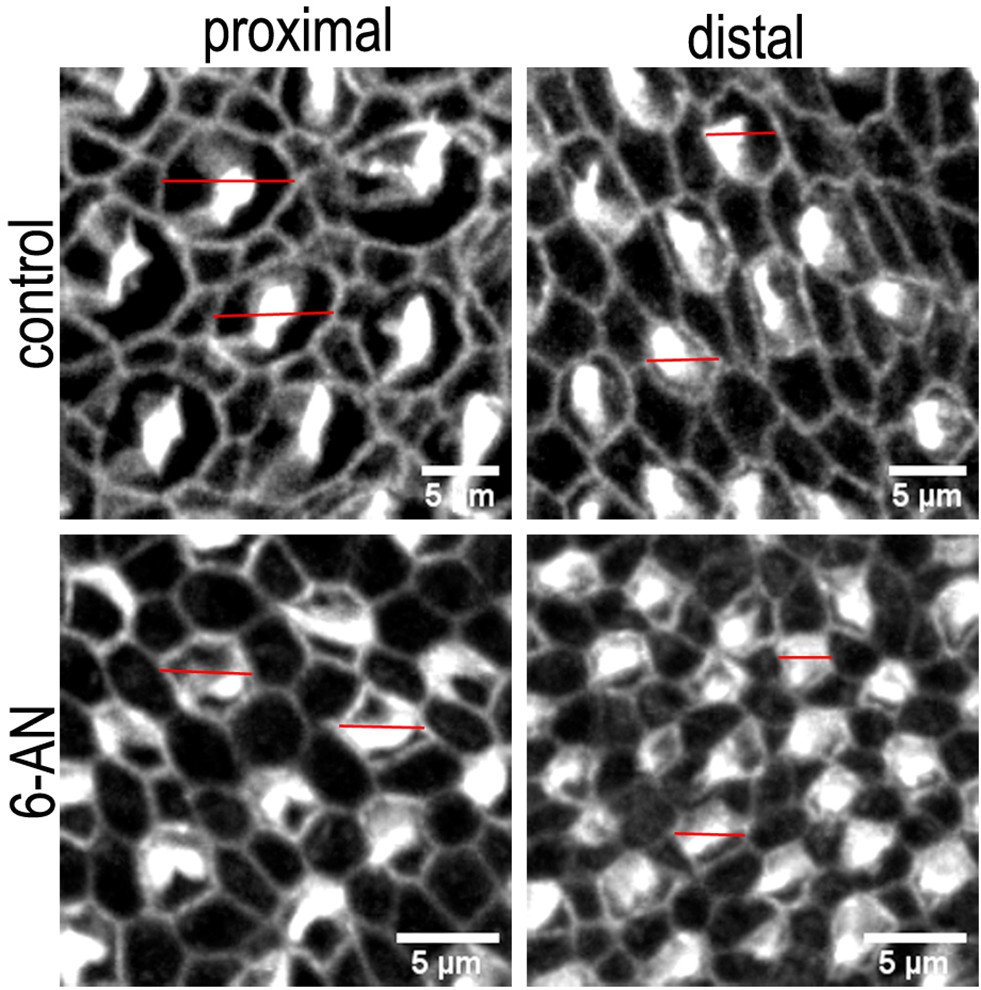
Differences in the hair cell (HC) lumenal surface area and gross bundle morphology in proximal and distal basilar papilla (BP) regions from explants treated with control or 6-aminonicotinamide (6-AN) containing medium.
Images are maximum z-projections of Phalloidin stained BP explants from the proximal and distal BP regions. Explants were maintained from E6.5 for 7 days in vitro (equivalent to E13.5) in either control medium or that supplemented with the pentose phosphate pathway (PPP) inhibitor 6-AN. Phalloidin staining depicts differences in HC lumenal surface area and gross bundle morphology between proximal and distal regions. Red lines indicate the size difference in HC lumenal surface area between control and 6-AN-treated cultures. Scale bars are 5 μm.
Figure 7—figure supplement 2
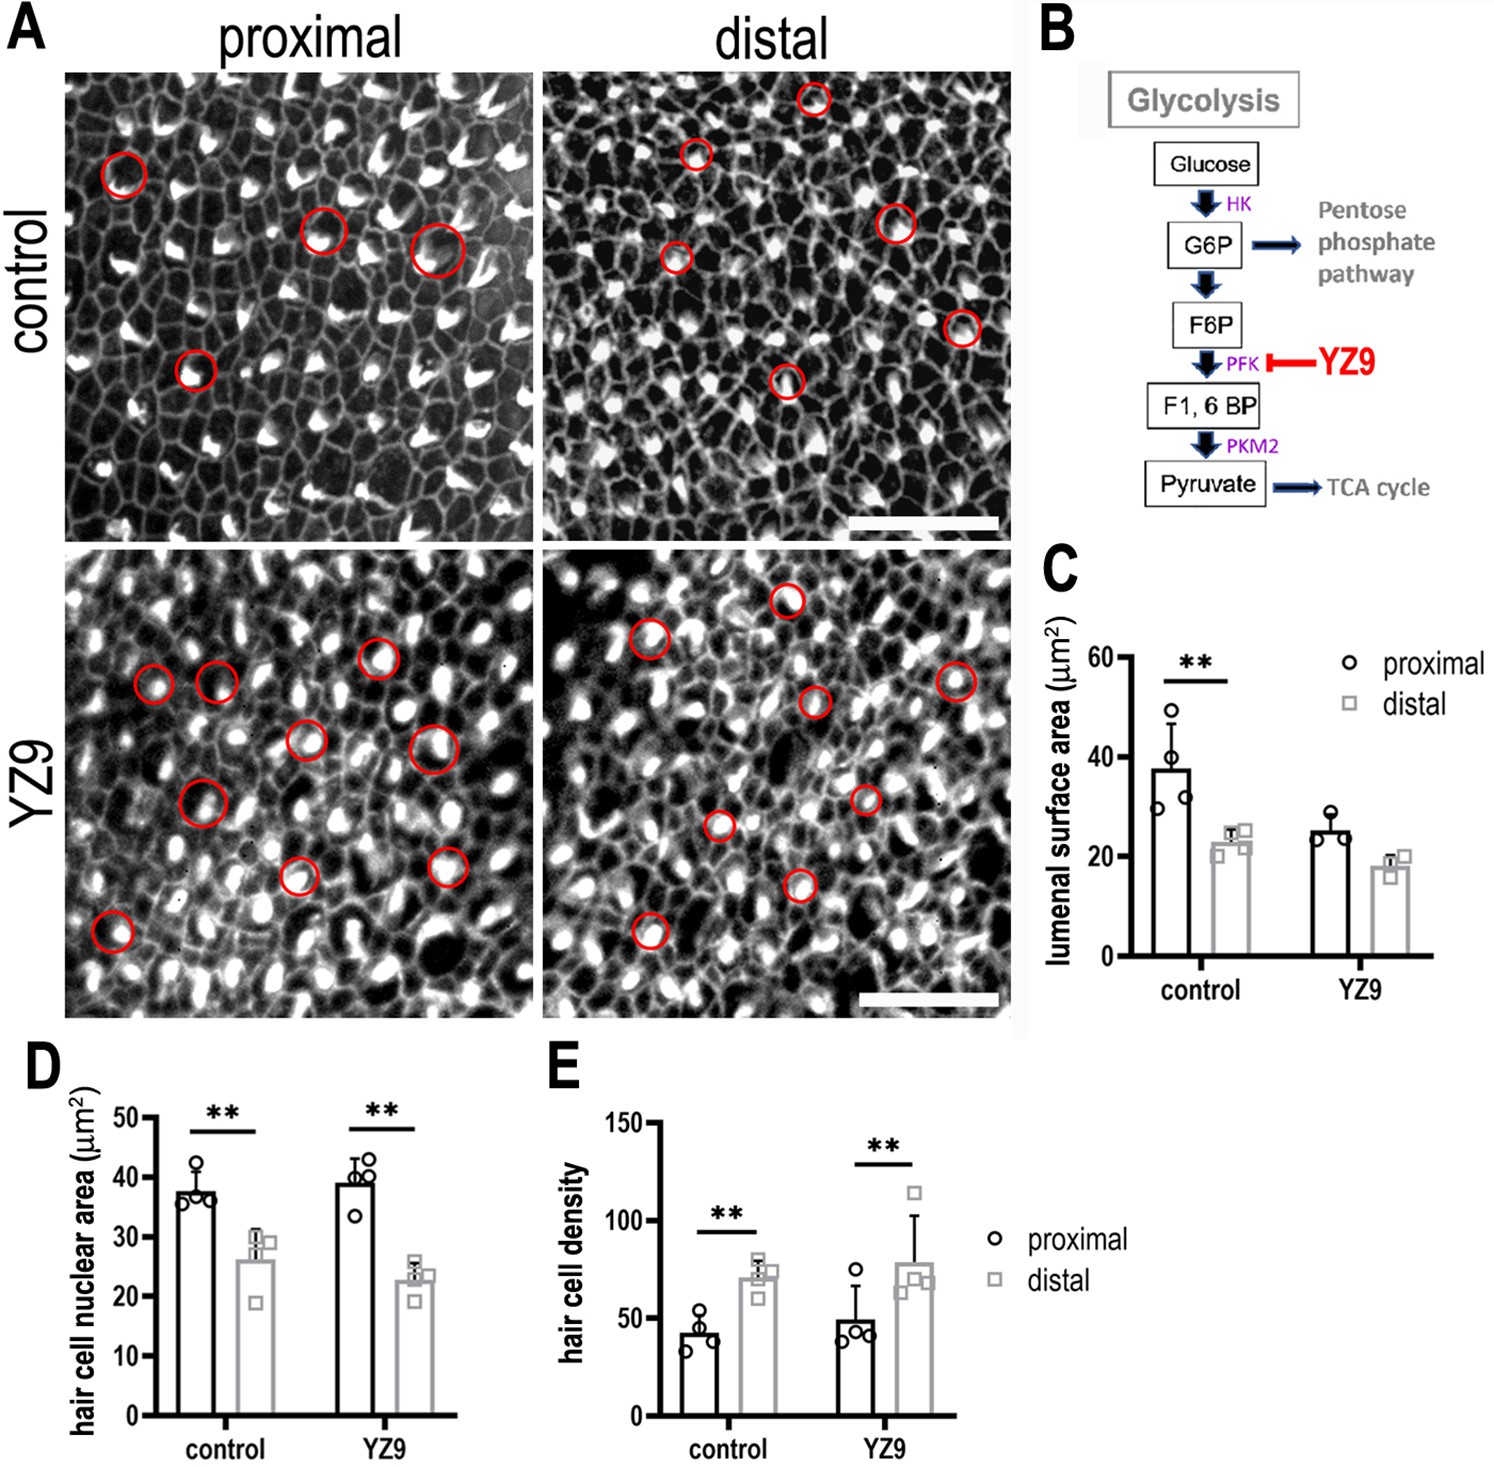
Inhibiting phosphofructokinase alters hair cell (HC) morphology at the luminal surface area during basilar papilla (BP) development.
(A) Maximal z-projections showing Phalloidin staining in proximal and distal BP regions of control and YZ9-treated explants. (B) Blocking glycolysis at the level of PFK between E6.5 and E13.5 had no effect on HC morphology along the tonotopic axis. HC circumference was quantified in 2500 μm2 areas in proximal (black bars) and distal (grey bars) regions, showing no difference in size or density after treatment with 1 μM YZ9. (C) Schematic illustrating the inhibitory action of YZ9 in the glycolytic pathway. Data are mean ± standard error of the mean (SEM). **p = <0.01 two-way analysis of variance (ANOVA). Controls: n = 4, YZ9: n = 4. Scale bars are 20 μm. Red circles indicate size HC lumenal surface area between control and YZ9-treated explants (n = 3). HK – Hexokinase, G6P – glucose 6-phosphate, F6P – fructose 6-phosphate, F1, PFK – phosphofuctokinase, 6BP – fructose 1,6-bisphosphate, PKM2 – pyruvate kinase M2.
Figure 8
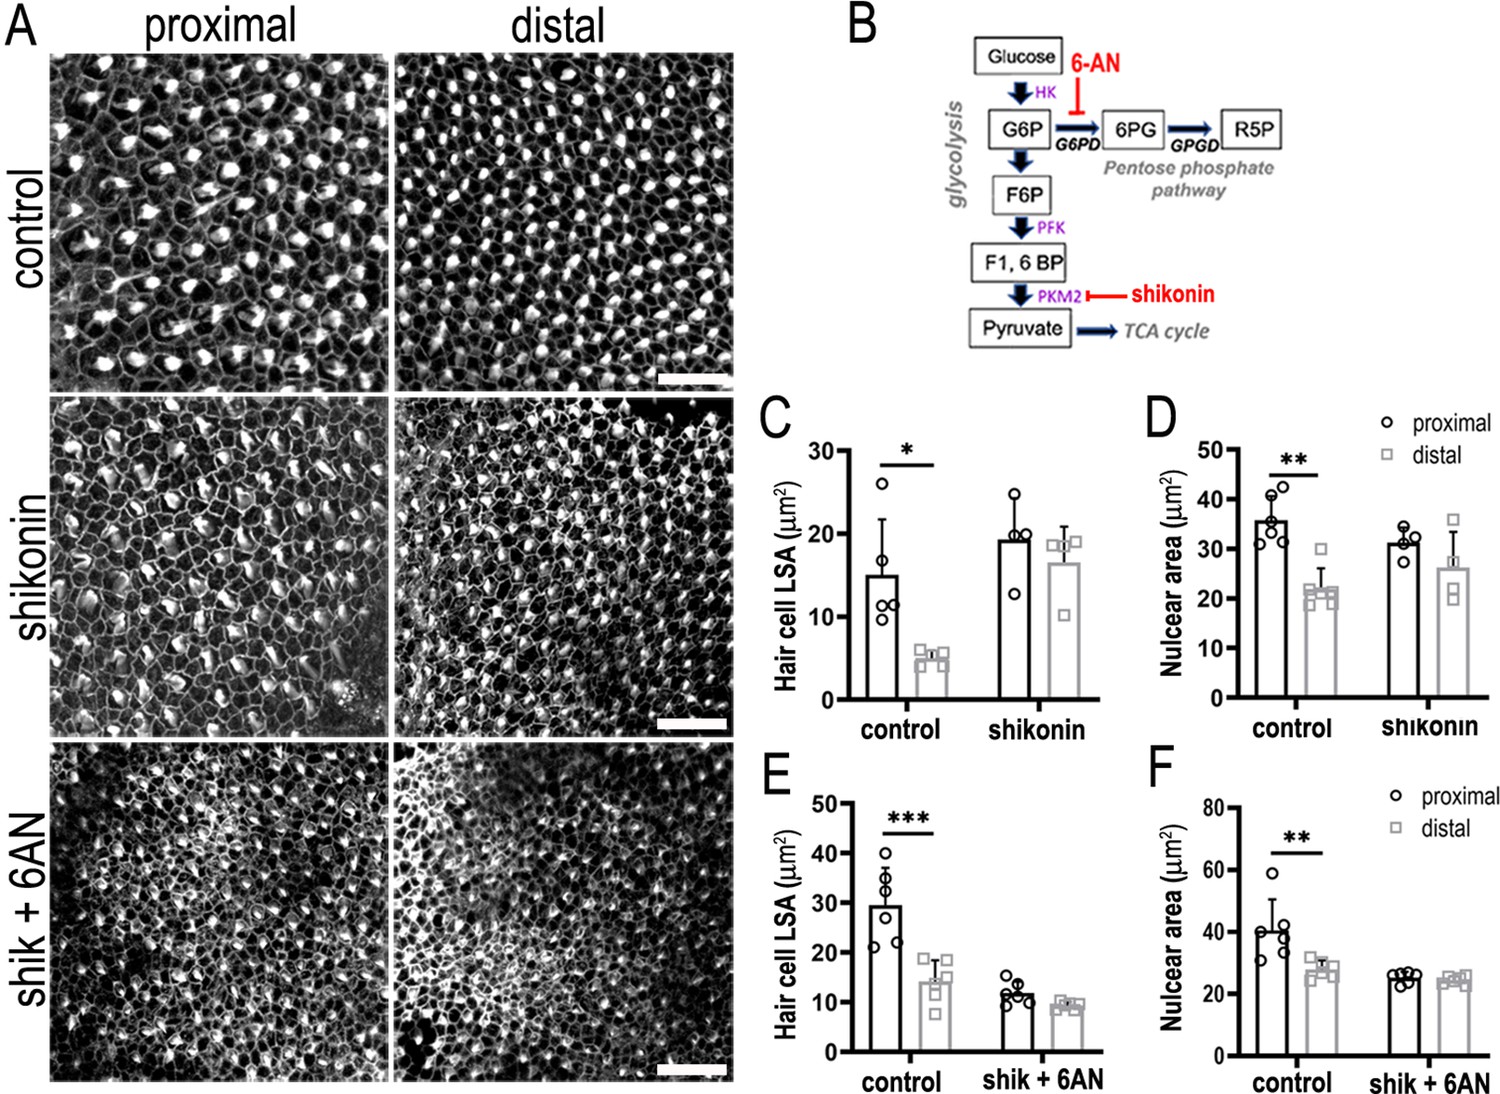
Glucose catabolism in pentose phosphate pathway (PPP) and Pkm2 pathways is necessary for specifying correct hair cell (HC) morphology and patterning along the tonotopic axis of the developing basilar papilla (BP).
(A) Maximal z-projections showing Phalloidin staining at the epithelial surface in proximal and distal BP regions of control and shikonin and shikonin + 6-aminonicotinamide (6-AN)-treated explants. (B) Schematic illustrating the metabolic enzymes targeted by shikonin and 6-AN. (C, D) Quantification of HC lumenal surface area and nuclear are in control and shikonin BP explants established at E6.5 and maintained for 7 days in vitro. (E, F) Quantification of HC lumenal surface area and nuclear are in control and shikonin + 6 AN explants treated from E6.5 for 7 days in vitro. HC circumference, nuclear area, and HC density were quantified in 2500 μm2 regions of interest (ROIs) in proximal and distal regions. Data are mean ± standard error of the mean (SEM). *p = <0.05, **p = <0.01, ***p = <0.001 two-way analysis of variance (ANOVA). Controls: n = 5 for LSA, n = 6 for nuclear area, shikonin: n = 4, shikonin + 6-AN: n = 6. Scale bars are 20 μm.
Figure 9 with 1 supplement
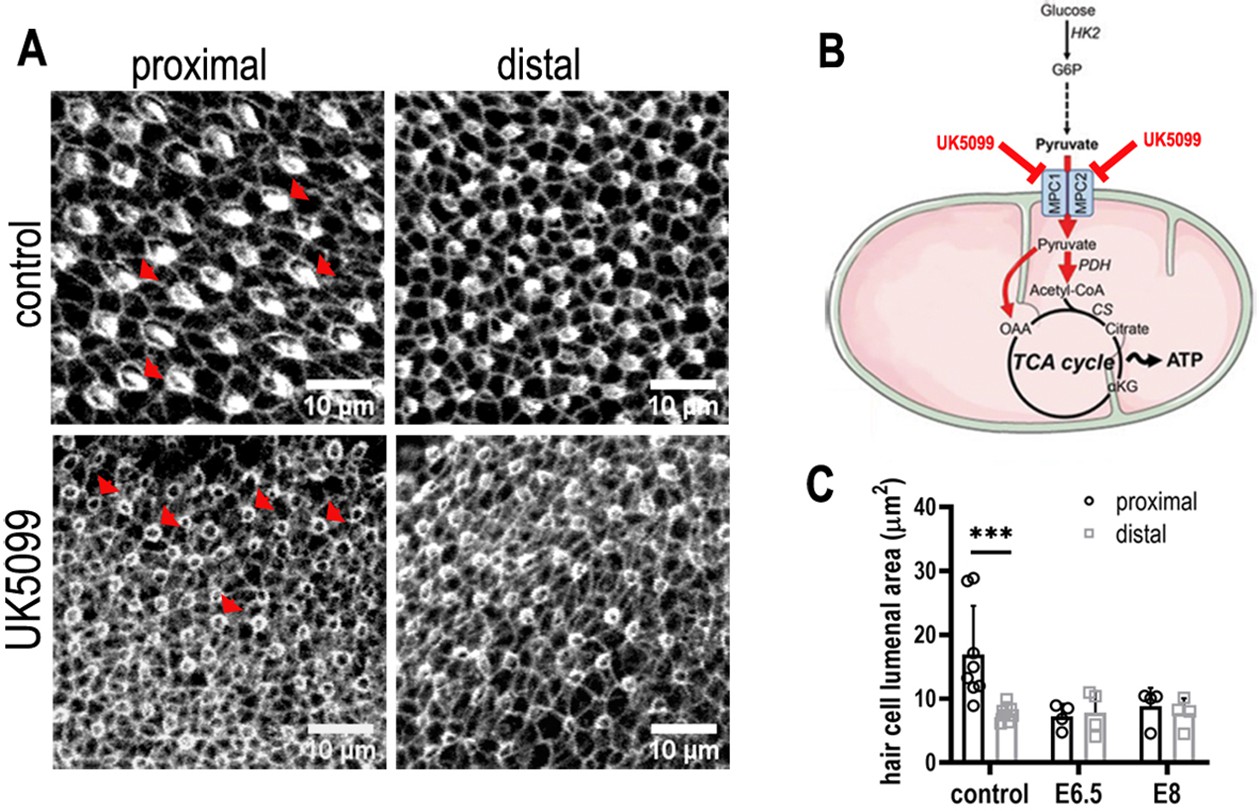
Mitochondrial OXPHOS is necessary for the normal developmental progression of hair cells (HCs) but not positional identity.
(A) HC morphology at the surface of the basilar papilla (BP) epithelium in explants stained with Phalloidin. Cultures were established at E6.5 and maintained for 7 days in vitro in control medium or that supplemented with the mitochondrial inhibitor UK5099. (B) Blocking pyruvate uptake into mitochondria with UK5099 disrupts normal tricarboxylic acid (TCA) cycle activity and thus mitochondrial OXPHOS by blocking pyruvate uptake via the mitochondrial pyruvate carrier (MPC1/MPC2). (C) Blocking mitochondrial OXPHOS from E6.5 to E13.5 equivalent caused developmental abnormalities in HCs along the BP including reduced HC size and immature stereocilial bundles (red arrowheads in A) in both proximal and distal regions compared to controls. To test whether mitochondrial OXPHOS is required for overall developmental progression, cultures were also established at E8 and treated with 1 μM UK5099 for 7 days in vitro to the developmental equivalent of E15. HCs showed no apparent recovery of normal morphology following UK5099 treatment from E8 compared to E6.5. Data are mean ± standard error of the mean (SEM). ***p < 0.001, two-way analysis of variance (ANOVA). Controls: n = 8, UK5099 E6.5: n = 4, E8: n = 4.
Figure 9—figure supplement 1
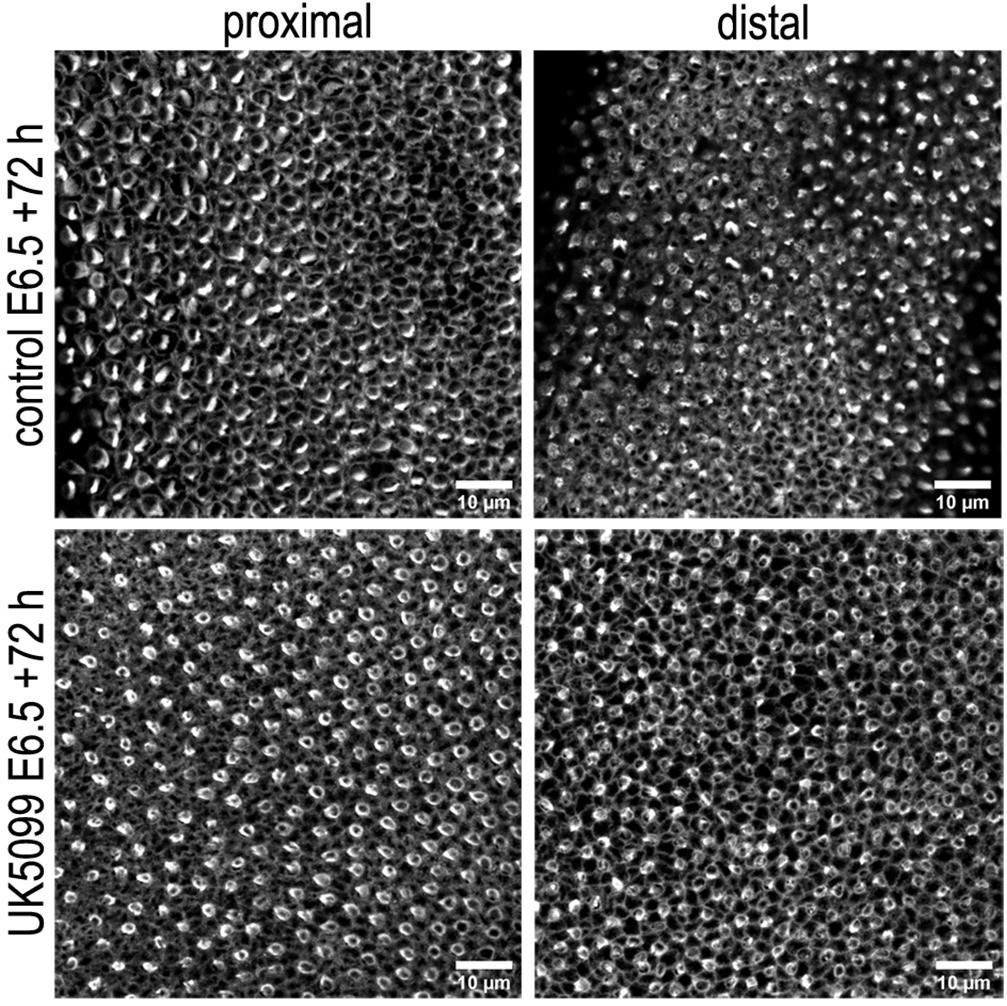
Blocking mitochondrial OXPHOS delays developmental acquisition of normal hair cell (HC) morphologies.
Images show HC morphology at the surface of the basilar papilla (BP) epithelium in explants stained with Phalloidin. Explants were established at E6.5 and maintained for 72 hr (E9.5 equivalent) in culture in control (top) medium or that supplemented with the mitochondrial inhibitor UK5099 (bottom). Images are representative of three independent biological replicates.
Figure 10 with 2 supplements
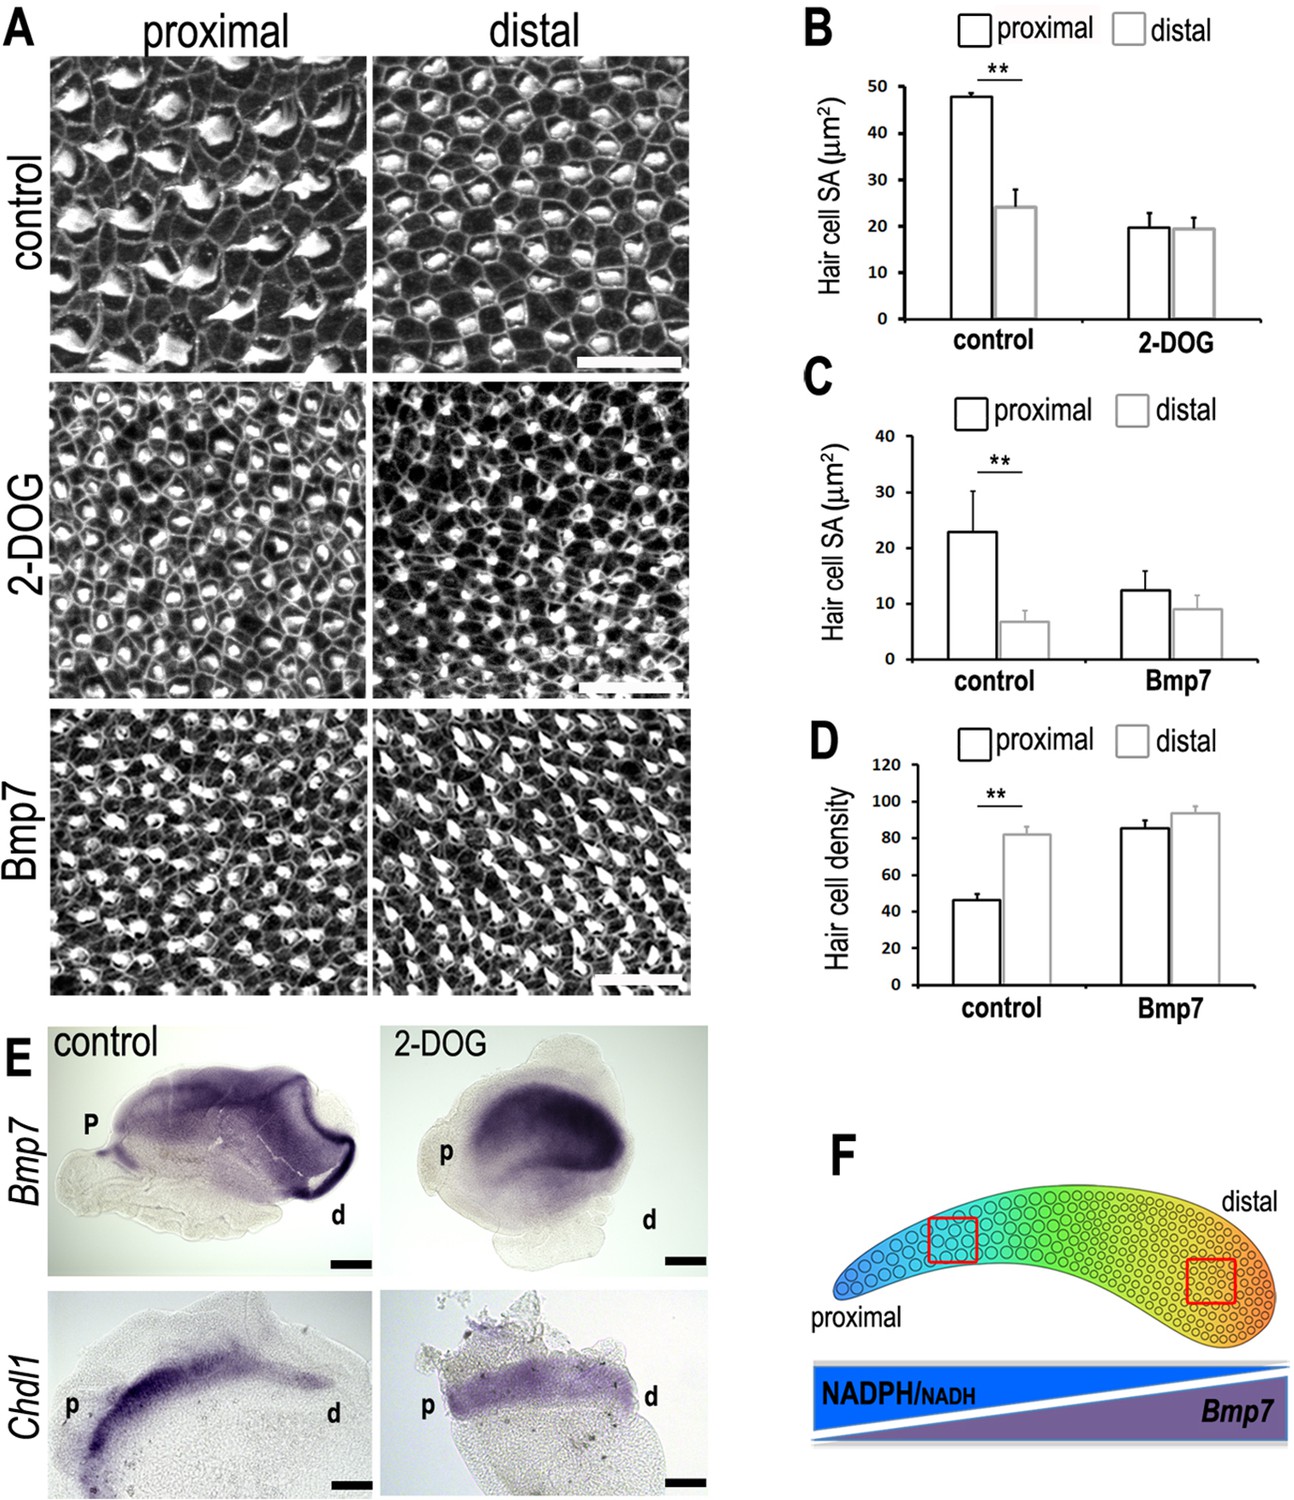
A tonotopic gradient in NAD(P)H producing glucose metabolism specifies hair cell (HC) positional identity along the basilar papilla (BP) by regulating gradients of Bmp7 and Chdl1.
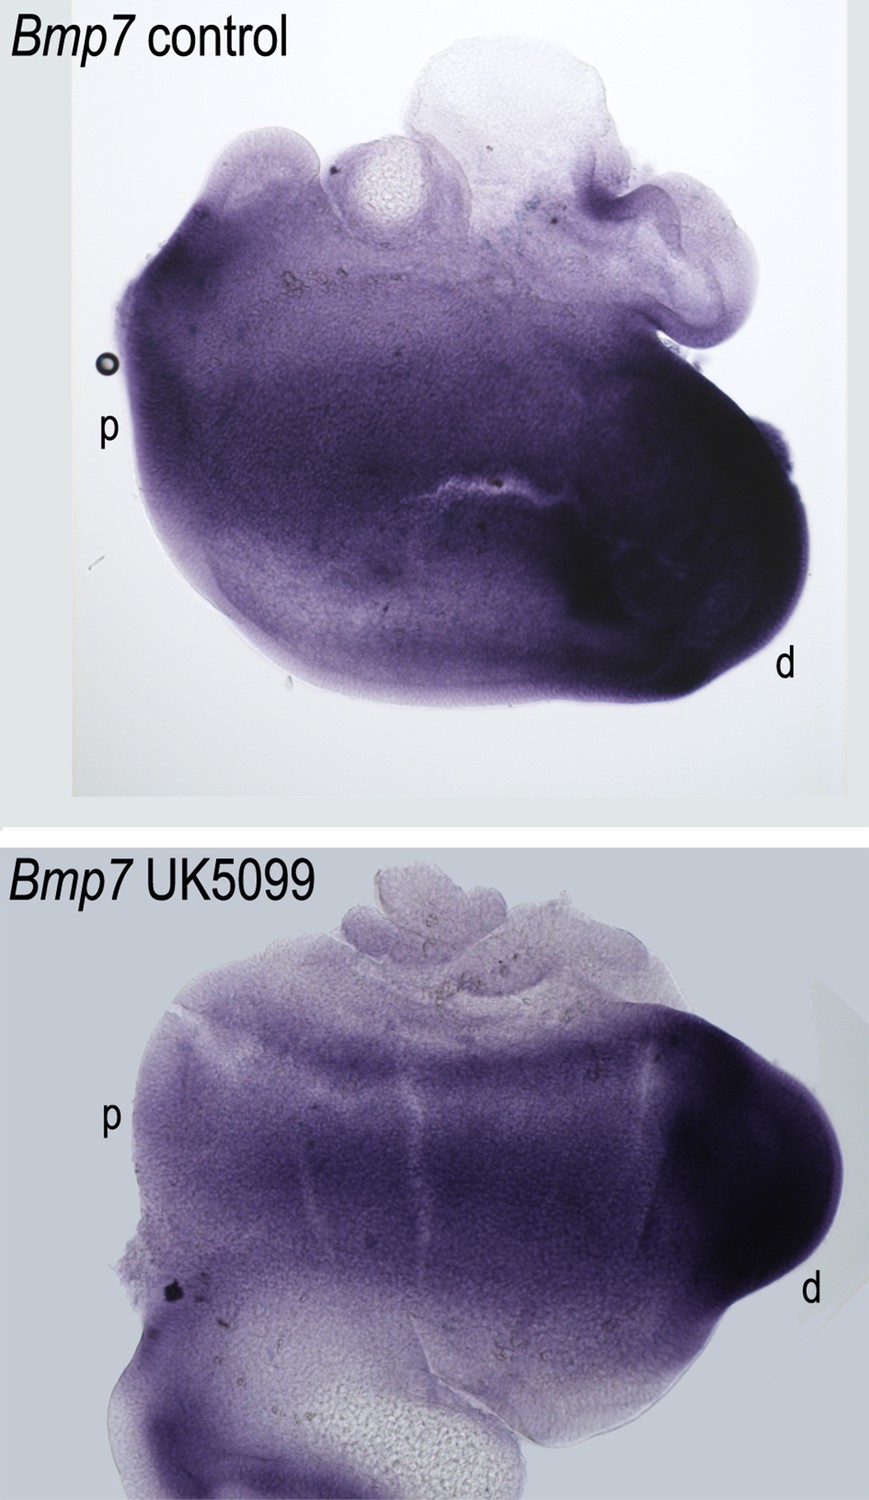
(A) Phalloidin staining at the surface of BP explants in the proximal and distal regions. Explants were established at E6.5 and incubated for 7 days in vitro in control medium or medium containing 2-deoxy-D-glucose (2-DOG) + sodium pyruvate (NaP) or Bmp7. (B, C) Treatment with 2-DOG- or Bmp7-induced HC morphologies consistent with a more distal phenotype in the proximal BP. HC lumenal surface area was determined using Phalloidin staining at the cuticular plate in 2500 μm2 areas. (D) Treatment with Bmp7 between E6.5 and E13.5 equivalent results in increased HC density in the proximal BP region. HC density was counted in proximal and distal BP regions using defines regions of interest (ROIs) of 10,000 μm2. (E) Treatment of explant cultures with 2-DOG + NaP from E6.5 for 72 hr in vitro disrupts the normal tonotopic expression of Bmp7 and its antagonist Chdl1. Images show in situ hybridisation for Bmp7 and Chdl1 in BP whole-mounts treated with 2-DOG + NaP from E6.5 for 72 hr in vitro. Images are representative of 6 biological replicates. (2-DOG) Controls: n = 6, 2-DOG: n = 6. Data mean ± standard error of the mean (SEM). **p < 0.01 two-way analysis of variance (ANOVA). (Bmp7) Controls: n = 11, Bmp7: n = 10. Data mean ± SEM. **p < 0.01 two-way ANOVA. Scale bars (A) control scale bar is 20 μm, DOG and Bmp7 are 50 μm. Scale bars for in situ data (E) are 10 μm. (F) Schematic of the chick BP, showing the graded differences in HC size and density along the tonotopic axis. The opposing gradients in Bmp7 activity and in cellular NAD(P)H/NADH (glycolysis) are indicated. Red boxes indicate regions of measurement for HC lumenal surface areas and cell density.
Figure 10—figure supplement 1
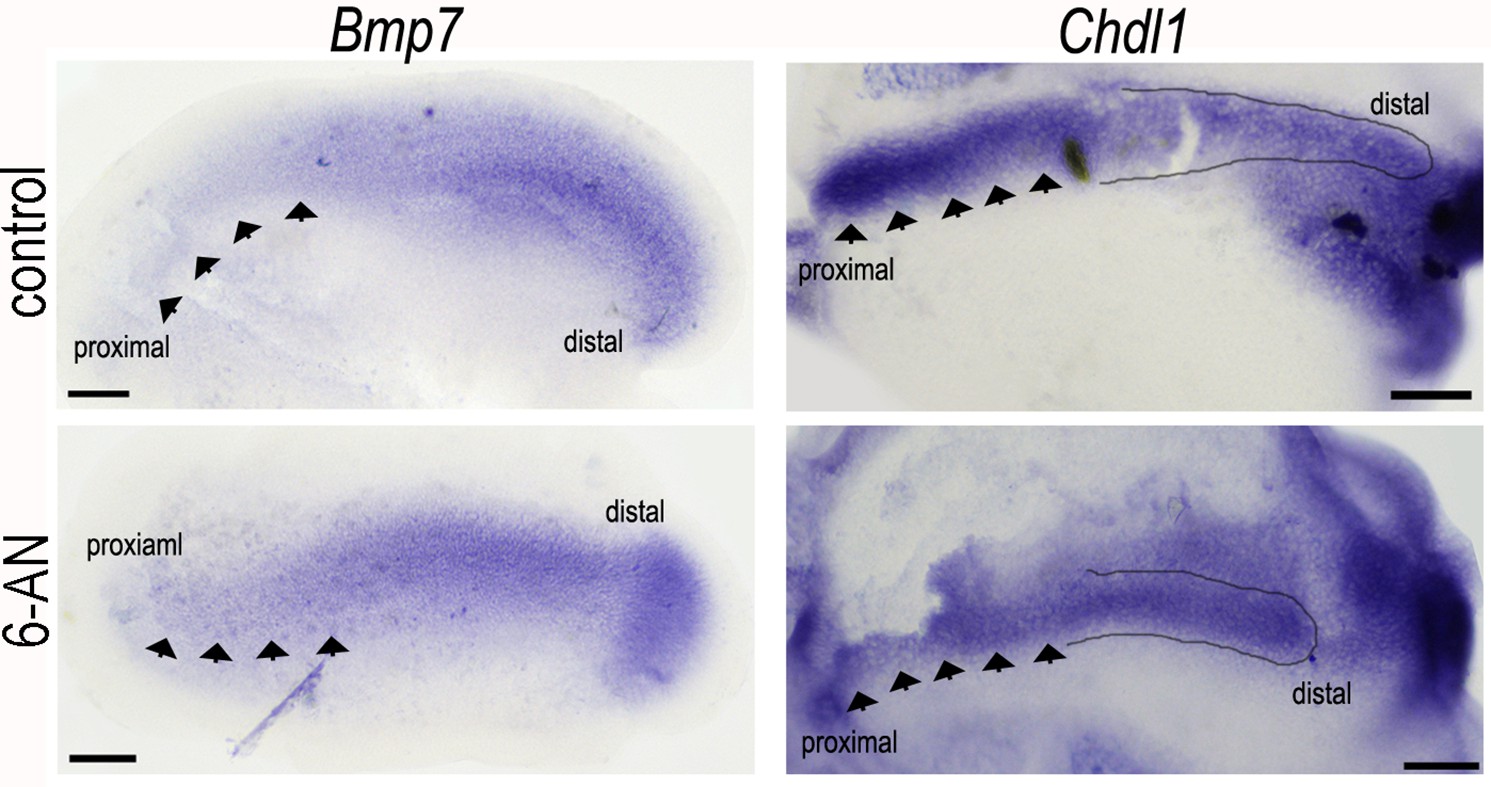
Blocking glucose flux into the pentose phosphate pathway (PPP) with 6-aminonicotinamide (6-AN) alters the normal expression of Bmp7 and Chdl1 in the developing basilar papilla (BP).
Treatment of explant cultures with 6-AN from E6.5 for 72 hr in vitro caused marked changes in the expression levels of Bmp7 and Chdl1. 6-AN induced a slight expansion of the Bmp7 gradient into the proximal region (indicated by black arrows) and a reduction in ChdlI at the proximal but not distal end (indicated by black arrows and outlined area). Images are representative of four independent biological replicates for each probe.
Figure 10—figure supplement 2
Blocking mitochondrial metabolism does not alter the gradient of Bmp7 expression along the developing basilar papilla (BP).
Treatment of explant cultures with UK5099 from E6.5 for 72 hr in vitro does not elicit marked changes in the normal expression of Bmp7 along the BP. Images show in situ hybridisation for Bmp7 in BP whole-mounts treated with UK5099 from E6.5 for 72 hr in vitro. Images are representative of five independent biological replicates.
Figure 11 with 1 supplement
Chdl1 restores tonotopic patterning along the basilar papilla (BP) when cytosolic glycolysis is blocked with 2-deoxy-D-glucose (2-DOG).
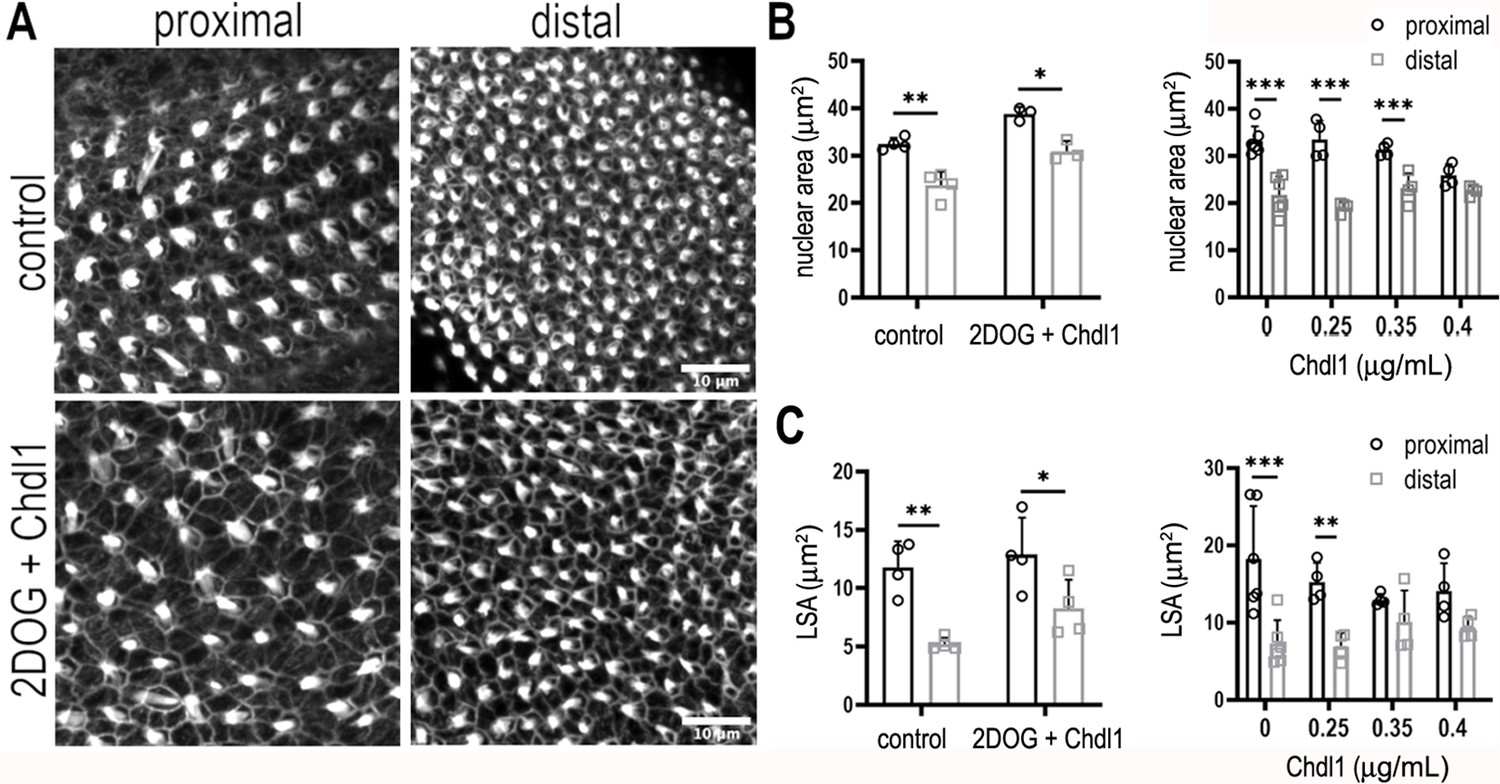
(A) Maximum z-projections of the epithelial surface in the proximal and distal regions of Phalloidin-stained BPs. Explants were established at E6.5 and maintained for 7 days in vitro in either control medium or that containing 2-DOG and Chdl1. Phalloidin staining indicates differences in hair cell (HC) lumenal surface area and gross bundle morphology between proximal and distal regions. The tonotopic gradient in HC lumenal surface was restored when explants were treated with 2-DOG in the presence of Chdl1. (B) The gradient in HC nuclear area was maintained along the proximal-to-distal axis when explants were treated with 2-DOG in the presence of Chdl1. Effects of Chdl1 were only apparent at concentrations of 0.35 μg/ml or above. (C) HC lumenal surface area measured from 2500 μm2 regions of interest (ROIs) in proximal (black) and distal (grey) BP regions. Effects of different Chdl1 concentrations on the HC luminal surface are indicated. Data are mean ± standard error of the mean (SEM). ** p < 0.01, *** p < 0.001 two-way analysis of variance (ANOVA). Dose–response data – Controls: n = 6, Chdl1 0.25 n = 4, 0.35 n = 4, 0.4 n = 4. Chdl1 + 2-DOG: Controls n = 6, Chdl1 + 2-DOG n = 4 biological replicates for HC lumenal surface areas and n = 3 for nuclear area. Scale bars are 10 μm.
Figure 11—figure supplement 1
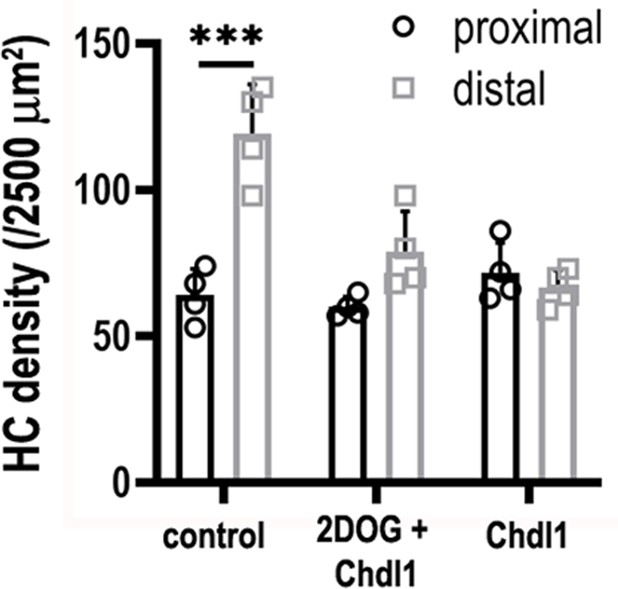
Treatment of explants with 2-deoxy-D-glucose (2-DOG) + Chdl1 partially rescues the pattern of hair cell (HC) density along the developing basilar papilla (BP).
HC density was quantified in 2500 μm2 regions of interest (ROIs) in proximal and distal regions. BP explants were established at E6.5 and maintained for 7 days in vitro in control conditions, or in medium containing 2-DOG + 0.4 μg/ml Chdl1 or 0.4 μg/ml Chdl1. Data are mean ± standard error of the mean (SEM) from four independent biological replicates. ***p < 0.001 two-way analysis of variance (ANOVA).
Additional files
-
Source data 1
Two-way repeated measures analysis of variance (ANOVA) results for hair cell (HC) nuclear area.
p-Values in the left-hand column indicate whether the proximal–distal differences in HC nuclear area was altered in inhibitor-treated explants compared to controls. The p-values in the interaction column indicate whether the proximal–distal differences in nuclear area changed after inhibitor treatment. YZ9 and Chdl1 + 2-deoxy-D-glucose (2-DOG) were the only treatments which did not produce a significant interaction, indicating preservation of the tonotopic gradient.
- https://cdn.elifesciences.org/articles/86233/elife-86233-data1-v2.xlsx
-
Source data 2
Two-way repeated measures analysis of variance (ANOVA) results for hair cell (HC) luminal surface area (SA).
p-Values in the left-hand column indicate whether the proximal–distal differences in HC luminal SA was altered in inhibitor-treated explants compared to controls. The p-values in the interaction column indicate whether the proximal–distal differences in luminal SA changed after treatment. YZ9 and Chdl1 + 2-deoxy-D-glucose (2-DOG) were the only treatments which did not produce a significant interaction, indicating preservation of the tonotopic gradient.
- https://cdn.elifesciences.org/articles/86233/elife-86233-data2-v2.xlsx
-
MDAR checklist
- https://cdn.elifesciences.org/articles/86233/elife-86233-mdarchecklist1-v2.pdf
Download links
A two-part list of links to download the article, or parts of the article, in various formats.
Downloads (link to download the article as PDF)
Open citations (links to open the citations from this article in various online reference manager services)
Cite this article (links to download the citations from this article in formats compatible with various reference manager tools)
Gradients of glucose metabolism regulate morphogen signalling required for specifying tonotopic organisation in the chicken cochlea
eLife 12:e86233.
https://doi.org/10.7554/eLife.86233


