Osteonecrosis in Gaucher disease in the era of multiple therapies: Biomarker set for risk stratification from a tertiary referral center
- Department of Internal Medicine, Yale University, United States
- Department of ENT, Head and Neck Surgery, Guilan University of Medical Sciences, Islamic Republic of Iran
- Department of Rheumatology, University of Toronto, Canada
- Department of Computer and Information Science, University of Massachusetts Dartmouth, United States
- Department of Radiology and Biomedical Imaging, Yale University, United States
- Translational Sciences, Sanofi, United States
Figures
Figure 1
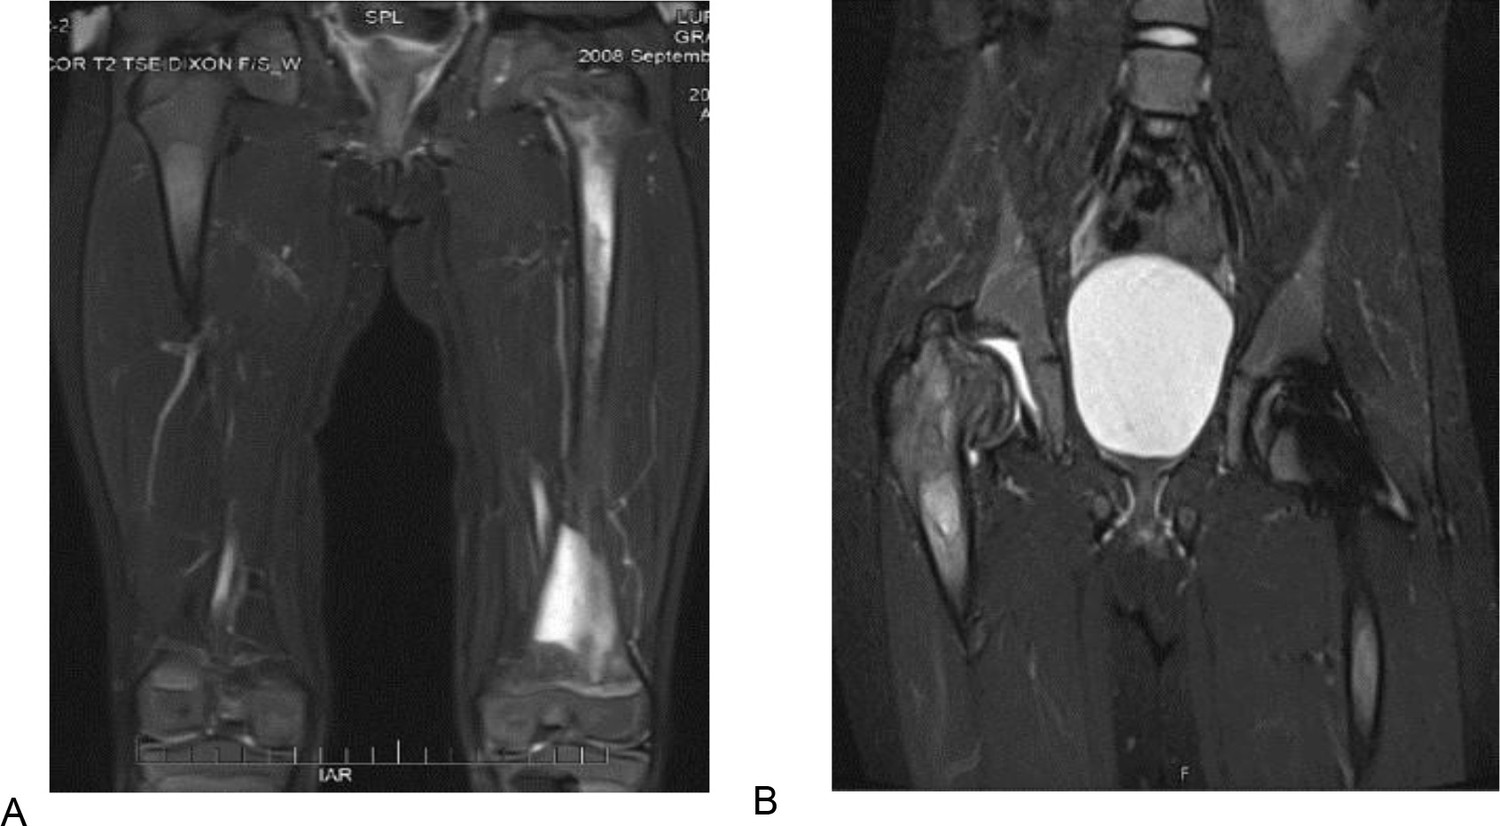
T2 weighted and STIR MR images of the patient 1 described in section Illustrative cases: the importance of awareness of AVN in pediatric patients.
(A) T2 weighted MR image of the femurs, showing diffuse bone marrow signal abnormality throughout the left femur with associated periostitis and subperiosteal fluid collection. (B) STIR MR image of the pelvis of the same patient 1 year after. (A) showing an expanding lesion of the greater trochanter, superiorly displacing fragments of bone and collapsed right hip joint.
Figure 2
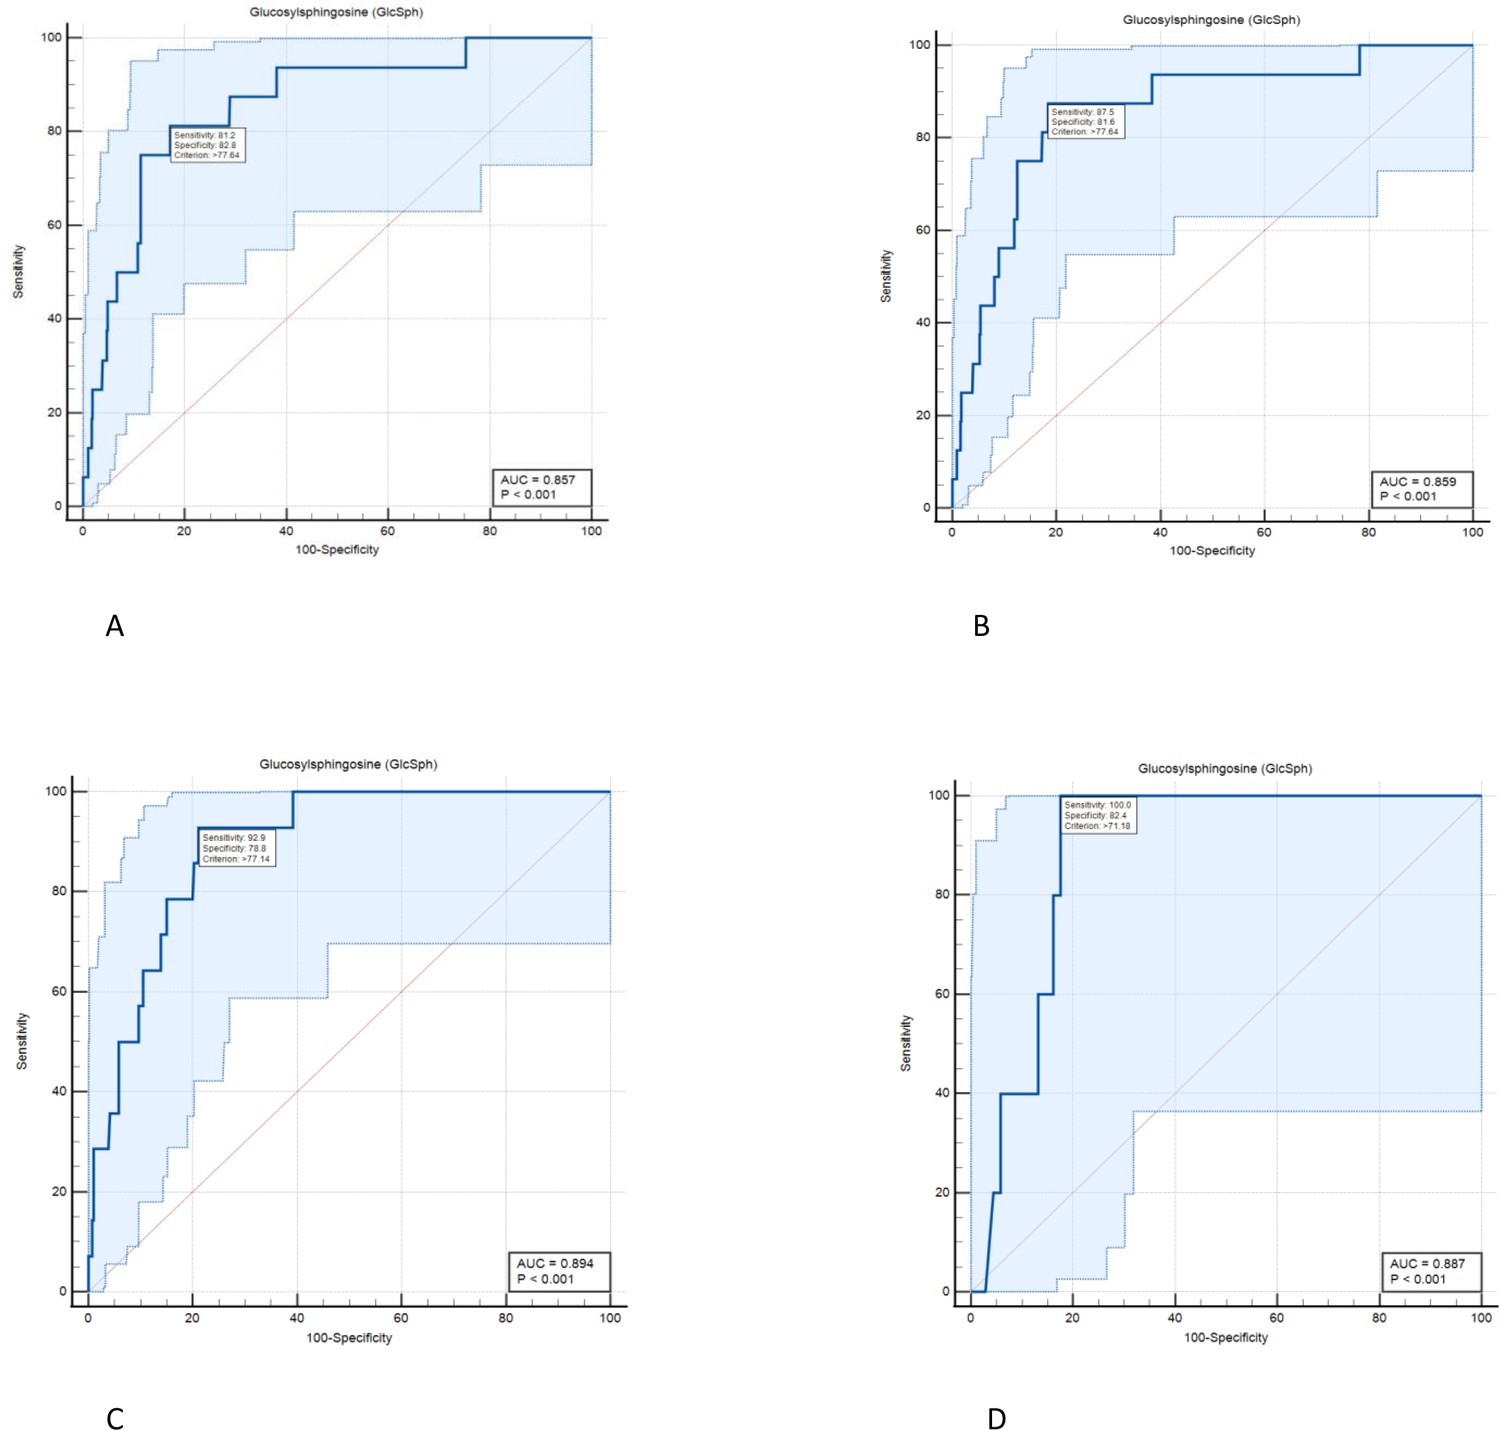
Diagnostic accuracy of serum level of glucosylsphingosine (GlcSph) for diagnosis of avascular osteonecrosis (AVN) on treatment: ROC curve analysis was done to assess the diagnostic accuracy cut-offs for GlcSph levels to predict the risk of AVN in Gaucher disease (GD) patients while receiving treatment.
(A) We found the value of the area under the ROC curve at GlcSph serum level of 77.64 ng/ml to be 0.857. GlcSph level of 77.64 ng/ml has sensitivity of 81.2% (95% CI, 54.4–96%) and specificity of 82.8% (95% CI, 80.7–84.8%) for association with AVN in entire GD patients receiving treatment. (B) As shown here, clinical significance of GlcSph levels is enhanced by considering their context of use regarding other risk factors. In patients with at least one of delineated risk factors in our study, that is compound heterozygosity for p.Asn409Ser, history of AVN prior to treatment or velaglucerase ERT, sensitivity for GlcSph level at 77.64 ng/ml increases to 87.5%. (C) In patients who harbor at least two of delineated risk factors in this study, GlcSph level of 77.14 ng/ml has sensitivity of 92.9% and specificity of 78.8% to rule in the probability of AVN on ERT. (D) In patients with all three risk factors delineated in the study, GlcSph level of 71.8 ng/ml is 100% sensitive to support the probability of AVN with specificity of 82.4%.
Figure 3
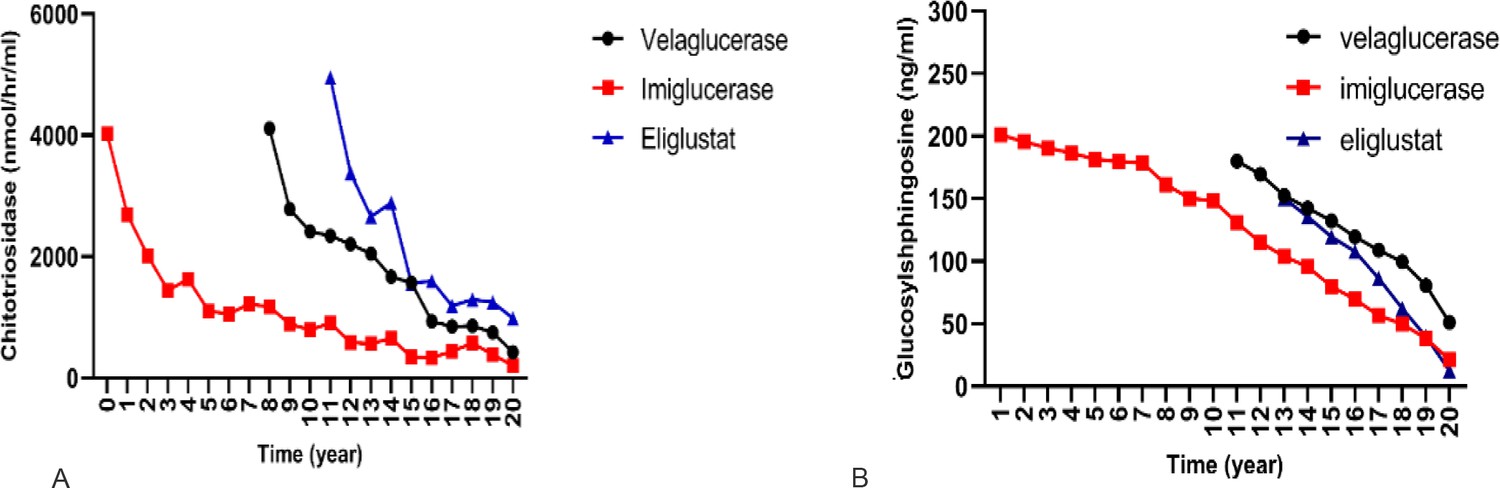
Effect of different therapies on chitotriosidase and glucosylsphingosine (GlcSph).
To compare the effect of each treatment on the changes of chitotriosidase and GlcSph, a linear mixed model with two-by-two Bonferroni comparisons was used.
(A) Effects of three drugs on chitotriosidase (nmol/hr/ml): pairwise comparisons showed velaglucerase is most effective in reducing chitotriosidase, followed by imiglucerase, followed by eliglustat. (B) Effects of three drugs on GlcSph (ng/ml): three drugs were significantly different for effect on GlcSph reduction (p<0.001). Eliglustat was the most effective in reducing serum GlcSph, followed by imiglucerase, followed by velaglucerase. Pairwise comparisons showed that the mean serum GlcSph in eliglustat-treated patients was significantly lower than the enzyme replacement therapies (ERTs). There was no significant difference in patients receiving velaglucerase vs imiglucerase (p=0.478).
Tables
Table 1
Demographic characteristics of the patients in this study.
Among 187 Gaucher disease patients followed longitudinally from 2001 to December 2021, a total of 155 patients met the inclusion criteria (explained in section Patients). Qualitative data were described by frequency and percentage and mean, and standard deviation (SD) were used for quantitative data. GBA1: glucosylceramidase beta 1, WBC: white blood cell, HgB: hemoglobin.
| All(N=155) | All(N=155) | ||
|---|---|---|---|
| Age at first visit (year) | Number of visits | ||
| Mean (SD) | 33.81 (18.74) | Mean (SD) | 6.1 (4.17) |
| Median (min, max) | 34 (2, 85) | Median (min, max) | 5.0 (1, 25) |
| Gender | Duration of follow-up (year) | ||
| Female:Male | 77 (49.7 %):78 (50.3%) | Mean (SD) | 14.0 (12) |
| Age at first symptoms (year) | Median (min, max) | 12(1,20) | |
| Mean (SD) | 20.02 (16.1) | Osteonecrosis while untreated | |
| Median (min, max) | 17.0 (5, 65) | Yes | 42 (27.1%) |
| Age at diagnosis (year) | No | 113 (72.9.%) | |
| Mean (SD) | 23.2 (17.3) | Spleen status | |
| Median (min, max) | 22.0 (5, 67) | Intact spleen | 123 (79.4%) |
| Gap to diagnosis in men (year) | Splenectomized | 32 (20.6%) | |
| Mean (SD) | 11.2 (12.6) | Type of treatment (year) | |
| Median (min, max) | 5.5 (0, 57) | Imiglucerase | 834 (60.3%) |
| Gap to diagnosis in women (year) | Eliglustat | 238 (17.2%) | |
| Mean (SD) | 10.3 (11.2) | Velaglucerase | 310 (22.4%) |
| median (min, max) | 7 (0, 40) | Clinical variables: mean (SD) | |
| Age at starting treatment (year) | Hermann score | 2.84 (1.6) | |
| Mean (SD) | 33 (18) | Severity score index | 7.62 (3.8) |
| Median (min, max) | 29 (2, 85) | Chitotriosidase (nmol/hr/ml) | 1106.15 (2801.3) |
| Gap to start treatment (year) | Glucosylsphingosine (ng/ml) | 58.12 (22.5) | |
| Mean (SD) | 10.5 (11) | Liver volume in cc | 1676.40 (186.4) |
| Median (min, max) | 9 (0, 57) | Liver multiples of normal | 0.94 (0.24) |
| GBA1 genotype | Spleen volume in cc | 480.9 (146.8) | |
| p.Asn409Ser/p.Asn409Ser | 78 (51%) | Spleen multiples of normal | 3.47 (2.95) |
| p.Asn409Ser/p.Leu483Pro | 20 (13.1%) | WBC ×103 u/l | 6.46 (3.48) |
| p.Asn409Ser/84GG | 14 (9.2%) | Hgb in g/dl | 13.92 (1.6) |
| p.Asn409Ser/IVS2+1 | 6 (3.9%) | Platelets ×103 u/l | 200.6 (87.1) |
| p.Asn409Ser/other | 27 (17.6%) | ||
| Other/other | 8 (5.2%) |
Table 2
Demographics and clinical features of patients with osteonecrosis on treatment at the proximity to avascular osteonecrosis (AVN) occurrence.
Modes of presentation of AVN shown as ‘painful’ indicating new onset of bone pain prompting early evaluation and ‘silent’ discovered on routine annual MRI and in retrospect, further history indicated patients had exacerbation of chronic pain that they treated symptomatically. * age range: C (child: age <18), YA (young adult: age 18–40), MA (middle-aged adult: age 40–60), OA (older adult: age >60). Shown are GBA1 genotype, age at AVN, type of treatment, history of AVN prior to treatment, serum biomarkers, liver/spleen volumes, and interval between diagnosis and initiation of treatment.
| AVNoccurrence | Gender | Genotype in GBA1 | Age at AVN (category)* | Type of ERT | History of AVN | Age at Diagnosis (category)* | Gap to diagnosis (years) | Age at ERT initiation (category)* | Gap to ERT initiation(year) | Type of AVN | Location | Hemoglobin(gm/dl) | Platelet(×1000 u/l) | Liver multiples of normal | Spleen multiples of normal | Chitotriosidase (nmol/hr/ml) | GlcSph(ng/ml) | |
|---|---|---|---|---|---|---|---|---|---|---|---|---|---|---|---|---|---|---|
| 1 | Patient no. 1 | M | p.Asn409Ser /84GG | MA | Velaglucerase | No | C | 1 | YA | 23 | Silent | Femur | 17.1 | 111 | 0.89 | 5.2 | 389.8 | 93.7 |
| 2 | Patient no. 2 | F | p.Asn409Ser /p.Ile442Thr | MA | Velaglucerase | Yes | C | 1 | YA | 11 | Painful | Femur | 15.6 | 252 | 0.93 | 1.8 | 743.5 | 158.3 |
| 3 | Patient no. 3 | M | p.Leu483Pro /p.Asn501Lys | OA | Velaglucerase | Yes | MA | 1 | OA | 25 | Silent | Femur | 14.0 | 313 | 0.80 | Splenectemized | 332.9 | 69.2 |
| 4 | Patient no. 4 | F | p.Asn409Ser /p.Leu483Pro | YA | Imiglucerase | No | C | 0.2 | C | 0.1 | Silent | Femur | 13.3 | 244 | 0.96 | 1.56 | 1962 | 89.8 |
| 5 | Patient no. 5 | F | p.Asn409Ser /p.Leu483Pro | C | Velaglucerase | Yes | C | 3 | C | 0.1 | Painful | Femur | 13.4 | 212 | 1.12 | 3.1 | 731.4 | 143.5 |
| 6 | Patient no. 6 | M | p.Asn409Ser /p.Asp166Glu | MA | Imiglucerase | Yes | MA | 5 | MA | 0.4 | Painful | Shoulder | 15.8 | 90 | 1.82 | 9.1 | 3.4 | 248.2 |
| 7 | Patient no. 7 | F | p.Asn409Ser /p.Arg502Ser | MA | Velaglucerase | No | YA | 10 | YA | 12 | Painful | Femur | 11.6 | 238 | 1.49 | 5.8 | 731 | 85 |
| 8 | Patient no. 7 | Second episode | OA | Imiglucerase | Yes | Painful | Hip | 12.5 | 235 | 1.41 | 5.4 | 733.6 | 145.7 | |||||
| 9 | Patient no. 8 | F | p.Asn409Ser /c.217delC | MA | Imiglucerase | Yes | YA | 0.1 | YA | 9 | Painful | Femur | 11.0 | 222 | 0.8 | Splenectemized | 523.4 | 61.9 |
| 10 | Patient no. 8 | Second episode | MA | Velaglucerase | Yes | Painful | Femur | 10.1 | 322 | 0.75 | 623.9 | 77.7 | ||||||
| 11 | Patient no. 9 | F | p.Asn409Ser /IVS2+1 | OA | Imiglucerase | Yes | C | 7 | YA | 23 | Painful | Hip | 13.3 | 474 | 0.73 | Splenectemized | 563.6 | 128.4 |
| 12 | Patient no. 10 | M | p.Asn409Ser /p.Leu483Pro | MA | Imiglucerase | Yes | YA | 4 | MA | 22 | Painful | Ankle | 16.7 | 299 | 0.88 | Splenectemized | 3123.4 | 223.8 |
| 13 | Patient no. 11 | M | p.Arg463Cys /p.255Tyr | MA | Velaglucerase | Yes | MA | 1 | MA | 5 | Painful | Hip | 14.5 | 253 | 0.91 | 1.6 | 1852.5 | 86.3 |
| 14 | Patient no. 12 | F | p.Asn409Ser /c.217delC | C | Velaglucerase | No | C | 3 | C | 1 | Painful | Femur | 11.5 | 124 | 1.38 | 7.7 | 4134.6 | 318.6 |
| 15 | Patient no. 13 | F | p.Asn409Ser /p.Asn409Ser | MA | Velaglucerase | No | YA | 0 | YA | 10 | Painful | Hand | 13.6 | 189 | 0.83 | 1.5 | 26.2 | 21.9 |
| 16 | Patient no. 14 | M | p.Asn409Ser /84GG | MA | Velaglucerase | Yes | C | 0 | YA | 12 | Painful | Navicular | 13.7 | 147 | 1.12 | 4.15 | 0 | 210.3 |
Table 3
Output of mixed-effects modeling.
To determine the clinical context in which avascular osteonecrosis (AVN) occurs in Gaucher disease (GD) patients while receiving enzyme replacement therapy (ERT). Eliglustat substrate reduction therapy (SRT) was not included in the model as there were no episodes of AVN on patients receiving this therapy at the time of analysis. A random intercept was chosen to account for the presence of different quantitative variables and the uniformity of sizes with different numbers for patients. (Further explanation in sections Statistical analysis and Delineating the determinants of AVN on treatment.)
| Fixed coefficients | ||||||||||
|---|---|---|---|---|---|---|---|---|---|---|
| Model term* | Coefficient | Std. error | t | Sig. | 95% Confidence interval | Exp(coefficient) | 95% Confidence Interval for Exp(coefficient) | |||
| Lower | Upper | Lower | Upper | |||||||
| Intercept | –9.392 | 1.2846 | –7.311 | <0.001 | –11.913 | –6.872 | 8.337E-5 | 6.705E-6 | 0.001 | |
| Rx: velaglucerase | 1.543 | 0.5235 | 2.948 | 0.003 | 0.516 | 2.570 | 4.680 | 1.676 | 13.071 | |
| Rx: imiglucerase | 0† | . | . | . | . | . | . | . | . | |
| AVN pre-Rx: Yes | 1.568 | 0.5894 | 2.659 | 0.008 | 0.411 | 2.724 | 4.795 | 1.508 | 15.243 | |
| AVN pre-Rx: No | 0† | . | . | . | . | . | . | . | . | |
| Gender: female | 0.859 | 0.5298 | 1.620 | 0.105 | –0.181 | 1.898 | 2.360 | 0.834 | 6.673 | |
| Gender: male | 0† | . | . | . | . | . | . | . | . | |
| Spleen status: Splenectomized | 0.754 | 0.5851 | 1.288 | 0.198 | –0.394 | 1.902 | 2.125 | 0.674 | 6.697 | |
| Spleen status: intact | 0† | . | . | . | . | . | . | . | . | |
| Genotype: other/other | 1.903 | 1.3717 | 1.387 | 0.166 | –0.789 | 4.594 | 6.705 | 0.454 | 98.919 | |
| Genotype: p.Asn409Ser/other | 2.309 | 0.9685 | 2.384 | 0.017 | 0.409 | 4.209 | 10.063 | 1.505 | 67.297 | |
| Genotype: p.Asn409Ser/p.Asn409Ser | 0† | . | . | . | . | . | . | . | . | |
| Serum level of glucosylsphingosine (ng/ml) | 0.012 | 0.0040 | 2.880 | 0.004 | 0.004 | 0.020 | 1.012 | 1.004 | 1.020 | |
-
Probability distribution: BinomialLink function: Logit.
-
*
Target: occurrence of AVN during treatment.
-
†
This coefficient is set to zero because it is redundant.
Table 4
Serum glucosylsphingosine (GlcSph) levels according to probabilities for avascular osteonecrosis (AVN) occurrence while on treatment with dual cut-offs to stratify patients for AVN risk.
Residual serum GlcSph levels were used to stratify risk of AVN among patients receiving treatment. Our findings permit AVN risk stratification based on GlcSph levels into three groups patients with low risk: GlcSph<21.7 ng/ml, patients with intermediate risk: 21.8ng/ml<GlcSph< 77.64 ng/ml, and patients at high risk: GlcSph>77.64 ng/ml.
| AVN on treatment | GlcSph (ng/ml) | Sensitivity(95% CI) | Specificity(95% CI) | +Likelihood ratio |
|---|---|---|---|---|
| Low risk | <21.7 | 100 (79.4–100) | 24.63 (22.3–27.0) | 1.33 |
| Intermediate risk | 21.8–77.6 | 89 (61.3–98) | 56.9 (54–62.5) | 2.36 |
| High risk | >77.64 | 81.25 (54.4–96) | 82.78 (80.7–84.8) | 4.72 |
Additional files
Download links
A two-part list of links to download the article, or parts of the article, in various formats.
Downloads (link to download the article as PDF)
Open citations (links to open the citations from this article in various online reference manager services)
Cite this article (links to download the citations from this article in formats compatible with various reference manager tools)
Osteonecrosis in Gaucher disease in the era of multiple therapies: Biomarker set for risk stratification from a tertiary referral center
eLife 12:e87537.
https://doi.org/10.7554/eLife.87537


