Photoreceptor disc incisures form as an adaptive mechanism ensuring the completion of disc enclosure
- Department of Ophthalmology, Duke University Medical Center, United States
- National Center for Microscopy and Imaging Research, School of Medicine, University of California, San Diego, United States
- Eugene Bell Center for Regenerative Biology and Tissue Engineering and National Xenopus Resource, United States
- Department of Pharmacology and Cancer Biology, Duke University Medical Center, United States
Figures
Figure 1

Schematic illustration of incisure arrangements.
(A) Cartoon illustrating the structure of rod photoreceptors in mice and frogs. In each species, the outer segment contains hundreds of disc membranes in a stack. For simplicity, the connecting cilium and the axoneme are not shown. Of note, rod outer segments in frogs are much wider than in mice. (B) Cartoon illustrating two different types of incisure arrangements in a stack of rod discs. Incisures are indentations of the disc rim that are longitudinally aligned across the disc stack. Mouse discs have a single incisure, whereas frog discs have multiple incisures.
Figure 2
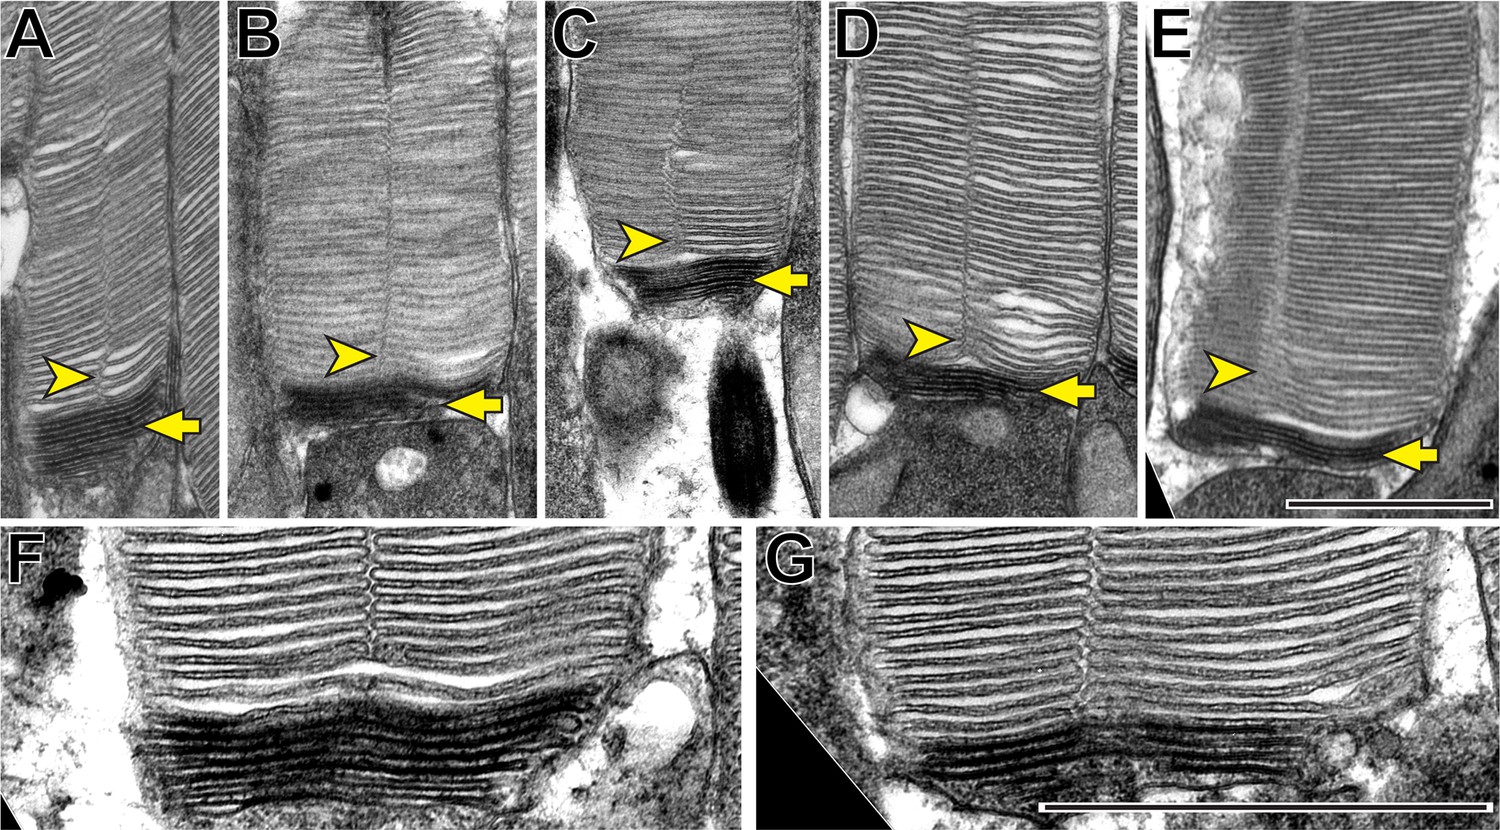
Incisures are observed only in fully enclosed discs of mouse rods.
(A–G) Representative TEM images of longitudinally sectioned WT mouse rods contrasted with a combination of tannic acid and uranyl acetate, which stains newly forming ‘open’ discs more intensely than mature enclosed discs. Yellow arrows point to darkly stained, unenclosed discs; yellow arrowheads point to longitudinally aligned incisures. Scale bars: 1 µm.
Figure 3 with 1 supplement
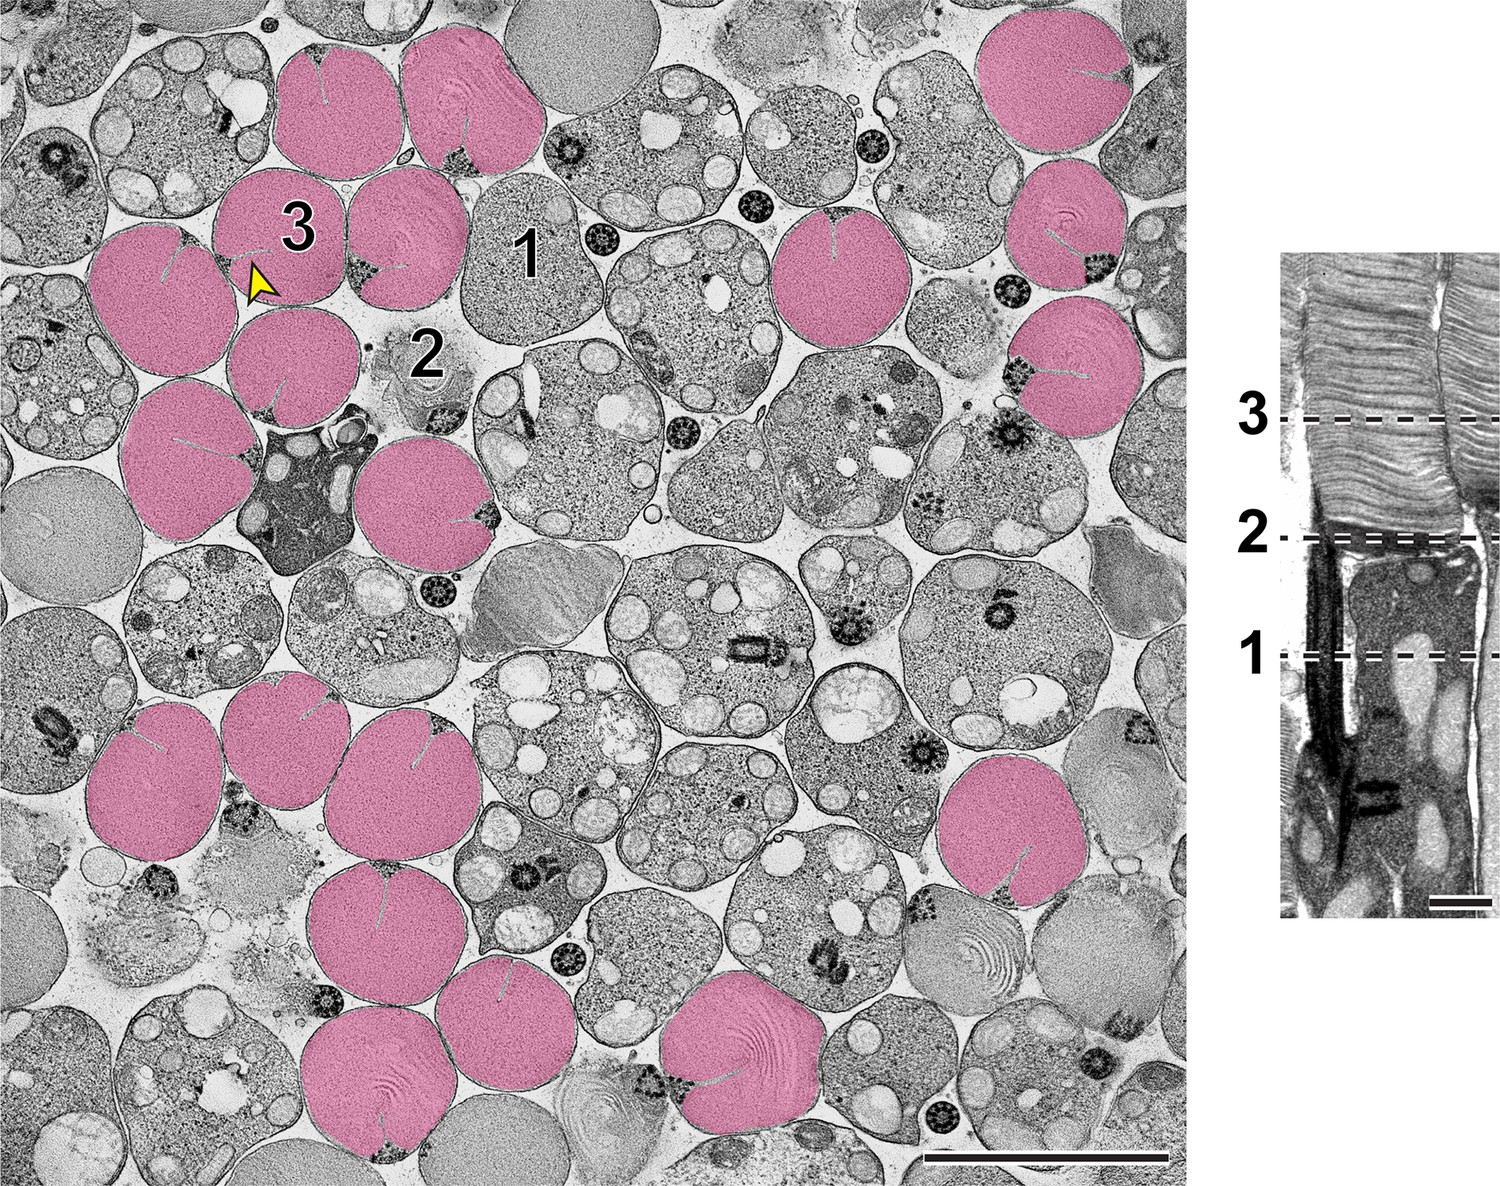
Representative z-section from a STEM tomogram of a 750-nm-thick tangential section of a WT mouse retina.
The retina was contrasted with tannic acid/uranyl acetate. Full tomogram is shown in Figure 3—video 1. Because individual rods in the mouse retina are not perfectly aligned, adjacent cells are sectioned at different compartments, including the inner segment (1), outer segment base (2) and mature outer segment (3). Shown on the right is an example of a longitudinally sectioned rod, in which these three locations are depicted by dashed lines. Surfaces of fully enclosed discs are pseudo-colored in magenta to highlight the structure of incisures. Yellow arrowhead points to an incisure in a fully enclosed disc. Tomogram pixel size is 3 nm; scale bars: 2.5 µm (left) or 0.5 µm (right).
Figure 3—video 1
Tomogram associated with Figure 3.
Field of view: 12.0 µm x 12.0 µm.
Figure 4 with 4 supplements

Disc incisures are observed in mature but not newly forming discs.
(A) Representative z-sections at the depths of 0 (left),+168 (middle) and +244 nm (right) from a reconstructed electron tomogram of a 750 nm-thick WT mouse retinal section. Full tomogram is shown in Figure 4—video 1. To guide the reader, the surfaces of newly forming discs are pseudo-colored in orange and a mature disc in magenta. Pseudo-coloring was used only in this example as it masks some fine morphological features of the images. (B) Representative z-sections at the depths of 0 (left),+107 (middle) and +343 nm (right) from the reconstructed electron tomogram shown in Figure 4—video 2. (C) Representative z-sections at the depths of 0 (left),+65 (middle) and +186 nm (right) from the reconstructed electron tomogram shown in Figure 4—video 3. (D) Representative z-sections at the depths of 0 (left),+19 (middle) and +208 nm from the reconstructed electron tomogram shown in Figure 4—video 4. Yellow asterisks indicate the ciliary axoneme; yellow arrows point to newly forming, unenclosed discs; yellow arrowheads point to incisures in fully enclosed discs. Tomogram pixel size is 4.2 nm (A) or 2.1 nm (B–D); scale bar: 0.5 µm.
Figure 4—video 1
Tomogram associated with Figure 4A.
Field of view: 1.91 µm x 1.91 µm.
Figure 4—video 2
Tomogram associated with Figure 4B.
Field of view: 1.91 µm x 1.91 µm.
Figure 4—video 3
Tomogram associated with Figure 4C.
Field of view: 1.91 µm x 1.91 µm.
Figure 4—video 4
Tomogram associated with Figure 4D.
Field of view: 1.91 µm x 1.91 µm.
Figure 5 with 1 supplement
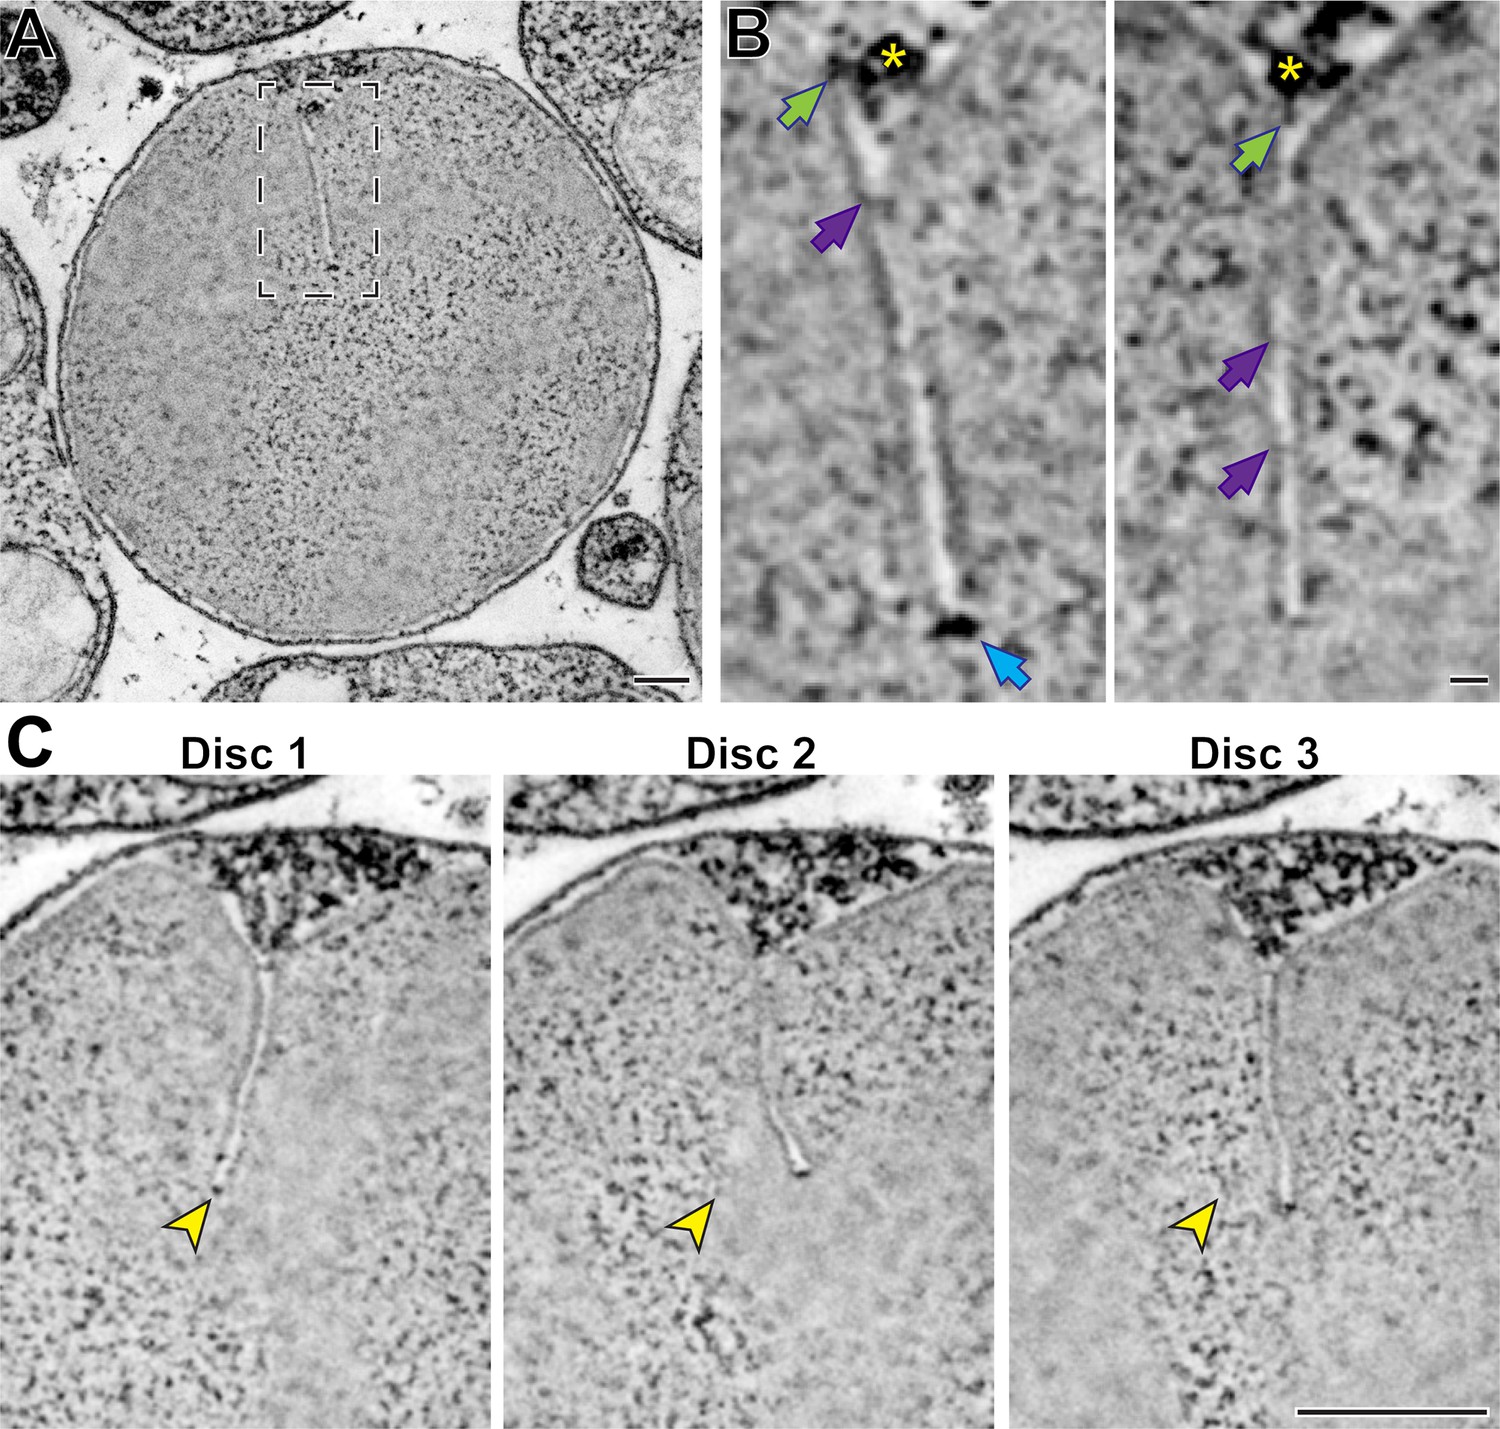
Ultrastructure of mature disc incisures.
(A) Representative z-section from a reconstructed electron tomogram of a 750-nm-thick WT mouse retinal section. Full tomogram of the boxed area is shown in Figure 5—video 1. (B) Representative maximum intensity projections of 3 (left) or 4 (right) z-sections highlighting various structures observed in a mature incisure. Green arrows point to structures spanning between microtubules and the disc rim; purple arrows point to connectors between apposing sides of the incisure; blue arrow points to the electron-dense structure at the incisure end. Yellow asterisk indicates the microtubule adjacent to the incisure. (C) Representative z-sections at the depths of 0 (Disc 1),+31.5 (Disc 2) and +63 nm (Disc 3) illustrating an imperfect alignment of incisures in three adjacent discs. Yellow arrowheads point to the incisure end in Disc 1 and the same x,y-coordinates in subsequent discs. Tomogram pixel size is 2.1 nm; scale bars: 0.25 µm (A, C) or 25 nm (B).
Figure 5—video 1
Tomogram associated with Figure 5.
Field of view: 0.63 µm x 0.84 µm.
Figure 6 with 1 supplement
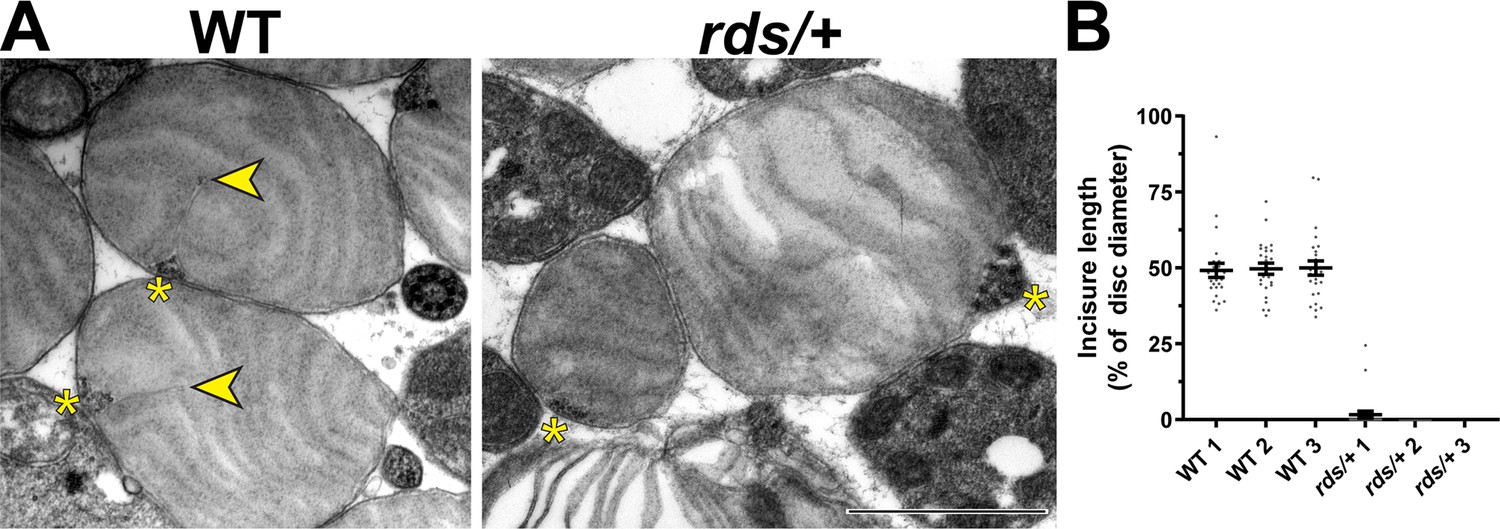
Reduction in peripherin-2 level prevents incisure formation in mouse rods.
(A) Representative TEM images of tangentially sectioned WT outer segments and rds/+ outer segments preserving their cylindrical shape. Yellow asterisks indicate the ciliary axoneme; yellow arrowheads point to incisures in WT discs. Scale bar: 1 µm. (B) Quantification of incisure length as a percent of the total disc diameter. Each data point represents a single outer segment. For each genotype, three mice were analyzed (labeled as 1, 2, and 3), with 25 outer segments analyzed in each mouse. Only 2 out of 75 analyzed rds/+ rods contained discernible incisures. Error bars represent mean ± s.d.
Figure 6—figure supplement 1
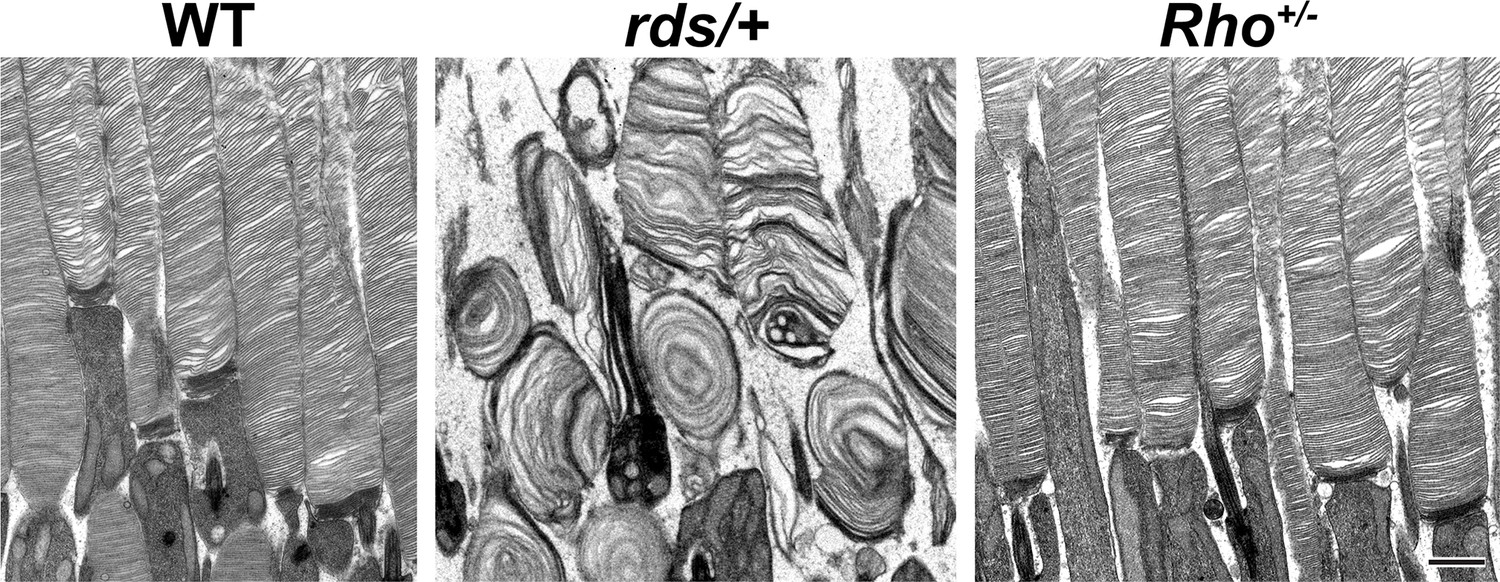
Reduction in the level of peripherin-2 but not rhodopsin causes gross abnormalities in outer segment structure.
Representative TEM images of longitudinally sectioned WT, rds/+ and Rho+/- mouse retinas. Scale bar: +/- µm.
Figure 7

Increase in relative peripherin-2 level produces long incisures of varying shape.
(A–C) Representative TEM images of tangentially sectioned Rho+/- mouse retinas. Incisures can be relatively straight and extend nearly the entire disc diameter (A) or be bifurcated or twisted (B). In some cells, incisures are associated with tubular structures (C). (D) Representative TEM image of a tangentially sectioned Rho-/- retina. While lacking discs, the outer segment cilium contains a large number of tubular structures. Yellow arrowheads point to incisure ends; orange arrows point to tubular structures. Scale bar: +/- µm.
Figure 8
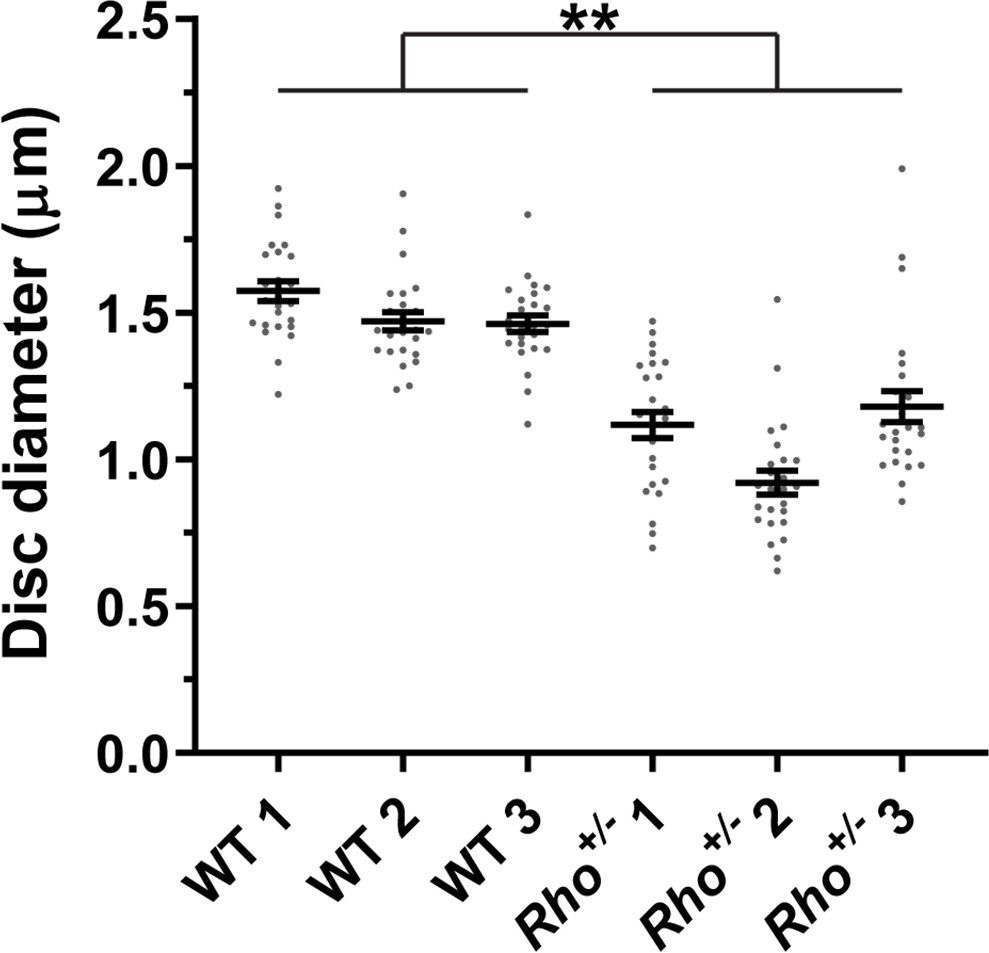
Quantification of disc diameters in WT and Rho+/- mouse rods.
Each data point represents a single outer segment. For each genotype, three mice were analyzed (labeled as 1, 2, and 3), with 25 outer segments analyzed in each mouse. Error bars represent mean ± s.d. Unpaired t-test was performed using the average disc diameter in each mouse to determine that the difference in diameters of WT and Rho+/- +/- was statistically significant (p=0.0075).
Figure 9 with 1 supplement
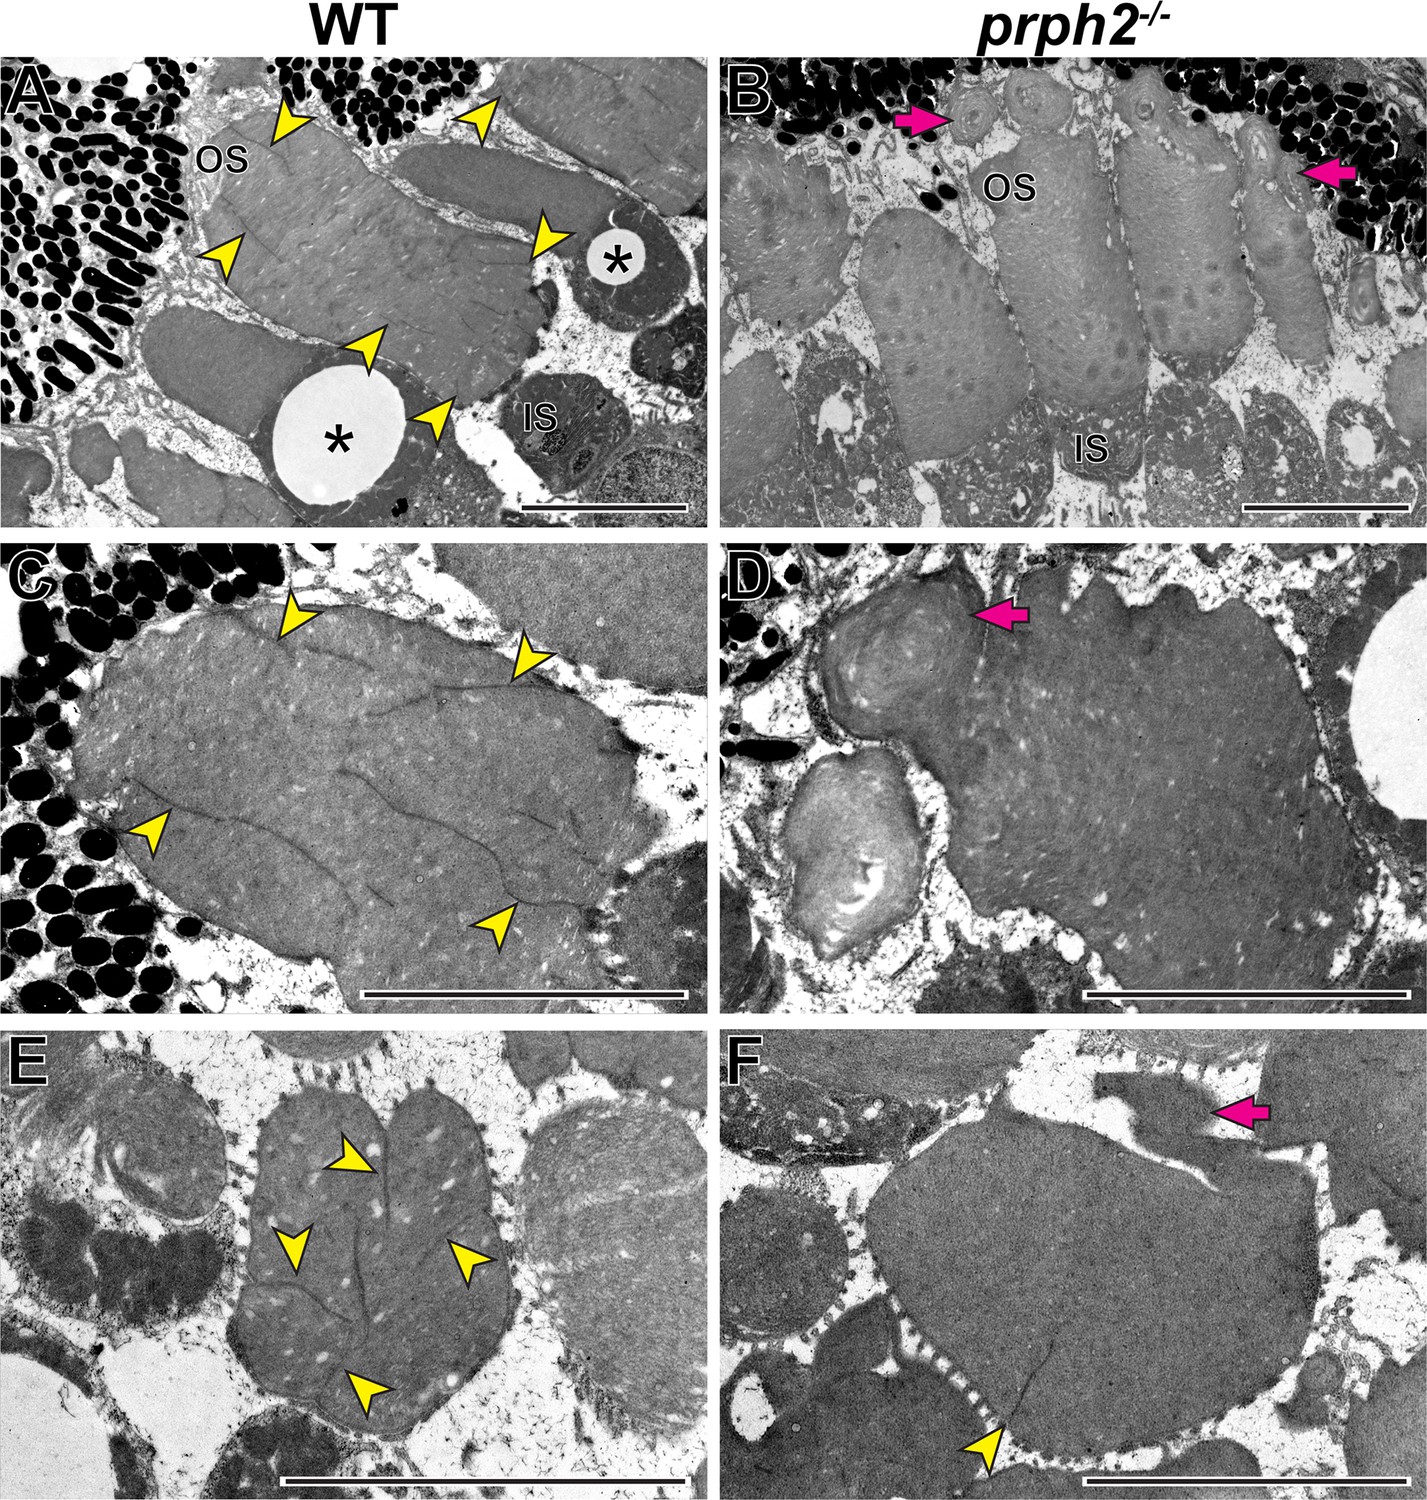
Loss of peripherin-2 in frogs (Xenopus tropicalis) prevents incisure formation.
(A–D) Representative TEM images of longitudinally sectioned WT and prph2-/- frog retinas. (E,F) Representative TEM images of tangentially sectioned WT and prph2-/- frog retinas. Magenta arrows point to defects in outer segment morphology; yellow arrowheads point to incisures; asterisks indicate cones, as evident by the presence of an oil droplet in their inner segments. OS: outer segment; IS: inner segment. Scale bars: 5 µm.
Figure 9—figure supplement 1
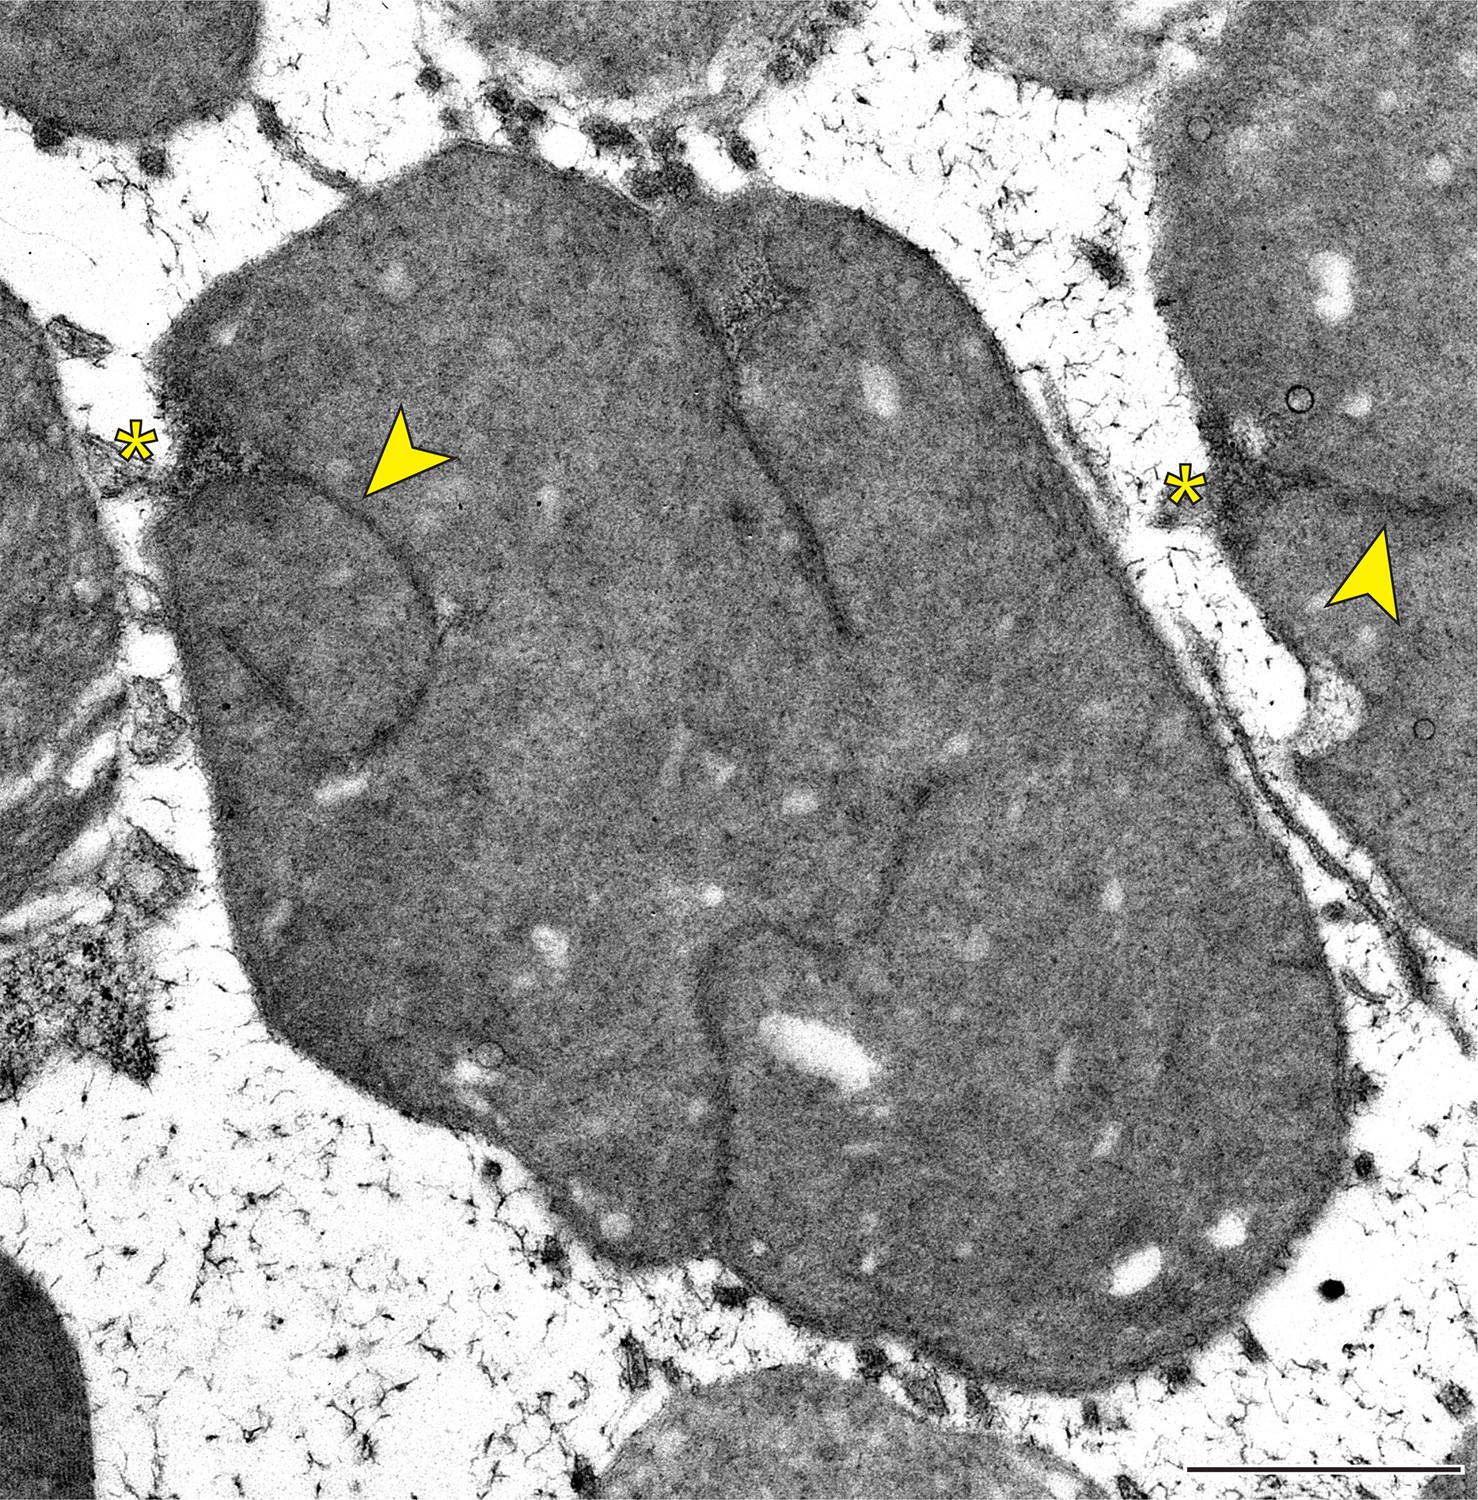
One incisure in frog rod discs is aligned with the ciliary axoneme.
Representative TEM image of a tangentially sectioned WT frog retina. Yellow asterisks indicate the ciliary axoneme; yellow arrowheads point to incisures. Scale bar: 1 µm.
Videos
Video 1
Reconstructed tomogram of a basal body nucleating the ciliary axoneme.
Shown is a 420 nm fragment of a 750-nm-thick retinal section. Tomogram pixel size is 0.7 nm. Field of view: 0.80 µm x 0.80 µm.
Tables
Table 1
Quantification of molar ratios between rhodopsin, peripherin-2 and ROM1 in mouse outer segments.
| Protein molar ratio* | WT | rds/+ | Rho+/- |
|---|---|---|---|
| Rhodopsin: peripherin-2 | 18.2±0.6 | 30.9±6.0 | 8.5±1.5 |
| Rhodopsin: ROM1 | 42.2±0.6 | 29.9±2.0 | 21.6±3.7 |
| Peripherin-2: ROM1 | 2.3±0.1 | 1.0±0.2 | 2.6±0.6 |
| Rhodopsin: (Peripherin-2 +ROM1) | 12.7±0.4 | 15.1±1.8 | 6.0±0.8 |
-
*
Values are shown as mean ± s.d. Three outer segment preparations from mice of each genotype were analyzed.
-
Table 1—source data 1
Quantification of molar ratios between rhodopsin, peripherin-2 and ROM1 in mouse outer segments – raw data.
- https://cdn.elifesciences.org/articles/89160/elife-89160-table1-data1-v2.xlsx
Table 2
Summary of quantitative parameters determined for mouse discs.
| Calculated parameter | WT | Rho+/- |
|---|---|---|
| Disc surface area (both lamellae) | 3.53 µm2 | 1.80 µm2 |
| Rhodopsin molecules per disc | 75,000 | 38,200 |
| Peripherin-2+ROM1 molecules per disc | 5,910 | 6,360 |
| Total rim length | 6.21 µm | N/A* |
| Measured incisure length as % of disc diameter | 50%† | N/A* |
| Theoretical incisure length as % of disc diameter | - | 155% |
-
*
Incisure and total rim lengths in Rho +/- discs cannot be readily measured due to incisure complexity.
-
†
The value is taken from the measurements shown in Figure 6.
Key resources table
| Reagent type (species) or resource | Designation | Source or reference | Identifiers | Additional information |
|---|---|---|---|---|
| strain, strain background (Mus musculus) | C57BL/6 J | Jackson Labs | Jax#:000664 | |
| genetic reagent (Mus musculus) | Rho | Lem et al., 1999 | MGI:2680822 | |
| genetic reagent (Mus musculus) | rds | van Nie et al., 1978 | MGI:1856523 | |
| strain, strain background (Xenopus tropicalis) | Nigerian | National Xenopus Resource | RRID:NXR_1018 | |
| genetic reagent (Xenopus tropicalis) | prph2 | This paper | RRID:NXR_3003 | National Xenopus Resource |
Additional files
Download links
A two-part list of links to download the article, or parts of the article, in various formats.
Downloads (link to download the article as PDF)
Open citations (links to open the citations from this article in various online reference manager services)
Cite this article (links to download the citations from this article in formats compatible with various reference manager tools)
Photoreceptor disc incisures form as an adaptive mechanism ensuring the completion of disc enclosure
eLife 12:e89160.
https://doi.org/10.7554/eLife.89160


