Higher ratio of plasma omega-6/omega-3 fatty acids is associated with greater risk of all-cause, cancer, and cardiovascular mortality: A population-based cohort study in UK Biobank
- Department of Epidemiology and Biostatistics, College of Public Health, University of Georgia, United States
- Department of Genetics, University of Georgia, United States
- Department of Biostatistics and Bioinformatics, Emory University, United States
- Department of Health Policy and Management, College of Public Health, University of Georgia, United States
- Division of Nutritional Sciences, Cornell University, United States
- Dell Pediatric Research Institute and the Depts of Pediatrics, of Nutrition, and of Chemistry, University of Texas at Austin, United States
- Institute of Bioinformatics, University of Georgia, United States
Figures
Figure 1
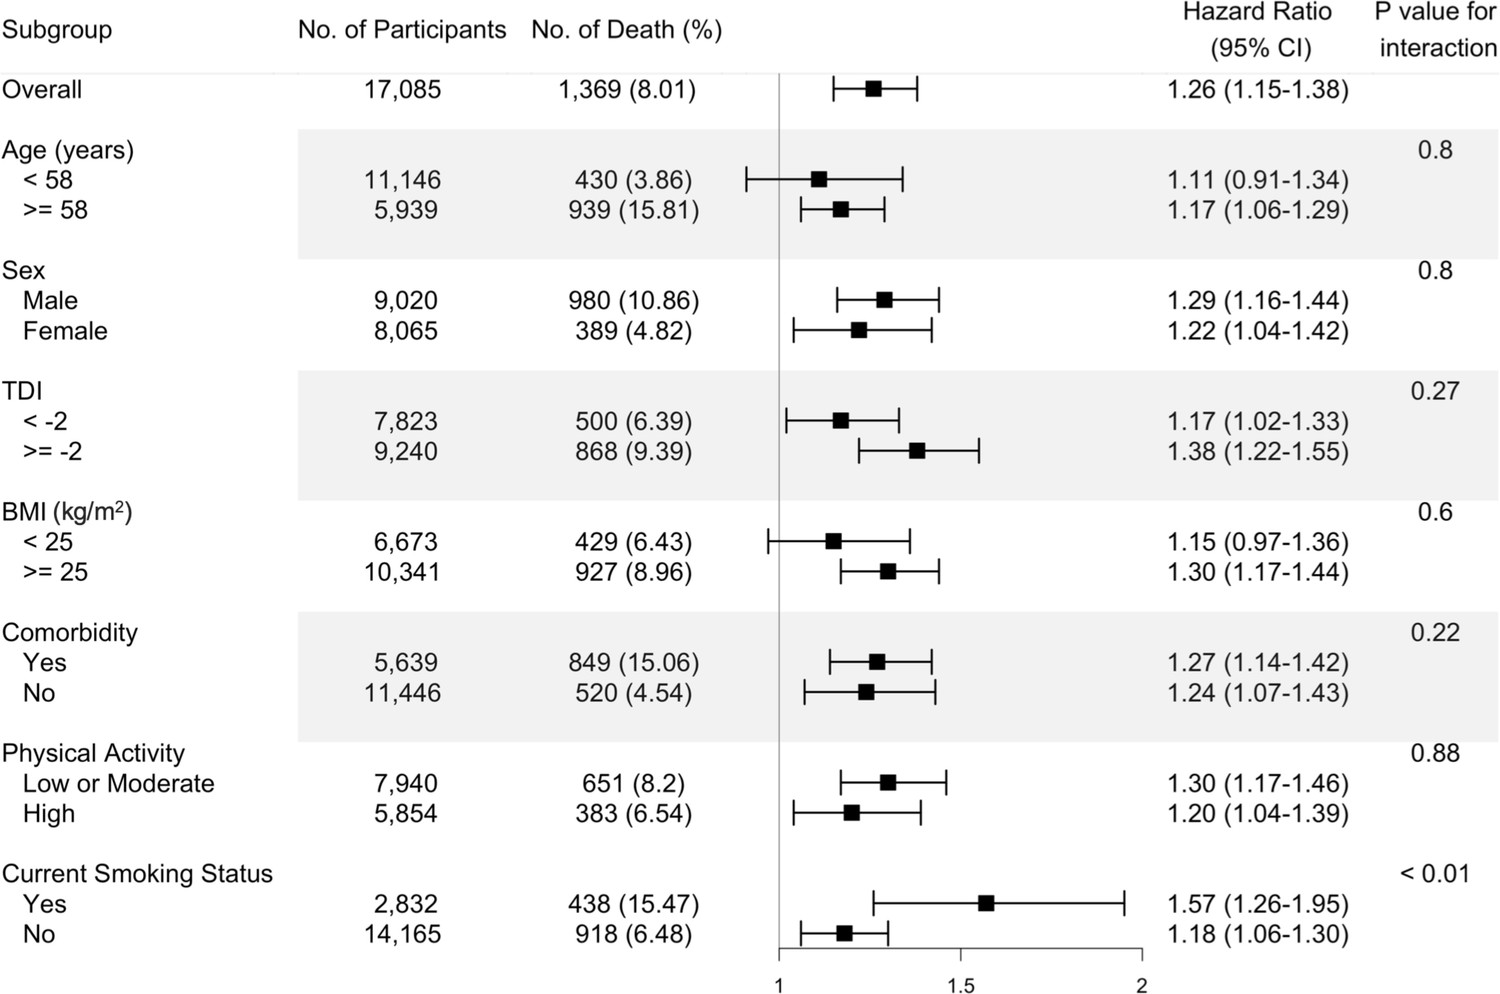
Risk estimates of all-cause mortality for the highest compared with the lowest quintile of the ratio of plasma omega-6 to omega-3 PUFAs, stratified by potential risk factors.
Results were adjusted for age (years; continuous), sex (male, female), race (White, Black, Asian, Others), Townsend deprivation index (continuous), assessment centre, BMI (kg/m2; continuous), smoking status (never, previous, current), alcohol intake status (never, previous, current), physical activity (low, moderate, high), and comorbidities (yes, no).
Figure 2
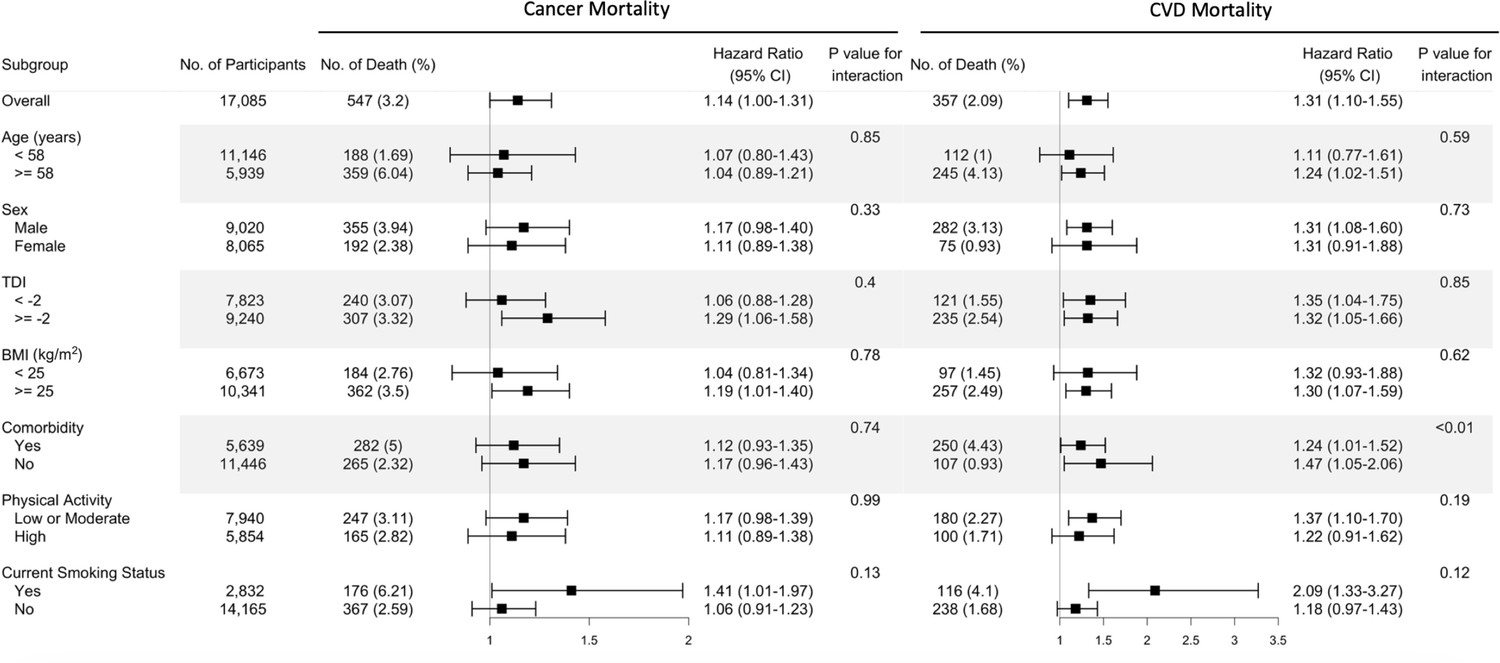
Risk estimates of cause-specific mortality for the highest compared with the lowest quintile of the ratio of plasma omega-6 to omega-3 PUFAs, stratified by potential risk factors.
Results were adjusted for age (years; continuous), sex (male, female), race (White, Black, Asian, Others), Townsend deprivation index (continuous), assessment centre, BMI (kg/m2; continuous), smoking status (never, previous, current), alcohol intake status (never, previous, current), physical activity (low, moderate, high), and comorbidities (yes, no).
Figure 3
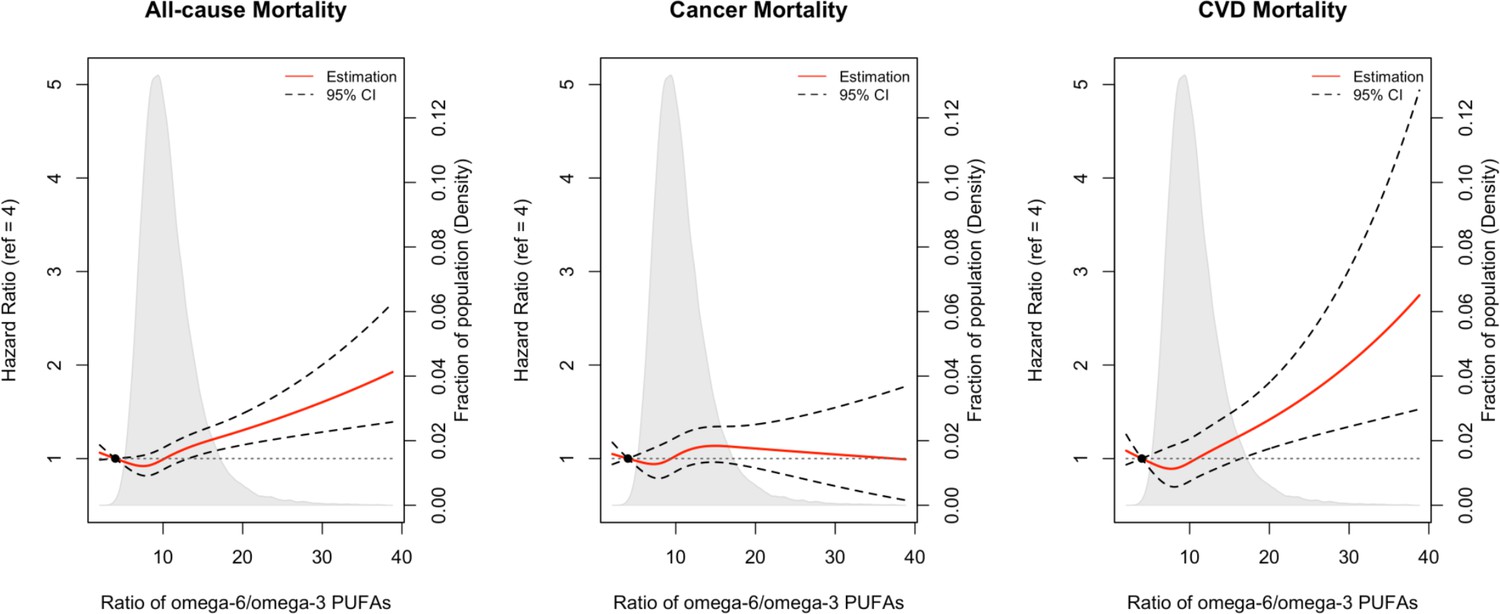
Associations of the ratio of omega-6/omega-3 PUFAs with all-cause and cause-specific mortality evaluated using restricted cubic splines.
Hazard ratios and omega ratios are presented in the vertical and horizontal axis, respectively. The best estimates and their confidence intervals are presented as solid red lines and dotted black lines, respectively. The ratio 4 was selected as a reference level, and the x-axis depicts the ratio from 0 to 40. Potential nonlinearity was identified for all-cause mortality (p<0.05) and CVD-caused mortality (p<0.05), but not for cancer-caused mortality (p=0.12). All HRs are adjusted for age (years; continuous), sex (male, female), race (White, Black, Asian, Others), Townsend deprivation index (continuous), assessment centre, BMI (kg/m2; continuous), smoking status (never, previous, current), alcohol intake status (never, previous, current), physical activity (low, moderate, high), and comorbidities (yes, no).
Tables
Table 1
Selected participaneline across quintiles of the plasma omega-6/omega-3 PUFAs ratio (n=85,425).
| Omega-6/omega-3 ratio quintiles | ||||||
|---|---|---|---|---|---|---|
| Characteristics* | 1 (median = 5.9)(n=17,085) | 2 (median = 7.6) (n=17,085) | 3 (median = 9.1) (n=17,085) | 4 (median = 11.0)(n=17,085) | 5 (median = 14.8) (n=17,085) | p |
| Age (years) | 58.6 (7.5) | 57.2 (7.9) | 55.7 (8.2) | 54.7 (8.3) | 53.4 (8.2) | <0.001† |
| Sex (male%) | 40.3 | 44.9 | 47.5 | 49.4 | 52.8 | <0.001‡ |
| Ethnicity(n%) | ||||||
| White | 15,375 (90.4%) | 15,486 (91.0%) | 15,494 (91.1%) | 15,467 (91.1%) | 15,420 (90.7%) | 0.384‡ |
| Black | 113 (0.7%) | 99 (0.6%) | 105 (0.6%) | 92 (0.5%) | 116 (0.7%) | |
| Asian | 673 (4.0%) | 639 (3.8%) | 663 (3.9%) | 653 (3.8%) | 659 (3.9%) | |
| Others | 844 (5.0%) | 786 (4.6%) | 742 (4.4%) | 773 (4.6%) | 810 (4.8%) | |
| Missing (n) | 80 | 75 | 81 | 100 | 80 | |
| BMI | 27.0 (4.4) | 27.3 (4.5) | 27.3 (4.7) | 27.3 (4.8) | 26.9 (5.0) | <0.001† |
| Missing (n) | 54 | 64 | 55 | 58 | 71 | |
| TDI | –1.6 (3.0) | –1.5 (3.0) | –1.4 (3.1) | –1.2 (3.1) | –0.9 (3.2) | <0.001† |
| Missing (n) | 17 | 24 | 24 | 28 | 22 | |
| Smoking status (n%) | <0.001‡ | |||||
| Never | 9426 (55.5%) | 9272 (54.6%) | 9424 (55.4%) | 9400 (55.3%) | 9214 (54.2%) | |
| Previous | 6402 (37.7%) | 6194 (36.5%) | 5772 (34.0%) | 5492 (32.3%) | 4951 (29.1%) | |
| Current | 1,162 (6.8%) | 1,526 (9.0%) | 1,802 (10.6%) | 2,104 (12.4%) | 2,832 (16.7%) | |
| Missing (n) | 95 | 93 | 87 | 89 | 88 | |
| Alcohol status (n%) | <0.001‡ | |||||
| Never | 631 (3.7%) | 676 (4.0%) | 655 (3.8%) | 755 (4.4%) | 974 (5.7%) | |
| Previous | 536 (3.1%) | 554 (3.2%) | 535 (3.1%) | 617 (3.6%) | 835 (4.9%) | |
| Current | 15,877 (93.2%) | 15,822 (92.8%) | 15,847 (93.0%) | 15,664 (91.9%) | 15,221 (89.4%) | |
| Missing (n) | 41 | 33 | 48 | 49 | 55 | |
| Physical activity (n%) | <0.001‡ | |||||
| Low | 2422 (17.4%) | 2602 (18.8%) | 2653 (19.1%) | 2617 (19.0%) | 2613 (18.9%) | |
| Moderate | 5879 (42.2%) | 5762 (41.5%) | 5712 (41.1%) | 5533 (40.1%) | 5327 (38.6%) | |
| High | 5635 (40.4%) | 5506 (39.7%) | 5545 (39.9%) | 5654 (41.0%) | 5854 (42.4%) | |
| Missing (n) | 3149 | 3215 | 3175 | 3281 | 3291 | |
| Fish oil supplementation (Yes%) | 48.1 | 37.7 | 29.6 | 22.7 | 15.5 | <0.001‡ |
| Missing (n) | 50 | 47 | 77 | 82 | 71 | |
| Comorbidity (Yes%) | 38.6 | 37.3 | 34.2 | 33.8 | 33.0 | <0.001‡ |
| Plasma omega-3 percentage | 6.6 (1.4) | 4.9 (0.5) | 4.2 (0.4) | 3.5 (0.3) | 2.6 (0.5) | <0.001† |
| Plasma omega-6 percentage | 36.3 (3.7) | 37.4 (3.4) | 38.2 (3.3) | 39.1 (3.2) | 40.2 (3.1) | <0.001† |
| Plasma DHA percentage | 2.8 (0.8) | 2.1 (0.5) | 1.9 (0.4) | 1.7 (0.4) | 1.5 (0.4) | <0.001† |
| Plasma LA percentage | 27.0 (3.3) | 28.4 (3.1) | 29.3 (3.0) | 30.2 (3.0) | 31.3 (3.1) | <0.001† |
| Dietary omega-3 percentage | 3.6 (1.8) | 3.2 (1.4) | 3.0 (1.3) | 2.9 (1.2) | 2.7 (1.0) | <0.001† |
| Missing (n) | 9355 | 9628 | 9857 | 9974 | 10,288 | |
| Dietary omaga-6 percentage | 16.8 (4.6) | 16.5 (4.4) | 16.6 (4.6) | 16.5 (4.7) | 16.5 (4.8) | <0.001† |
| Missing (n) | 9355 | 9628 | 9857 | 9974 | 10,288 | |
-
*
All variables measured at baseline are presented as mean (SD) unless otherwise specified.
-
†
From the ANOVA test for continuous variables.
-
‡
From the Pearson’s Chi-squared test for categorical variables.
Table 2
Associations* of the plasma omega-6/omega-3 PUFAs ratio with all-cause, cancer, and CVD mortality risk in the UK Biobank.
| Omega ratio variable forms | Causes of death | |||||||||
|---|---|---|---|---|---|---|---|---|---|---|
| All-cause | Cancer | Cardiovascular diseases | ||||||||
| Number of deaths | Partially adjusted associations† | Fully adjusted associations‡ | Number of deaths | Partially adjusted associations† | Fully adjusted associations‡ | Number of deaths | Partially adjusted associations† | Fully adjusted associations‡ | ||
| HR(95%CI) | HR(95%CI) | HR(95%CI) | HR(95%CI) | HR(95%CI) | HR(95%CI) | |||||
| Continuous | 6461 | 1.02 (1.02–1.03) | 1.02 (1.02–1.03) | 2794 | 1.02 (1.01–1.03) | 1.01 (1.00–1.02) | 1668 | 1.02 (1.01–1.03) | 1.02 (1.01–1.03) | |
| Quintiles (median) | ||||||||||
| 1 (5.9) | 1348 | 1.00 (ref) | 1.00 (ref) | 593 | 1.00 (ref) | 1.00 (ref) | 369 | 1.00 (ref) | 1.00 (ref) | |
| 2 (7.6) | 1256 | 1.00 (0.92–1.08) | 0.96 (0.88–1.05) | 563 | 1.02 (0.91–1.15) | 0.98 (0.86–1.12) | 315 | 0.90 (0.77–1.05) | 0.89 (0.75–1.06) | |
| 3 (9.1) | 1236 | 1.06 (0.98–1.15) | 1.01 (0.93–1.11) | 543 | 1.08 (0.96–1.21) | 0.99 (0.87–1.13) | 321 | 0.97 (0.84–1.13) | 0.97 (0.81–1.16) | |
| 4 (11.0) | 1252 | 1.14 (1.06–1.23) | 1.09 (1.00–1.19) | 548 | 1.16 (1.03–1.31) | 1.12 (0.98–1.27) | 306 | 0.98 (0.84–1.15) | 1.02 (0.86–1.22) | |
| 5 (14.8) | 1369 | 1.34 (1.24–1.45) | 1.26 (1.15–1.38) | 547 | 1.27 (1.12–1.43) | 1.14 (1.00–1.31) | 357 | 1.20 (1.04–1.40) | 1.31 (1.10–1.55) | |
| Ptrend | <0.001 | <0.001 | <0.001 | 0.011 | 0.002 | <0.001 | ||||
-
*
From Cox proportional hazards regression.
-
†
Adjusted for age (years; continuous), sex (male, female), race (White, Black, Asian, Others), Townsend deprivation index (continuous), assessment centre.
-
‡
Adjusted for age (years; continuous), sex (male, female), race (White, Black, Asian, Others), Townsend deprivation index (continuous), assessment centre, BMI (kg/m2; continuous), smoking status (never, previous, current), alcohol intake status (never, previous, current), physical activity (low, moderate, high), and comorbidities (yes, no).
-
CI, confidence interval; HR, hazards ratio; ref, reference.
Additional files
-
MDAR checklist
- https://cdn.elifesciences.org/articles/90132/elife-90132-mdarchecklist1-v1.pdf
-
Supplementary file 1
Supplementary Table 1 for literature review.
- https://cdn.elifesciences.org/articles/90132/elife-90132-supp1-v1.docx
-
Supplementary file 2
Supplementary Tables 2 - 14 for additional results.
- https://cdn.elifesciences.org/articles/90132/elife-90132-supp2-v1.docx
-
Supplementary file 3
Directed acyclic graph to explain mediation.
- https://cdn.elifesciences.org/articles/90132/elife-90132-supp3-v1.docx
-
Reporting standard 1
STROBE checklist.
- https://cdn.elifesciences.org/articles/90132/elife-90132-repstand1-v1.docx
Download links
A two-part list of links to download the article, or parts of the article, in various formats.
Downloads (link to download the article as PDF)
Open citations (links to open the citations from this article in various online reference manager services)
Cite this article (links to download the citations from this article in formats compatible with various reference manager tools)
Higher ratio of plasma omega-6/omega-3 fatty acids is associated with greater risk of all-cause, cancer, and cardiovascular mortality: A population-based cohort study in UK Biobank
eLife 12:RP90132.
https://doi.org/10.7554/eLife.90132.3


