Hypoxia-induced metabolic stress in retinal pigment epithelial cells is sufficient to induce photoreceptor degeneration
- The Scripps Research Institute, United States
- The Lowy Medical Research Institute, United States
- National Institutes of Health, United States
Abstract
Photoreceptors are the most numerous and metabolically demanding cells in the retina. Their primary nutrient source is the choriocapillaris, and both the choriocapillaris and photoreceptors require trophic and functional support from retinal pigment epithelium (RPE) cells. Defects in RPE, photoreceptors, and the choriocapillaris are characteristic of age-related macular degeneration (AMD), a common vision-threatening disease. RPE dysfunction or death is a primary event in AMD, but the combination(s) of cellular stresses that affect the function and survival of RPE are incompletely understood. Here, using mouse models in which hypoxia can be genetically triggered in RPE, we show that hypoxia-induced metabolic stress alone leads to photoreceptor atrophy. Glucose and lipid metabolism are radically altered in hypoxic RPE cells; these changes impact nutrient availability for the sensory retina and promote progressive photoreceptor degeneration. Understanding the molecular pathways that control these responses may provide important clues about AMD pathogenesis and inform future therapies.
https://doi.org/10.7554/eLife.14319.001eLife digest
Cells use a sugar called glucose as fuel to provide energy for many essential processes. The light-sensing cells in the eye, known as photoreceptors, need tremendous amounts of glucose, which they receive from the blood with the help of neighboring cells called retinal pigment epithelium (RPE) cells. Without a reliable supply of this sugar, the photoreceptors die and vision is lost.
As we age, we are at greater risk of vision loss because RPE cells become less efficient at transporting glucose and our blood vessels shrink so that the photoreceptors may become starved of glucose. To prevent age-related vision loss, we need new strategies to keep blood vessels and RPE cells healthy. However, it was not clear exactly how RPE cells supply photoreceptors with glucose, and what happens when blood supplies are reduced.
To address this question, Kurihara, Westenskow et al. used genetically modified mice to investigate how cells in the eye respond to starvation. The experiments show that when nutrients are scarce the RPE cells essentially panic, radically change their diet, and become greedy. That is to say that they double in size and begin burning fuel faster while also stockpiling extra sugar and fat for later use. In turn, the photoreceptors don’t get the energy they need and so they slowly stop working and die.
Kurihara, Westenskow et al. also show that there is a rapid change in the way in which sugar and fat are processed in the eye during starvation. Learning how to prevent these changes in patients with age-related vision loss could protect their photoreceptors from starvation and death. The next step following on from this research is to design drugs to improve the supply of glucose and nutrients to the photoreceptors by repairing aging blood vessels and/or preventing RPE cells from stockpiling glucose for themselves.
https://doi.org/10.7554/eLife.14319.002Introduction
Uninterrupted blood flow and an intricate and architecturally optimized network of photoreceptors, interneurons, glia, and epithelial cells are required for vision. The primary blood supply for photoreceptors is the choriocapillaris, an extraretinal fenestrated capillary bed. A layer of extracellular matrix proteins, Bruch’s membrane, lies adjacent to the choriocapillaris, and a monolayer of retinal pigment epithelium (RPE) cells divides Bruch’s membrane from the photoreceptors. The choriocapillaris, Bruch’s membrane, RPE, and photoreceptors function as one unit, with the choriocapillaris providing fuel for phototransduction, and Bruch’s membrane and RPE cells filtering and regulating the reciprocal exchange of oxygen, nutrients, biomolecules, and metabolic waste products between the circulation and retina. RPE also provide critical support for both photoreceptors and the choriocapillaris (Strauss, 2005) in large part by generating vascular endothelial growth factor (VEGF), a cytokine required for choriocapillaris development and maintenance (Kurihara et al., 2012; Le et al., 2010; Marneros et al., 2005; Saint-Geniez et al., 2009). Defects in this unit, including reduced choriocapillaris density, the presence of sub-RPE lipid-rich deposits, and RPE/photoreceptor dysfunction, are characteristic of age-related macular degeneration (AMD), a common vision-threatening disease whose prevalence is steadily increasing globally (Friedman et al., 2004; Wong et al., 2014). Several genetic and lifestyle risk factors have been identified but no cure exists (Bird, 2010).
While current evidence suggests that AMD is a spectrum of closely related multifactorial polygenic diseases (Bird et al., 2014), 10 year clinic-based data from the Age-Related Macular Degeneration Study (AREDS; n = 4757) showed that the major risk factors include aging, severity of drusen (sub-RPE deposits), and RPE abnormalities (Chew et al., 2014). Early AMD is characterized by pigmentary changes and appearance of drusen (Gass, 1973; Pauleikhoff et al., 1990; Sarks, 1976; Wang et al., 2010). In most cases early AMD proceeds towards geographic atrophy (or 'dry' AMD), a condition defined by focal photoreceptor, RPE, and choriocapillaris loss and thickening of Bruch’s membrane with immunomodulatory proteins and lipids (Bird, 2010; Jager et al., 2008; Zarbin, 1998). While the primary defect could occur in Bruch’s membrane (Pauleikhoff et al., 1990; Bressler et al., 1990; Mullins et al., 2011), the choriocapillaris (Ramrattan et al., 1994; Spraul et al., 1996; Spraul et al., 1999), or photoreceptors (Sarks, 1976; Hogan, 1972; Sarks et al., 1988), most evidence suggests that it probably occurs in RPE cells. Granules enriched with lipid-rich residues, lipofuscin, accumulate normally in aging RPE cells (Bazan et al., 1990), but abnormal accretions are observed in patients with geographic atrophy in a band directly surrounding the lesion (Feeney-Burns et al., 1984; Holz et al., 1999; von Ruckmann et al., 1997). Lipofuscin renders the RPE more sensitive to blue light-induced damage (Rozanowska et al., 1995; Schutt et al., 2000; Sparrow et al., 2000), impairs RPE functions (Holz et al., 1999; Finnemann et al., 2002; Lakkaraju et al., 2007; Sparrow et al., 1999), and is potentially toxic for RPE cells (Schutt et al., 2000). The downstream effects of RPE loss are catastrophic, and result in choriocapillaris attenuation and photoreceptor degeneration in late stage AMD patients (Bhutto and Lutty, 2012; Coscas et al., 2014; Jonas et al., 2014; Lee et al., 2013; Sohrab et al., 2012; McLeod et al., 2009).
Assuming, therefore, that the critical event of AMD pathogenesis occurs in RPE cells, how can the onset of the other early clinical manifestations of the disease in neighboring cells and structures be explained? There is a growing body of evidence that choroidal and retinal blood flow is reduced in AMD (Boltz et al., 2010; Remsch et al., 2000). We hypothesize that hypoxia, a natural consequence of aging microenvironments (that is exacerbated by obesity and smoking) (Blasiak et al., 2014; Chiu and Taylor, 2011; Morgado et al., 1994; Sagone et al., 1973), in RPE cells may be a central AMD risk factor based on the following lines of evidence: (a) RPE provide critical vasculotrophic support required for photoreceptor function (Kurihara et al., 2012); (b) Hypoxia alters lipid handling in other cell-types (Glunde et al., 2008; Santos et al., 2012; Semenza, 2009); (c) at least 40% of lipids in drusen are secreted by RPE (Cao et al., 2013); (d) the RPE secretome is sensitive to stress (Wang et al., 2010); and (e) in drusen rich zones of AMD patient eyes, vascular density is significantly reduced (Mullins et al., 2011). Therefore, hypoxia-mediated changes to the RPE lipidome and secretome could enhance lipofuscin accumulation and induce Bruch’s Membrane lipidization and thickening, thereby exacerbating RPE dysfunction, choriocapillaris drop-out, and photoreceptor dysfunction. This vicious cycle of events could accelerate progression of AMD.
Hypoxia-inducible factor alpha subunits (HIF-αs) are the key transcription factors that mediate responses to hypoxia. Under normal conditions HIF-αs are constitutively expressed and targeted by von Hippel-Lindau protein (VHL) for ubiquitination and proteasomal degradation. VHL is inactivated at low oxygen tensions; this allows HIF-αs to translocate to the nucleus and activate a host of angiogenesis, glucose metabolism, erythropoiesis, and inflammation genes (Semenza, 2011). In this study we directly or indirectly hyperactivated HIF-αs in RPE by genetically perturbing components of the VHL/HIF/VEGF pathway using inducible and conditional gene ablation techniques. These manipulations altered lipid handling and glucose consumption of RPE cells, induced gross morphometric changes in RPE, reduced nutrient availability for the sensory retina, and promoted progressive photoreceptor atrophy. Understanding the effects of hypoxia on RPE metabolism, and learning how to control these effects, may provide insights for developing novel therapeutic strategies to treat retinal degenerative diseases.
Results
Choriocapillaris attenuation induces hypoxia in RPE and promotes photoreceptor degeneration
Based on the hypothesis that choriocapillaris attenuation and prolonged hypoxia in RPE cells induces photoreceptor death/dysfunction, we set out to catalog the temporal and spatial manifestations of hypoxia in retinas of mice with severe choriocapillaris deficits (VMD2-Cre;Vegfafl/fl) and correlate these manifestations with any corresponding anatomical and functional changes in photoreceptors. Transgenic mice harboring human vitelliform macular dystrophy-2 promoter-directed cre (VMD2-Cre) (Le et al., 2008) were used to ablate Vegfa; severe choriocapillaris vasoconstriction is observed in adult Vegfa-cKO mice three days post induction (dpi) (Kurihara et al., 2012). The first signs of RPE hypoxia, including nuclear HIF immunoreactivity (Figure 1A), accumulation of the hypoxic probe pimonidazole in RPE (Figure 1A&B; white arrows), and activation of a known panel of hypoxia-inducible target genes, were observed six months post induction (mpi) in the Vegfa mutants (Figure 1—figure supplement 1&2). However, we cannot exclude the possibility that low-grade hypoxia may occur in RPE or other retinal cells earlier at subthreshold levels of detection. Hypoxia in RPE induced several defects including severely distended basal infoldings, accumulation of lipid droplets within RPE cells (Figure 1C; yellow arrows), RPE cell hypertrophy (Figure 1D), and dramatic and progressive thickening of Bruch’s membrane beginning at nine months post induction (Figure 1C red arrows; Figure 1E pseudo-colored blue). At 11 months post induction we also detected pigmentary abnormalities in fundus images (Figure 2A) and thinning of the photoreceptor cell layer (Figure 2B; red line) characteristic of photoreceptor degeneration. While RPE defects took months to manifest, defects in cone-driven pathways occurred within seven days of Vegfa ablation (Kurihara et al., 2012) and do not recover by 11 months post induction (Figure 2C and D, photopic). Surprisingly, rod-driven pathway defects were not observed until 11 months post ablation (Figure 2C and D, scotopic), suggesting that, for reasons that are unclear, rod photoreceptors are less sensitive to oxygen and nutrient deprivation than cones are.
Figure 1 with 2 supplements see all
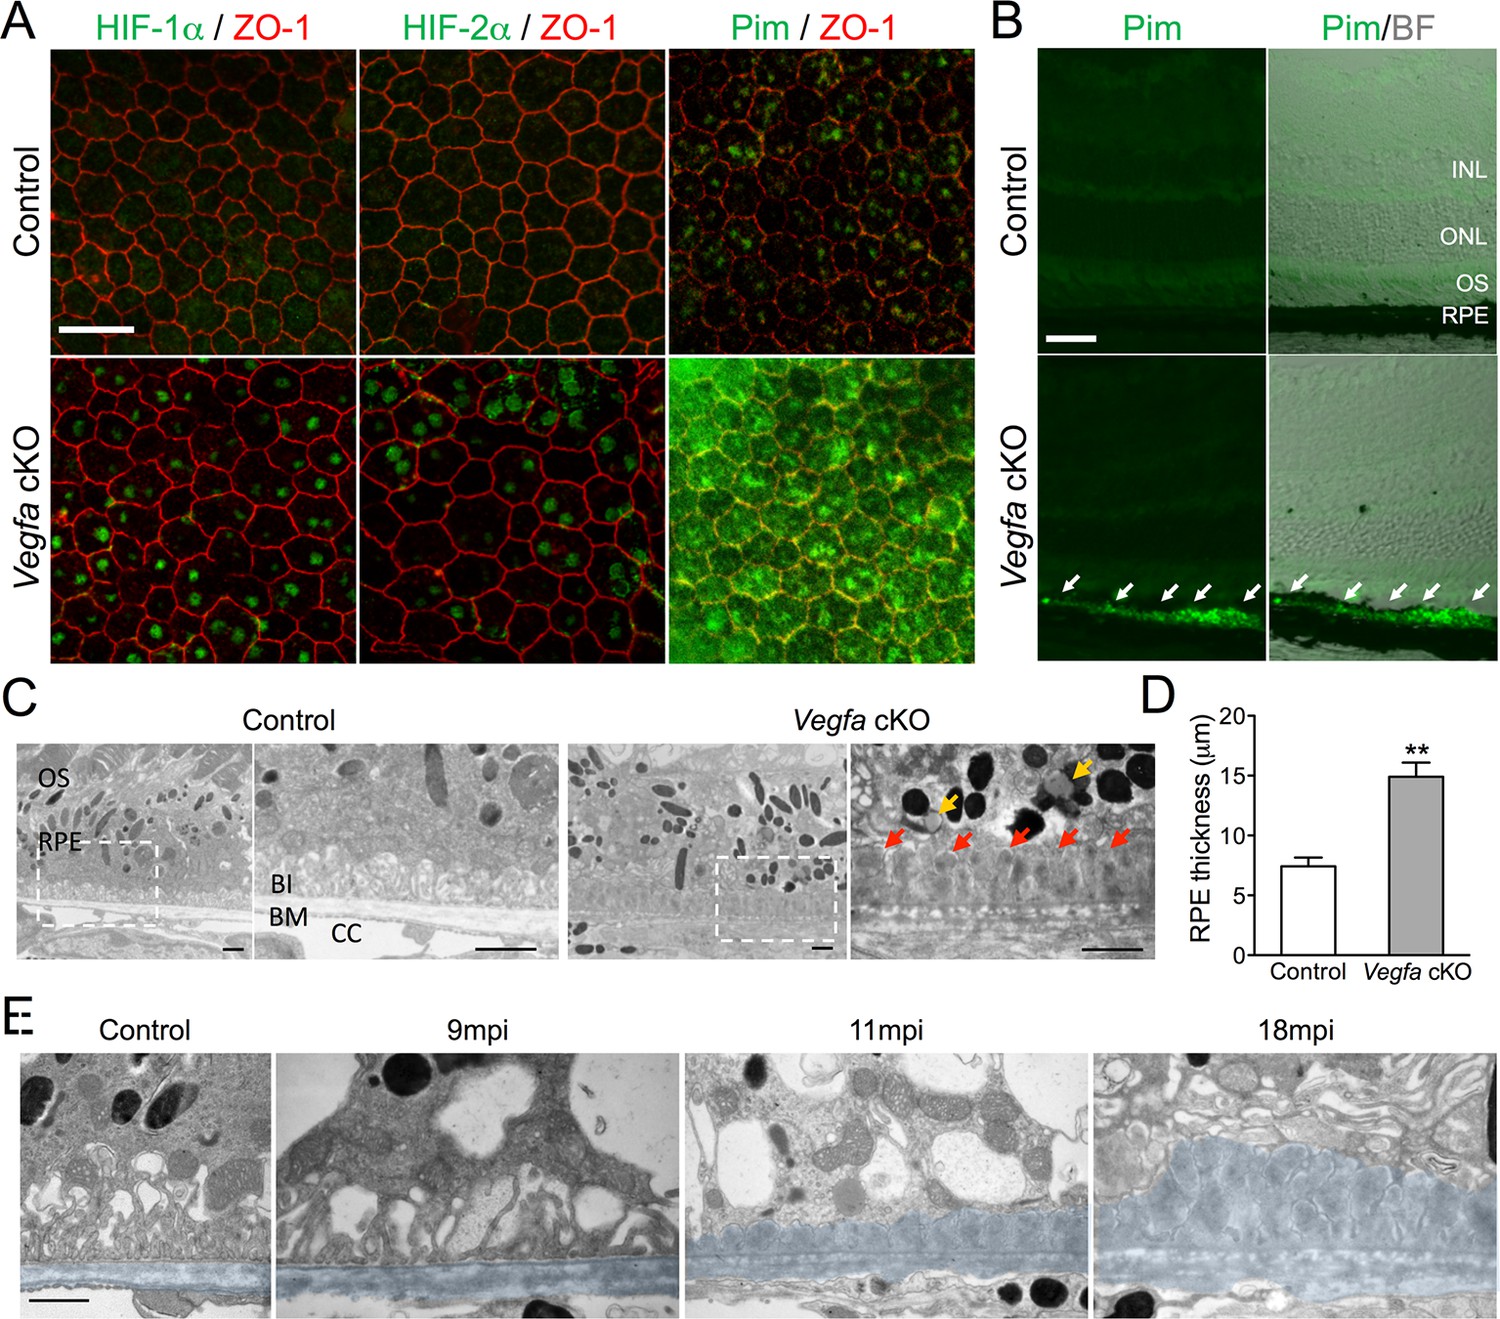
HIF-α accumulation precedes the induction of AMD-like features in Vegfa-cKO mice.
(A) HIF-1α, HIF-2α, and pimonidazole (Pim; green) are detected 6 months post induction in flat-mounted RPE/choroids from Vegfa mutants but not in littermate controls. ZO-1 (red) labels the cell boundaries. (B) The hypoxia probe Pimonidazole (Pim; green) is detected specifically in the RPE (white arrows) of cross-sectioned Vegfa mutant retinas (probe labeling is shown alone (left) and overlaid over brightfield images (right) to emphasize the retinal anatomy). (C) Electron micrographs of littermate control (left) and Vegfa-cKO RPE 11 months post induction (right). Dashed squares in left panels are magnified in right panels. Note the absence of choriocapillaris in Vegfa mutants, accumulation of lipid droplets (yellow arrows) in the cytoplasm, and thickening of Bruch’s membrane (red arrows). (D) Measured thickness values of the RPE of Vegfa mutant mice 11 months post induction (n=4) (see associated Figure 1—source data 1). (E) Electron micrographs of RPE/Bruch’s membrane from control and Vegfa-cKO RPE taken 9, 11, and 18 months post induction. Note the progressive accumulation of material in Bruch’s membrane (pseudo-colored light blue). Abbreviations: Pim=pimonidazole, INL=inner nuclear layer, ONL=outer nuclear layer (photoreceptor cell bodies), OS=photoreceptor outer segments, BI=basal infoldings of RPE cells, BM=Bruch’s membrane, CC=choriocapillaris, mpi=months post [RPE-specific] induction. Scale bars=20 µm (A), 50 µm (B), 1 µm C&E.
-
Figure 1—source data 1
Source data for Figure 1D.
- https://doi.org/10.7554/eLife.14319.004
Figure 2
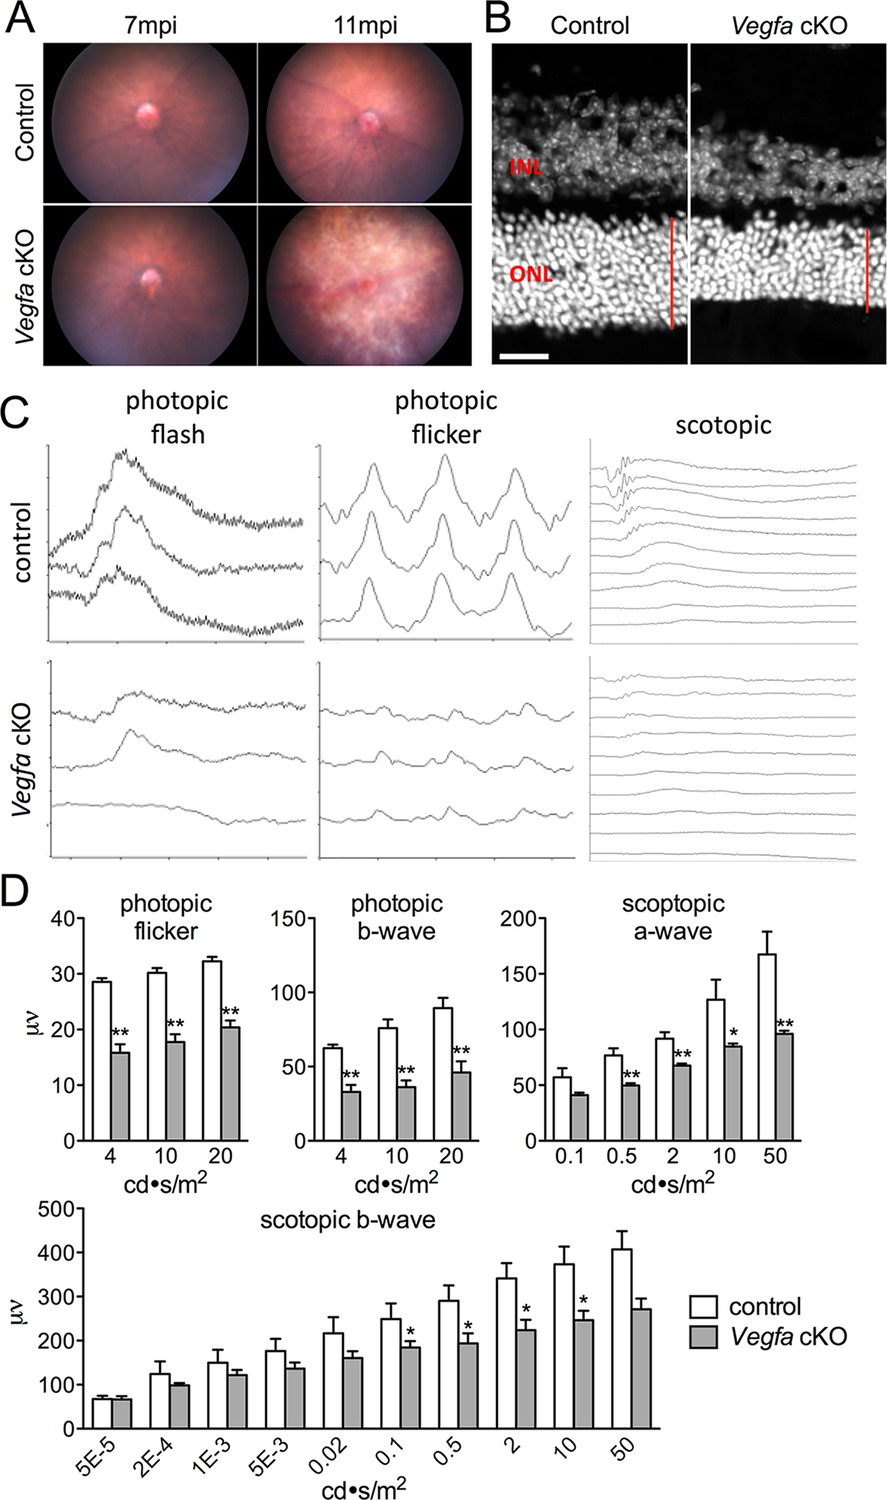
Photoreceptor atrophy and dysfunction is observed in late stage Vegfa-cKOs.
(A) Color fundus images of littermate control and Vegfa-cKO mice 7 or 11 months post induction (mpi). No obvious changes are seen after 7 months, but significant changes indicative of retinal degeneration are seen 11 months post induction. (B) Photoreceptor atrophy, determined by observing thinning of the outer nuclear layer (ONL; red vertical line) is seen in DAPI labeled cryosectioned Vegfa-cKO retinas 18 months post induction 600 μm from the optic nerve head compared with controls. (C) Full-field ERGs performed on controls and Vegfa-cKO mice 11 months post induction (n=6) reveal rod dysfunction in both the a- and b-waves (scotopic), and cone dysfunction in the b-wave and flicker response (photopic flash & flicker) in Vegfa-cKO mice. (D) Quantification of ERGs (see associated Figure 2—source data 1). *p<0.05, **p<0.01. Error bars indicate mean plus s.d. Scale bar=20 µm.
-
Figure 2—source data 1
Source data for Figure 2D.
- https://doi.org/10.7554/eLife.14319.008
RPE can induce choriocapillaris vasodilation
Theoretically, RPE should be able to respond to hypoxia and improve circulation in the choriocapillaris by increasing basal VEGF secretion. To induce hypoxia we maintained 3D cultures of primary human RPE in 3% oxygen in a controlled chamber and analyzed the molecular and metabolic changes. The HIF target gene Vegfa was upregulated after exposure to low oxygen (Figure 3A) or upon addition of dimethyloxalylglycine (DMOG), an inhibitor of prolyl hydroxylase that leads to HIF stabilization (Figure 3B). DMOG also significantly stimulated basal VEGF secretion in a dose dependent manner (Figure 3C). To determine the physiological relevance of hypoxia-enhanced RPE-derived VEGF synthesis, we used VMD2-Cre to delete Vhl in RPE in vivo. Signs of [pseudo] hypoxia, i.e. HIF-α immunoreactivity and activation of known hypoxia-induced genes (including Vegfa), were observed three days post induction in Vhl-cKO mice (Figure 3D and Figure 3—figure supplement 1). The increased VEGF production from Vhl-cKO RPE correlates with significant and progressive choriocapillaris vasodilation based on ultrastructural examinations (Figure 3E and F). However, no vasodilation was observed in double (Vhl/Hif1a-dKO or Vhl/Hif2a-dKO) or triple (Vhl/Hif1a/Hif2a-tKO) knockout mice (Figure 3G) indicating that both RPE-derived HIF-1α and HIF-2α are mutually responsible for HIF/VEGF induced vasodilation. Collectively, these findings demonstrate that RPE can sense changes in oxygen/nutrient availability and respond by appropriately altering the vascular tone of the choriocapillaris.
Figure 3 with 1 supplement see all
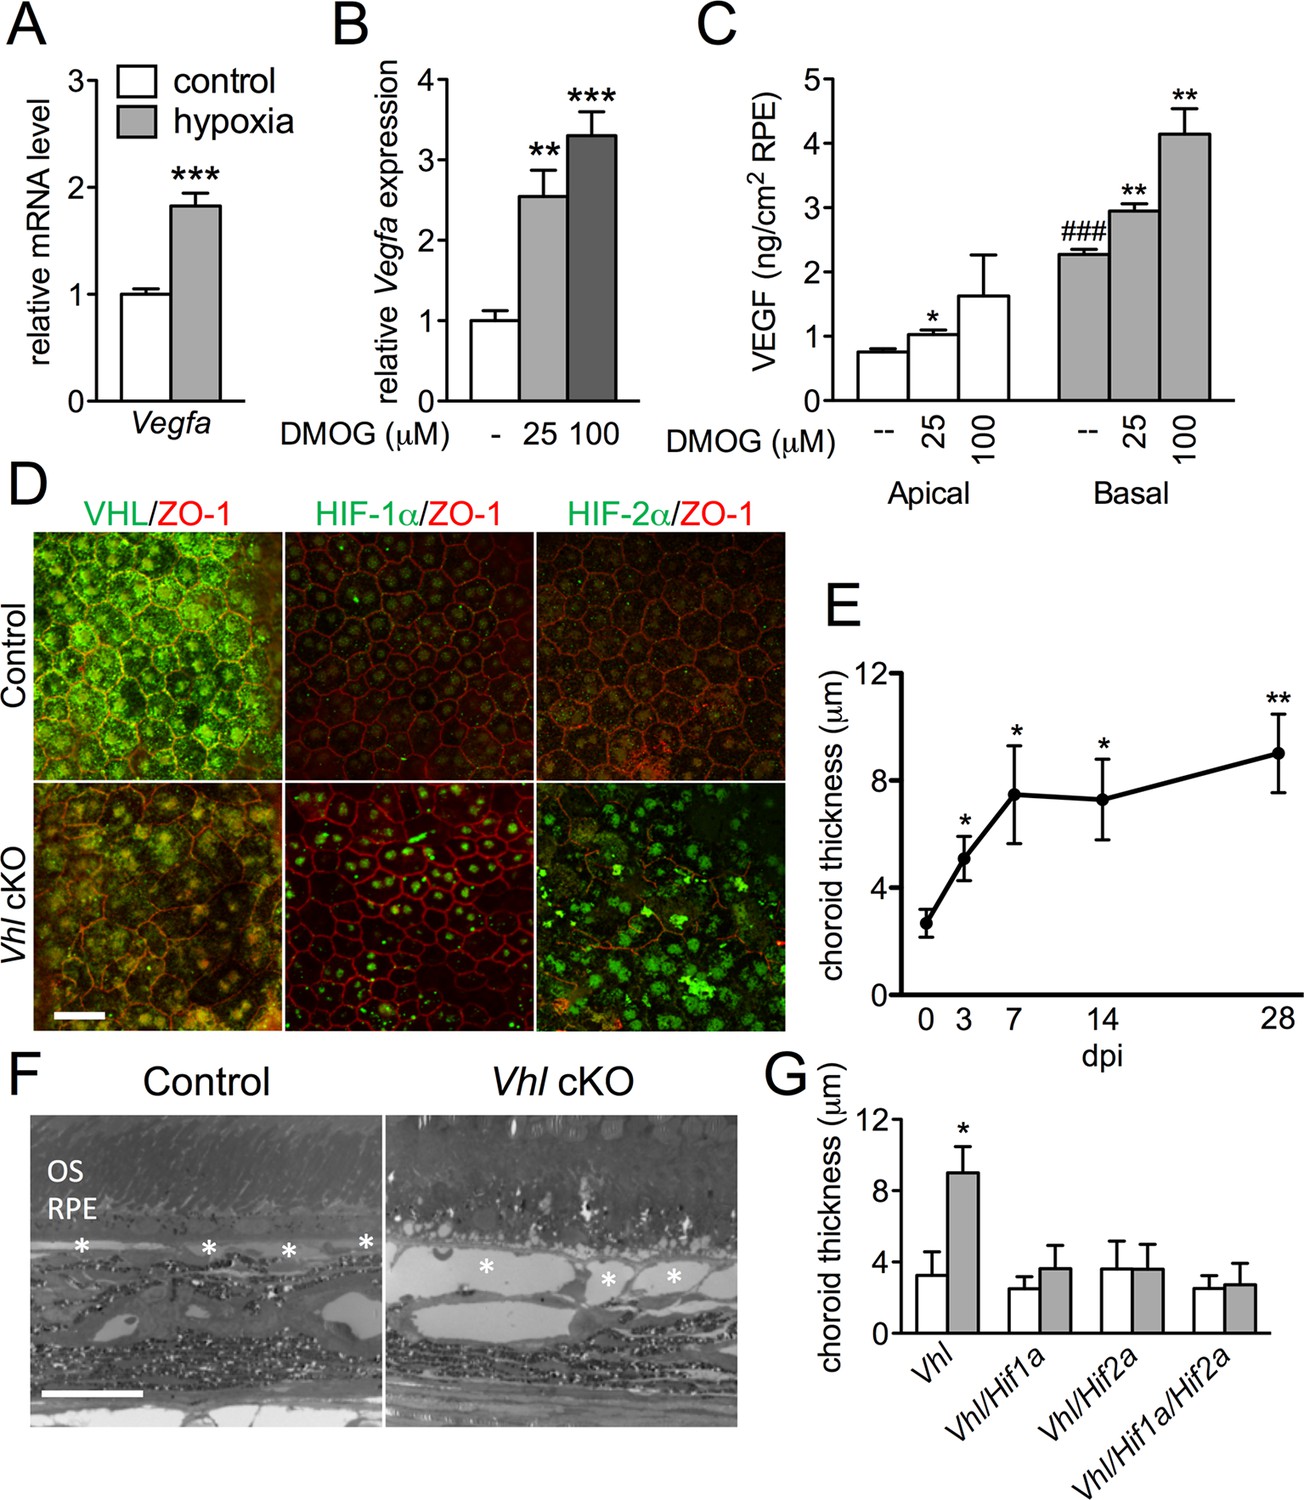
HIF-αs induce dilation of the choriocapillaris in Vhl-cKOs.
(A) Vegfa is upregulated in hRPE exposed to 3% oxygen. Data are the mean plus s.e.m. (n=5–6). (B–C) Vegfa mRNA (B) and VEGF165 protein (C—predominately from the basal surface when grown on transwells) is upregulated in a dose-dependent manner by DMOG for 24 hr compared with DMSO controls. Data are the mean plus s.e.m. (n=4–6). (D) Immunohistochemistry analyses reveal that VHL (green) expression is lost 3 days post induction in Vhl-cKOs, and HIF-1α and HIF-2α are upregulated in the nucleus of Vhl-cKOs RPE, but not in controls. (E) Measurements of the choriocapillaris from electron micrographs 0–28 days post induction (F) in untreated and Vhl mutants revealed progressive choriocapillaris vasodilation (n=4). (G) Choriocapillaris thickness values of Vhl-cKO, Vhl/Hif1a-dKO, Vhl/Hif2a-dKO, Vhl/Hif1a/Hif2a-tKO mice measured 28 days post induction (n=4). (See also associated Figure 3—source data 1 for panels A-C, E, and G.) Scale bars=20 µm. Error bars represent mean plus s.d.
-
Figure 3—source data 1
Source data for Figure 3A–C,E, and G.
- https://doi.org/10.7554/eLife.14319.010
Hypoxia induces structural changes in RPE and retinal degeneration
Hypoxia-triggered choriocapillaris vasodilation may come at a significant cost for the retina. The accumulation of lipid droplets and material resembling glycogen is detectable within only three days post induction in the RPE of Vhl mutants (Figure 4A). Severely distended basal infoldings, thickening of Bruch’s membrane, and numerous lipid droplets (sometimes contiguous with subretinal extracellular spaces) are observed 14 days post Vhl deletion (Figure 4B; red). Measurements across the RPE from electron micrographs reveal significant hypertrophy (Figure 4C). While the double deletion of Vhl/Hif1a did not prevent the RPE defects in the Vhl mutants, the RPE cells of Vhl/Hif2a or Vhl/Hif1a/Hif2a mutants appeared unremarkable and were not hypertrophic (Figure 4D and E), suggesting that HIF-2α, as it is in other cell-types (Qiu et al., 2015; Zhao et al., 2015), is the pathological HIF isoform in hypoxic RPE.
Figure 4
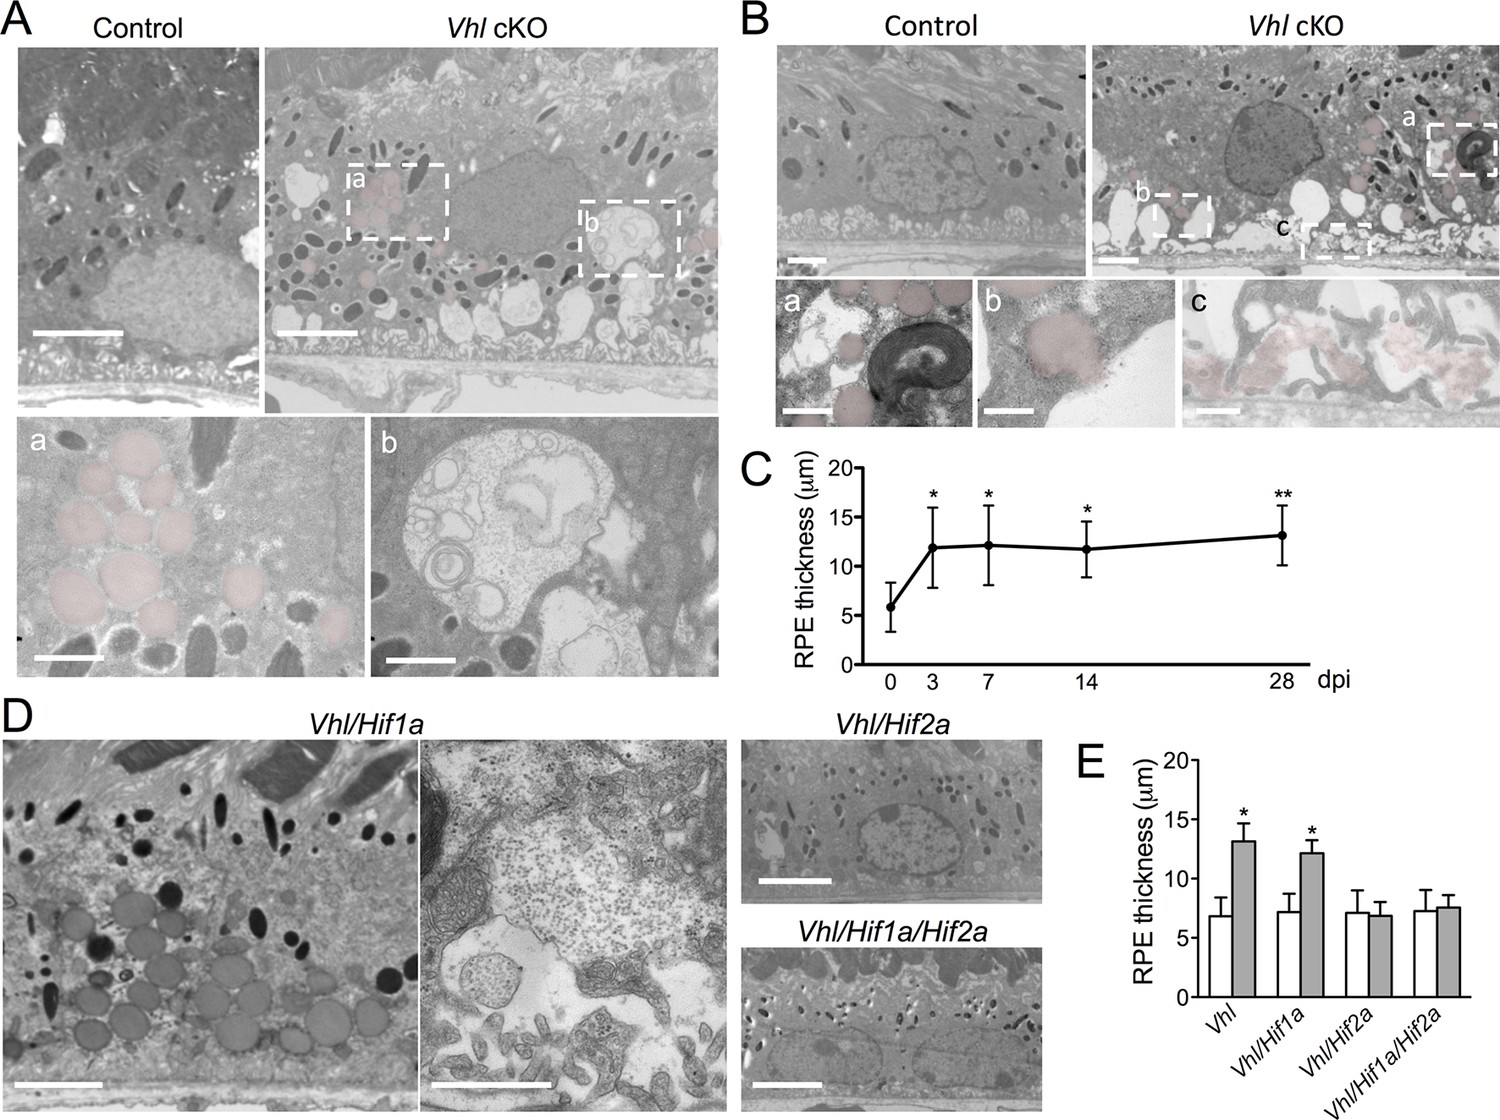
Dramatic and rapid-ensuing RPE defects observed in Vhl-cKO mice are dependent on Hif2a.
(A) Electron micrographs of RPE cells from littermate control and Vhl-cKO mice 3 days post Vhl deletion. Regions marked with perforated white rectangles are in the lower panels. Note the intracellular accumulations of lipid droplets (a; red) and glycogen (b). (B) Electron micrographs of RPE cells from littermate control and Vhl-cKO mice 14 days post Vhl deletion. Intracellular lipid droplets (a), extrusion of lipid droplets into the subretinal space (b), and lipids collecting along the basal laminar surface of Bruch’s membrane and between RPE basal infoldings (c) are observed. (C) Thickness measurements from electron micrographs and reveal that RPE hypertrophy occurs from 0–3 day post induction timepoints, and then plateaus from 3–28 timepoints in Vhl mutant mice (n=5). (D) Electron micrographs of RPE from Vhl/Hif1a (left panels), Vhl/Hif2a (upper middle panel), and Vhl/Hif1a/Hif2a (bottom middle panel) mutant mice 14 days post induction. Note that lipid droplets (dark gray spheres, upper left panel) and material resembling glycogen (small punctate spots) are observed in Vhl/Hif1a-dKO, but not in Vhl/Hif2a-dKO or Vhl/Hif1a/Hif2a-tKO RPE) 14 days post induction. These data suggest Hif2a is responsible for the phenotype in Vhl mice. (E) Choriocapillaris thickness values of Vhl-cKO, Vhl/Hif1a, Vhl/Hif2a, Vhl/Hif1a/Hif2a mice measured 28 days post induction (n=4). (See also associated Figure 4—source data 1 for panels C&E.) Scale bars=5 µm (A), 1 µm (A’a & A’b), 2 µm (B), 0.5 µm (B’a, B’b, B’c), 5 µm (D). Error bars represent mean plus s.d.
-
Figure 4—source data 1
Source data for Figure 4C&E.
- https://doi.org/10.7554/eLife.14319.013
Devastating secondary effects resulting from RPE hypoxia were observed in the sensory retina. Photoreceptor degeneration (Figure 5A–C) and significant functional impairments of both rod and cone driven-pathways (Figure 5D—figure supplement 1A) were observed in VMD-Cre;Vhl and VMD-Cre;Vhl/Hif1a mice 28 days post induction but not in in Vhl/Hif2a (or Vhl/Hif1a/Hif2a mice; Figure 5C,E–G), (or in any of the relevant controls; Figure 5—figure supplement 1B and C). In advanced stages of the phenotype (>50 dpi), dramatic changes in RPE and the vasculature are observed consistent with retinal remodeling (Figure 5—figure supplement 2) (Marc et al., 2003). These findings imply that HIF-2α-mediated metabolic stress in RPE, which cannot be rescued even with a significantly dilated choriocapillaris, is enough to promote photoreceptor degeneration.
Figure 5 with 2 supplements see all

Progressive and rapid photoreceptor degeneration observed in Vhl-cKO mice is dependent on Hif2a.
(A) Thickness measurements from electron micrographs reveal progressive thinning of the outer nuclear layer (ONL or photoreceptor cell bodies) from 0–28 days post induction timepoints in Vhl mutant mice (n=5). (B) Cryosectioned DAPI stained retinas from Vhl-cKO mice prior to induction (0 dpi; left panel), 7 dpi, and 28 dpi. (C) Quantified thickness values measured 600 μm from the optic nerve head of the outer nuclear layer in Vhl-cKO, Vhl/Hif1a, Vhl/Hif2a, and Vhl/Hif1a/Hif2a 28 days post induction (n=4) (See associated Figure 5—source data 1 for panels A&C.). (D) Full-field ERGs performed on Vhl-cKO and control mice 28 days post induction. (E) ERGs from Vhl/Hif1a, (F) Vhl/Hif2a, and (G) Vhl/Hif1a/Hif2a mutant mice 28 days post induction. ERG analyses reveal that normal photoreceptor function is observed in Vhl/Hif2a (F) or Vhl/Hif1a/Hif2a (G) mutant mice. *p<0.05, **p<0.01. For all ERGs n=6–8. Error bars indicate mean plus s.d.
-
Figure 5—source data 1
Source data for Figure 5A&C and Figure 5—figure supplement 1A–C.
- https://doi.org/10.7554/eLife.14319.015
Lipid handling is impaired in hypoxic RPE
We next set out to identify the molecular mechanisms driving the hypoxic-mediated metabolic stress in RPE cells. Based on histopathological evidence of impaired lipid handling in hypoxic RPE we performed gene profiling for fatty acid metabolism genes from RPE/choroid complexes of Vhl-cKO mice. Acyl-CoA synthetase and Acyl-CoA dehydrogenase family genes were downregulated (Figure 6A and Figure 6—figure supplement 1A and B) but not in Vhl/Hif2a or Vhl/Hif1a/Hif2a mutant RPE (Figure 6B and Figure 6—figure supplement 1B). We also performed untargeted high-resolution mass spectrometry-based metabolomic analyses and observed abnormal levels of several long-chain saturated, unsaturated, and oxidized acylcarnitines in the Vhl-cKO mice (Figure 6C and Figure 6—figure supplement 2). Vhl/Hif1a mice exhibit dysregulated metabolomic profiles similar to Vhl mutants (Figure 6—figure supplement 2A and B), but normal levels of acylcarnitines and other metabolites were observed in Vhl/Hif2a (Figure 6—figure supplement 2C) and Vhl/Hif1a/Hif2a mice (Figure 6—figure supplement 2D). Collectively, these data strongly suggest that HIF-2α regulates lipid handling in RPE in vivo.
Figure 6 with 3 supplements see all
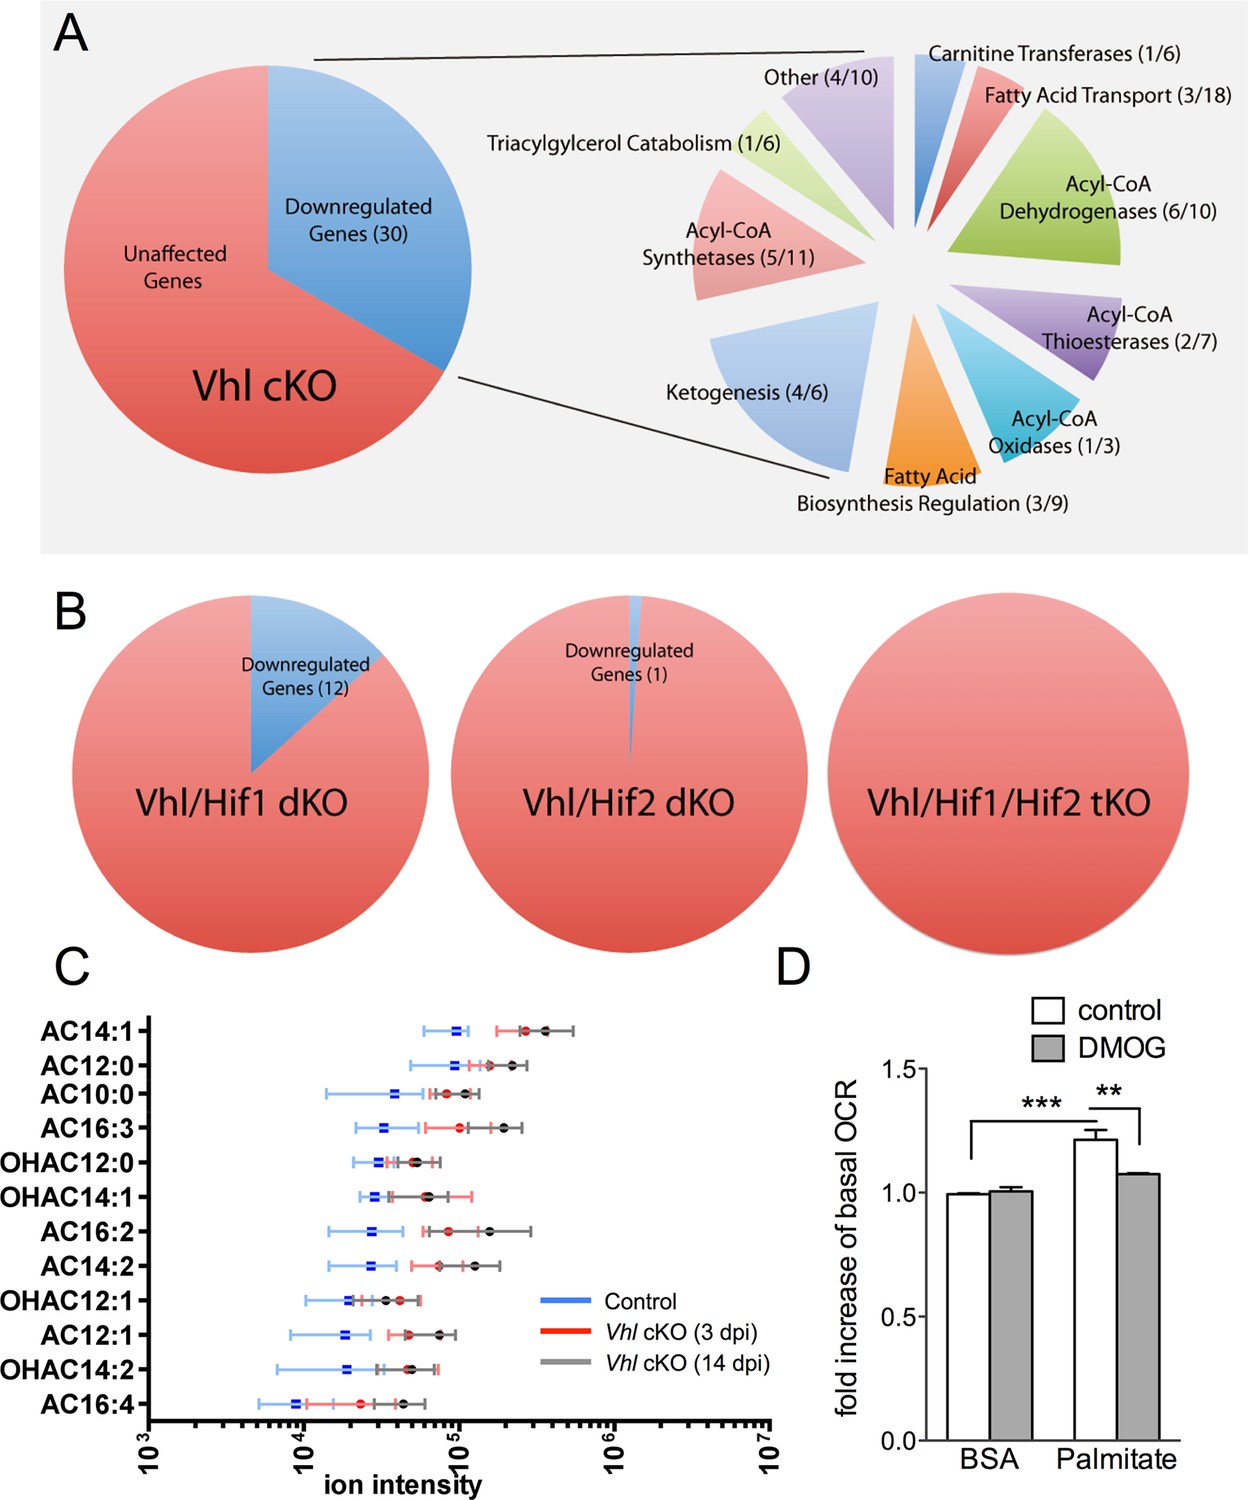
Defects in lipid metabolism in Vhl mutant RPE.
(A) Summary of gene-profiling experiments for lipid metabolism genes in RPE/choroid complexes from Vhl mutant mice 3 days post induction (n=4). (B) Downregulation of lipid metabolism genes was also seen in Vhl/Hif1a mutants, but nominally in Vhl/Hif2a, and no gross changes were seen in Vhl/Hif1a/Hif2a mutants 3 days post induction (n=4). (C) Untargeted high-resolution mass spectrometry-based metabolomic analyses revealed that a group of acylcarnitines (AC) was progressively dysregulated from 3 to 14 days post induction (n=4–6) (see also associated Figure 6—source data 1). Box and whiskers plots are shown. Error bars represent maximum and minimum values. (D) Pre-treating hRPE with DMOG reduced the basal oxygen consumption rates (initial OCR – OCR after injection of RAA) when the cells were assayed in substrate limited media (2.5 mM glucose) and provided BSA control or palmitate conjugated to BSA (n=4) (see also associated Figure 6—figure supplement 3B). Error bars are the maximum and minimum values in panel C and mean plus s.d. in panel D.
-
Figure 6—source data 1
Source data for Figure 6C, Figure 6—figure supplement 2A–D, Figure 6—figure supplement 3B.
- https://doi.org/10.7554/eLife.14319.019
To test if HIF activation leads to altered lipid oxidation we monitored oxygen consumption in human RPE treated with a hypoxia mimetic, DMOG. Seahorse flux analysis revealed that human RPE cells in substrate-limited media oxidize exogenous lipids (palmitate) as an energy substrate (BSA control vs. palmitate control, Figure 6D). The ability of palmitate to increase oxygen consumption rates (OCRs) was validated by the addition of an inhibitor of the carnitine transport, etomoxir, which reduced oxygen consumption to BSA control levels (Figure 6—figure supplement 3A). Interestingly, treating the cells with low-dose DMOG for 48 hr prevented lipid oxidation (palmitate control vs. palmitate DMOG, Figure 6D and Figure 6—figure supplement 3B). These data suggest that hypoxic RPE alter their lipid handling behaviors and begin storing lipids in droplets, rather than utilizing them as an energy substrate.
Glucose metabolism is disrupted in hypoxic RPE
The presence of visible glycogen stores in Vhl-cKO RPE indicates that glucose metabolism may also be dysregulated. Using PCR arrays for glucose metabolism we determined that glycogen degradation genes were downregulated in Vhl mutant mice (summarized in Figure 7A). Furthermore, we observed that glycolysis-related genes were largely upregulated and TCA cycle genes were largely downregulated (summarized in Figure 7B and Figure 7—figure supplement 1A and B). These data suggest that in vivo the RPE cells are reducing oxidative phosphorylation and meeting their energy demands by increasing glycolysis. To test if RPE cells reduce oxidative metabolism in response to hypoxia, we monitored oxygen consumption rates in cultured human RPE cells (provided glucose, pyruvate and glutamine) after the cells were exposed to hypoxic conditions (3% O2) for 72 hr compared to a parallel control plate maintained in normoxia. Basal and maximal oxygen consumption rates were greatly reduced in cells after hypoxia exposure (Figure 7C and Figure 7—figure supplement 2A), suggesting mitochondrial respiration has been remodeled as a result of hypoxia. An internal ratio of the basal OCR divided by the proton leak (oligomycin-insensitive OCR) to normalize for potential plate-to-plate variation, showed a similar effect of hypoxia reducing oxidative capacity (Figure 7—figure supplement 2B). Treating the human RPE cells with low-dose DMOG, a HIF activator, also significantly reduced basal and maximal oxidative capacities in a dose-dependent manner (Figure 7D). In cells treated with higher doses of DMOG (>250 uM) oxidative capacity was completely lost (Figure 7D), even though there were no outward signs of toxicity or cell death. Collectively these data suggest that the oxidative metabolism of RPE cells is very sensitive to hypoxia.
Figure 7 with 2 supplements see all

Glucose consumption and metabolism is altered in the RPE of Vhl mutants.
(A) Gene-profiling data revealed that glycogen degradation genes were significantly attenuated in Vhl mutants 3 days post induction (n=4). (B) Gene-profiling data for glucose metabolism genes were summarized by plotting changes along the glycolysis and TCA cycle pathways 3 days post induction (n=4) (red text=downregulated, blue text=upregulated). (C) Basal and maximal oxygen consumption rates (OCR) of hRPE after being exposed to 3% O2 for 72 hr or maintained at normoxia. Data are the mean plus s.e.m. (n=7–10). (D) Seahorse Flux Analysis OCR trace showing reduced OCR in hRPE cells treated with DMOG for 24 hr. Data points are the mean plus s.d. (n=6). (E and F) Changes in lactate (E) and glucose (F) levels of the media from hRPE cells, in transwells, after treatment with DMOG for 24 hr. Data are the mean plus s.e.m. (n=4). (G) Glucose levels are decreased in the sensory retina of Vhl-cKO mice 3 days post induction compared with littermate controls (n=6–10). (H) Relative glucose consumption is increased (roughly two-fold) in primary Vhl-cKO RPE compared with controls (n=6). (I and J) Relative expression level of Glut1 in hRPE cells after exposure to 3% 02 for 72 hr (I) or treatment with DMOG for 24 hr (J). Data are the mean plus s.e.m. (n=6). (K) Changes in glutamine levels of the media from hRPE cells, in transwells, after treatment with DMOG for 24 hr. (See also associated Figure 7—source data 1 for panels C-K.) Data are the mean plus s.d. (n=4).
-
Figure 7—source data 1
Source data for Figure 7C–K, Figure 7—figure supplement 2A.
- https://doi.org/10.7554/eLife.14319.024
Figure 8
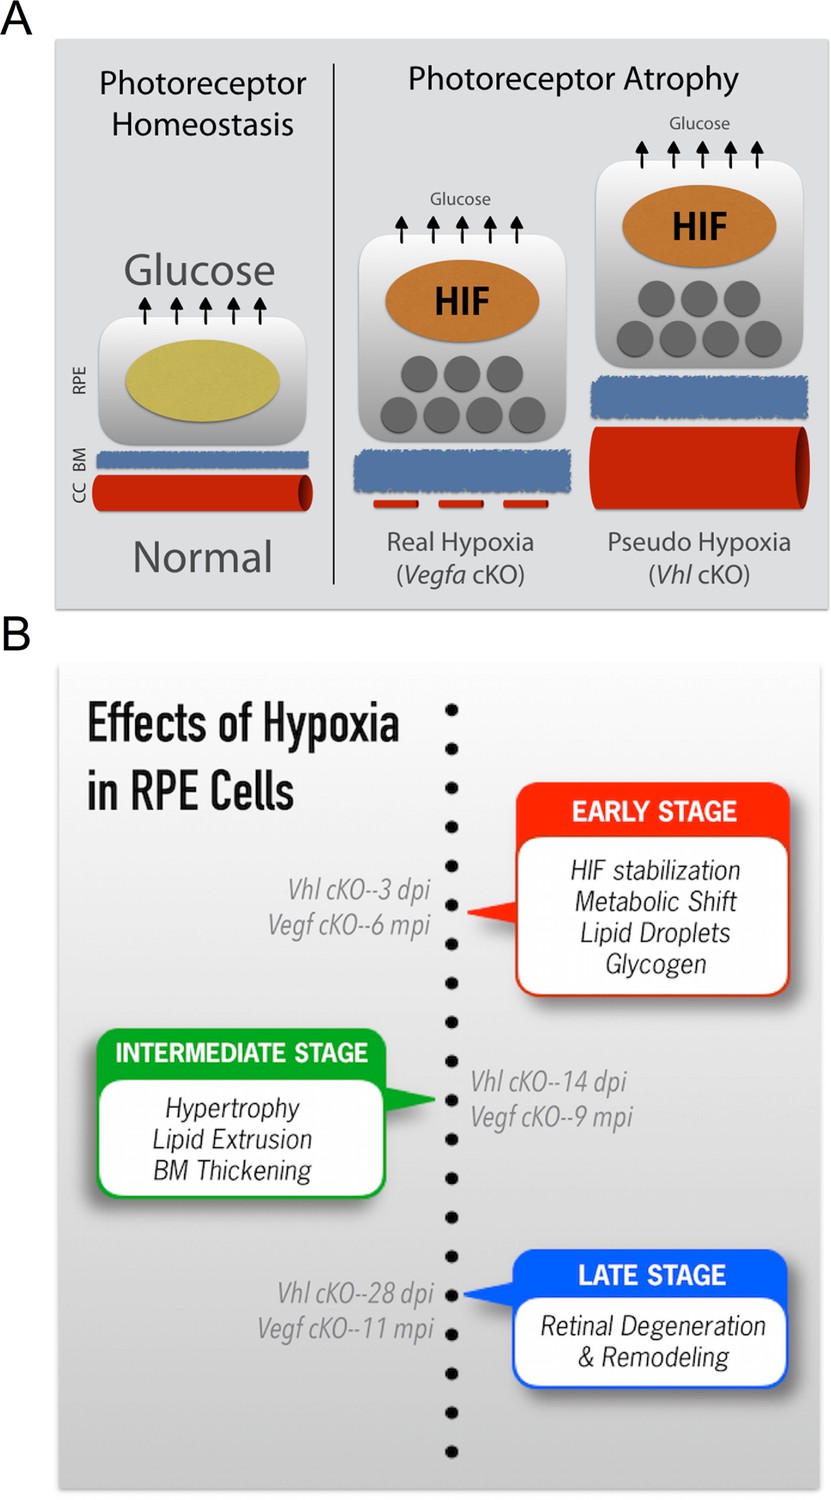
Summarizing the onset of the major phenotypes in Vhl and Vegfa mutant mice.
(A) In normal conditions RPE deliver sufficient levels of glucose for photoreceptor homeostasis. During real (Vegfa-cKO) and pseudo hypoxia (Vhl-cKO), Bruch’s membrane thickening and metabolic changes in RPE (that induce lipid accumulation—dark gray circles) limit glucose delivery to photoreceptors. This results in photoreceptor atrophy. (B) The effects of pseudo hypoxia in Vhl mutants and real hypoxia in Vegfa mutants present in a similar sequence but at radically different rates. The progression rate is accelerated in Vhl-cKOs since HIFs are dominant-stable. Changes in choriocapillaris density induce graded hypoxia in the Vegfa-cKO line, making it more physiologically relevant.
We found using 3D culture methods that polarized human RPE treated with DMOG increased lactate production (Figure 7E) further supporting the notion of a metabolic shift from oxidative phosphorylation toward glycolysis in RPE. This was coupled with evidence of increased glucose uptake from their apical surfaces (Figure 7F), thereby potentially depleting glucose supplies allocated for the photoreceptors. In vivo, metabolic profiling analyses revealed that glucose levels in the sensory retina of Vhl mutants were significantly reduced (Figure 7G). Similarly, primary RPE cells isolated from Vhl mutant mice took up more than double the amount glucose as controls (Figure 7H). To allow increased glucose uptake, we found the glucose transporter 1 (Glut1 or Slc2a1) was upregulated in vivo ( Vhl-cKO RPE; Figure 3—figure supplement 1) and in vitro in response to both hypoxia and DMOG treatment (human RPE Figure 7I and J). These changes in glucose processing are similar to a HIF-dependent phenomenon observed in tumor cells known as the 'Warburg effect' (Luo et al., 2011; Takubo et al., 2010; Warburg, 1956).
Measuring metabolite levels from human RPE differentiated in transwells highlights how changes in RPE metabolism may influence nutrient availability for the retina. In addition to DMOG reducing glucose (and increasing lactate) levels in the apical chamber, we observed that glutamine handling was also altered in response to hypoxia. Glutamine is an essential cellular metabolite that is both a key energy substrate and nitrogen source. DMOG reduced glutamine availability in the apical chamber (Figure 7K). These data suggest that a confluence of hypoxia-mediated metabolic changes in RPE results in depleted energy substrates for photoreceptors that promotes retinal degeneration.
Discussion
Photoreceptors are some of the most metabolically demanding cells in the body; this study reinforces how heavily photoreceptors rely on RPE for metabolic support. While it is widely accepted that death or dysfunction or RPE results in photoreceptor degeneration, the combination(s) of cellular stresses that impair RPE function and survival are incompletely understood. We present evidence here that a single causative factor, chronic HIF-2α-mediated metabolic stress in RPE cells, is enough to induce photoreceptor dysfunction/degeneration. We also provided the following mechanistic explanations: (a) hypoxia alters the RPE secretome and vectorial release of VEGF, lipids, and several metabolites including lactate, glutamine, and glucose; (b) hypoxic RPE shut down glucose and lipid oxidation and commit to glycolysis (and store superfluous glucose and lipid); (c) this metabolic shift allows RPE to obtain energy more quickly, but requires that they double their glucose intake due to low ATP yield. Since RPE are the major suppliers of glucose to the neurosensory retina (Foulds, 1990), these changes directly impact photoreceptor function and survival (Linton et al., 2010; Chertov et al., 2011).
Aberrant lipid accumulation occurs in both human RPE and Bruch’s Membrane during aging and disease (Pauleikhoff et al., 1990; Holz et al., 1994; Sheraidah et al., 1993). In fact lipids were the first identified molecules in human subretinal deposits (Pauleikhoff et al., 1992; Wolter and Falls, 1962). Unlike retinosomes, lipid droplets that arise due to visual cycling defects in RPE (Imanishi et al., 2004), the lipid inclusions observed in hypoxic RPE are likely derived from metabolic derangements. Similar inclusions (and RPE hypertrophy and photoreceptor atrophy) were observed in transgenic mice by conditionally inactivating OXPHOS in RPE (Best1-Cre;Tfamfl/fl) (Zhao et al., 2011). Lipid accumulation in Bruch’s membrane is a common feature of AMD, and several lipid-processing genes have been associated with modifiable risk for AMD (Chen et al., 2010; Klaver et al., 1998; Neale et al., 2010; Souied et al., 1998; Zerbib et al., 2009). Neutral lipids, likely derived from RPE, are abundant in AMD specific basal linear deposits (Sarks et al., 1988; Curcio and Millican, 1999; Rudolf et al., 2008; Sarks et al., 2007; Zweifel et al., 2010). Finally, thickening of Bruch’s membrane contributes to AMD pathogenesis (Sarks, 1976; Sarks et al., 1988), probably by greatly limiting diffusion of aqueous based metabolites to the retina (including energy substrates such as glucose) (Pauleikhoff et al., 1990; Moore, 1995; Starita et al., 1995; 1996; 1997), by inducing inflammation, and by promoting choroidal neovascularization (Baba et al., 2010; Tamai et al., 2002). The identification of a broad class of acyl-carnitines in hypoxic RPE provides additional evidence of gross glucose metabolism and lipid-handling defects; identifying the combinations of perturbed acylcarnitines is informative for diagnosing fatty acid oxidation defects and other inborn errors of metabolism (Rinaldo et al., 2008).
Glucose availability correlates with retinal degeneration in both animal models and AMD patients. A comprehensive analysis of murine models of spontaneous degeneration revealed nutritional imbalances leading to cone photoreceptor degeneration, which could be delayed with insulin therapy (Punzo et al., 2009). In addition RPE-specific inactivation of oxidative phosphorylation, which is induced by conditional deletion of mitochondrial transcription factor A, leads to increased glycolysis and photoreceptor degeneration. These phenotypes were prevented by inhibition of mTOR (mammalian target of rapamycin) (Zhao et al., 2011), a positive regulator of HIF-αs (Hudson et al., 2002; Nayak et al., 2012). Furthermore, excessive glycemic load is a modifiable risk for AMD; and 20% of advanced AMD cases might be prevented by consuming less glucose-rich foods (Chiu et al., 2007).
Hypoxia in RPE can occur during aging and disease due to localized choriocapillaris dropout. Based on this study, morphometric changes to the choriocapillaris, which can be routinely and non-invasively examined (Zhang et al., 2015), may be a powerful predictive tool for AMD disease progression. In addition, monitoring RPE/Bruch’s membrane changes and tracking the glycemic index of early AMD patients may improve case-specific treatment and risk progression prediction algorithms. Finally, abnormally high HIF-2α levels have been observed in the RPE of human aged donor eyes (Sheridan et al., 2009). Therefore, anti-HIF therapies, which are being developed for treating other diseases (Metelo et al., 2015; Rini and Atkins, 2009; Rogers et al., 2013; Scheuermann et al., 2013), may be effective for treating some AMD patients. In conclusion, our models may be employed to examine the progression of AMD-like features, as well as for developing novel preventive and therapeutic strategies for AMD and other vision-threatening diseases.
Materials and methods
Mice
The TSRI Animal Care Committee approved all procedures involving animals and we adhered to all federal animal experimentation guidelines. Transgenic mice carrying the human vitelliform macular dystrophy-2 (VMD2) promoter-directed reverse tetracycline-dependent transactivator (rtTA) and the tetracycline-responsive element (TRE)-directed Cre recombinase (VMD2-Cre mice) (Le et al., 2008) were mated with Vhlfl/fl mice (Haase et al., 2001), Hif1afl/fl mice (Ryan et al., 2000), Epas (Hif2a)fl/fl mice (Gruber et al., 2007), or Vegfafl/fl mice (Gerber et al., 1999). Control littermates harboring floxed alleles but no Cre-recombinase were utilized. Additional control experiments were also examined (Figure 5—figure supplement 1B and C). To induce gene deletion, 80 μg/g body weight of doxycycline were injected daily into 6–8 week-old transgenic mice intraperitoneally for three days. Gene recombination was quantified and cre-mediated toxicity was examined in double transgenic VMD2-Cre with ROSA26 mTomato/mGFP reporter mice (Muzumdar et al., 2007). We noted that recombination in VMD2-Cre occurs at either ~70% or ~10%, and either the high or low efficiency is inherited. All data shown in the main body of text was from the offspring of “high efficiency mice.” Gene ablation in “low efficiency mice” yielded a similar, albeit much milder phenotype. Genotyping was performed at Transnetyx (Memphis, TN). Mutations for rds (retinal degeneration slow), rd1, rd8, and rd10 were examined and excluded from breeding pairs.
Primary RPE cell culture
Request a detailed protocolRPE cells from VMD2-Cre;Vhlfl/fl and control Vhlfl/fl littermates were isolated as previously described (Krohne et al., 2012). Cells were maintained at 37° and 5% CO2 in DMEM/F12 from Thermo Fisher Scientific (Waltham, MA) with 2% FBS from Jackson ImmunoResearch (West Grove, PA). 2 μg/μl doxycycline was added to all cultures daily for three days to induce Vhl ablation. Human RPE cells (Lonza) were maintained either on plastic surfaces or on transwell filters (Corning) depending on the application in RtEGM Retinal Pigment Epithelial Cell Growth Medium fortified with RtEGM BulletKit from Lonza (Basel, Switzerland). Glucose, lactate, and glutamine levels were measured from the media in apical and basal compartments using a 2900 Biochemistry Analyzer from YSI (Yellow Springs, OH). A concentrated stock of DMOG from Cayman Chemical (Ann Arbor, MI) was made with DMSO, and added directly to the media in different concentrations to induce pseudo-hypoxia. RPE cells were maintained in low oxygen and metabolic changes were analyzed using Seahorse Flux Analysis (see below) in a Coy Dual Hypoxia Chamber from Coy Lab Products (Grass Lake, MI) (Grassian et al., 2014).
Glucose assays
Request a detailed protocolIn vitro glucose consumption analyses (GAHK20-1KT, Sigma-Aldrich; St. Louis, MO) and in vivo glucose measurements (SKU120003, Eton Bioscience Inc.; San Diego, CA) were performed on the fourth day after doxycycline administration according to the manufacturer’s instructions. For in vivo glucose measurements, retinas were dissected out and homogenized in 80% ethanol.
Seahorse flux analysis
Request a detailed protocolRPE were cultured on 96 well XF Microplates (Agilent Technologies Inc.; La Jolla, CA)) and maintained as described above. Prior to analysis human RPE were transferred to assay media (modified Ringer’s solution lacking sodium bicarbonate). For glucose metabolism assays media was supplemented with 12 mM glucose, 2 mM pyruvate, 2 mM glutamine, and 10 mM HEPES, pH 7.4. For fatty acid oxidation (FAO) assays the media contained 2.5 mM glucose, 0.5 mM carnitine and 10 mM HEPES, pH 7.4. Oxygen consumption rates (OCR) were measured using a XFe96 device (Agilent Technologies Inc.)); the following concentrations of drugs were used: 2 µM oligomycin, 0.5 µM carbonyl cyanide p-trifluoromethoxyphenylhydrazone (FCCP), 1 µM antimycin A, and 1 µM rotenone. For measuring fatty acid oxidation higher concentrations of drugs were used: 2 µM oligomycin, 1 µM FCCP, 4 µM antimycin A, and 2 µM rotenone. For FAO, etomoxir (40 µM/well) was added at least 30 min prior to analysis. BSA and BSA-conjugated palmitate (Agilent Technologies Inc.) were added to the cells immediately prior to reading. Basal OCR was calculated by subtracting the OCR in the presence of antimycin A and rotenone from that of the initial OCR prior to addition of drugs. Maximal OCR was calculated by subtracting OCR in the presence of antimycin A and rotenone from the OCR in the presence of FCCP.
Electron microscopy analysis
Request a detailed protocolCardiac perfusions were performed with freshly prepared saline, and then with 4% paraformaldehyde plus 1.5% gluteraldehyde in 0.1 M cacodylate buffer. Eyes were enucleated and fixed in the same mixture overnight at 4°C and then rinsing in 0.1 M Na cacodylate buffer for 1 hr. The eye cups were then postfixed in 1% OsO4 in 0.1 M cacodylate buffer for 2 hr, followed by another 1-hr wash and dehydration with graded ethanol solutions. Samples were incubated overnight in a 1:2 mixture of propylene oxide and Epon/Araldite (Sigma-Aldrich) and then placed in 100% resin followed by embedding. The blocks were sectioned and used for high-magnification electron microscopy analysis.
Electroretinography
Request a detailed protocolFully dark adapted mice were anesthetized under dim red light by intraperitoneal injection of 15 mg/kg ketamine and 7 mg/kg xylazine. Full-field ERGs were recorded from the corneal surface of each eye after pupil dilation (1% tropicamide and 2.5% phenylephrine) using active contact lens electrodes (Mayo; Inazawa, Japan) placed on the cornea, a mouth reference, and tail ground electrode. A computerized system with an electronically controlled Ganzfeld dome was used (Espion E2 with Colordome; Diagnosys; Westford, MA). In the dark-adapted state, we recorded rod and mixed cone/rod responses to a series of white flashes of increasing intensities (1 × 10⁻⁵ to 50 cd•s/m2). In the light-adapted state, with a 30 cd/m2 background, cone responses to 1-Hz (0.63 to 20 cd•s/m2) and 30-Hz (3.98, 10, and 20 cd•s/m2) flicker stimuli were recorded. All ERG responses were filtered at 0.3–500 Hz, and signal averaging was applied.
Immunohistochemistry
Request a detailed protocolRetinas or RPE/choroid complexes were dissected and prepared for whole mounts or sectioning. For preparation of retinal cross-sections, dissected retinas were laid flat with 4 radial relaxing incisions, placed in 4% PFA, and incubated at 4°C overnight. Retinas were then placed in 20% sucrose at 4°C for 4 hr and embedded in Tissue-Tek OCT compound (Sakura Finetek; Torrance, CA) for cryosectioning. The entire retinas were sectioned, and central sections from at least three retinas from at least three mice were examined. Primary antibodies were used including anti- ZO-1 (Life Sciences, Carlsbad, CA), HIF-1α (Novus Biologicals; Littleton, CO), HIF-2α (Novus Biologicals), and VHL (Santa Cruz Biotechnology; Santa Cruz, CA). Fluorescent-conjugated isolectin Griffonia Simplicifolia IB-4 (Lectin) was also used (Life Sciences). Images were obtained using a confocal microscope (LSM710, Carl Zeiss; Oberkochen, Germany)
In vivo imaging
Request a detailed protocolColor fundus images were captured using a Micron III platform (Phoenix Research Laboratories; Pleasanton, CA). Confocal scanning laser ophthalmoscopy (cSLO) detecting fundus autofluorescence, indocyanine green angiography, and optical coherence tomography (OCT) were performed using Spectralis (Heidelberg Engineering; Heidelberg, Germany) and Envisu (Bioptigen; Durham, NC) instruments.
Quantification of retinal thickness
Request a detailed protocolRetinal thickness values of the ONL, OS, RPE, and choriocapillaris were measured at 600 μm from the optic nerve head from electron micrographs using NIH ImageJ software. RPE thickness measurements were made by measuring the area between end of the basal infoldings and the outer segments of the photoreceptors.
Proteomic and transcriptomic arrays
Request a detailed protocolProteomic arrays for angiogenesis-related proteins (Angiogenesis Proteome Profiling Array, R&D Systems, Inc; Minneapolis, MN) and ELISAs for human VEGF (R&D Systems) were performed according to the manufacturer’s instructions. For mRNA arrays, total RNA was prepared from RPE/choroid complexes using the RNeasy Plus Mini kit (Qiagen; Hilden, Germany) and was reverse transcribed using the RT² First Strand cDNA Kit (Qiagen). mRNA PCR arrays for hypoxia signaling, glucose metabolism, and fatty acid metabolism (RT² Profiler PCR Array for Mouse Hypoxia Signaling Pathway (PAMM-032), Mouse Glucose Metabolism (PAMM-006), and Mouse Fatty Acid Metabolism (PAMM-007), Qiagen) were performed according to the manufacturer’s instructions. Quantitative PCR assays were performed on a real-time PCR System (ABI 7900HT Fast; Thermo Fisher Scientific).
LC-MS/MS based untargeted metabolomics
Request a detailed protocolAfter harvesting, eyes were flash frozen in LN2 and stored at -80°C prior to processing. Eyes were lyophilized overnight. The next day, 500 µL of 10% CHCl3 in MeOH was added to each tube. The eyes were subjected to 5 rounds of vortexing for 30s, frozen in LN2 and sonicated for 10 min at 50°C. The samples where then incubated for 1 hr at −20°C and centrifuged for 10 min @ 13,000 rpm, 4°C in a microcentrifuge. The supernatant was collected in a clean vial, an additoinal 500 µL of 10% CHCl3 in MeOH was added to each eye, and the extraction procedure was repeated. The supernatants were pooled and dried in a centrifugal concentrator. The resulting residue was reconstituted in 100 µL of 1:1 50 mM ammonium formate:MeCN and centrufuged at 13,000 rpm for 10 min in a 4°C microcentrifuge. The supernate was vialed and analyzed via LC-MS.
8 µL of each sample was analyzed on an Agilent 1200 capillary LC connected to an Agilent 6538 UHD-QToF mass spectrometer (Agilent) by injection on a Scherzo SM-18 150 x 2 mm column (Imtakt; Portland, OR) with a flow rate of 200 µL/min. For positive mode analysis, mobile phase A consisted of 0.1% formic acid in H2O and B was 0.1% formic acid in MeCN. The column was equilibrated in 100% A. The gradient was as follows: 0–5 min hold at 0% B, 0 to 100% B over 30 min, hold at 100% B for 10 min. MS data was collected from 80–1000 m/z across the entire chromatographic run, with a capillary voltage of 4000 V, a nebulizer gas flow of 11 L/min, and a pressure of 35 psig. Identical chromatographic conditions were used for metabolite identification via a targeted MS/MS analysis in which fragmentation was induced at 20 V and the product spectra collected from 50 to 1000 m/z. For negative mode analysis, mobile phase A consisted of H2O and B was 90% MeCN with 10% aqueous 50 mM ammonium formate. The column was equilibrated in 100% A. All other parameters were the same as the positive mode.
XCMS was utilized to detect and align metabolic features, providing a matrix of retention time, m/z values, and intensities for each sample (Tautenhahn et al., 2012a). XCMS also provides the fold change and a P-value from an univariate t-test to determine which features are dysregulated. Features were identified by exact mass (m/z), retention time, and MS/MS fragmentation by comparison against the METLIN (http://metlin.scripps.edu/) database (Tautenhahn et al., 2012b). The mean, minimum, and maximum ion intensities were graphed for identified metabolites using Prism.
Statistical analyses
Request a detailed protocolComparisons between the mean variables of two groups were performed by a two-tailed Student’s t-test for mRNA arrays (RT² Profiler PCR Array Data Analysis Template v3.3; Qiagen), LC/MS (XCMS; http://metlin.scripps.edu/xcms/), and other results (Excel; Microsoft). Pp <0.05 was considered to be statistically significant.
References
-
A rat model for choroidal neovascularization using subretinal lipid hydroperoxide injectionThe American Journal of Pathology 176:3085–3097.https://doi.org/10.2353/ajpath.2010.090989
-
Lipids in human lipofuscin-enriched subcellular fractions of two age populations. Comparison with rod outer segments and neural retinaInvestigative Ophthalmology & Visual Science 31:1433–1443.
-
Therapeutic targets in age-related macular diseaseThe Journal of Clinical Investigation 120:3033–3041.https://doi.org/10.1172/JCI42437
-
Geographic atrophy: a histopathological assessmentJAMA Ophthalmology 132:338–345.https://doi.org/10.1001/jamaophthalmol.2013.5799
-
Oxidative stress, hypoxia, and autophagy in the neovascular processes of age-related macular degenerationBioMed Research International 2014:.https://doi.org/10.1155/2014/768026
-
Choroidal blood flow and progression of age-related macular degeneration in the fellow eye in patients with unilateral choroidal neovascularizationInvestigative Ophthalmology & Visual Science 51:4220–4225.https://doi.org/10.1167/iovs.09-4968
-
Altered cytokine profiles of human retinal pigment epithelium: oxidant injury and replicative senescenceMolecular Vision 19:718–728.
-
Genetic variants near TIMP3 and high-density lipoprotein-associated loci influence susceptibility to age-related macular degenerationProceedings of the National Academy of Sciences of the United States of America 107:7401–7406.https://doi.org/10.1073/pnas.0912702107
-
Roles of glucose in photoreceptor survivalThe Journal of Biological Chemistry 286:34700–34711.https://doi.org/10.1074/jbc.M111.279752
-
Association between dietary glycemic index and age-related macular degeneration in nondiabetic participants in the Age-Related Eye Disease StudyThe American Journal of Clinical Nutrition 86:180–188.
-
Dietary hyperglycemia, glycemic index and metabolic retinal diseasesProgress in Retinal and Eye Research 30:18–53.https://doi.org/10.1016/j.preteyeres.2010.09.001
-
Comparison of macular choroidal thickness in adult onset foveomacular vitelliform dystrophy and age-related macular degenerationInvestigative Ophthalmology & Visual Science 55:64–69.https://doi.org/10.1167/iovs.13-12931
-
Basal linear deposit and large drusen are specific for early age-related maculopathyArchives of Ophthalmology 117:329–339.https://doi.org/10.1001/archopht.117.3.329
-
Aging human RPE: morphometric analysis of macular, equatorial, and peripheral cellsInvestigative Ophthalmology & Visual Science 25:195–200.
-
The lipofuscin component A2E selectively inhibits phagolysosomal degradation of photoreceptor phospholipid by the retinal pigment epitheliumProceedings of the National Academy of Sciences of the United States of America 99:3842–3847.https://doi.org/10.1073/pnas.052025899
-
Prevalence of age-related macular degeneration in the United StatesArchives of Ophthalmology 122:564–572.https://doi.org/10.1001/archopht.122.4.564
-
Drusen and disciform macular detachment and degenerationArchives of Ophthalmology 90:206–217.https://doi.org/10.1001/archopht.1973.01000050208006
-
Acute postnatal ablation of Hif-2alpha results in anemiaProceedings of the National Academy of Sciences of the United States of America 104:2301–2306.https://doi.org/10.1073/pnas.0608382104
-
Vascular tumors in livers with targeted inactivation of the von Hippel-Lindau tumor suppressorProceedings of the National Academy of Sciences of the United States of America 98:1583–1588.https://doi.org/10.1073/pnas.98.4.1583
-
Role of the retinal pigment epithelium in macular diseaseTransactions - American Academy of Ophthalmology and Otolaryngology. American Academy of Ophthalmology and Otolaryngology 76:64–80.
-
Analysis of lipid deposits extracted from human macular and peripheral Bruch's membraneArchives of Ophthalmology 112:402–406.https://doi.org/10.1001/archopht.1994.01090150132035
-
Patterns of increased in vivo fundus autofluorescence in the junctional zone of geographic atrophy of the retinal pigment epithelium associated with age-related macular degenerationGraefe's Archive for Clinical and Experimental Ophthalmology 237:145–152.https://doi.org/10.1007/s004170050209
-
Regulation of hypoxia-inducible factor 1alpha expression and function by the mammalian target of rapamycinMolecular and Cellular Biology 22:7004–7014.https://doi.org/10.1128/mcb.22.20.7004-7014.2002
-
Retinosomes: new insights into intracellular managing of hydrophobic substances in lipid bodiesThe Journal of Cell Biology 166:447–453.https://doi.org/10.1083/jcb.200405110
-
Age-related macular degenerationThe New England Journal of Medicine 358:2606–2617.https://doi.org/10.1056/NEJMra0801537
-
Genetic association of apolipoprotein E with age-related macular degenerationAmerican Journal of Human Genetics 63:200–206.https://doi.org/10.1086/301901
-
Generation of retinal pigment epithelial cells from small molecules and OCT4 reprogrammed human induced pluripotent stem cellsStem Cells Translational Medicine 1:96–109.https://doi.org/10.5966/sctm.2011-0057
-
Targeted deletion of Vegfa in adult mice induces vision lossThe Journal of Clinical Investigation 122:4213–4217.https://doi.org/10.1172/JCI65157
-
The lipofuscin fluorophore A2E perturbs cholesterol metabolism in retinal pigment epithelial cellsProceedings of the National Academy of Sciences of the United States of America 104:11026–11031.https://doi.org/10.1073/pnas.0702504104
-
Inducible expression of cre recombinase in the retinal pigmented epitheliumInvestigative Ophthalmology & Visual Science 49:1248–1253.https://doi.org/10.1167/iovs.07-1105
-
Temporal requirement of RPE-derived VEGF in the development of choroidal vasculatureJournal of Neurochemistry 112:1584–1592.https://doi.org/10.1111/j.1471-4159.2010.06573.x
-
Correlation between subfoveal choroidal thickness and the severity or progression of nonexudative age-related macular degenerationInvestigative Ophthalmology & Visual Science 54:7812–7818.https://doi.org/10.1167/iovs.13-12284
-
Flow of energy in the outer retina in darkness and in lightProceedings of the National Academy of Sciences of the United States of America 107:8599–8604.https://doi.org/10.1073/pnas.1002471107
-
Neural remodeling in retinal degenerationProgress in Retinal and Eye Research 22:607–655.https://doi.org/10.1016/s1350-9462(03)00039-9
-
Vascular endothelial growth factor expression in the retinal pigment epithelium is essential for choriocapillaris development and visual functionThe American Journal of Pathology 167:1451–1459.https://doi.org/10.1016/S0002-9440(10)61231-X
-
Relationship between RPE and choriocapillaris in age-related macular degenerationInvestigative Ophthalmology & Visual Science 50:4982–4991.https://doi.org/10.1167/iovs.09-3639
-
Pharmacological Hif2α inhibition improves VHL disease-associated phenotypes in zebrafish modelThe Journal of Clinical Investigation 125:1987–1997.https://doi.org/10.1172/JCI73665
-
Age-related variation in the hydraulic conductivity of Bruch's membraneInvestigative Ophthalmology & Visual Science 36:1290–1297.
-
Choriocapillaris vascular dropout related to density of drusen in human eyes with early age-related macular degenerationInvestigative Ophthalmology & Visual Science 52:1606–1612.https://doi.org/10.1167/iovs.10-6476
-
Genome-wide association study of advanced age-related macular degeneration identifies a role of the hepatic lipase gene (LIPC)Proceedings of the National Academy of Sciences of the United States of America 107:7395–7400.https://doi.org/10.1073/pnas.0912019107
-
Morphometric analysis of Bruch's membrane, the choriocapillaris, and the choroid in agingInvestigative Ophthalmology & Visual Science 35:2857–2864.
-
Changes of retinal capillary blood flow in age-related maculopathyGraefe's Archive for Clinical and Experimental Ophthalmology 238:960–964.https://doi.org/10.1007/s004170000202
-
Acylcarnitine profile analysisGenetics in Medicine 10:151–156.https://doi.org/10.1097/GIM.0b013e3181614289
-
Resistance to targeted therapy in renal-cell carcinomaThe Lancet. Oncology 10:992–1000.https://doi.org/10.1016/S1470-2045(09)70240-2
-
Development of inhibitors of the PAS-B domain of the HIF-2α transcription factorJournal of Medicinal Chemistry 56:1739–1747.https://doi.org/10.1021/jm301847z
-
Blue light-induced reactivity of retinal age pigment. in vitro generation of oxygen-reactive speciesThe Journal of Biological Chemistry 270:18825–18830.https://doi.org/10.1074/jbc.270.32.18825
-
Prevalence and morphology of druse types in the macula and periphery of eyes with age-related maculopathyInvestigative Ophthalmology & Visual Science 49:1200–1209.https://doi.org/10.1167/iovs.07-1466
-
Hypoxia-inducible factor-1alpha is a positive factor in solid tumor growthCancer Research 60:4010–4015.
-
An essential role for RPE-derived soluble VEGF in the maintenance of the choriocapillarisProceedings of the National Academy of Sciences of the United States of America 106:18751–18756.https://doi.org/10.1073/pnas.0905010106
-
Lipid metabolism in cancerThe FEBS Journal 279:2610–2623.https://doi.org/10.1111/j.1742-4658.2012.08644.x
-
Ageing and degeneration in the macular region: a clinico-pathological studyThe British Journal of Ophthalmology 60:324–341.https://doi.org/10.1136/bjo.60.5.324
-
Relationship of Basal laminar deposit and membranous debris to the clinical presentation of early age-related macular degenerationInvestigative Ophthalmology & Visual Science 48:968–977.https://doi.org/10.1167/iovs.06-0443
-
Allosteric inhibition of hypoxia inducible factor-2 with small moleculesNature Chemical Biology 9:271–276.https://doi.org/10.1038/nchembio.1185
-
Photodamage to human RPE cells by A2-E, a retinoid component of lipofuscinInvestigative Ophthalmology & Visual Science 41:2303–2308.
-
Regulation of cancer cell metabolism by hypoxia-inducible factor 1Seminars in Cancer Biology 19:12–16.https://doi.org/10.1016/j.semcancer.2008.11.009
-
Oxygen sensing, homeostasis, and diseaseThe New England Journal of Medicine 365:537–547.https://doi.org/10.1056/NEJMra1011165
-
Expression of hypoxia-inducible factor-1alpha and -2alpha in human choroidal neovascular membranesGraefe's Archive for Clinical and Experimental Ophthalmology 247:1361–1367.https://doi.org/10.1007/s00417-009-1133-3
-
The epsilon4 allele of the apolipoprotein E gene as a potential protective factor for exudative age-related macular degenerationAmerican Journal of Ophthalmology 125:353–359.https://doi.org/10.1016/s0002-9394(99)80146-9
-
A2E, a lipofuscin fluorophore, in human retinal pigmented epithelial cells in cultureInvestigative Ophthalmology & Visual Science 40:2988–2995.
-
The lipofuscin fluorophore A2E mediates blue light-induced damage to retinal pigmented epithelial cellsInvestigative Ophthalmology & Visual Science 41:1981–1989.
-
Morphometric analysis of the choroid, Bruch's membrane, and retinal pigment epithelium in eyes with age-related macular degenerationInvestigative Ophthalmology & Visual Science 37:2724–2735.
-
Histologic and morphometric analysis of the choroid, Bruch's membrane, and retinal pigment epithelium in postmortem eyes with age-related macular degeneration and histologic examination of surgically excised choroidal neovascular membranesSurvey of Ophthalmology 44 Suppl 1:S10–32.https://doi.org/10.1016/s0039-6257(99)00086-7
-
Decreasing hydraulic conductivity of Bruch's membrane: relevance to photoreceptor survival and lipofuscinosesAmerican Journal of Medical Genetics 57:235–237.https://doi.org/10.1002/ajmg.1320570224
-
Hydrodynamics of ageing Bruch's membrane: implications for macular diseaseExperimental Eye Research 62:565–572.https://doi.org/10.1006/exer.1996.0066
-
Localization of the site of major resistance to fluid transport in Bruch's membraneInvestigative Ophthalmology & Visual Science 38:762–767.
-
The retinal pigment epithelium in visual functionPhysiological Reviews 85:845–881.https://doi.org/10.1152/physrev.00021.2004
-
Lipid hydroperoxide stimulates subretinal choroidal neovascularization in the rabbitExperimental Eye Research 74:301–308.https://doi.org/10.1006/exer.2001.1121
-
XCMS Online: a web-based platform to process untargeted metabolomic dataAnalytical Chemistry 84:5035–5039.https://doi.org/10.1021/ac300698c
-
An accelerated workflow for untargeted metabolomics using the METLIN databaseNature Biotechnology 30:826–828.https://doi.org/10.1038/nbt.2348
-
Fundus autofluorescence in age-related macular disease imaged with a laser scanning ophthalmoscopeInvestigative Ophthalmology & Visual Science 38:478–486.https://doi.org/10.1136/bjo.82.4.346
-
Bilateral confluent drusenArchArchives Ophthalmolof Ophthalmology 68:219–226.https://doi.org/10.1001/archopht.1962.00960030223013
-
Age-related macular degeneration: review of pathogenesisEuropean Journal of Ophthalmology 8:199–206.
-
Validity of Automated Choroidal Segmentation in SS-OCT and SD-OCTInvestigative Ophthalmology & Visual Science 56:3202–3211.https://doi.org/10.1167/iovs.14-15669
-
mTOR-mediated dedifferentiation of the retinal pigment epithelium initiates photoreceptor degeneration in miceThe Journal of Clinical Investigation 121:369–383.https://doi.org/10.1172/JCI44303
-
The role of hypoxia-inducible factor-2 in digestive system cancersCell Death & Disease 6:e1600.https://doi.org/10.1038/cddis.2014.565
Article and author information
Author details
Martin Friedlander

Funding
National Eye Institute (EY11254)
- Martin Friedlander
The Lowy Medical Research Institute (MacTel Project)
- Martin Friedlander
Manpei Suzuki Diabetes Foundation (Postdoctoral support)
- Toshihide Kurihara
Japan Society for the Promotion of Science Postdoctoral Fellowships for Research Abroad (Postdoctoral support)
- Toshihide Kurihara
National Eye Institute (Postdoctoral support)
- Peter D Westenskow
The funders had no role in study design, data collection and interpretation, or the decision to submit the work for publication.
Acknowledgements
We would like to thank Drs. Alan Bird, Mike Dorrell, and Lea Scheppke for critically evaluating the manuscript. Dr. Malcolm R Wood at the Core Microscopy Facility at TSRI provided excellent technical assistance, Dr. Yun-Zheng Le (University of Oklahoma Health Sciences Center) and Dr. Randall S Johnson (University of Cambridge) kindly provided transgenic mice. This work was supported by grants to M Friedlander from the National Eye Institute (EY-11254) and the Lowy Medical Research Institute (MacTel). T Kurihara is supported by a fellowship from the Manpei Suzuki Diabetes Foundation and The Japan Society for the Promotion of Science Postdoctoral (JSPS) Fellowships for Research Abroad. PD Westenskow is a Ruth L Kirschstein Fellow of the NIH (EY021416).
Ethics
Animal experimentation: This study was performed in strict accordance with the recommendations in the Guide for the Care and Use of Laboratory Animals of the National Institutes of Health. All of the animals were handled according to approved institutional animal care and use committee (IACUC) protocols (#08-0045-3) of the Scripps Research Institute. All surgery was performed under isofluorane and/or ketamine/xylazine anesthesia, and every effort was made to minimize suffering.
Copyright
This is an open-access article, free of all copyright, and may be freely reproduced, distributed, transmitted, modified, built upon, or otherwise used by anyone for any lawful purpose. The work is made available under the Creative Commons CC0 public domain dedication.
Metrics
-
- 5,799
- views
-
- 1,387
- downloads
-
- 192
- citations
Views, downloads and citations are aggregated across all versions of this paper published by eLife.
Citations by DOI
-
- 192
- citations for umbrella DOI https://doi.org/10.7554/eLife.14319
Download links
A two-part list of links to download the article, or parts of the article, in various formats.
Downloads (link to download the article as PDF)
Open citations (links to open the citations from this article in various online reference manager services)
Cite this article (links to download the citations from this article in formats compatible with various reference manager tools)
Hypoxia-induced metabolic stress in retinal pigment epithelial cells is sufficient to induce photoreceptor degeneration
eLife 5:e14319.
https://doi.org/10.7554/eLife.14319


