Genetic and environmental influences on adult human height across birth cohorts from 1886 to 1994
- University of Helsinki, Finland
- University of the Basque Country, Spain
- Mokpo National University, South Korea
- Osaka City University, Japan
- Institute of Research & Development, Sri Lanka
- Rajarata University of Sri Lanka, Sri Lanka
- NIHR Mental Health Biomedical Research Centre, South London and Maudsley NHS Foundation Trust and, Institute of Psychiatry Psychology and Neuroscience, King's College London, United Kingdom
- Keele University, United Kingdom
- King's College London, United Kingdom
- Institute of Public Health, University of Southern Denmark, Denmark
- Qingdao University Medical College, China
- Qingdao Centers for Disease Control and Prevention, China
- Kirikkale University, Turkey
- Karabuk University, Turkey
- Virginia Commonwealth University, United States
- Semmelweis University, Hungary
- Hungarian Twin Registry, Hungary
- University of Southern Denmark, Denmark
- Odense University Hospital, Denmark
- The University of Melbourne, Australia
- Seoul National University, Korea
- University of Murcia, Spain
- IMIB-Arrixaca, Spain
- QIMR Berghofer Medical Research Institute, Australia
- University of Southern California, United States
- USC Norris Comprehensive Cancer Center, United States
- Seoul National University, South-Korea
- Sungkyunkwan University School of Medicine, South-Korea
- Inje University College of Medicine, Korea
- University of California, San Diego, United States
- VA San Diego Center of Excellence for Stress and Mental Health, United States
- Boston University, United States
- HealthTwiSt GmbH, Germany
- Colorado State University, United States
- Duke University, United States
- Bielefeld University, Germany
- University of British Columbia, Canada
- Karolinska Institutet, Sweden
- The National Academies of Sciences, Engineering, and Medicine, United States
- Istituto Superiore di Sanità - National Center for Epidemiology, Surveillance and Health Promotion, Italy
- Washington State University - Health Sciences Spokane, United States
- Washington State University, United States
- University Hospitals Leuven, Belgium
- Ghent University Hospitals, Belgium
- Icahn School of Medicine at Mount Sinai, United States
- Stanford University School of Medicine, United States
- SRI International, United States
- Jönköping University, Sweden
- Goldsmiths, University of London, United Kingdom
- Örebro University, Sweden
- Healthy Twin Association of Mongolia, Mongolia
- Hiroshima University, Japan
- King's College, United Kingdom
- VU University Amsterdam, Netherlands
- Michigan State University, United States
- Norwegian Institute of Public Health, Norway
- University of Minnesota, United States
- University of Colorado, United States
- University of Washington, United States
- Osaka University, Japan
- Kio University, Japan
- University of Copenhagen, Denmark
- Bispebjerg and Frederiksberg Hospitals, Denmark
- Institute for Molecular Medicine FIMM, Finland
Abstract
Human height variation is determined by genetic and environmental factors, but it remains unclear whether their influences differ across birth-year cohorts. We conducted an individual-based pooled analysis of 40 twin cohorts including 143,390 complete twin pairs born 1886–1994. Although genetic variance showed a generally increasing trend across the birth-year cohorts, heritability estimates (0.69-0.84 in men and 0.53-0.78 in women) did not present any clear pattern of secular changes. Comparing geographic-cultural regions (Europe, North America and Australia, and East Asia), total height variance was greatest in North America and Australia and lowest in East Asia, but no clear pattern in the heritability estimates across the birth-year cohorts emerged. Our findings do not support the hypothesis that heritability of height is lower in populations with low living standards than in affluent populations, nor that heritability of height will increase within a population as living standards improve.
https://doi.org/10.7554/eLife.20320.001Introduction
Height is a classic anthropometric quantitative trait in humans due to its ease of measurement, approximately normal distribution and relative stability in adulthood. Since the studies of height in the late 19th and early 20th centuries (Galton, 1886; Pearson and Lee, 1903; Fisher, 1919), twin, adoption and family studies have shown that height is one of the most heritable human quantitative phenotypes (Silventoinen, 2003). More recently, genetic linkage studies have helped to elucidate the location of genetic effects in the genome (Perola et al., 2007) and genome-wide association (GWA) studies allowed identification of loci consistently associated with height in populations of different ancestry (Cho et al., 2009; Hao et al., 2013; Lango Allen et al., 2010; N'Diaye et al., 2011; Wood et al., 2014). Besides the genetic factors, a multitude of environmental factors, such as nutrition and childhood diseases, operate during the growth period and can affect the final attained height. These and other proximate biological determinants of height are further associated with social and economic conditions, which in turn are associated with living standards (Bozzoli et al., 2009; Bogin, 2001; Eveleth and Tanner, 1990; Steckel, 2009). The secular trend of increasing height over the 20th century observed in many parts of the world, which has slowed or stopped in most northern European countries, probably reflects the continuous improvement in the standard of living (Eveleth and Tanner, 1990; Cole, 2003; Stulp and Barrett, 2016). A recent study showed that the height difference between the tallest and shortest populations a century ago (19–20 cm) has remained the same for women and increased for men (NCD Risk Factor Collaboration (NCD-RisC), 2016) .
Twin and family studies have consistently estimated that the proportion of variation in adult height explained by genetic differences between individuals, or heritability, in general populations is approximately 0.80 (Fisher, 1919; Silventoinen et al., 2003; Stunkard et al., 1986). There is a hypothesis that heritability is not constant and can differ in environments having different amount of environmental variation. Accordingly, it has been suggested that heritability of height is lower in populations with low living standards compared with affluent populations since poverty can lead to a lack of basic necessities important for human growth in part of the population (Steckel, 2009). However, there is little direct evidence on this issue. A study in Finnish twins born between 1900 and 1957 showed that the heritability of height increased across birth cohorts born in the first half of the century when the standard of living increased and leveled off after World War II thus supporting this hypothesis (Silventoinen et al., 2000). Because this result needs to be replicated, we conducted an individual-based analysis of 40 twin cohorts from 20 countries. We aimed to analyze (i) the genetic and environmental contribution to the variation of adult height across nine birth-year cohorts covering more than 100 years and (ii) to assess whether the pattern varies by geographic-cultural region (Europe, North America and Australia, and East Asia).
Results
In the pooled data (all twin cohorts together), mean height was greater in men than in women and increased over the birth-year cohorts in both sexes; the decrease ( > 1 cm) observed in the latest birth cohort mainly reflects differences in the distribution of different twin cohorts within each group (Table 1). Both means and variances were significantly different between twin cohorts in all birth-year and sex groups. Mean height was shorter in East Asia than in Europe and North America and Australia in all birth-year and sex groups. The increase in mean height over the birth cohorts (from 1940–1949 to 1980–1994) was substantially greater in East Asia than in the other two geographic-cultural regions. The variance of height was generally greater in men than in women, lowest in East Asia and greatest in North America and Australia, and showed a general trend to increase over the birth cohorts.
Table 1
Descriptive statistics of age and height by sex, birth year and geographic-cultural region. Names list of the participating twin cohorts in this study: two cohorts from Australia (Australian Twin Registry and Queensland Twin Register), six cohorts from East-Asia (Korean Twin-Family Register, Mongolian Twin Registry, Osaka University Aged Twin Registry, South Korea Twin Registry, Qingdao Twin Registry of Adults and West Japan Twins and Higher Order Multiple Births Registry), 18 cohorts from Europe (Adult Netherlands Twin Registry, Berlin Twin Register, Bielefeld Longitudinal Study of Adult Twins, Danish Twin Cohort, East Flanders Prospective Twin Survey, Finnish Older Twin Cohort, FinnTwin12, FinnTwin16, Genesis 12–19 Study, Hungarian Twin Registry, Italian Twin Registry, Murcia Twin Registry, Norwegian Twin Registry, Swedish Twin Cohorts, Swedish Young Male Twins Study of Adults, TCHAD-study, TwinsUK and Young Netherlands Twin Registry), two cohorts from South-Asia and Middle-East (Sri Lanka Twin Registry and Turkish Twin Study) and 12 cohorts from North-America (California Twin Program, Carolina African American Twin Study of Aging, Colorado Twin Registry, Michigan State University Twin Registry, Mid Atlantic Twin Registry, Minnesota Twin Registry, NAS-NRC Twin Registry, SRI-international, University of British Columbia Twin Project, University of Southern California Twin Study, University of Washington Twin Registry and Vietnam Era Twin Study of Aging).
Age | Height | ||||||||||||||||||
|---|---|---|---|---|---|---|---|---|---|---|---|---|---|---|---|---|---|---|---|
All cohorts | All cohorts | Europe | NA and Australia | East Asia | |||||||||||||||
Birth year | Mean | SD | Range | N | Mean (F, p-value)* | SD (F, p-value)† | N | Mean | SD | N | Mean | SD | N | Mean | SD | ||||
Men | |||||||||||||||||||
1886–1909 | 67.0 | 7.5 | 53.5–99.2 | 3747 | 171.6 (15, < 0.001) | 6.34 (2.5,0.019) | 3569 | 171.5 | 6.27 | 178 | 174.6 | 6.88 | |||||||
1910–1919 | 52.2 | 16.2 | 20.0–95.8 | 9171 | 174.2 (23, < 0.001) | 6.72 (5.0,<0.001) | 4117 | 173.3 | 6.37 | 5052 | 174.9 | 6.91 | |||||||
1920–1929 | 51.6 | 16.1 | 20.0–90.9 | 23147 | 175.4 (62, < 0.001) | 6.81 (5.7,<0.001) | 6382 | 173.9 | 6.42 | 16714 | 176.0 | 6.82 | |||||||
1930–1939 | 57.5 | 10.5 | 33.5–83.2 | 12028 | 175.7 (413, < 0.001) | 6.70 (2.9,<0.001) | 9308 | 175.2 | 6.42 | 2658 | 178.1 | 6.78 | |||||||
1940–1949 | 49.3 | 10.6 | 23.5–73.9 | 22967 | 177.4 (72, < 0.001) | 6.73 (2.5,<0.001) | 16629 | 177.0 | 6.53 | 6235 | 178.4 | 6.95 | 68 | 164.8 | 6.57 | ||||
1950–1959 | 41.4 | 10.0 | 19.5–65.0 | 24560 | 178.4 (120, < 0.001) | 6.96 (6.5,<0.001) | 15199 | 178.5 | 6.73 | 9124 | 178.7 | 7.04 | 161 | 167.1 | 4.79 | ||||
1960–1969 | 35.5 | 7.1 | 19.5–54.0 | 13264 | 179.0 (99, < 0.001) | 7.49 (2.3,<0.001) | 6218 | 179.6 | 7.04 | 6574 | 179.2 | 7.22 | 298 | 168.1 | 6.24 | ||||
1970–1979 | 28.7 | 5.4 | 19.5–44.0 | 14975 | 179.9 (121, < 0.001) | 7.55 (5.5,<0.001) | 10339 | 180.7 | 7.01 | 3906 | 179.7 | 7.51 | 456 | 170.1 | 5.68 | ||||
1980–1994 | 23.1 | 3.2 | 19.5–34.4 | 9948 | 178.4 (70, < 0.001) | 7.59 (4.9,<0.001) | 5077 | 178.8 | 7.22 | 4066 | 179.4 | 7.49 | 329 | 173.1 | 6.37 | ||||
Women | |||||||||||||||||||
1886–1909 | 68.5 | 8.1 | 53.5–98.0 | 5423 | 160.2 (23, < 0.001) | 6.14 (3.3,0.006) | 5011 | 160.2 | 6.11 | 412 | 160.2 | 6.41 | |||||||
1910–1919 | 62.0 | 10.9 | 43.6–95.9 | 7169 | 161.1 (18, < 0.001) | 5.93 (2.5,0.002) | 5621 | 161.0 | 5.85 | 1548 | 161.2 | 6.20 | |||||||
1920–1929 | 59.7 | 11.4 | 37.5–91.7 | 10975 | 162.1 (65, < 0.001) | 5.99 (3.8,<0.001) | 7908 | 162.0 | 5.89 | 3052 | 162.4 | 6.16 | |||||||
1930–1939 | 57.9 | 10.0 | 33.5–83.0 | 14610 | 162.7 (249, < 0.001) | 6.05 (5.8,<0.001) | 11226 | 162.5 | 5.83 | 3344 | 163.2 | 6.49 | |||||||
1940–1949 | 49.9 | 10.2 | 23.5–74.0 | 28537 | 163.7 (175, < 0.001) | 6.19 (10.3,<0.001) | 20097 | 163.9 | 5.93 | 8285 | 163.5 | 6.57 | 100 | 153.6 | 5.33 | ||||
1950–1959 | 41.3 | 9.5 | 19.5–64.0 | 31250 | 164.4 (146, < 0.001) | 6.58 (13.6,<0.001) | 18817 | 164.8 | 6.22 | 12080 | 164.1 | 6.78 | 225 | 155.1 | 5.10 | ||||
1960–1969 | 35.8 | 6.9 | 19.5–54.3 | 20422 | 165.1 (163, < 0.001) | 7.00 (8.6,<0.001) | 9604 | 166.2 | 6.58 | 10182 | 164.6 | 6.87 | 438 | 156.8 | 5.17 | ||||
1970–1979 | 29.3 | 5.4 | 19.5–44.3 | 19893 | 165.9 (180, < 0.001) | 7.27 (11.5,<0.001) | 11819 | 167.3 | 6.67 | 7034 | 165.0 | 7.22 | 718 | 158.5 | 5.58 | ||||
1980–1994 | 23.4 | 3.3 | 19.5–34.3 | 14694 | 164.7 (118, < 0.001) | 7.07 (6.2,<0.001) | 7291 | 165.6 | 6.77 | 6274 | 164.9 | 6.96 | 633 | 159.8 | 5.74 | ||||
-
*Welch ANOVA test for equality of means
-
†Levene’s test for equality of variances; SD: standard deviation
The variance of adult height explained by additive genetic, shared environmental and unique environmental factors by birth-year cohorts is presented in Figure 1 (estimates with 95% confidence intervals (CIs) are available in Supplementary file 1A). In men, there was a trend for an increasing total variance from birth cohort 1940–1949 onwards; genetic variance also increased during this period but especially in the two latest birth-year cohorts (1970–1979 and 1980–1994). Height variance due to the environment shared by co-twins was significant from birth cohorts 1920–1929 to 1970–1979, being greatest from 1950 to 1969. The effect of environmental factors unique to each twin individual including measurement error was more similar across birth-year cohorts. Heritability estimates ranged from 0.69 to 0.84 and were greatest in the two earliest and the two latest birth-year cohorts (Table 2). In women, although the total variance also started to increase from birth cohort 1940–1949, genetic variance showed an increasing trend from the earliest birth-year cohort. Both shared and unique environmental factors explained variation in height in all analyzed birth-year cohorts; whereas the shared environmental variance was somewhat greater in the latest cohorts (1970–1979 and 1980–1994) unique environmental variance was greatest in the earliest one. Although the variance components differed between sexes in all birth-year cohorts, the relative contribution of the genetic and environmental variance components did not differ by sex from 1930–1939 to 1960–1969 (Supplementary file1B). In contrast to the results in men, heritability estimates in women (0.53 to 0.78) were lowest in the earliest and latest cohorts, particularly in 1886–1909. When we studied the effect of birth year on the genetic variance by using gene-environment interaction models, modest but statistically significant increase was found. The interaction effect was 0.050 (95% CI 0.018–0.082) in men and 0.043 (95% CI 0.019–0.071) in women for the genetic path coefficient per 10 years. This turns to 1.37 (95% CI 0.50–2.27) increase of genetic variance in men and 1.07 (95% CI 0.46–1.79) increase of genetic variance in women per 25 years, i.e. approximately one human generation.
Figure 1
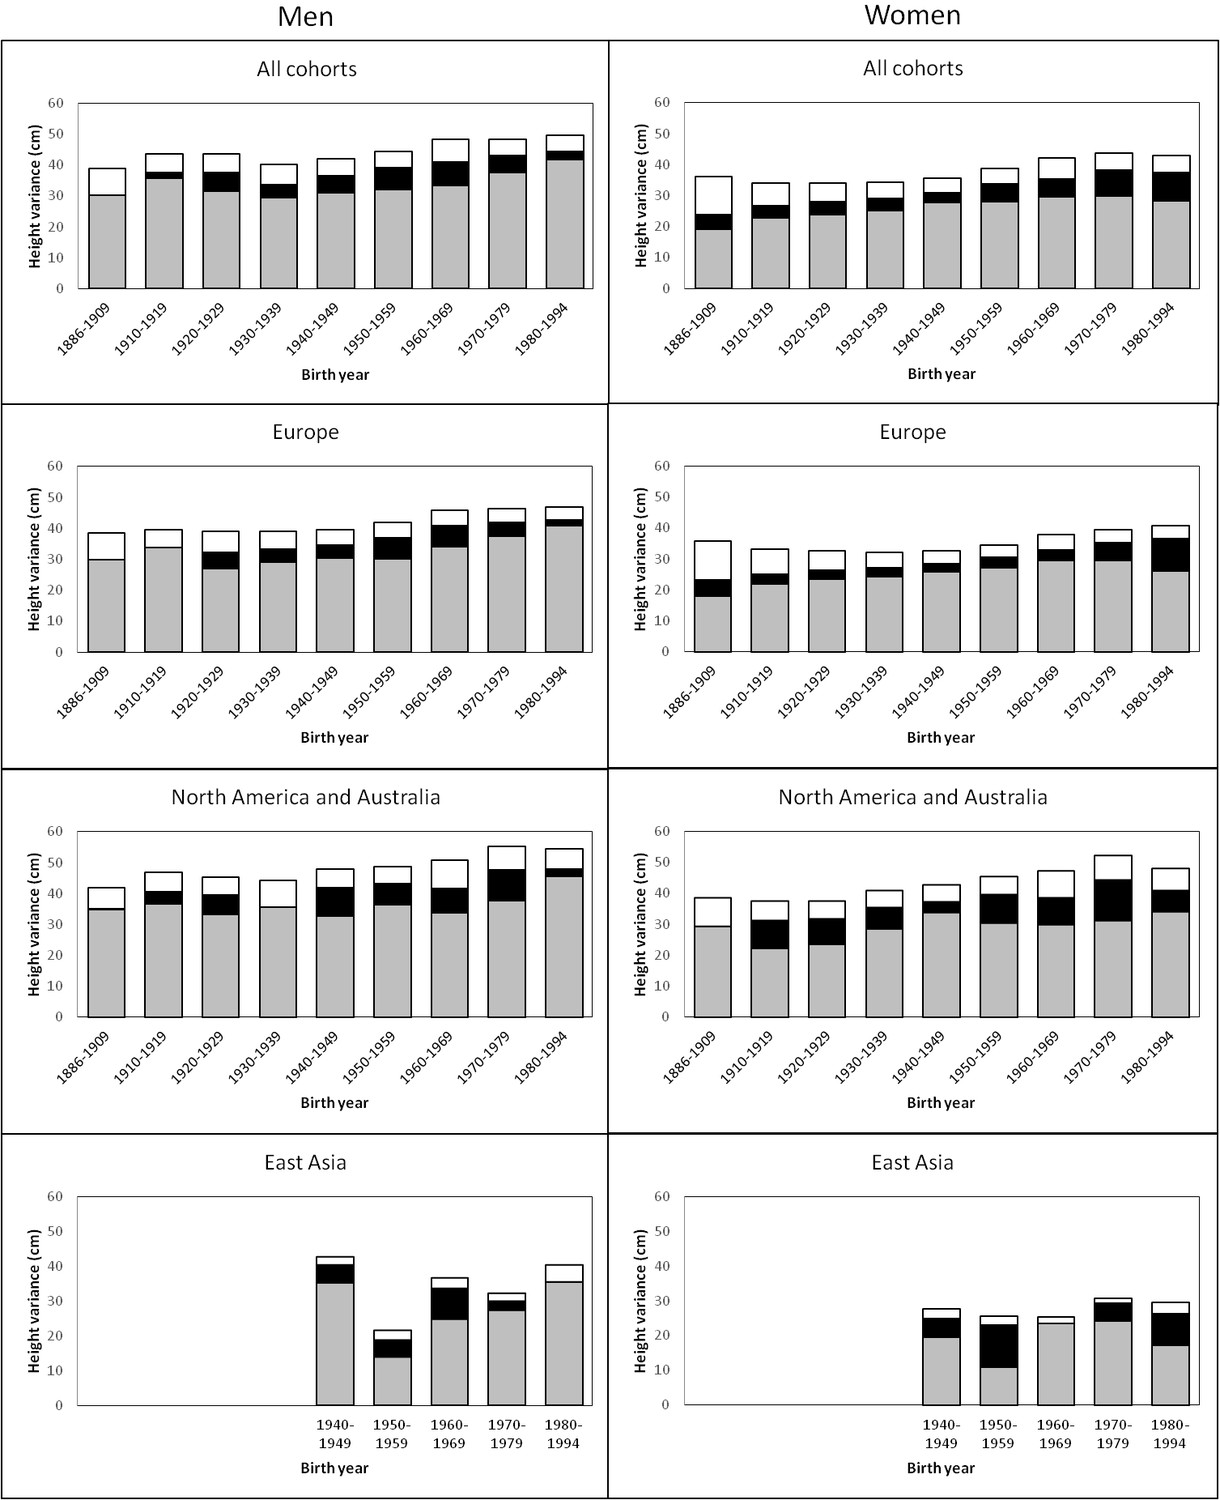
Additive genetic (grey), shared environmental (black) and unique environmental (white) variances of height across birth-year cohorts for the pooled data and by geographic-cultural region.
https://doi.org/10.7554/eLife.20320.003
Table 2
Proportion of the height variance explained by additive genetic, shared environmental and unique environmental factors by birth year, sex and geographic-cultural region.
Men | Women | ||||||||||||||||||||||
|---|---|---|---|---|---|---|---|---|---|---|---|---|---|---|---|---|---|---|---|---|---|---|---|
Additive genetics | Shared environment | Unique environment | Additive genetics | Shared environment | Unique environment | ||||||||||||||||||
Birth year | A | 95% CIs | C | 95% CIs | E | 95% CIs | A | 95% CIs | C | 95% CIs | E | 95% CIs | |||||||||||
All cohorts | |||||||||||||||||||||||
1886–1909 | 0.78 | 0.69 | 0.80 | 0.00 | 0.00 | 0.08 | 0.22 | 0.20 | 0.25 | 0.53 | 0.43 | 0.62 | 0.13 | 0.05 | 0.21 | 0.34 | 0.31 | 0.37 | |||||
1910–1919 | 0.82 | 0.76 | 0.87 | 0.04 | 0.00 | 0.10 | 0.14 | 0.13 | 0.15 | 0.67 | 0.60 | 0.74 | 0.11 | 0.04 | 0.18 | 0.22 | 0.20 | 0.24 | |||||
1920–1929 | 0.72 | 0.69 | 0.76 | 0.14 | 0.10 | 0.17 | 0.14 | 0.13 | 0.15 | 0.70 | 0.64 | 0.76 | 0.12 | 0.07 | 0.18 | 0.18 | 0.17 | 0.19 | |||||
1930–1939 | 0.73 | 0.68 | 0.79 | 0.10 | 0.04 | 0.16 | 0.16 | 0.15 | 0.18 | 0.74 | 0.68 | 0.79 | 0.11 | 0.06 | 0.16 | 0.15 | 0.14 | 0.16 | |||||
1940–1949 | 0.74 | 0.70 | 0.78 | 0.13 | 0.09 | 0.17 | 0.13 | 0.12 | 0.13 | 0.78 | 0.75 | 0.82 | 0.09 | 0.05 | 0.13 | 0.13 | 0.12 | 0.13 | |||||
1950–1959 | 0.72 | 0.69 | 0.76 | 0.16 | 0.12 | 0.20 | 0.12 | 0.11 | 0.12 | 0.73 | 0.69 | 0.76 | 0.15 | 0.11 | 0.18 | 0.12 | 0.12 | 0.13 | |||||
1960–1969 | 0.69 | 0.63 | 0.76 | 0.16 | 0.09 | 0.21 | 0.15 | 0.14 | 0.16 | 0.70 | 0.66 | 0.75 | 0.14 | 0.09 | 0.18 | 0.16 | 0.15 | 0.17 | |||||
1970–1979 | 0.77 | 0.72 | 0.83 | 0.11 | 0.06 | 0.17 | 0.11 | 0.10 | 0.12 | 0.68 | 0.64 | 0.73 | 0.19 | 0.14 | 0.23 | 0.13 | 0.12 | 0.13 | |||||
1980–1994 | 0.84 | 0.77 | 0.90 | 0.05 | 0.00 | 0.13 | 0.11 | 0.10 | 0.12 | 0.66 | 0.61 | 0.72 | 0.21 | 0.16 | 0.27 | 0.13 | 0.12 | 0.13 | |||||
Europe | |||||||||||||||||||||||
1886–1909 | 0.78 | 0.69 | 0.80 | 0.00 | 0.00 | 0.08 | 0.22 | 0.20 | 0.25 | 0.50 | 0.40 | 0.60 | 0.14 | 0.06 | 0.23 | 0.35 | 0.32 | 0.39 | |||||
1910–1919 | 0.85 | 0.79 | 0.87 | 0.00 | 0.00 | 0.07 | 0.15 | 0.13 | 0.16 | 0.66 | 0.58 | 0.74 | 0.10 | 0.02 | 0.17 | 0.24 | 0.22 | 0.26 | |||||
1920–1929 | 0.69 | 0.62 | 0.76 | 0.14 | 0.07 | 0.20 | 0.17 | 0.16 | 0.19 | 0.72 | 0.65 | 0.79 | 0.09 | 0.03 | 0.16 | 0.19 | 0.17 | 0.21 | |||||
1930–1939 | 0.75 | 0.69 | 0.81 | 0.11 | 0.05 | 0.17 | 0.14 | 0.13 | 0.16 | 0.76 | 0.70 | 0.82 | 0.09 | 0.03 | 0.14 | 0.16 | 0.15 | 0.17 | |||||
1940–1949 | 0.77 | 0.72 | 0.82 | 0.10 | 0.06 | 0.15 | 0.13 | 0.12 | 0.13 | 0.79 | 0.75 | 0.83 | 0.08 | 0.04 | 0.13 | 0.13 | 0.12 | 0.13 | |||||
1950–1959 | 0.72 | 0.68 | 0.77 | 0.16 | 0.11 | 0.20 | 0.12 | 0.11 | 0.12 | 0.79 | 0.75 | 0.83 | 0.09 | 0.05 | 0.13 | 0.12 | 0.11 | 0.13 | |||||
1960–1969 | 0.74 | 0.66 | 0.83 | 0.15 | 0.06 | 0.23 | 0.11 | 0.10 | 0.12 | 0.78 | 0.72 | 0.85 | 0.08 | 0.02 | 0.15 | 0.13 | 0.12 | 0.14 | |||||
1970–1979 | 0.81 | 0.74 | 0.88 | 0.09 | 0.02 | 0.16 | 0.10 | 0.09 | 0.10 | 0.74 | 0.69 | 0.81 | 0.15 | 0.09 | 0.21 | 0.11 | 0.10 | 0.11 | |||||
1980–1994 | 0.87 | 0.77 | 0.92 | 0.04 | 0.00 | 0.14 | 0.09 | 0.08 | 0.10 | 0.64 | 0.57 | 0.72 | 0.26 | 0.18 | 0.32 | 0.10 | 0.09 | 0.11 | |||||
North America and Australia | |||||||||||||||||||||||
1886–1909 | 0.83 | 0.33 | 0.90 | 0.01 | 0.00 | 0.49 | 0.16 | 0.10 | 0.26 | 0.76 | 0.43 | 0.82 | 0.00 | 0.00 | 0.31 | 0.24 | 0.18 | 0.32 | |||||
1910–1919 | 0.78 | 0.70 | 0.87 | 0.09 | 0.00 | 0.17 | 0.13 | 0.12 | 0.15 | 0.60 | 0.44 | 0.78 | 0.24 | 0.06 | 0.39 | 0.16 | 0.14 | 0.19 | |||||
1920–1929 | 0.73 | 0.69 | 0.77 | 0.14 | 0.10 | 0.18 | 0.13 | 0.12 | 0.14 | 0.63 | 0.52 | 0.76 | 0.22 | 0.09 | 0.33 | 0.15 | 0.14 | 0.17 | |||||
1930–1939 | 0.81 | 0.66 | 0.83 | 0.00 | 0.00 | 0.14 | 0.19 | 0.17 | 0.22 | 0.70 | 0.59 | 0.82 | 0.17 | 0.04 | 0.28 | 0.13 | 0.12 | 0.15 | |||||
1940–1949 | 0.69 | 0.61 | 0.77 | 0.19 | 0.10 | 0.27 | 0.13 | 0.12 | 0.14 | 0.80 | 0.72 | 0.87 | 0.08 | 0.00 | 0.15 | 0.13 | 0.12 | 0.14 | |||||
1950–1959 | 0.75 | 0.68 | 0.82 | 0.14 | 0.07 | 0.21 | 0.11 | 0.10 | 0.12 | 0.67 | 0.61 | 0.73 | 0.21 | 0.15 | 0.26 | 0.13 | 0.12 | 0.13 | |||||
1960–1969 | 0.66 | 0.58 | 0.76 | 0.16 | 0.06 | 0.24 | 0.18 | 0.17 | 0.20 | 0.63 | 0.57 | 0.70 | 0.18 | 0.11 | 0.24 | 0.18 | 0.17 | 0.20 | |||||
1970–1979 | 0.68 | 0.57 | 0.81 | 0.18 | 0.05 | 0.29 | 0.14 | 0.13 | 0.16 | 0.60 | 0.53 | 0.67 | 0.25 | 0.18 | 0.32 | 0.15 | 0.14 | 0.16 | |||||
1980–1994 | 0.83 | 0.72 | 0.89 | 0.04 | 0.00 | 0.16 | 0.12 | 0.11 | 0.14 | 0.71 | 0.62 | 0.81 | 0.14 | 0.04 | 0.23 | 0.15 | 0.14 | 0.16 | |||||
East Asia | |||||||||||||||||||||||
1940–1949 | 0.83 | 0.33 | 0.97 | 0.12 | 0.00 | 0.61 | 0.05 | 0.03 | 0.12 | 0.71 | 0.17 | 0.94 | 0.19 | 0.00 | 0.73 | 0.10 | 0.06 | 0.18 | |||||
1950–1959 | 0.64 | 0.24 | 0.91 | 0.23 | 0.00 | 0.63 | 0.13 | 0.08 | 0.20 | 0.42 | 0.14 | 0.92 | 0.48 | 0.00 | 0.75 | 0.10 | 0.07 | 0.15 | |||||
1960–1969 | 0.67 | 0.36 | 0.94 | 0.24 | 0.00 | 0.56 | 0.08 | 0.06 | 0.12 | 0.92 | 0.67 | 0.94 | 0.00 | 0.00 | 0.25 | 0.08 | 0.06 | 0.10 | |||||
1970–1979 | 0.85 | 0.51 | 0.95 | 0.08 | 0.00 | 0.43 | 0.07 | 0.05 | 0.09 | 0.79 | 0.52 | 0.96 | 0.17 | 0.00 | 0.43 | 0.05 | 0.04 | 0.06 | |||||
1980–1994 | 0.88 | 0.51 | 0.91 | 0.00 | 0.00 | 0.37 | 0.12 | 0.09 | 0.17 | 0.58 | 0.34 | 0.90 | 0.31 | 0.00 | 0.55 | 0.11 | 0.09 | 0.14 | |||||
Univariate quantitative genetic models for height were then conducted separately in the three geographic-cultural regions (Figure 1 and Supplementary file 1A). The pattern in Europe was practically the same as that observed for the pooled data because it represents a large proportion of the total sample. In North America and Australia, the total variance of height was greater than in Europe, but the pattern of genetic and environmental variances was less consistent across birth-year cohorts. In East Asia, because of the smaller sample size, the magnitude of the variance components between the birth-year cohorts fluctuated more than in the other two geographic-cultural regions. Genetic variance was generally greater in men than in women in the three geographic-cultural regions. Variance components of height (both raw and relative proportion) showed a similar pattern across birth-year cohorts when analyses were performed for men and women together (Supplementary file 1C).
Discussion
This very large twin study showed no clear pattern in the heritability of height across birth-year cohorts and thus does not support the hypothesis that the heritability of height is lower in populations with low living standards compared with affluent populations, nor that the heritability of height will increase within a population as living standards improve. Since infant mortality rates are higher in men than in women, both in singletons (Drevenstedt et al., 2008) and twins (Pongou, 2013), the higher heritability observed for men in the earliest cohorts could be explained by selection effects since those who survived were the genetically more advantaged and thus less vulnerable to environmental conditions. The greater relative environmental effect on height variation in women than in men, although unexpected because women’s growth is considered to be more resistant to environmental influences, is in agreement with the findings in Finnish twins born prior to 1958 (Silventoinen et al., 2000). This might indicate differential access to food and medical care (Eveleth and Tanner, 1990). Women are also more likely to develop osteoporosis leading to shrinking in old age (National Institute of Arthritis and musculoskeletal and Skin Diseases, 2014), which may affect the greater influence of unique environmental factors in women born in 1886–1910. This idea is supported by results showing that although genetic factors play an important role in bone loss in early postmenopausal women, their effect weakens with age and completely disappears with advanced aging (Moayyeri et al., 2012).
Total and genetic variance of height generally increased across birth-year cohorts; gene-birth year interaction analysis showed that the genetic variance increase was only modest even when it was statistically significant in this very large twin cohort. However, part of the increase in total variance in some birth-year cohorts was also due to the increase in shared environmental variance. This suggests that both greater ethnic diversity and variation in living standards have contributed to the secular increase in height variation. The greatest total height variation in North America and Australia was due to both genetic and environmental factors and the pattern of variance components across the birth cohorts was less consistent than in Europe. A recent study across 14 European countries found that many independent loci contribute to population genetic differences in height and estimated that these differences account for 24% of the captured additive genetic variance (Robinson et al., 2015). Therefore, it may be that both allelic frequencies and the effects of genes affecting height vary between the geographic-cultural regions. It has been previously shown that even when the total variance of height was greater in Western populations than in East Asian populations, heritability estimates were largely similar in adolescence (Hur et al., 2008) and from 1 to 19 years of age (Jelenkovic et al., 2016); however, the limited statistical power in the data from East Asia does not allow for comparisons across birth cohorts.
The main strength of the present study is the very large sample size of our multinational database of twin cohorts, with adult height data from individuals born between year 1886 and 1994, allowing a more detailed investigation of the genetic and environmental contributions to individual differences in height across birth cohorts than in the previous studies. Important advantages of individual-based data are improved opportunities for statistical modeling and lack of publication bias. This type of analysis is difficult to perform by using literature-based meta-analyses because most of the published studies do not provide the needed statistics by birth-year cohorts. However, our study also has limitations. Countries and/or ethnic-cultural regions are not equally represented and the database is heavily weighted toward populations following Westernized lifestyles. In the classical twin design, parental phenotypic assortment increases dizygotic correlations and thus inflates the shared environmental component when not accounted for in the modeling. In our database, we do not have information on parental height and thus could not take into account assortative mating, which may thus explain part of the shared environmental variation. In addition, most of the height measures were self-reported (Silventoinen et al., 2015), which may bias our analyses toward higher estimates of unique environmental effects due to increased measurement error. However, these sources of bias are unlikely to explain our main result, i.e., relatively similar heritability estimates of adult height over birth cohorts. Finally, since we previously showed that there was no zygosity difference in height variance (Jelenkovic et al., 2015), variance components estimates should not be affected by changes in the proportion of MZ to DZ twins across birth-year cohorts.
In conclusion, although the genetic variance of height showed a slightly increasing trend with birth year, heritability estimates did not present any clear pattern of secular changes across birth-year cohorts from 1886 to 1994. Thus, our findings do not support the hypothesis that the heritability of height increases along with increasing living standards and diminishing rate of absolute poverty within populations.
Materials and methods
Sample
Request a detailed protocolThis study is based on the data from the Collaborative project of Development of Anthropometrical measures in Twins (CODATwins), which was intended to pool data from all twin projects in the world with information on height and weight measurements for MZ and DZ twins (Silventoinen et al., 2015). For the present analyses, we selected height measurements at ages 19.5–99.5 years. After excluding four cohorts having less than 50 twin individuals in the final database, we had data from 40 cohorts in 20 countries. The participating twin cohorts are identified in Table 1 (footnote) and were previously described in detail (Silventoinen et al., 2015).
From the initial 558,672 height measurements, we excluded those <145 or>210 cm in men and <135 or >195 cm in women (<0.1% of the measurements). Since individuals in longitudinal studies have more than one measurement over time, analyses were restricted to one observation per individual resulting in 323,491 individuals. After excluding unmatched pairs (without data on their co-twins), we had 286,780 twin individuals (143,390 complete twin pairs) born between year 1886 and 1994 (40% monozygotic (MZ), 41% same- sex dizygotic (SSDZ) and 19% opposite-sex dizygotic (OSDZ) twin pairs). The smaller proportion of OSDZ compared to SSDZ twins in this study is explained by the fact that some of the twin cohorts in our database have collected, by design, only SSDZ twins and thus do not have data on OSDZ twins. These individuals were categorized into nine consecutive birth year groups described in Table 1. In order to analyze possible ethnic-cultural differences in the genetic and environmental contribution on height, cohorts were grouped in three geographical-cultural regions: Europe (18 cohorts), North America and Australia (14 cohorts) and East Asia (six cohorts) with 87,116, 53,359 and 1793 twin pairs, respectively. One cohort from the Middle-East and the one from South-Asia were not included in these sub-analyses by geographic-cultural region because the data were too sparse to study these two areas separately.
Statistical analyses
Request a detailed protocolWe first tested whether the means and variances of height differed between twin cohorts within each sex and birth-year group (Table 1). Since the Levene´s test for homogeneity indicated that variances were not homogeneous, a Welch’s ANOVA was performed showing that means were significantly different between twin cohorts in all sex and birth-year groups.
To analyze genetic and environmental influences on the variation of height, we used classic twin modeling based on linear structural equations (Neale and Cardon, 1992). MZ twins share the same genomic sequence, whereas DZ twins share, on average, 50% of their genes identical-by-descent. On this basis, it is possible to divide the total variance of height into variance due to additive genetic effects (A: correlated 1.0 for MZ and 0.5 for DZ pairs), dominance genetic effects (D: 1.0 for MZ and 0.25 for DZ pairs), common (shared) environmental effects (C: by definition, correlated 1.0 for MZ and DZ pairs) and unique (non-shared) environmental effects (E: by definition, uncorrelated in MZ and DZ pairs). However, since our data included only twins reared together, we cannot simultaneously estimate shared environmental and dominance genetic effects. All genetic models were fitted by the OpenMx package (version 2.0.1) in the R statistical platform (Boker et al., 2011) using the maximum likelihood method.
Prior to conducting the modeling, height values were adjusted for the year of birth and twin cohort within each birth year and sex groups using linear regressions, and the resulting residuals were used as input phenotypes. The ACE sex-limitation model was selected as a starting point of the univariate modeling based on the following criteria: (i) MZ within-pair correlations were clearly higher than DZ correlations consistent with the influence of genetic effects, (ii) the magnitude of the difference between MZ and DZ correlations (rDZ > 1/2 rMZ) indicated the presence of common environmental effects and (iii) the lower within-pair correlations for OSDZ than for SSDZ twins observed for most birth-year groups suggested the presence of sex-specific genetic effects (results not shown). Previous findings from this international database showed that both male and female DZ twins are slightly taller than MZ twins in these age groups (Jelenkovic et al., 2015), and thus different means for MZ and DZ twins were allowed. The fit of the univariate models for height at each birth-year group is shown in Supplementary file 1B. In the present study, the equal-environment assumption was tested by comparing the ACE model to the saturated model. The fit of the models after Bonferroni correction of multiple testing did not worsen for most birth-year groups, which suggested that the assumption of equality of variances between MZ and DZ twins was not violated. When fixing A, C and E parameters to be the same in men and women, the fit of the model was poorer in all birth-year groups (p<0.0001), suggesting that these variance components differ between sexes. We additionally fitted a scale model allowing for different sizes of variance components but fixing the relative size of these components to be equal. Since this model also showed statistically significant differences (p<0.0001) in some birth-year cohorts, we decided to present the results separately for men and women. Sex-specific genetic effects were significant for some birth-year cohorts, and thus all modeling results are presented in sex-limited form for consistency. Comparative model fitting revealed that the C parameter could be not excluded from the model without a significant deterioration in fit. In order to study how birth year modifies the genetic and environmental variances of height, we additionally conducted gene-environment interaction modeling using birth year as an environmental modification factor (Purcell, 2002). This modeling offers intercept and interaction term describing the change per birth year which then need to be squared to get raw genetic and environmental variances. To make the results easier to understand, we calculated expected variance change with 95% CI per 25 years, i.e. approximately one human generation.
References
-
The secular trend in human physical growth: a biological viewEconomics & Human Biology 1:161–168.https://doi.org/10.1016/S1570-677X(02)00033-3
-
BookWorldwide Variation in Human Growth (2nd edn)Cambridge: Cambridge University Press.
-
XV.—The correlation between relatives on the supposition of mendelian InheritanceTransactions of the Royal Society of Edinburgh 52:399–433.https://doi.org/10.1017/S0080456800012163
-
Regression towards mediocrity in heriditary statureJournal of the Anthropological Institute 15:246–262.https://doi.org/10.2307/2841583
-
Genetic influences on the difference in variability of height, weight and body mass index between caucasian and east asian adolescent twinsInternational Journal of Obesity 32:1455–1467.https://doi.org/10.1038/ijo.2008.144
-
Zygosity differences in height and body mass index of twins from infancy to old age: A study of the CODATwins projectTwin Research and Human Genetics 18:557–570.https://doi.org/10.1017/thg.2015.57
-
Effects of age on genetic influence on bone loss over 17 years in women: the healthy ageing Twin Study (HATS)Journal of Bone and Mineral Research 27:2170–2178.https://doi.org/10.1002/jbmr.1659
-
Websitehttp://www.niams.nih.gov/health_info/Osteoporosis/default.aspHandout on Health: Osteoporosis. Accessed 2016.
-
BookMethodology for Genetic Studies of Twins and FamiliesDordrecht: Kluwer Academic Publishers.
-
Population genetic differentiation of height and body mass index across EuropeNature Genetics 47:1357–1362.https://doi.org/10.1038/ng.3401
-
The CODATwins project: The cohort description of collaborative project of development of Anthropometrical measures in twins to study Macro-environmental variation in genetic and environmental effects on Anthropometric traitsTwin Research and Human Genetics 18:348–360.https://doi.org/10.1017/thg.2015.29
-
Relative effect of genetic and environmental factors on body height: differences across birth cohorts among Finnish men and womenAmerican Journal of Public Health 90:627–630.https://doi.org/10.2105/ajph.90.4.627
-
Determinants of variation in adult body heightJournal of Biosocial Science 35:263–285.https://doi.org/10.1017/s0021932003002633
-
Heights and human welfare: recent developments and new directionsExplorations in Economic History 46:1–23.https://doi.org/10.1016/j.eeh.2008.12.001
-
Evolutionary perspectives on human height variationBiological Reviews 91:206–234.https://doi.org/10.1111/brv.12165
Article and author information
Author details
Funding
Suomen Akatemia (266592)
- Karri Silventoinen
The funders had no role in study design, data collection and interpretation, or the decision to submit the work for publication.
Acknowledgements
Support for collaborating projects: The Australian Twin Registry is supported by a Centre of Research Excellence (grant ID 1079102) from the National Health and Medical Research Council administered by the University of Melbourne. The California Twin Program was supported by The California Tobacco-Related Disease Research Program (7RT-0134H, 8RT-0107H, 6RT-0354H) and the National Institutes of Health (1R01ESO15150-01). The Carolina African American Twin Study of Aging (CAATSA) was funded by a grant from the National Institute on Aging (grant 1RO1-AG13662-01A2) to K. E. Whitfield. Colorado Twin Registry is funded by NIDA funded center grant DA011015, and Longitudinal Twin Study HD10333; Author Huibregtse is supported by 5T32DA017637-11. Danish Twin Registry is supported by the National Program for Research Infrastructure 2007 from the Danish Agency for Science, Technology and Innovation, The Research Council for Health and Disease, the Velux Foundation and the US National Institute of Health (P01 AG08761). Since its origin the East Flanders Prospective Survey has been partly supported by grants from the Fund of Scientific Research, Flanders and Twins, a non-profit Association for Scientific Research in Multiple Births (Belgium). Data collection and analyses in Finnish twin cohorts have been supported by ENGAGE – European Network for Genetic and Genomic Epidemiology, FP7-HEALTH-F4-2007, grant agreement number 201413, National Institute of Alcohol Abuse and Alcoholism (grants AA-12502, AA-00145, and AA-09203 to R J Rose, the Academy of Finland Center of Excellence in Complex Disease Genetics (grant numbers: 213506, 129680), and the Academy of Finland (grants 100499, 205585, 118555, 141054, 265240, 263278 and 264146 to J Kaprio). K Silventoinen is supported by Osaka University's International Joint Research Promotion Program. Waves 1–3 of Genesis 12–19 were funded by the W T Grant Foundation, the University of London Central Research fund and a Medical Research Council Training Fellowship (G81/343) and Career Development Award (G120/635) to Thalia C. Eley. Wave four was supported by grants from the Economic and Social Research Council (RES-000-22–2206) and the Institute of Social Psychiatry (06/07–11) to Alice M. Gregory who was also supported at that time by a Leverhulme Research Fellowship (RF/2/RFG/2008/0145). Wave five was supported by funding to Alice M. Gregory from Goldsmiths, University of London. Anthropometric measurements of the Hungarian twins were supported by Medexpert Ltd., Budapest, Hungary. Korean Twin-Family Register was supported by the Global Research Network Program of the National Research Foundation (NRF 2011–220-E00006). The Michigan State University Twin Registry has been supported by Michigan State University, as well as grants R01-MH081813, R01-MH0820-54, R01-MH092377-02, R21-MH070542-01, R03-MH63851-01 from the National Institute of Mental Health (NIMH), R01-HD066040 from the Eunice Kennedy Shriver National Institute for Child Health and Human Development (NICHD), and 11-SPG-2518 from the MSU Foundation. The content of this manuscript is solely the responsibility of the authors and does not necessarily represent the official views of the NIMH, the NICHD, or the National Institutes of Health. The Murcia Twin Registry is supported by Fundación Séneca, Regional Agency for Science and Technology, Murcia, Spain (08633/PHCS/08, 15302/PHCS/10 and 19479/PI/14) and Ministry of Science and Innovation, Spain (PSI2009-11560 and PSI2014-56680-R). Data collection and research stemming from the Norwegian Twin Registry is supported, in part, from the European Union’s Seventh Framework Programmes ENGAGE Consortium (grant agreement HEALTH-F4-2007–201413, and BioSHaRE EU (grant agreement HEALTH-F4-2010–261433). The NAS-NRC Twin Registry acknowledges financial support from the National Institutes of Health grant number R21 AG039572. Netherlands Twin Register acknowledges the Netherlands Organization for Scientific Research (NWO) and MagW/ZonMW grants 904-61–090, 985-10–002, 912-10–020, 904-61–193,480-04–004, 463-06–001, 451-04–034, 400-05–717, Addiction-31160008, Middelgroot-911-09–032, Spinozapremie 56-464–14192; VU University’s Institute for Health and Care Research (EMGO+); the European Research Council (ERC - 230374), the Avera Institute, Sioux Falls, South Dakota (USA). South Korea Twin Registry is supported by the National Research Foundation of Korea (NRF-371-2011–1 B00047). S.Y. Öncel and F. Aliev are supported by Kırıkkale University Research Grant: KKU, 2009/43 and TUBITAK grant 114C117. TwinsUK was funded by the Wellcome Trust; European Community’s Seventh Framework Programme (FP7/2007–2013). The study also receives support from the National Institute for Health Research (NIHR) BioResource Clinical Research Facility and Biomedical Research Centre based at Guy's and St Thomas' NHS Foundation Trust and King's College London. The University of Southern California Twin Study is funded by a grant from the National Institute of Mental Health (R01 MH58354). Washington State Twin Registry (formerly the University of Washington Twin Registry) was supported in part by grant NIH RC2 HL103416 (D. Buchwald, PI). Vietnam Era Twin Study of Aging was supported by the National Institute of Health grants NIA R01 AG018384, R01 AG018386, R01 AG022381, and R01 AG022982, and, in part, with resources of the VA San Diego Center of Excellence for Stress and Mental Health. The Cooperative Studies Program of the Office of Research and Development of the United States Department of Veterans Affairs has provided financial support for the development and maintenance of the Vietnam Era Twin (VET) Registry. The content of this manuscript is solely the responsibility of the authors and does not necessarily represent the official views of the NIA/NIH, or the VA. The West Japan Twins and Higher Order Multiple Births Registry was supported by Grant-in-Aid for Scientific Research (B) (grant number 15H05105) from the Japan Society for the Promotion of Science.
Ethics
Human subjects: All participants were volunteers and gave their informed consent when participating in their original study. Only a limited set of observational variables and anonymized data were delivered to the data management center at University of Helsinki. The pooled analysis was approved by the ethical committee of Department of Public Health, University of Helsinki.
Copyright
© 2016, Jelenkovic et al.
This article is distributed under the terms of the Creative Commons Attribution License, which permits unrestricted use and redistribution provided that the original author and source are credited.
Metrics
-
- 6,933
- views
-
- 644
- downloads
-
- 49
- citations
Views, downloads and citations are aggregated across all versions of this paper published by eLife.
Citations by DOI
-
- 49
- citations for umbrella DOI https://doi.org/10.7554/eLife.20320
Download links
A two-part list of links to download the article, or parts of the article, in various formats.
Downloads (link to download the article as PDF)
Open citations (links to open the citations from this article in various online reference manager services)
Cite this article (links to download the citations from this article in formats compatible with various reference manager tools)
Genetic and environmental influences on adult human height across birth cohorts from 1886 to 1994
eLife 5:e20320.
https://doi.org/10.7554/eLife.20320


