A dynamin 1-, dynamin 3- and clathrin-independent pathway of synaptic vesicle recycling mediated by bulk endocytosis
- Yale University School of Medicine, United States
- Howard Hughes Medical Institute, Yale University School of Medicine, United States
- University of Colorado, United States
- Montreal Neurological Institute, McGill University, Canada
Figures
Figure 1
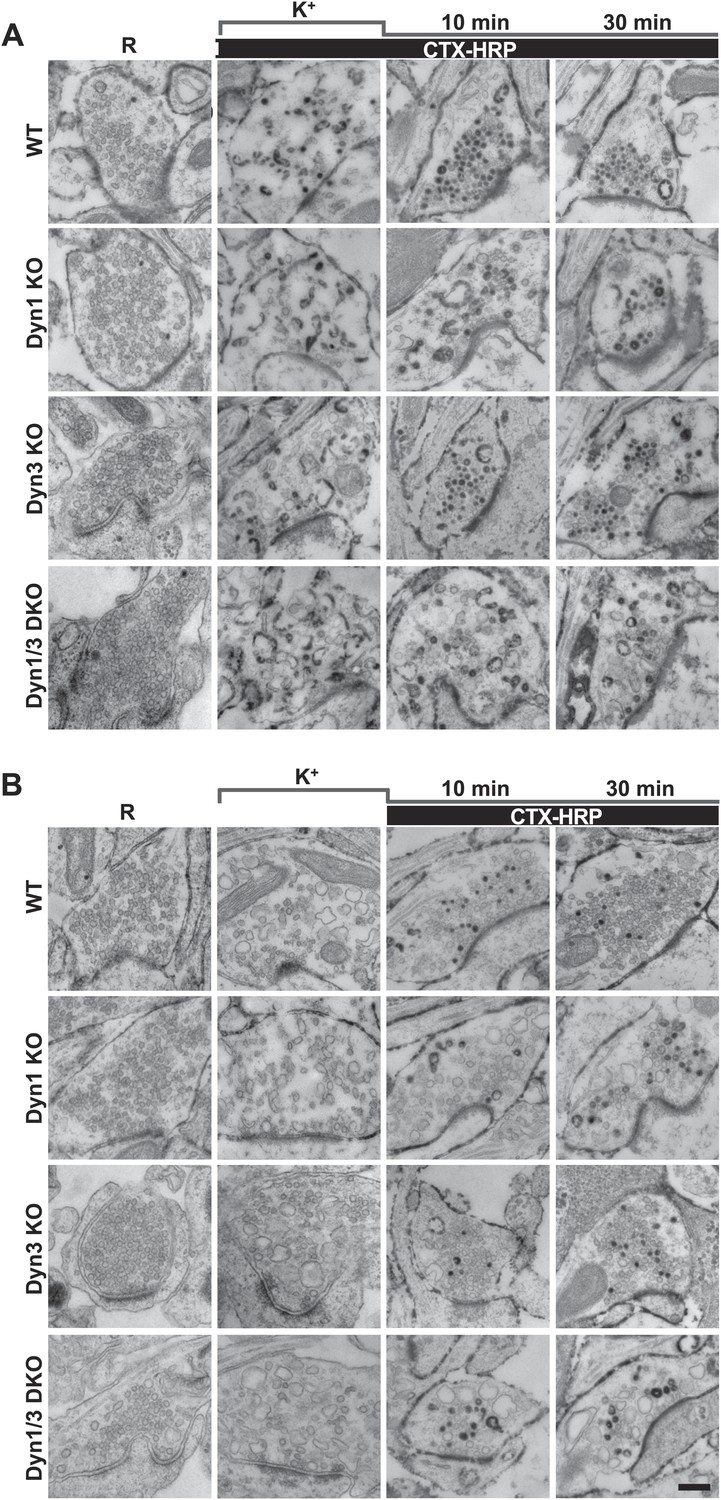
High K+ stimulation induces bulk endocytosis, as assessed by CTX-HRP, at both WT and dynamin mutant synapses.
Following incubation in resting buffer (R), neurons were stimulated with 90 mM K+ for 90 s, then incubated in resting buffer for 10 and 30 min. CTX-HRP, added either during or after the stimulus (A), or selectively after the stimulus (B), was used as an endocytic tracer. In all genotypes, loss of SVs during the stimulus is compensated by the appearance of numerous bulk endosomes. Most these organelles are HRP-reaction product-positive only in samples expose to CTX-HRP also during the high K+ incubation, indicating that bulk endocytosis occurs primarily during the stimulus. During the recovery period bulk endosomes are converted to SVs. Scale bar = 100 nm.
Figure 2
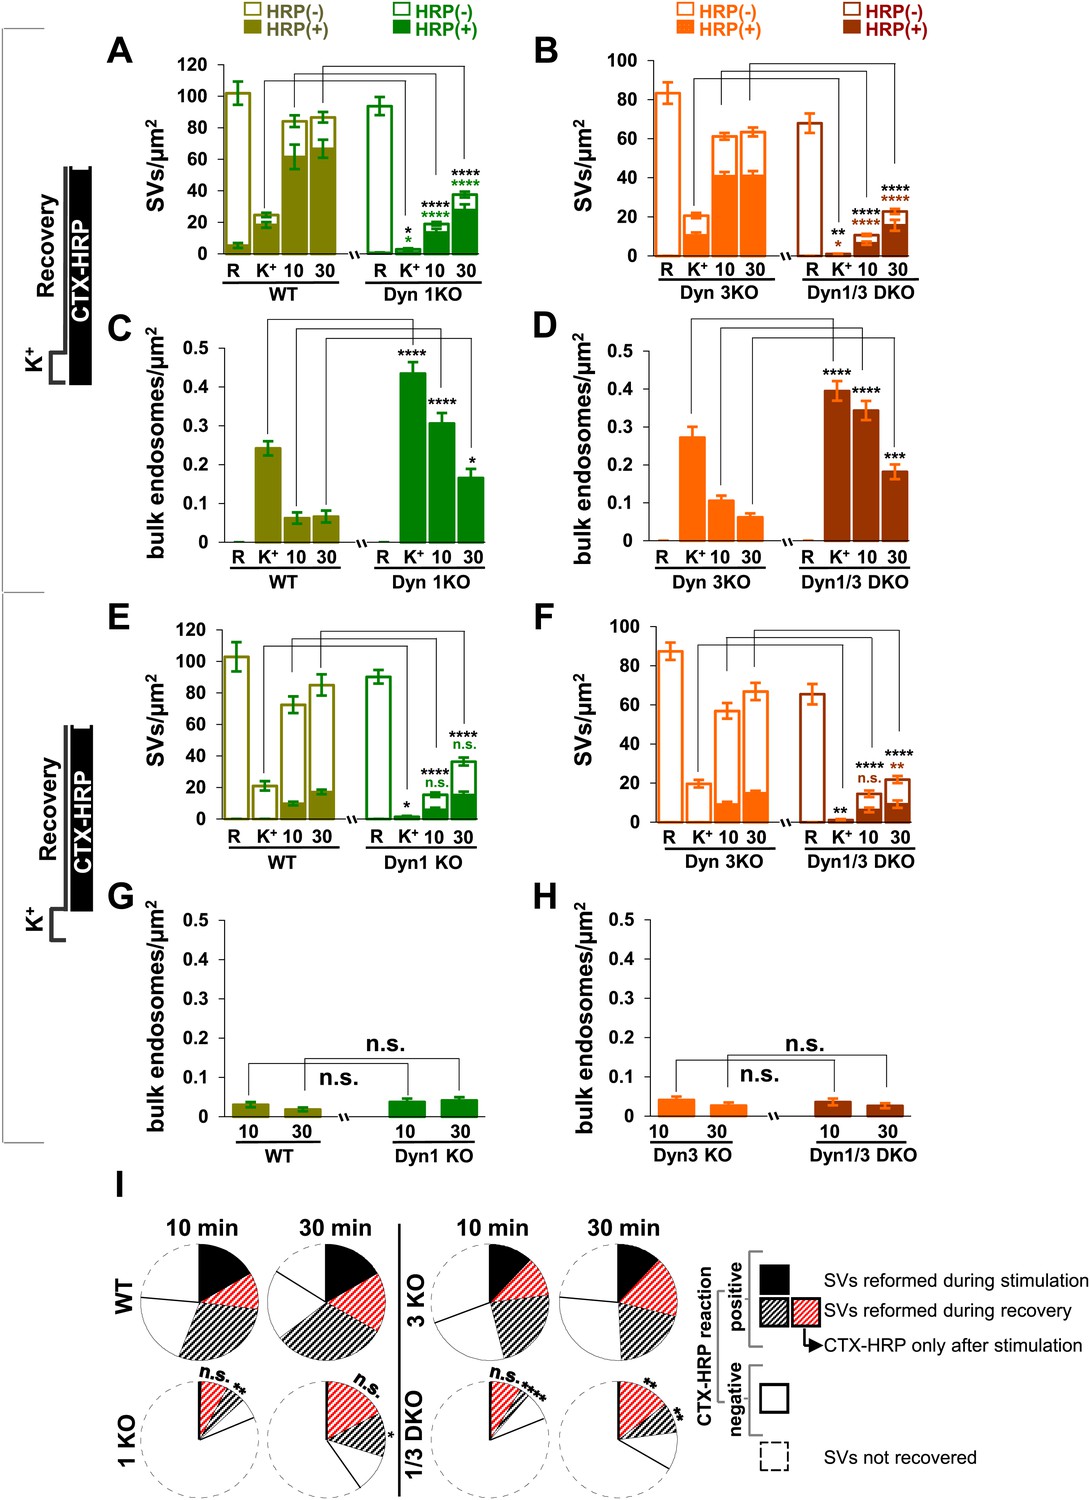
Quantification of SV number and bulk endosome dynamics, as assessed by CTX-HRP labeling, in WT and dynamin mutant neurons in response to high K+ stimulation.
These data represent a quantification of the experiments used for Figure 1. CTX-HRP was present both during and after stimulation in (A–D), in order to maximize labeling of all endocytic structures, and only after stimulation in (E–H) to monitor selectively post-stimulation endocytosis. (A, B, E and F) Analysis of SV number per cross-sectional area of nerve terminal under resting conditions (R), at the end of the 90 s high K+ stimulus (K+), and after 10 and 30 min recovery. SVs positive for HRP reaction product are indicated by the dark portion of each bar. (C, D, G and H) Analysis of the membrane area of CTX-HRP-positive bulk endosomes per cross-sectional area of nerve terminal in each of the conditions investigated. In fields (A–H) as well as in the following figures, error bars represent mean ± S.E. of values obtained at individual synapses. (I) Pie charts integrating results of different experiments and summarizing putative contributions of (i) direct endocytosis from the plasma membrane and (ii) conversion of bulk endosomes to the recovery of SVs at 10 and 30 min as extrapolated from the data of fields (A and B) and (E and F). The entire pie represents the SV pool before stimulation. The black section of each pie indicates HRP-reaction positive SVs at the end of the stimulus. The striped sections indicate HRP-reaction positive SVs generated during recovery (dark portion of the ‘recovery’ bars in field A and B, subtracted by the dark portion of the ‘K+’ bars in the same fields), with red stripes showing SVs labeled when CTX-HRP had been added selectively after the stimulus (dark portions of the bars in fields E and F). As very few bulk endosomes are generated when CTX-HRP is added selectively after the stimulus (fields E and F), most likely these vesicles (red stripes) were derived directly from the plasma membrane. Thus, black striped sections represent SVs putatively derived from bulk endosomes. The white sections represent SVs unlabeled by HRP and the missing section represents the vesicle pool that had not recovered at the time points indicated. The pie clearly demonstrates a delay in SV recovery in the Dyn1 KO and Dyn1/3 DKO genotypes. It further shows that in these genotypes the predominant defect is in the reformation of SVs during the stimulus and from bulk endosomes, with no obvious impact on their reformation from the plasma membrane after stimulation. ****, ***, **, * indicate p-values of <0.0001, <0.001, <0.01 and <0.05, respectively. n.s., ‘not significant’. Black asterisks refer to comparisons between total vesicles, colored asterisks to comparisons between HRP-labeled vesicles. Bars: standard error of the mean.
Figure 3
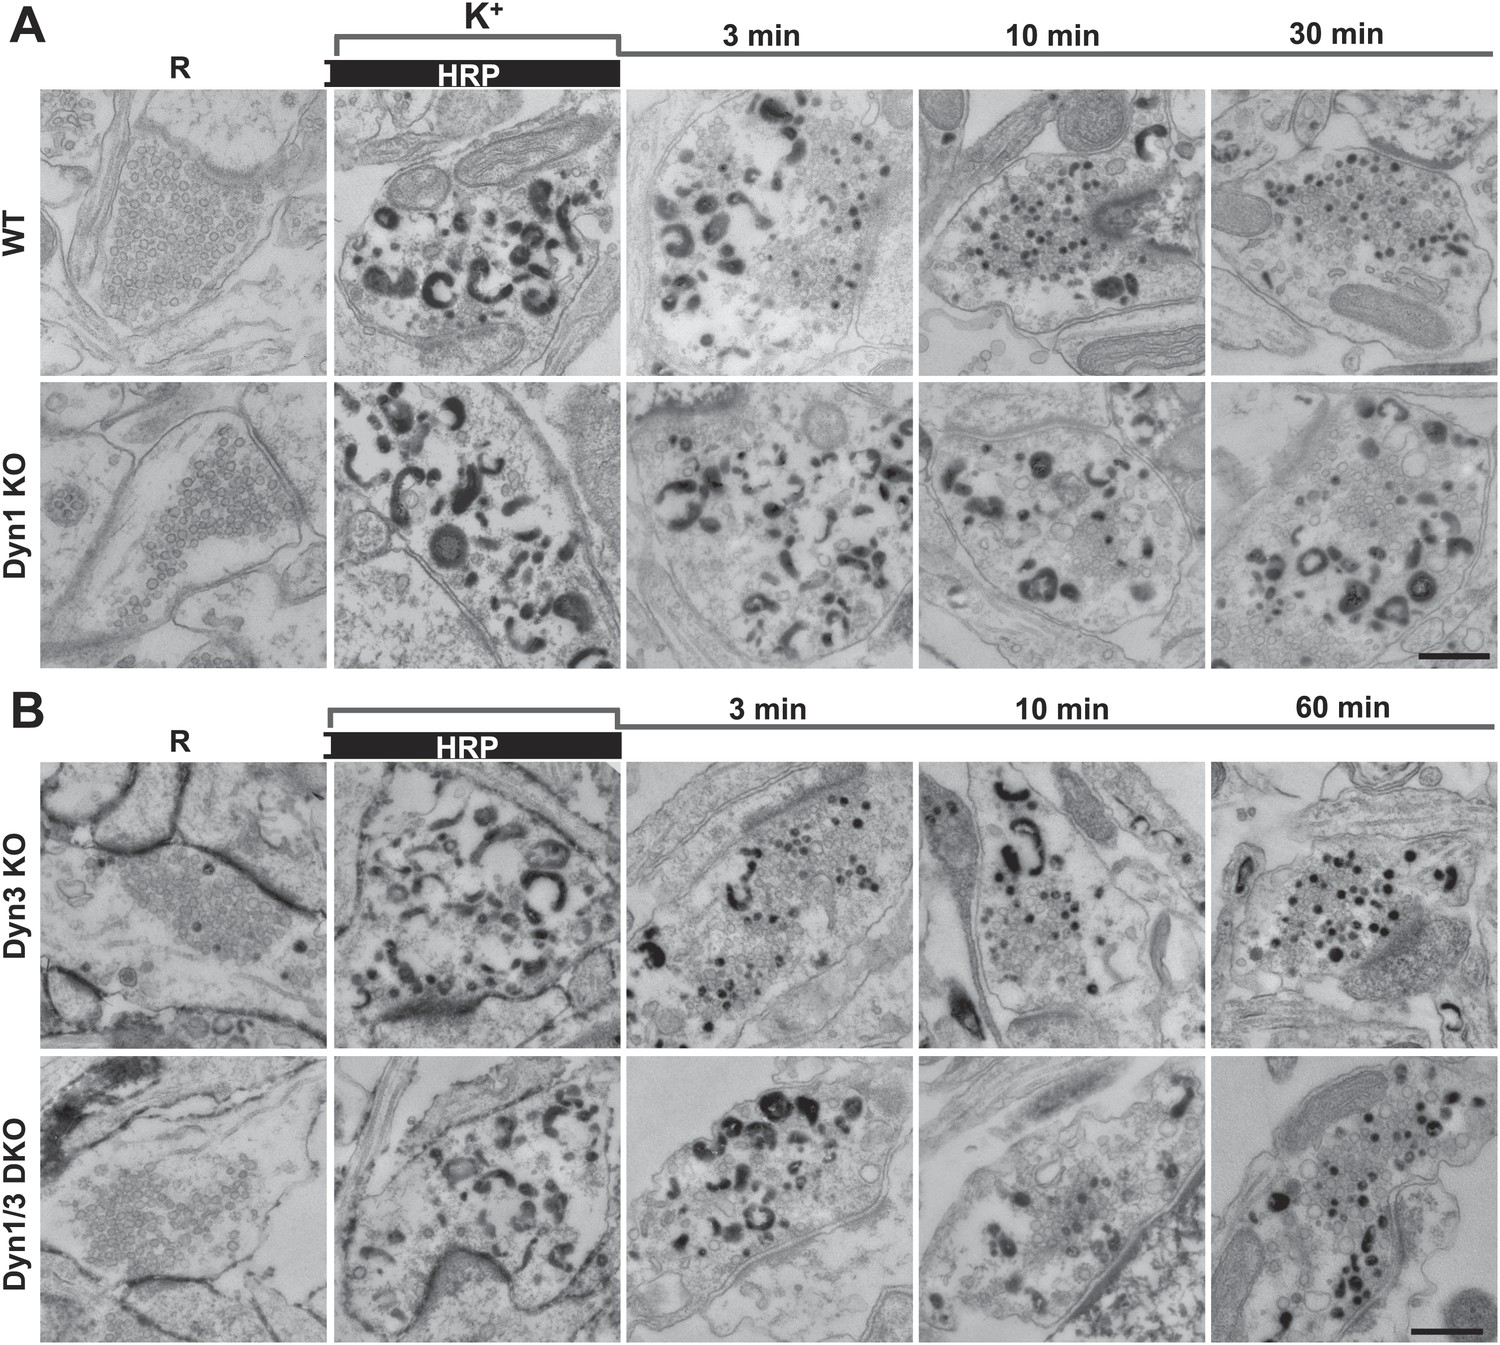
Bulk endocytosis and conversion of bulk endosomes into SVs analyzed with soluble HRP labeling after high K+ stimulation in WT and dynamin mutant synapses.
Neurons of the indicated genotypes (A, WT and Dyn1 KO; B, Dyn3 KO and Dyn1/3 DKO respectively) were stimulated with 90 mM K+ for 90 s in the presence of HRP, followed by wash-out of HRP and recovery in resting buffer. Massive bulk endocytosis is observed during stimulation. The large fraction of HRP reaction product-positive SVs observed in all genotypes during the recovery period documents formation of these vesicles from HRP reaction product-positive bulk endosomes formed during stimulation. Scale bar = 500 nm.
Figure 4
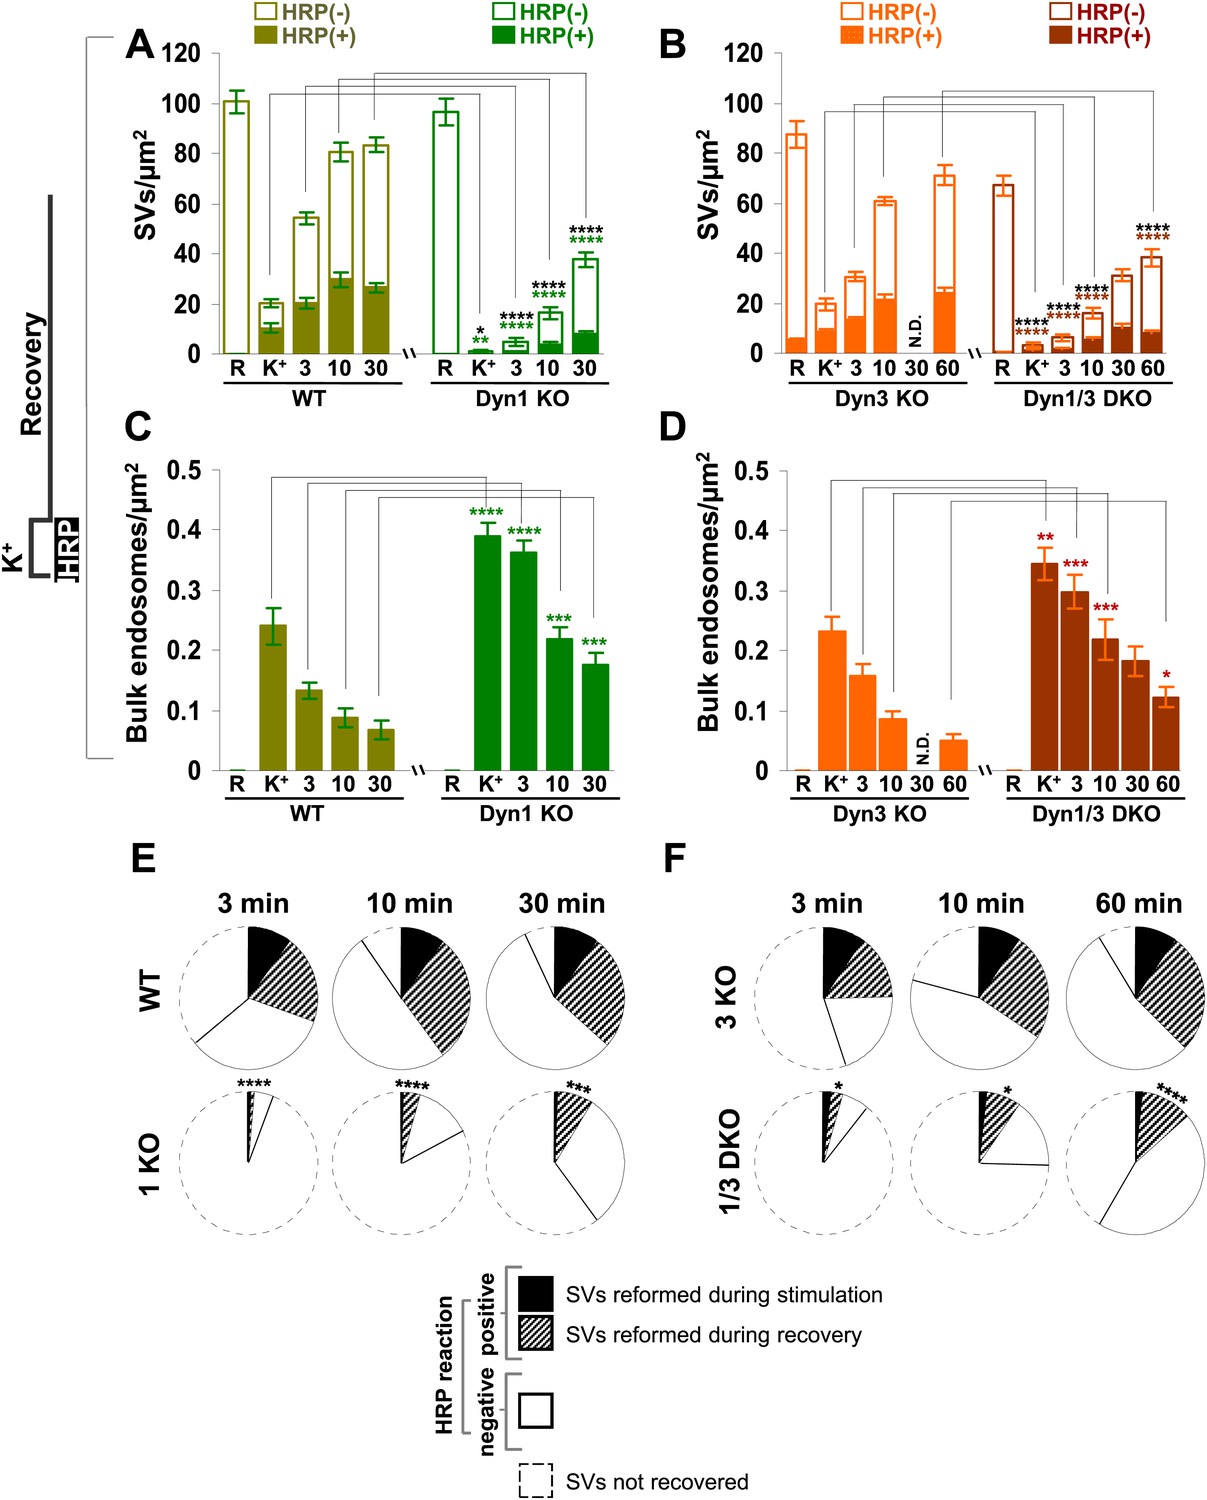
Quantification of SV number and bulk endosome dynamics, as assessed by soluble HRP labeling, in WT and dynamin KO neurons in response to high K+ stimulation.
These data represent a quantification of the experiments used for Figure 3. (A and B) Analysis of SV number per cross-sectional area of nerve terminal under resting conditions (R), at the end of the 90 s high K+ stimulus (K+), and after recovery for the times indicated. SVs positive for HRP reaction product are indicated by the dark portion of each bar. (C and D) Analysis of the membrane area of HRP reaction product-positive bulk endosomes per cross-sectional area of nerve terminal in each of the conditions investigated. (E and F) Pie charts summarizing results of fields A and B concerning the reformation of SVs at different times after recovery. Entire pie: total SVs before stimulation; white sector: unlabeled SVs; black sector: labeled SVs after stimulation; striped section: total labeled SVs subtracted by the SVs formed during stimulation. ****, ***, **, * indicate p-values of <0.0001, <0.001, <0.01, and <0.05, respectively. N.D., ‘not determinated’. Black asterisks refer to comparisons between total vesicles, colored asterisks to comparisons between HRP-labeled vesicles. Bars: standard error of the mean.
Figure 5
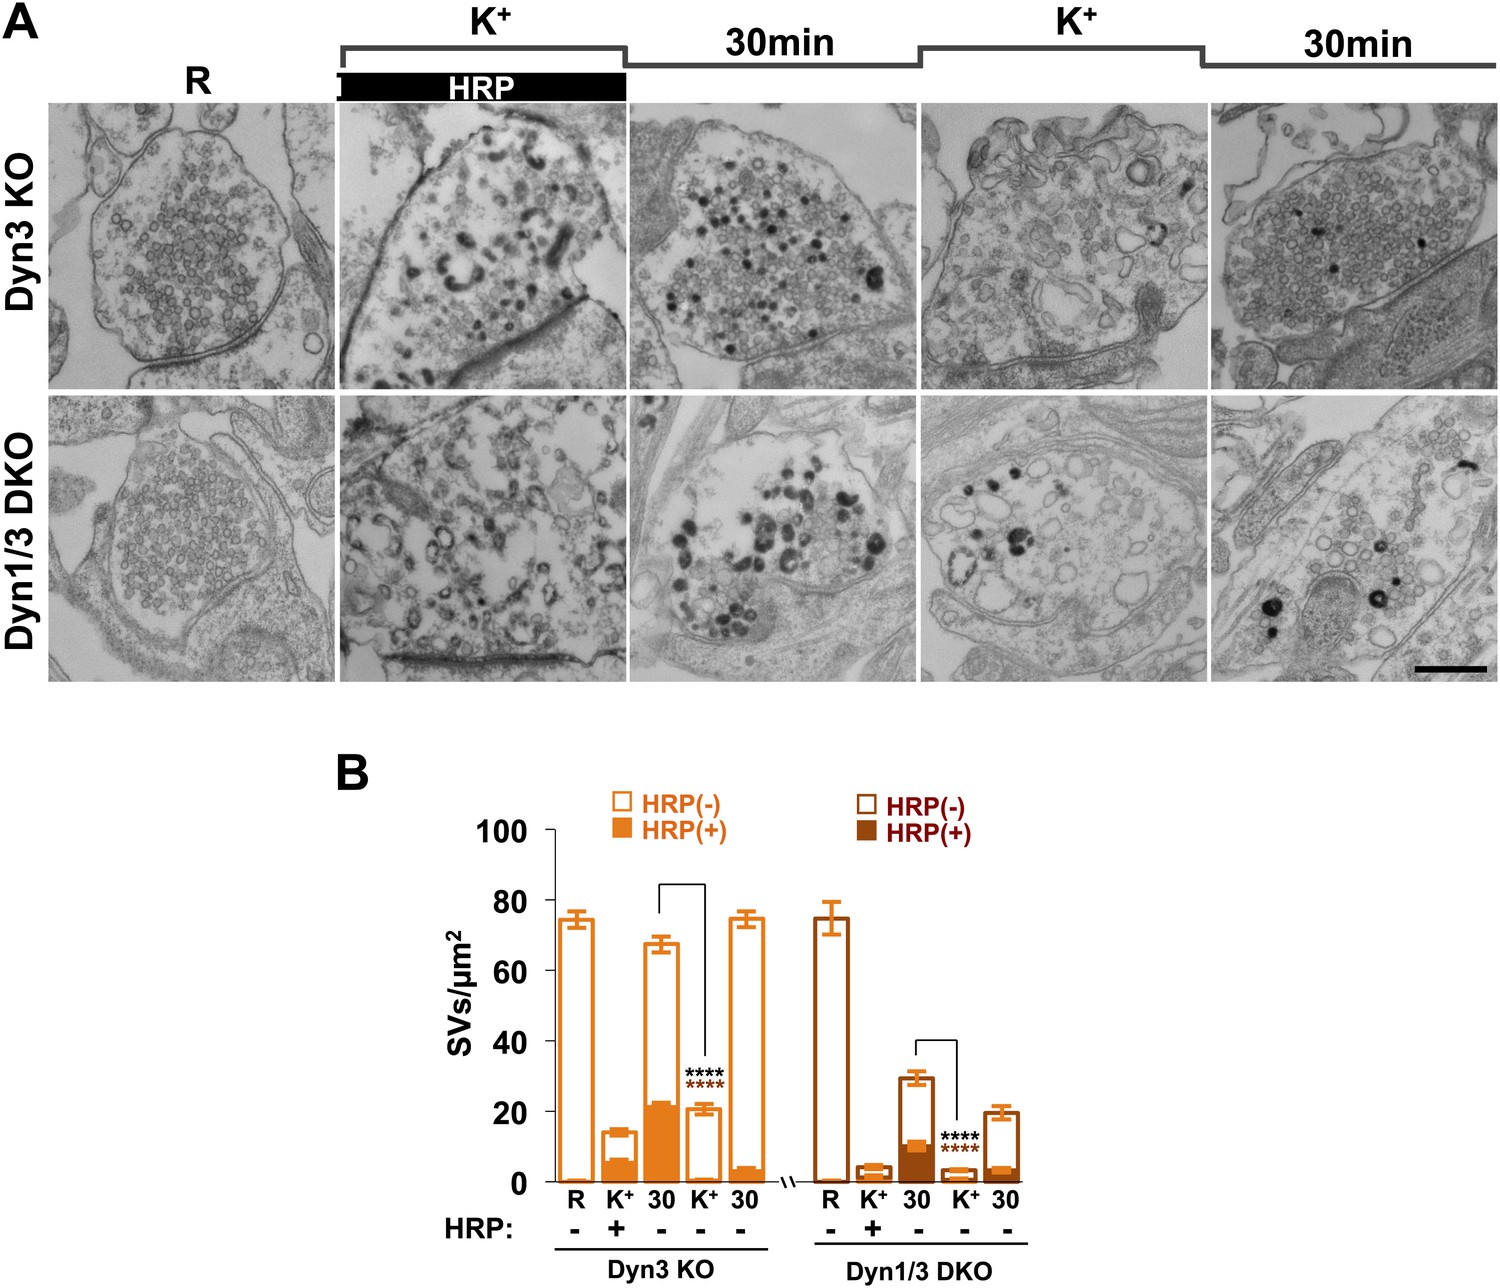
SVs reformed from bulk endosomes can undergo exocytosis upon stimulation.
(A) Control (Dyn3 KO) and Dyn1/3 DKO neurons were stimulated by a 90 s high K+ stimulation in the presence of HRP, rested for 30 min in the absence of HRP and then subjected to a second round of high K+ stimulation and recovery, always in the absence of HRP. Loss of HRP-labeled SVs during the second stimulus, and the subsequent recovery of unlabeled SVs, demonstrates that vesicles generated from bulk endosomes are functional SVs. (B) Quantification of the results shown in A. Scale bar = 500 nm. **** indicates p-values of <0.0001. Black asterisks refer to comparisons between total vesicles, colored asterisks to comparisons between HRP-labeled vesicles. Bars: standard error of the mean.
Figure 6

Bulk endocytosis and SV recovery after high frequency electrical stimulation.
(A) Neuronal cultures were stimulated at 80 Hz for 10 s and then allowed to recovery in resting buffer for 30 min. CTX-HRP was added either during both stimulation and recovery, or during recovery only, as indicated. The endocytic intermediates observed under these conditions, as well as their labeling pattern, were similar to those observed upon high K+ stimulation. (B) quantification of the results shown in A. (C) Pie charts illustrating SVs observed under the various conditions, based on the results shown in panel B, with sectors coded as indicated in the legend of Figure 2I. As in the case of high K+ stimulation (Figure 2), SV reformation during the stimulus was virtually abolished in Dyn1/3 DKO neurons (black sectors). Concerning the recovery of SVs after the stimulus (striped sectors), the major defect was observed in the reformation of labeled SVs from bulk endosomes (black stripes), this value was extrapolated (as for Figure 2I) by subtracting from the total striped area the fraction of SVs that become labeled when CTX-HRP was added only after the stimulus. Scale bar = 100 nm. ****, ** indicate p-values of <0.0001 and <0.01, respectively. n.s., ‘not significant’. Black asterisks refer to comparisons between total vesicles, colored asterisks to comparisons between HRP-labeled vesicles. Bars: standard error of the mean.
Figure 7
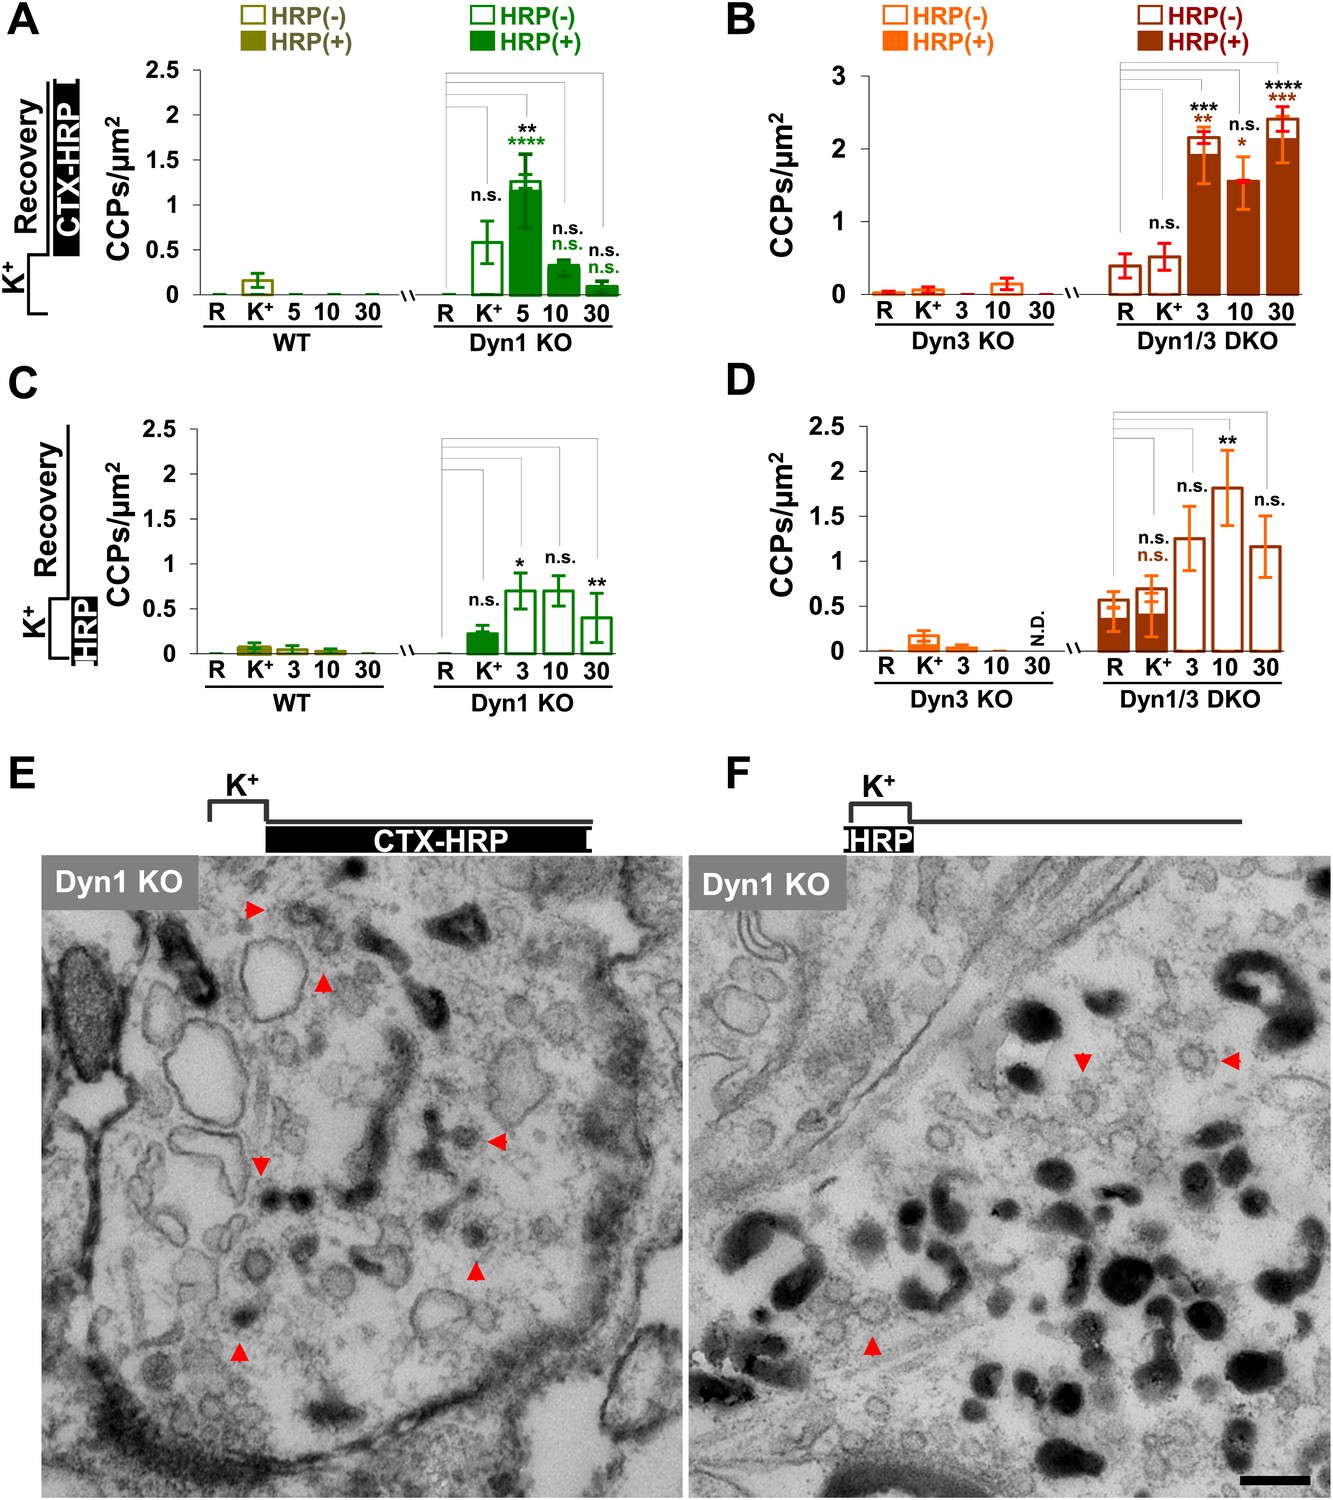
CCP number following stimulation is drastically elevated at dynamin mutant synapses, but in both WT and KO synapses they are selectively localized in the plasma membrane.
(A and B) CCP number in cultures incubated with CTX-HRP selectively after the high K+ stimulation. CCPs positive for HRP reaction product are indicated by the dark portion of each bar. Note that in these samples, where only very few vacuoles are labeled (see Figure 1G,H), nearly all CCPs are labeled, indicating their localization on the plasma membrane. (C and D) CCP number in cultures stimulated in the presence of soluble HRP and washed at the end of the stimulus. Note that CCPs observed after stimulation are negative for HRP reaction product (dark portion of each bar), once again indicating their selective localization on the plasma membrane. The HRP-positive CCPs in the resting (R) and stimulated (K+) samples reflect accessibility to the extracellular medium of arrested plasma membrane CCPs in dynamin KO synapses. (E) Electron micrograph of a Dyn1 KO synapse incubated for 5 min with CTX-HRP selectively during recovery (as for field A). Most CCPs are HRP reaction product positive (red arrows). (F) Dyn1 KO synapse incubated with soluble HRP during stimulation and then washed and examined at 3 min (as for field C). All CCPs are HRP reaction product negative. Scale bar = 100 nm. ****, ***, **, * indicate p-values of <0.0001, <0.001, <0.01, and <0.05, respectively. n.s., ‘not significant’, N.D., ‘not determinated’. The standard error of the mean is shown in each graph. Black asterisks refer to comparisons between total vesicles, colored asterisks to comparisons between HRP-labeled vesicles. Bars: standard error of the mean.
Figure 8

3D models based on electron microscopy tomograms of WT and Dyn1 KO synapses following high K+ stimulation.
The models illustrate the abundance and morphology of HRP-labeled bulk endosomes (yellow) in nerve terminals from WT (A and B, a 600 nm thick volume) and Dyn1 KO (C and D, an 800 nm volume) neuronal cultures stimulated for 90 s with high K+ in the presence of soluble HRP and recovered for 1 min in HRP-free buffer. PM is shown in green. B and D show the same nerve terminals of A and B after subtraction of bulk endosomes to reveal SVs (blue) and CCPs (green). CCPs are shown in the same green as the plasma membrane as they are all connected to this membrane by long narrow tubules (see a direct connection to the plasma membrane in the inset of D). No CCPs are present on bulk endosomes. The postsynaptic density is shown in red. Scale bars: A–D, 100 nm. (E and F) Gallery of individual bulk endosomes in WT and Dyn1 KO nerve terminals, respectively.
Figure 9 with 1 supplement
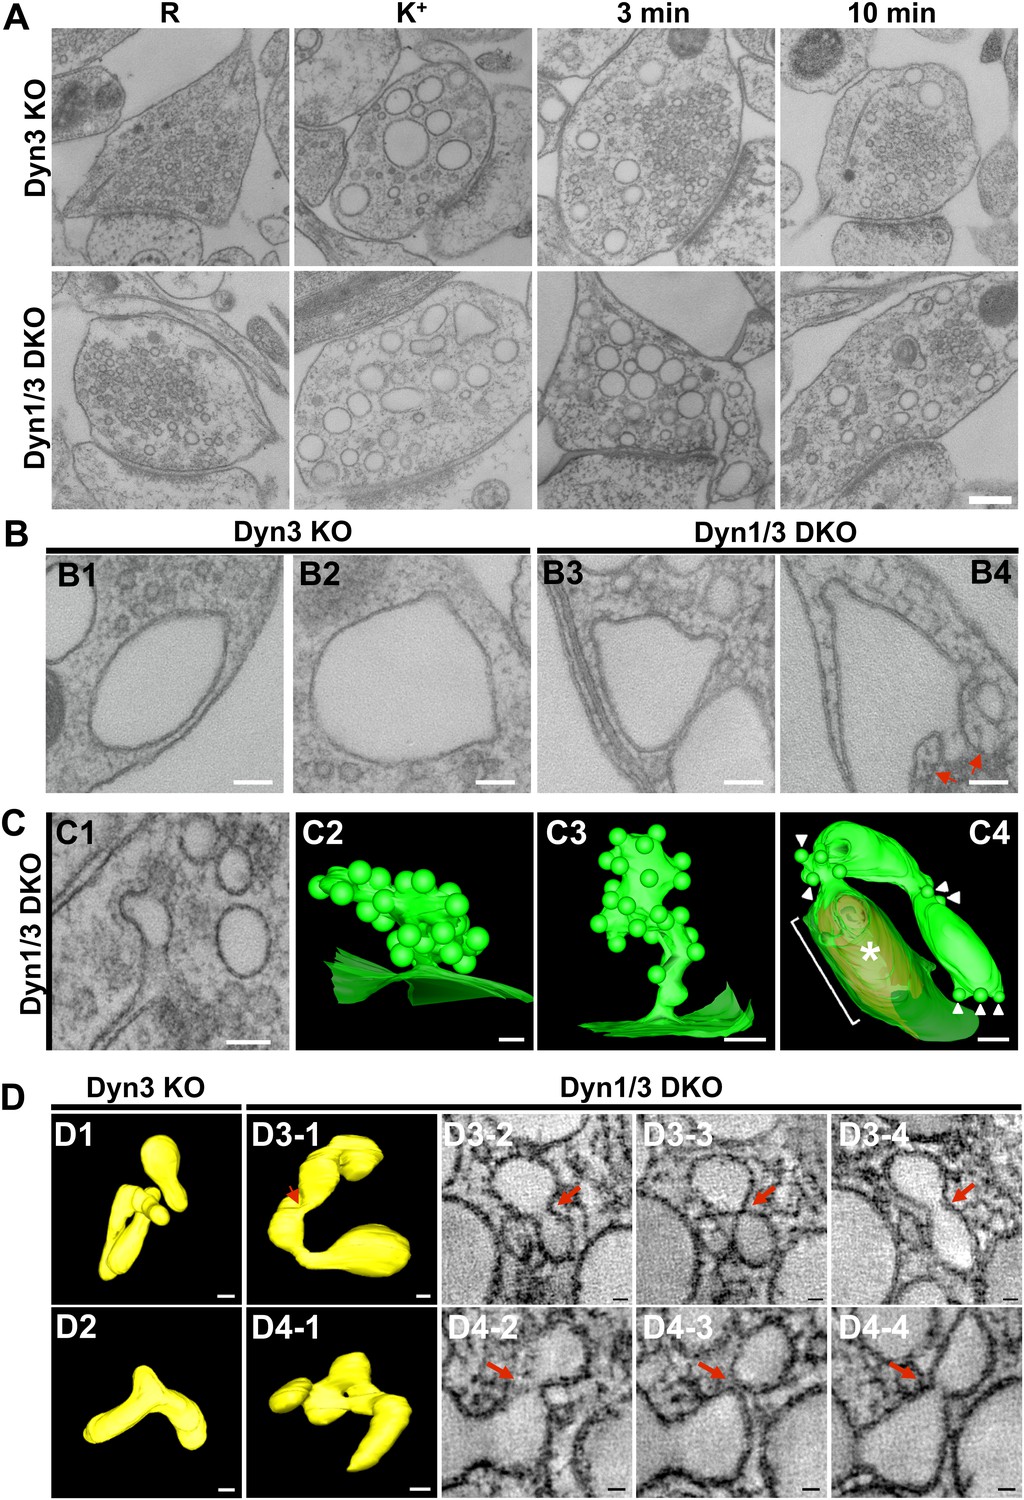
EM analysis of bulk endosomes from high pressure-frozen/freeze-substituted specimens.
Neuronal cultures were incubated overnight in TTX and then exposed to 90 s stimulation in high K+ and recovered for 3 and 10 min. (A) Representative examples of Dyn3 KO (control) and Dyn1/3 DKO synapses. (B) Gallery of coated buds on vacuole-like structures: note the connection to the plasma membrane in B4 (red arrows). (C) CCPs on PM invaginations at Dyn1/3 DKO synapses. C1, EM micrograph; C2-C3, 3-D models from tomograms illustrating CCP trees; C4, CCPs (white arrowheads) on a dilated PM invagination. A white bracket and an asterisk indicates the portion of the PM directly apposed to the postsynaptic membrane (red) which is visible through the transparent green presynaptic plasma membrane. (D) Constricted bulk endosomes. Serial images D3-2 to D3-4 show constrictions and serial images D4-2 to D4-4 show constrictions and a fenestration. Red arrows point to membrane discontinuities. Scale bars: A, 250 nm; B and C1, 3 and 4, 100 nm; C2, 50 nm; D, 50 nm (3D), 20 nm (single images).
Figure 9—figure supplement 1
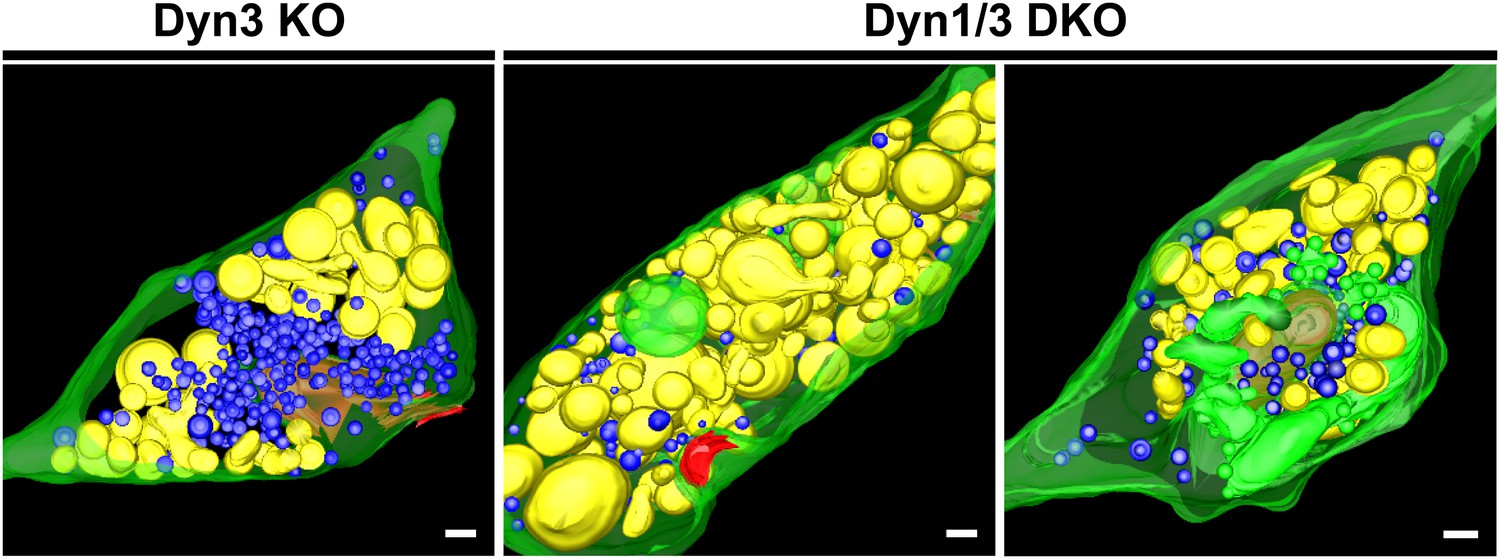
3D models of high pressure-frozen/freeze substituted synapses from Dyn3 KO and Dyn1/3 DKO synapses at 3 min recovery after stimulation with high K+ for 90 s.
Colors are as follows: PM, including PM anchored CCPs (green), bulk endosomes (yellow), SVs (blue) and the post-synaptic density (red). Scale bar: 100 nm.
Figure 10
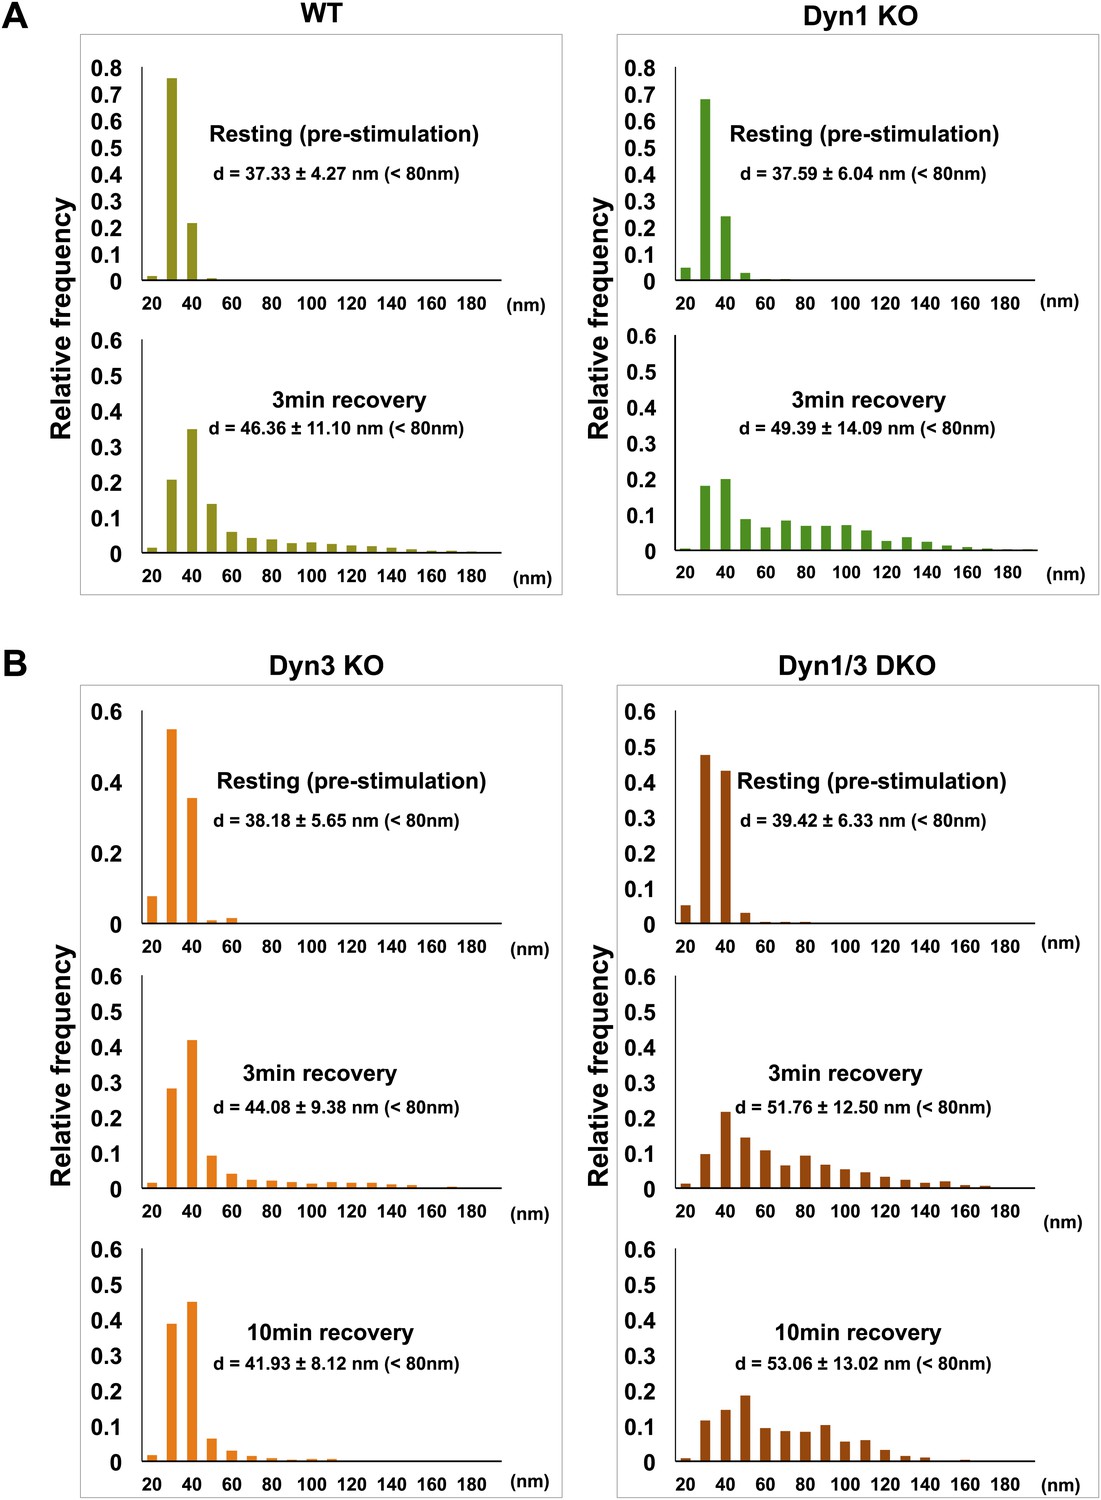
SVs reformed after a wave of bulk endocytosis have a larger and more heteregenous average diameter.
Neuronal cultures of the indicated genotypes were stimulated with high K+ for 90 s and processed by high pressure-freezing/freeze-substitution EM. The diameter of all vesicles (within the 20–200 nm range) in sections of individual nerve terminals before stimulation and after 3 and/or 10 min recovery were analyzed. (A) WT and Dyn1 KO nerve terminals. (B) Dyn3 KO and Dyn1/3 DKO nerve terminals. Diameters were binned at 10 nm intervals and the average diameters (± SD) of vesicles smaller than 80 nm (i.e., vesicles considered as SVs) are indicated in each field. Note (a) the shift of the peak of SV diameter from the 30 to the 40 nm bin, (b) the larger average SV size and (c) the larger SD during the recovery after the stimulus in all genotypes. Nerve terminals analyzed: 21 for WT R, 106 for WT 3 min, 18 for Dyn1 KO R, 123 for Dyn1 KO 3 min, 20 for Dyn3 KO R, 86 for Dyn3 KO 3 min, 27 for Dyn3 KO 10 min, 17 for Dyn1/3 DKO R, 114 for Dyn1/3 DKO 3 min, 42 for Dyn1/3 DKO 10 min.
Figure 11

Clathrin heavy chain (CHC) depletion does not further impair bulk endosome conversion to SVs in Dyn1/3 DKO neurons.
(A) Western blotting of extracts of Dyn1/3 DKO neuronal cultures showing depletion of CHC by transduction with lentivirus encoding CHC shRNAmiR but not by lentivirus encoding control shRNAmiR. (B) Drastic reduction in CCP number in axon terminals of Dyn1/3 DKO neurons maintained under spontaneous network activity upon CHC KD. (C–F) Impact of CHC KD on the ultrastructure of Dyn1/3 DKO neurons preincubated overnight in TTX, stimulated with high K+ for 90 s in the presence of soluble HRP and then allowed to recover for 30 min in HRP-free medium. (C) Electron micrographs showing that the KD of CHC does not prevent the reformation of SVs after stimulation in Dyn1/3 DKO neurons. (D) High K+ stimulation induces an increase of CCPs number in Dyn1/3 DKO neurons that express control shRNAmiR but not in neurons that express CHC shRNAmiR (CCPs had already been reduced to very low level also in the control treated cultures before stimulation by the overnight treatment in TTX). (E) The recovery of SV number is similar in control and CHC KD conditions. (F) The reduction of bulk endosomes during recovery at 30 min is not affected by CHC KD. The values of SVs, CCPs and bulk endosomes per μm2 were calculated by averaging the corresponding values calculated at individual synapses. Scale bar = 200 nm. ****, **, * indicate p-values of <0.0001, <0.01 and <0.05, respectively. n.s., ‘not significant’. Black asterisks refer to comparisons between total vesicles, colored asterisks to comparisons between HRP-labeled vesicles. Bars: standard error of the mean.
Figure 12
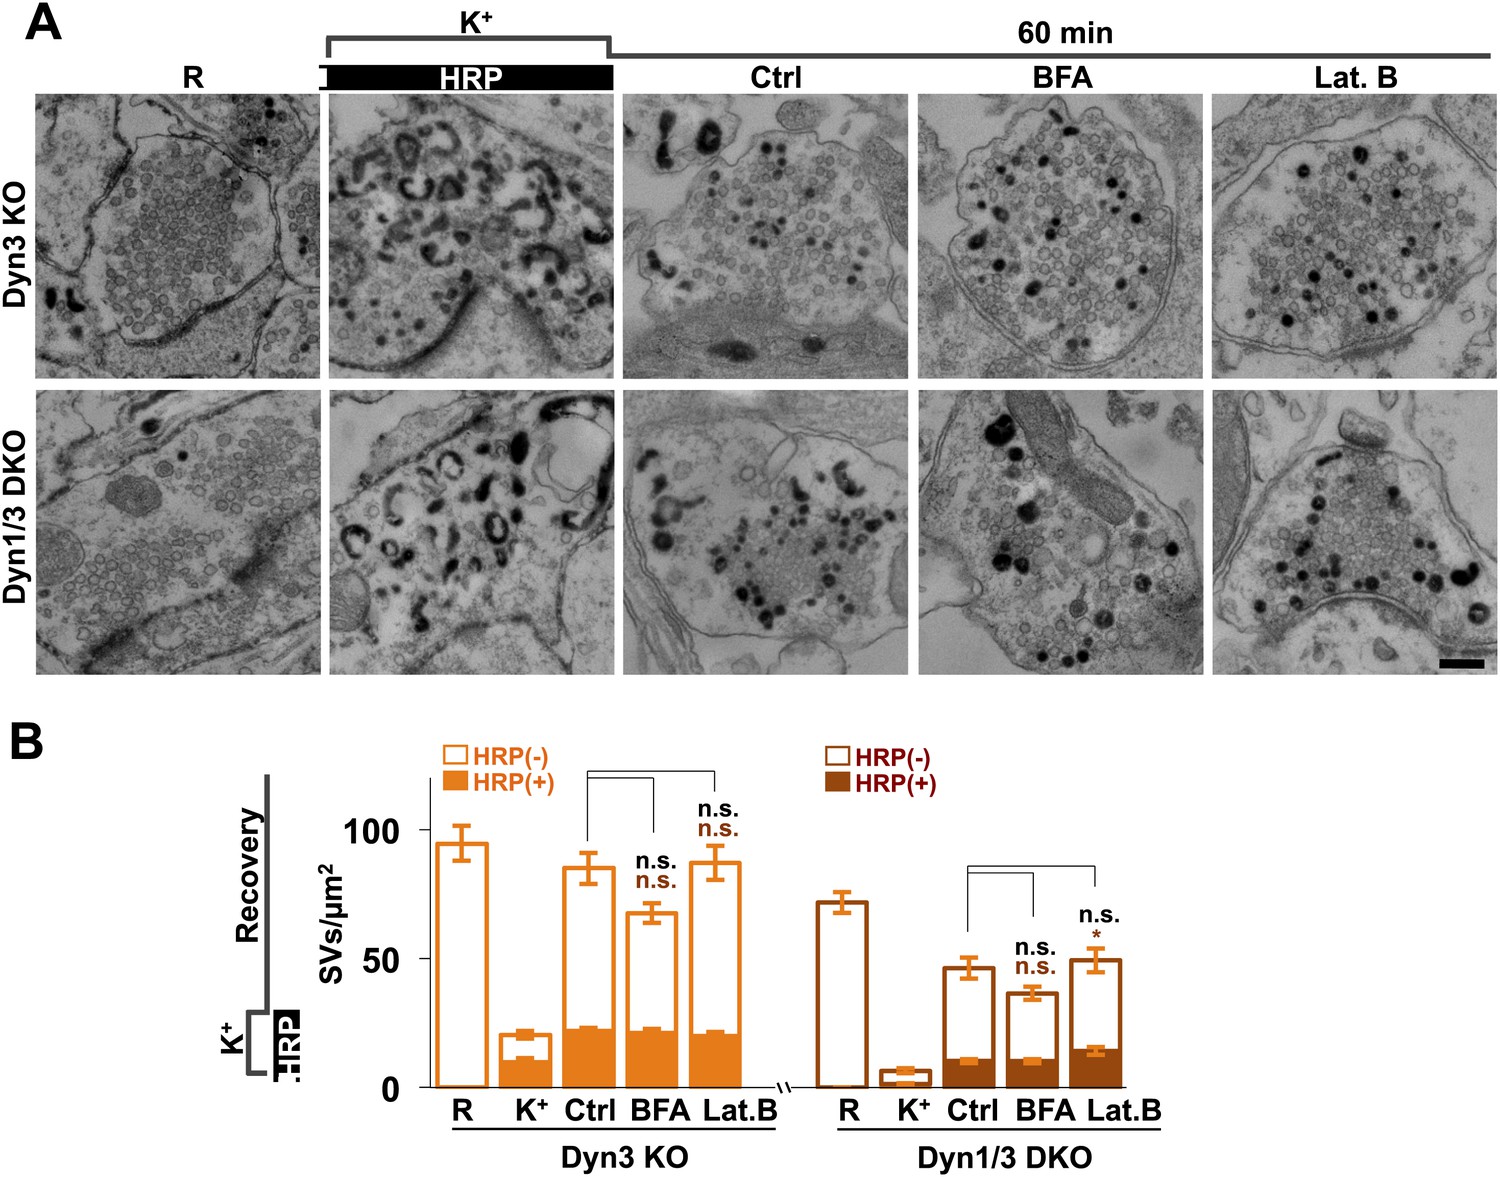
No major effect of Brefeldin A and Latrunculin B treatments on SV recovery in Dyn3 KO and Dyn1/3 DKO neurons.
Ultrastructure of Dyn1/3 DKO neurons preincubated overnight in TTX, stimulated with high K+ for 90 s in the presence of soluble HRP and then allowed to recover for 60 min in HRP-free medium. (A) Representative EM micrographs and (B) quantification of the results showing that recovery of SVs after 1 hr is similar in controls and in the presence of BFA (25 μg/ml) or Lat. B (5 μM), though a modest statistical significance was found for total SVs recovery in BFA-treated neurons and HRP-labeled SVs in Lat.B treated conditions. SVs positive for HRP reaction product are indicated by the dark portion of each bar. Scale bar = 200 nm. *p<0.05, n.s., ‘not significant’. Black asterisks refer to comparisons between total vesicles, colored asterisks to comparisons between HRP-labeled vesicles. Bars: standard error of the mean.
Figure 13
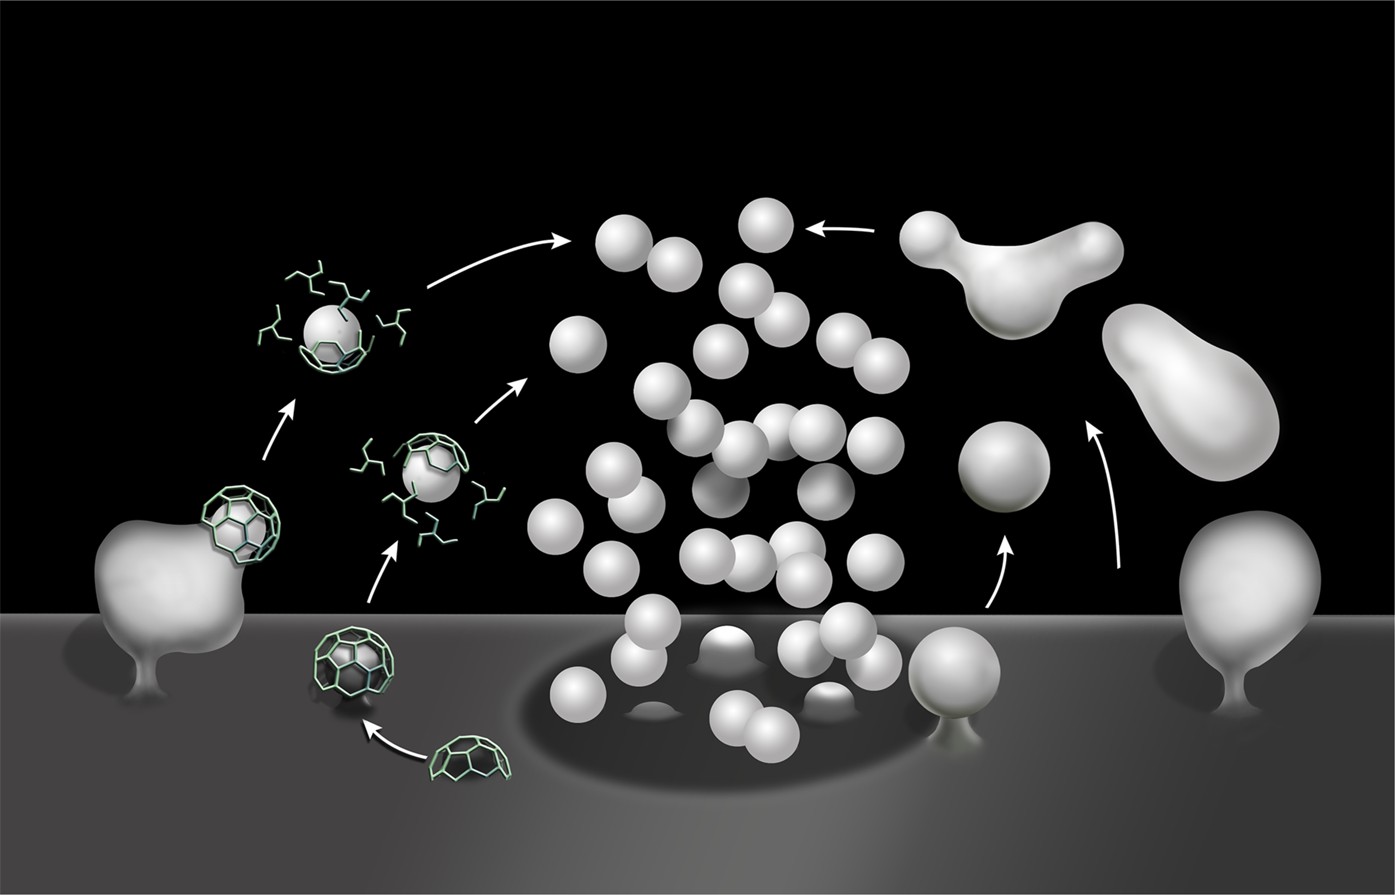
Schematic drawing illustrating clathrin-mediated and clathrin independent endocytosis of synaptic vesicle membranes.
At left is CME. At right is bulk endocytosis followed by fragmentation of bulk endosomes to generate new vesicles. As membranes of bulk endosomes are expected to be enriched in SV proteins, functional SVs may be generated by this mechanism. The uncoated invaginations occurring near active zones and described by Watanabe et al. (2013a and 2013b) may represent a form of this type of clathrin-independent endocytosis. At subsequent exo–endocytic cycles, however, CME may help reestablish SV reformation with high fidelitiy.
Download links
A two-part list of links to download the article, or parts of the article, in various formats.
Downloads (link to download the article as PDF)
Open citations (links to open the citations from this article in various online reference manager services)
Cite this article (links to download the citations from this article in formats compatible with various reference manager tools)
A dynamin 1-, dynamin 3- and clathrin-independent pathway of synaptic vesicle recycling mediated by bulk endocytosis
eLife 3:e01621.
https://doi.org/10.7554/eLife.01621


