Hedgehog signaling regulates gene expression in planarian glia
- Massachusetts Institute of Technology, United States
- Stanford University, United States
Figures
Figure 1 with 3 supplements
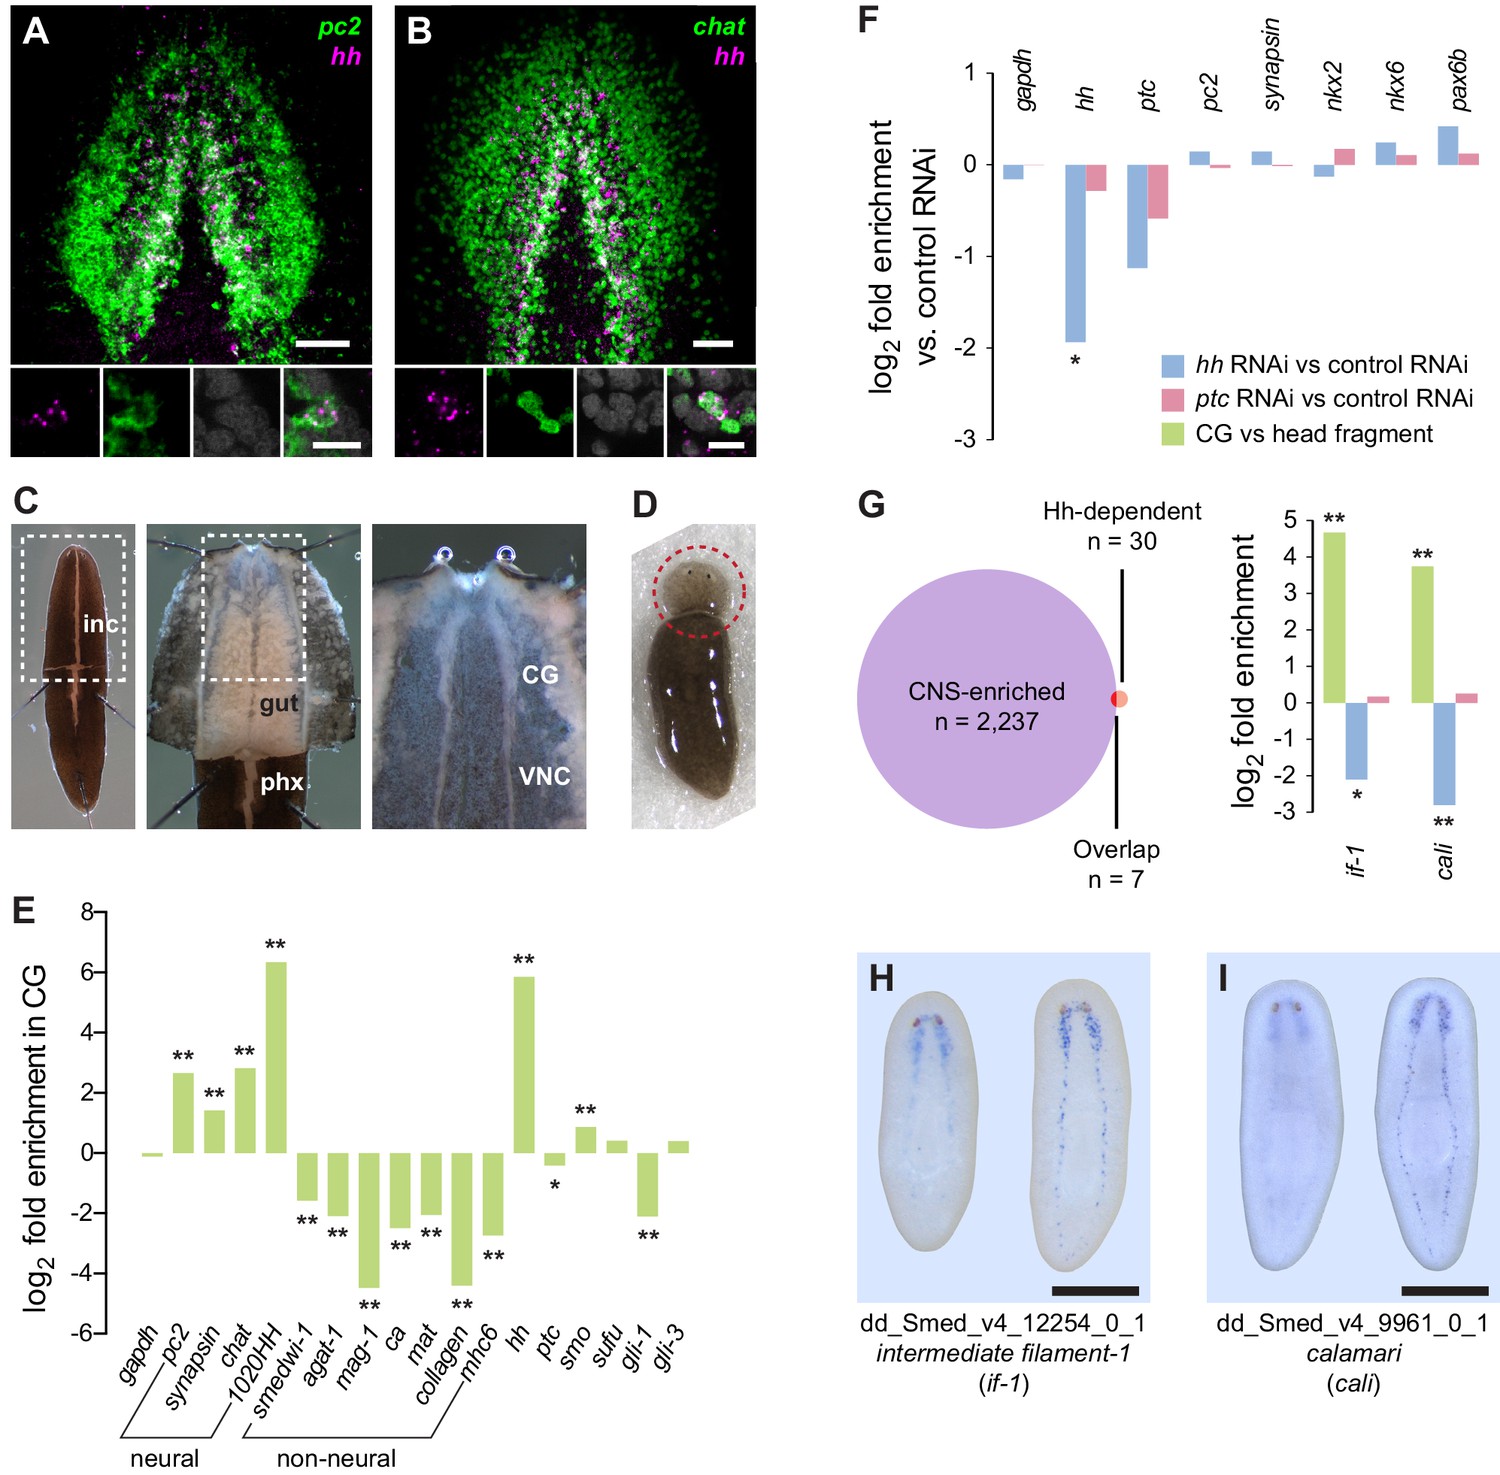
Perturbation of Hh signaling affects gene expression in the cephalic ganglia.
(A–B) Double fluorescent RNA in situ hybridization (FISH) for hh (magenta) and neuronal markers (A) pc2 or (B) chat (green) in wild-type animals. Main panels show cephalic ganglia. Lower panels show high magnification images of, from left to right, hh (magenta), pc2 or chat (green), DAPI (gray), and merged channels from a representative double-positive neuron. (C) Excision of cephalic ganglia tissue from acid-killed animals for RNA isolation. The left panel shows incision in the dorsal epidermis. Middle panel shows detail of the boxed region in the left panel after removal of dorsal epidermis. The right panel shows the detail of the boxed region in the middle panel after removal of gut tissue overlying the cephalic ganglia and ventral nerve cords. Abbreviations: inc, incision; gut, gut branches; phx, pharynx; CG, cephalic ganglia; VNC, ventral nerve cords. See methods for dissection protocol. (D) Representative image of amputation used to collect tissue for generating the head fragment Illumina libraries. Circle indicates the portion of the animal taken for RNA isolation. (E) Bar graph depicting log2 fold enrichment of selected markers in cephalic ganglia transcriptome over the head fragment transcriptome. Experimentally-verified neural markers and non-neural markers identified by brackets. Average log2 fold enrichment of all 7 CNS genes listed in Figure 1—source data 2 in cephalic ganglia transcriptome is 2.57. Average log2 fold depletion of all 22 non-CNS genes listed in Figure 1—source data 2 in cephalic ganglia transcriptome is 1.22. Statistically significant log2 fold change indicated by asterisks (*padj≤0.05, **padj≤0.001). For a list of all analyzed genes, see Figure 1—source data 1. (F) Bar graph depicting log2 fold enrichment of transcript expression level in the cephalic ganglia tissue of hh(RNAi) animals (blue bars) or ptc(RNAi) animals (red bars) over cephalic ganglia tissue from control(RNAi) animals. (G) Intersection of CNS-enriched genes (n = 2237) and Hh-dependent genes (n = 30) reveals 7 CNS genes misregulated following Hh pathway perturbation. Bar graph shows CNS enrichment (green bar) and relative expression following RNAi of hh (blue bar) or ptc (red bar) for if-1 and cali (*padj≤0.05, **padj≤ 0.01). (H–I) WISH for (H) if-1 and (I) cali. Dorsal surface shown on left, ventral surface shown on the right. Anterior up, maximum intensity projection of the ventral domain shown for A, B. Anterior up for H, I. Scale bars: 50 um for overviews, 10 um for insets for A, B; 500 um for H, I.
-
Figure 1—source data 1
Neuronal markers used in RNA-seq analysis and co-expression studies.
For each gene, log2 fold change between control(RNAi) and hh(RNAi) and between control(RNAi) and ptc(RNAi) cephalic ganglia samples are listed. References for previously published genes are listed (Cebrià and Newmark, 2005; Cebrià et al., 2002; Collins et al., 2010; Cowles et al., 2013; Currie and Pearson, 2013; Felix and Aboobaker, 2010; Fraguas et al., 2011; Gurley et al., 2008; Lapan and Reddien, 2011; März et al., 2013; Nishimura et al., 2010, 2008; Petersen and Reddien, 2008; Rink et al., 2009; Scimone et al., 2014a; Scimone et al., 2014b; Vásquez-Doorman and Petersen, 2014).
- https://doi.org/10.7554/eLife.16996.003
-
Figure 1—source data 2
Enrichment of neuronal markers and depletion of non-neuronal markers in cephalic ganglia tissue libraries.
For each gene, general expression pattern and log2 fold enrichment of CNS tissue expression over head fragment expression is listed. CNS, central nervous system; GUT, intestinal tract; MUS, muscle layer; NB, neoblasts; NP, neuropil; NPH, nephridia; PCYM, parenchyma; PHX, pharynx; PR, photoreceptors; RIM, body peripheral edge. References for previously published genes are listed (Cebrià and Newmark, 2005; Collins et al., 2010; Currie and Pearson, 2013; Eisenhoffer et al., 2008; Fraguas et al., 2011; Lapan and Reddien, 2011, 2012; Petersen and Reddien, 2009; Reddien et al., 2005b; Rink et al., 2009; Scimone et al., 2011; Witchley et al., 2013; Zayas et al., 2010).
- https://doi.org/10.7554/eLife.16996.004
-
Figure 1—source data 3
Genes with significant differential expression levels following inhibition of hh or ptc.
Criteria for selecting genes were (1) adjusted p-value (padj) of less than 0.05, (2) greater than 1000 RPKM, and (3) greater than 2-fold change in expression level either between control(RNAi) and hh(RNAi) or between control(RNAi) and ptc(RNAi). Annotations by best BLAST hit listed for each gene; "No Similarity" listed if no significant BLAST hit was found. Two genes, prog-1 and reticulocalbin-1, were described in planarians previously (Eisenhoffer et al., 2008; Zayas et al., 2010). Blue text indicates greater than 2-fold change in expression level. Green text indicates enrichment in CNS tissue versus whole head fragment.
- https://doi.org/10.7554/eLife.16996.005
-
Figure 1—source data 4
Accession numbers of protein sequences used in phylogenetic analysis of intermediate filament proteins.
Text in gray represents hypothetical proteins or sequences with high BLASTX similarity.
- https://doi.org/10.7554/eLife.16996.006
Figure 1—figure supplement 1
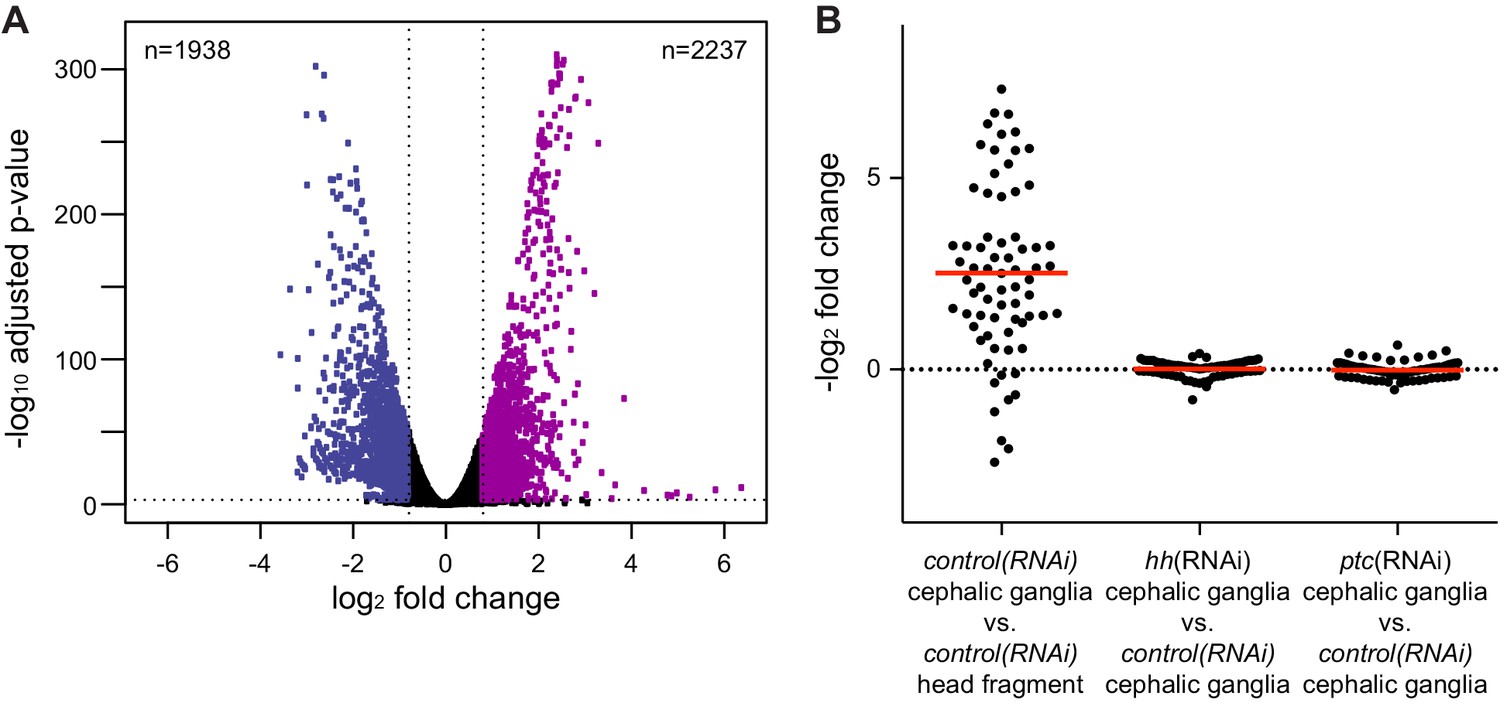
Analysis of RNA-seq libraries.
(A) Volcano plot of differential expression between head fragment transcriptome and cephalic ganglia transcriptome. Dots represent the magnitude of differential expression versus the significance for each gene with an average RPKM over 100. A horizontal dotted line indicates significance cutoff and vertical lines indicate the differential expression magnitude cutoff. Number of genes significantly enriched (purple dots) or depleted (blue dots) in cephalic ganglia tissue listed in the upper right and left corners, respectively. (B) Column scatter plot of differential expression of neural markers between conditions. Each dot represents one neural marker. The solid red line indicates mean log2 fold change of all analyzed neural markers for each condition.
Figure 1—figure supplement 2
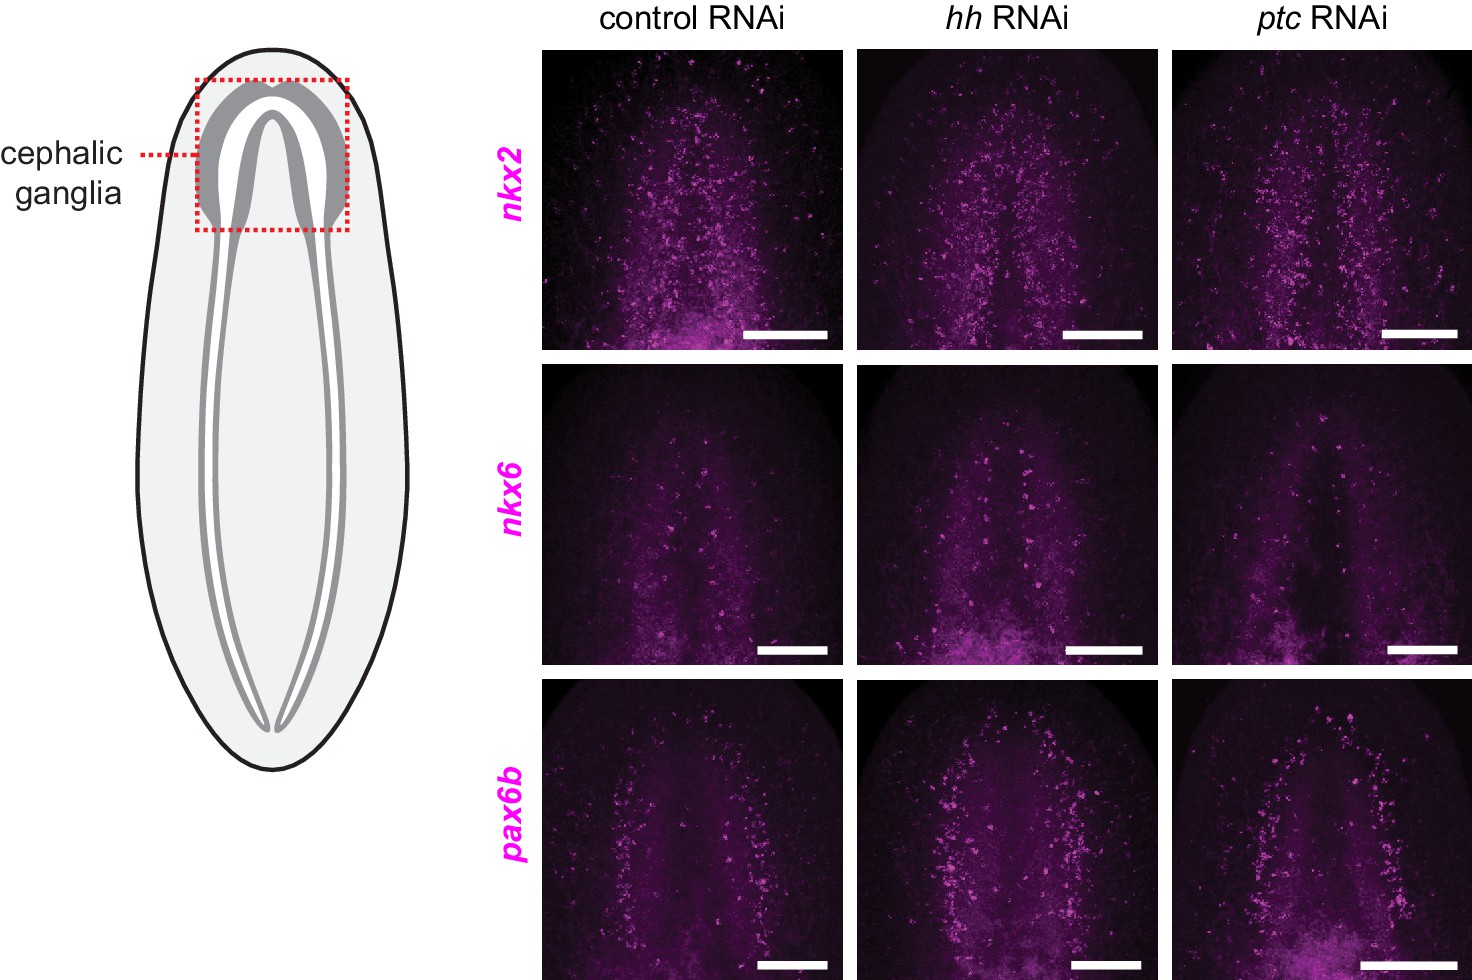
Hh signaling pathway perturbation does not affect regional expression of transcription factors in the central nervous system.
FISH of orthologs of vertebrate CNS development transcription factors following perturbation of Hh signaling pathway components. Schematic indicates a region of the animal displayed in images. Inhibition of hh (center column) or ptc (right column) shows no change in the expression pattern of nkx2 (top row), nkx6 (middle row), or pax6b (bottom row) from controls (left column). Anterior up, maximum intensity projection of ventral side shown. Scale bars: 100 um for all.
Figure 1—figure supplement 3
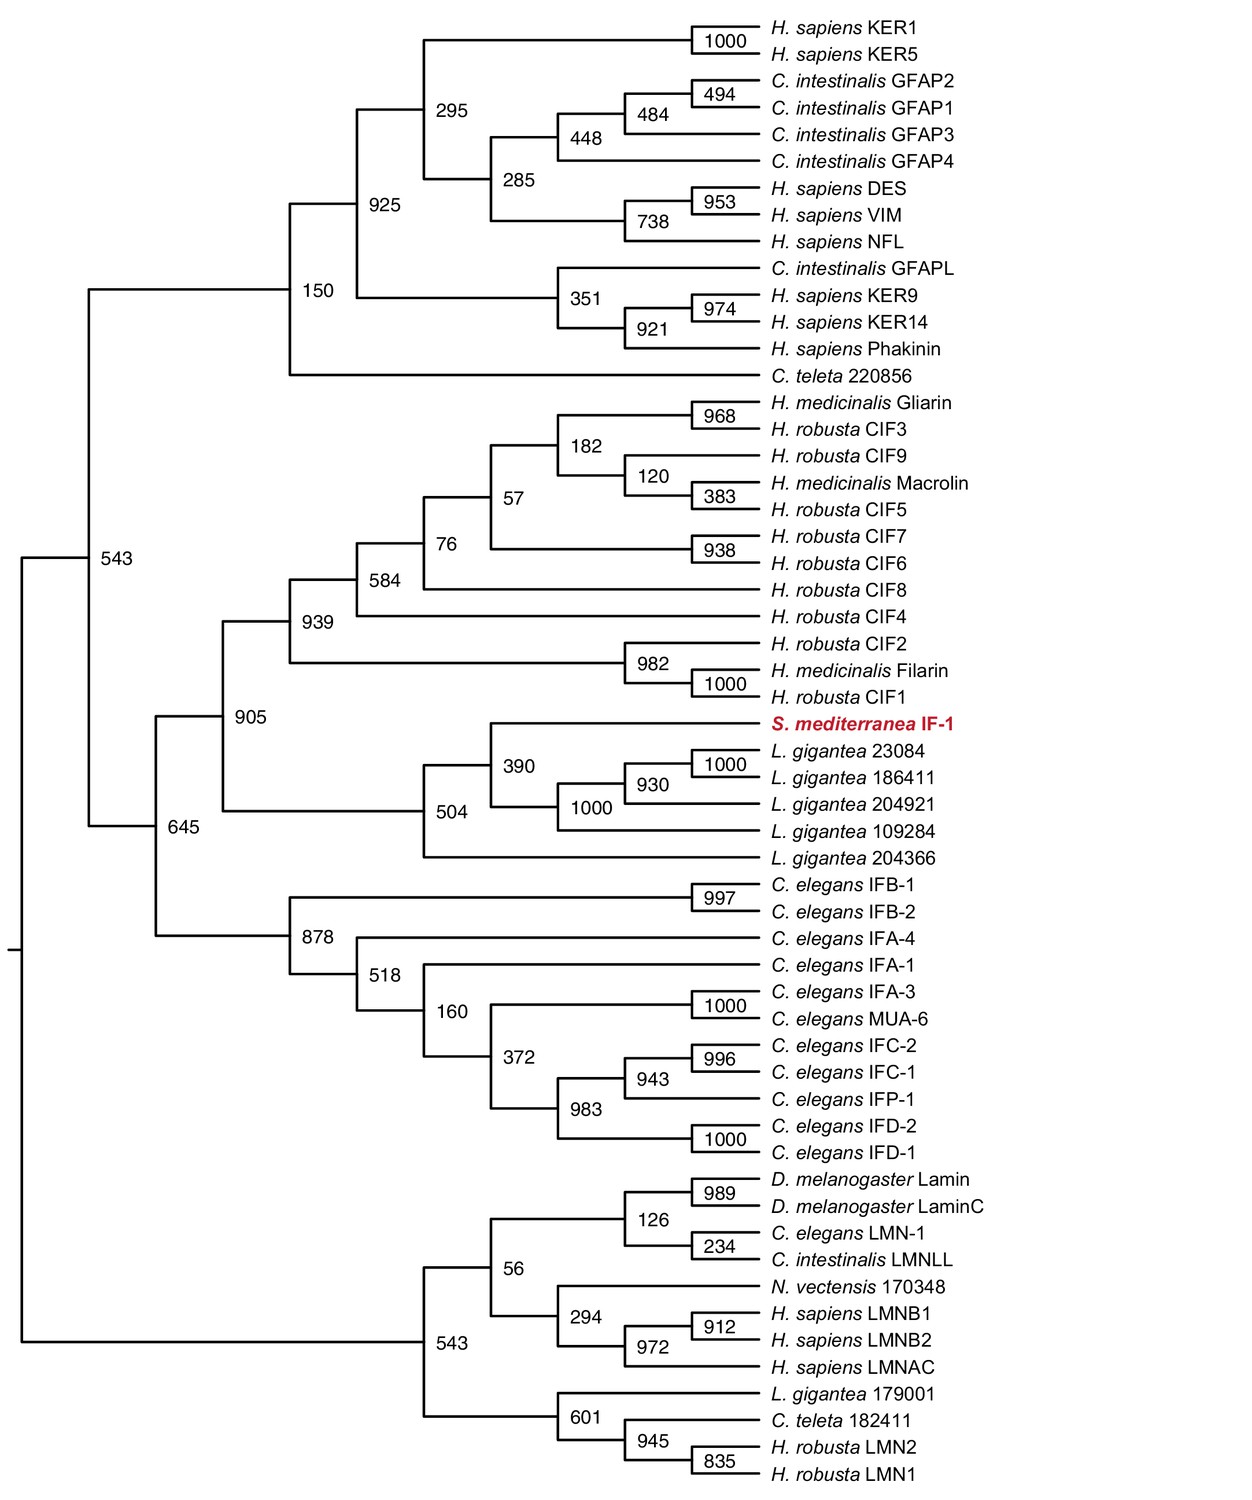
Maximum likelihood cladogram for cytoplasmic intermediate filaments.
S. mediterranea IF-1 clusters with Protostome cytoplasmic intermediate filaments, which diverged prior to the vertebrate radiation of multiple intermediate filament types. Nuclear intermediate filament proteins were used as an outgroup to root the tree. Bootstrap values listed at branch junctions. Accession numbers of protein sequences used in the analysis listed in Figure 1—source data 4.
Figure 2 with 2 supplements
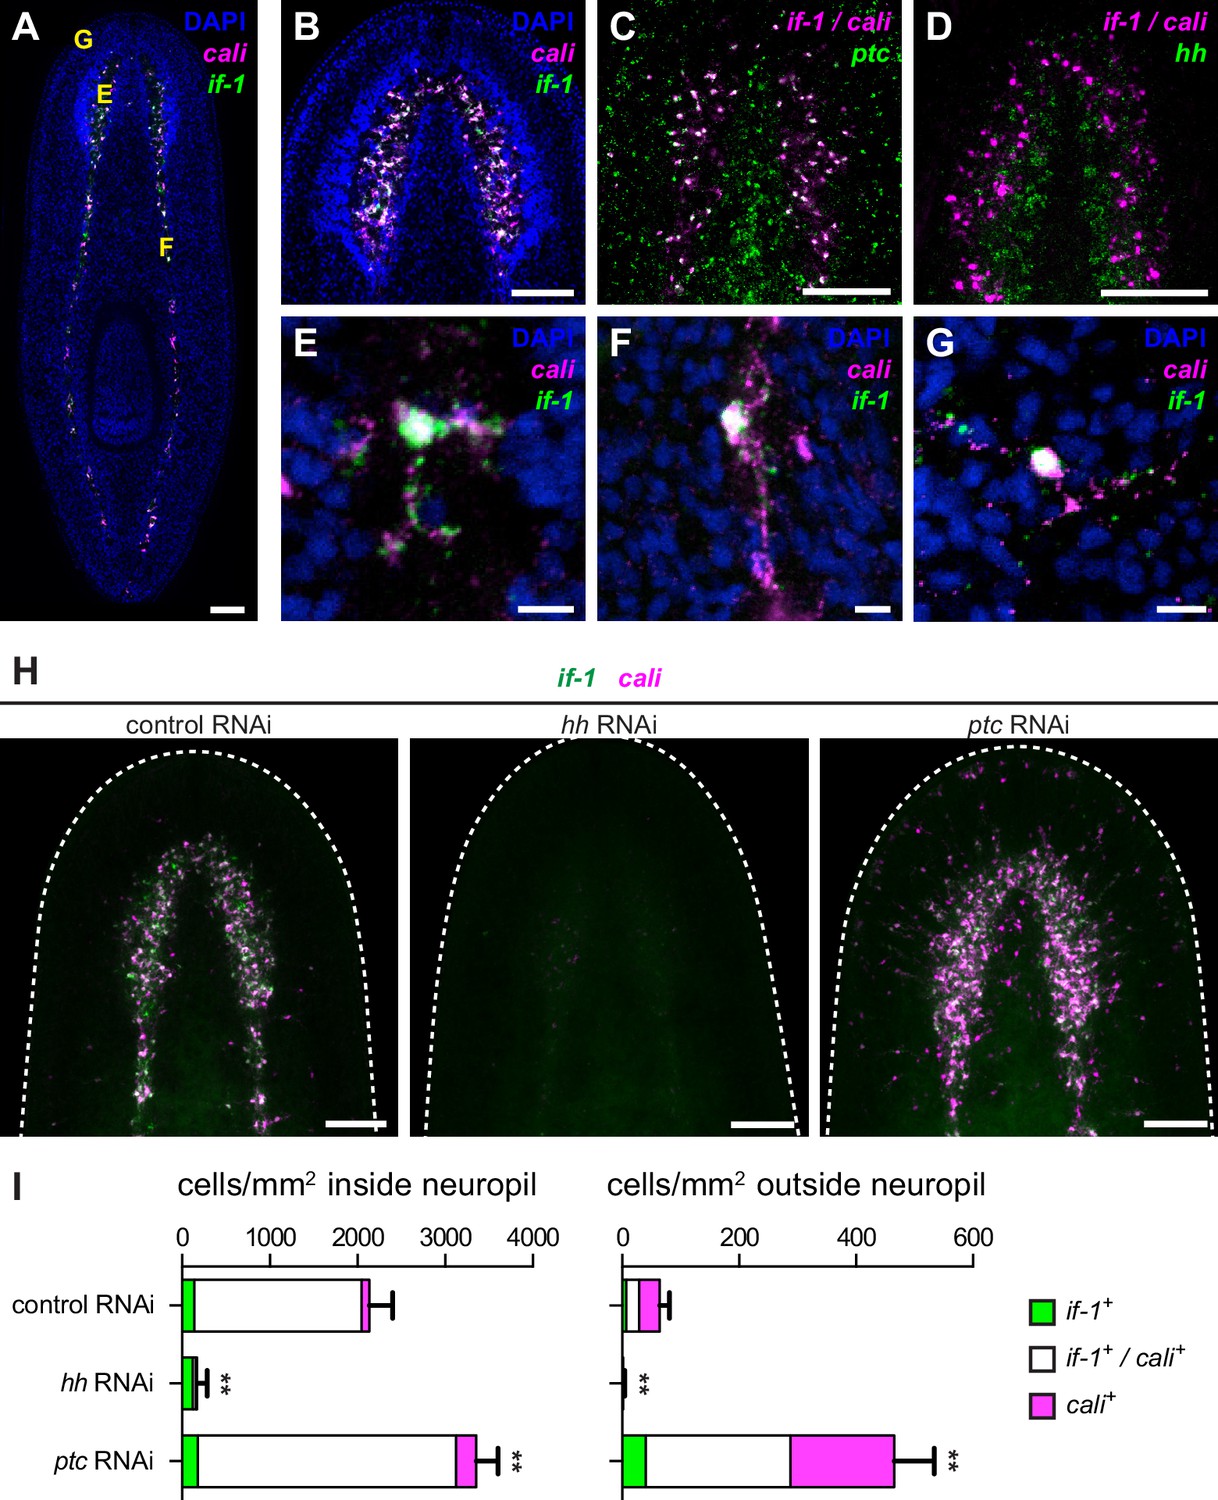
Expression of if-1 and cali in neuropil cells is dependent on Hh signaling.
(A) Double FISH for if-1 (green) and cali (magenta) in wild-type animals. Cells co-expressing both markers are located in the cell body-sparse neuropil of the cephalic ganglia and ventral nerve cords. The cell body-rich cortical region is labeled by DAPI (blue). Yellow letters indicate regions detailed in E–G. (B) Double FISH for if-1 and cali in cephalic ganglia neuropil. (C) Double FISH for if-1/cali (magenta) and ptc (green) indicates co-expression of the genes. Probes for if-1 and cali were combined into a single channel (denoted if-1/cali) to improve coverage and signal intensity. 97.8 ± 2.1% of if-1+/cali+ cells in the neuropil and 100% of if-1+/cali+ cells outside the neuropil expressed ptc. (D) Double FISH for if-1/cali (magenta) and hh (green) indicates lack of co-expression. (E–G) Single if-1+/cali+ cells in the (E) cephalic ganglion neuropil, (F) ventral nerve cord, and (G) head rim. (H) Double FISH for if-1 (green) and cali (magenta) in animals following inhibition of a control gene, hh, or ptc. White dotted line delineates the edge of animal. (I) Quantification of the results from (H), with distribution of if-1+ only cells (green), cali+ only cells (magenta), and if-1+/cali+ cells (white). Within the neuropil, cells expressing one or both markers are present at 2135.6 ± 265.8 cells/mm2 in control(RNAi) conditions (n = 5 animals), 169.3 ± 118.6 cells/mm2 in hh(RNAi) conditions (n = 4 animals), and 3354.0 ± 249.5 cells/mm2 in ptc(RNAi) conditions (n = 5 animals). Differences were significant in both hh RNAi and ptc RNAi (**p<0.001, two-tailed t test). In the head not including the neuropil region, cells expressing one or both markers are present at 64.4 ± 16.6 cells/mm2 in control(RNAi) conditions (n = 5 animals), 1.5 ± 2.9 cells/mm2 in hh(RNAi) conditions (n = 4 animals), and 465.4 ± 68.7 cells/mm2 in ptc(RNAi) conditions (n = 5 animals). Differences were significant in both hh RNAi and ptc RNAi (**p<0.001, two-tailed t test). Anterior up, ventral side shown for A–D, H. Scale bars: 100 um for A–D, H; 10 um for E–G.
-
Figure 2—source data 1
Cell counts for if-1 and cali co-expression.
- https://doi.org/10.7554/eLife.16996.011
Figure 2—figure supplement 1
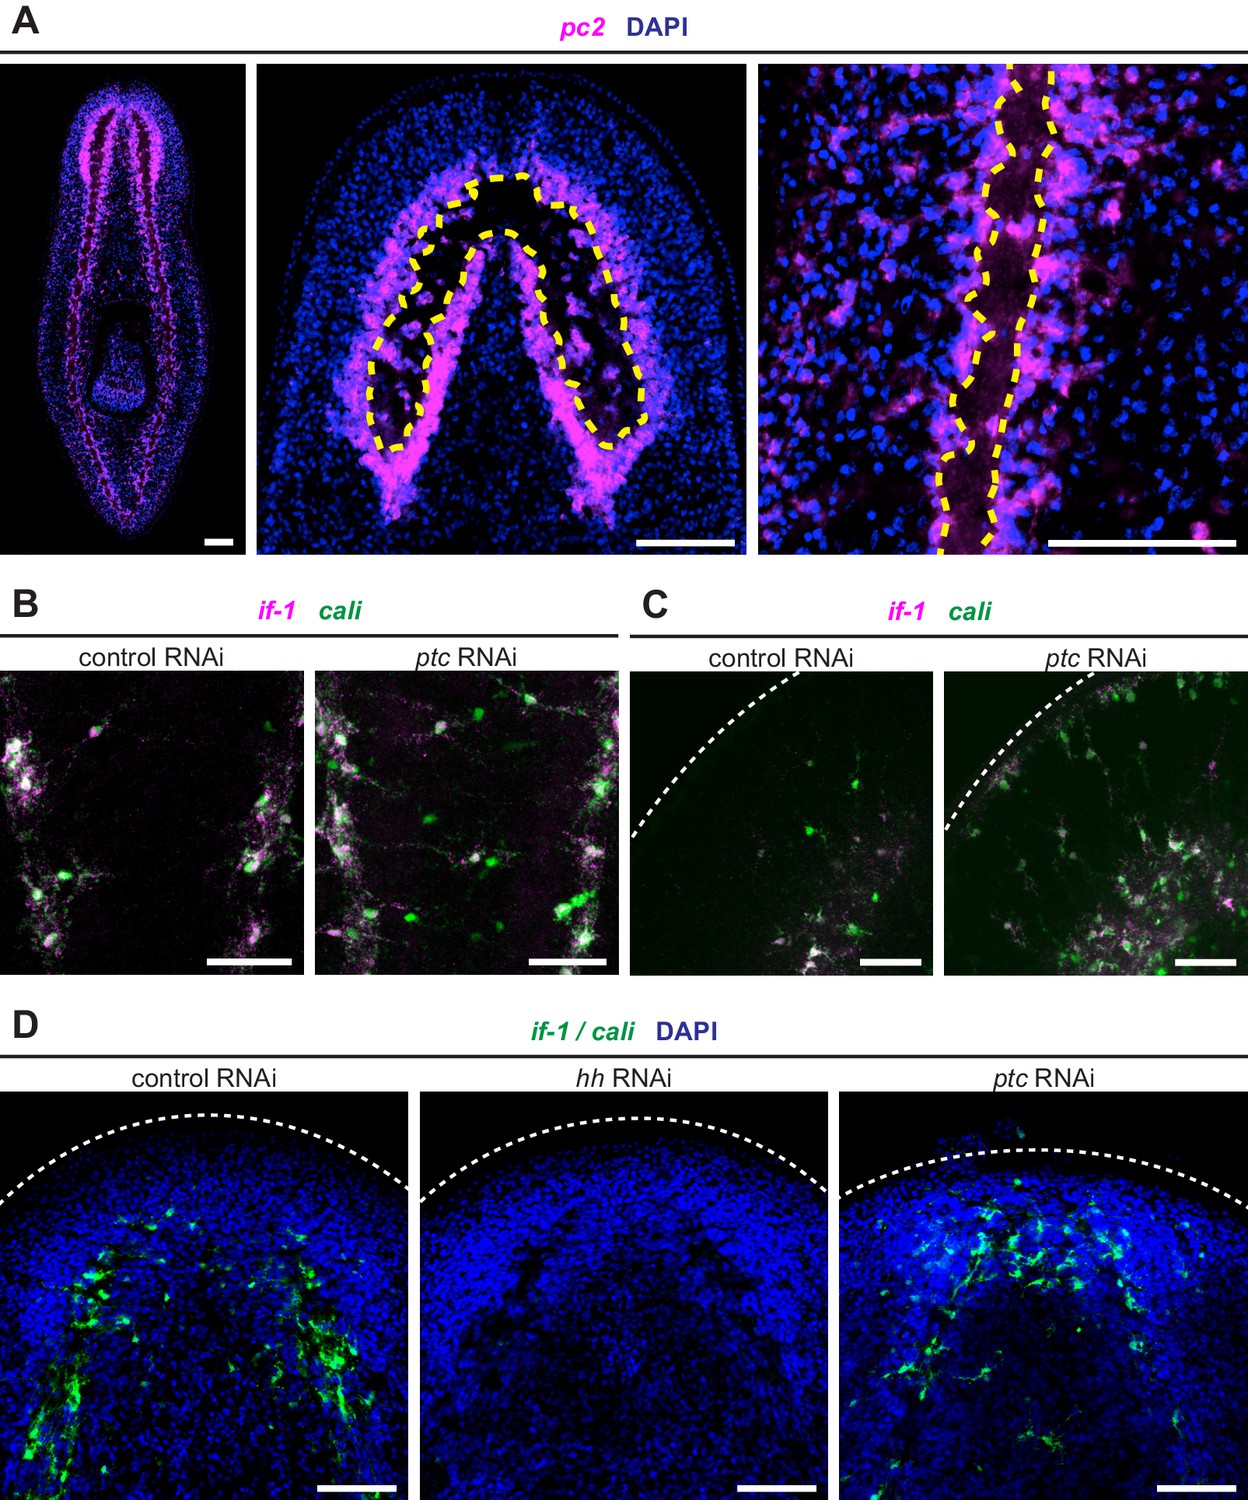
if-1+/cali+ cells are found in multiple regions.
(A) The neuropil of the planarian CNS revealed by DAPI and FISH for pc2. The neuropil is the cell body-sparse region surrounded by neurons and extends from the cephalic ganglia through the ventral nerve cords (left). Neuropil boundaries (yellow dashed line) in cephalic ganglia images (center) were based on the borders between DAPI-dense regions and DAPI-sparse regions. Neuropil boundaries can also be resolved in this fashion in the ventral nerve cords (right). Cells within the CNS not entirely surrounded by other cells (i.e. adjacent to the cell body-sparse area) were considered part of the neuropil. (B–C) Double FISH for if-1 (magenta) and cali (green) in animals following inhibition of a control gene or ptc. The images show detail of (B) the tail region between the ventral nerve cords and (C) the head rim region. (D) FISH for if-1/cali (green) in d6 anterior blastemas following inhibition of a control gene, hh, or ptc. Images of anterior blastemas show accumulation of if-1+/cali+ cells during regeneration. Images of the pharyngeal region show presentation of hh or ptc phenotype. Nuclei labeled with DAPI (blue). Anterior up, ventral side shown for all. Scale bars: 100 um for A and D; 50 um for B and C.
Figure 2—figure supplement 2
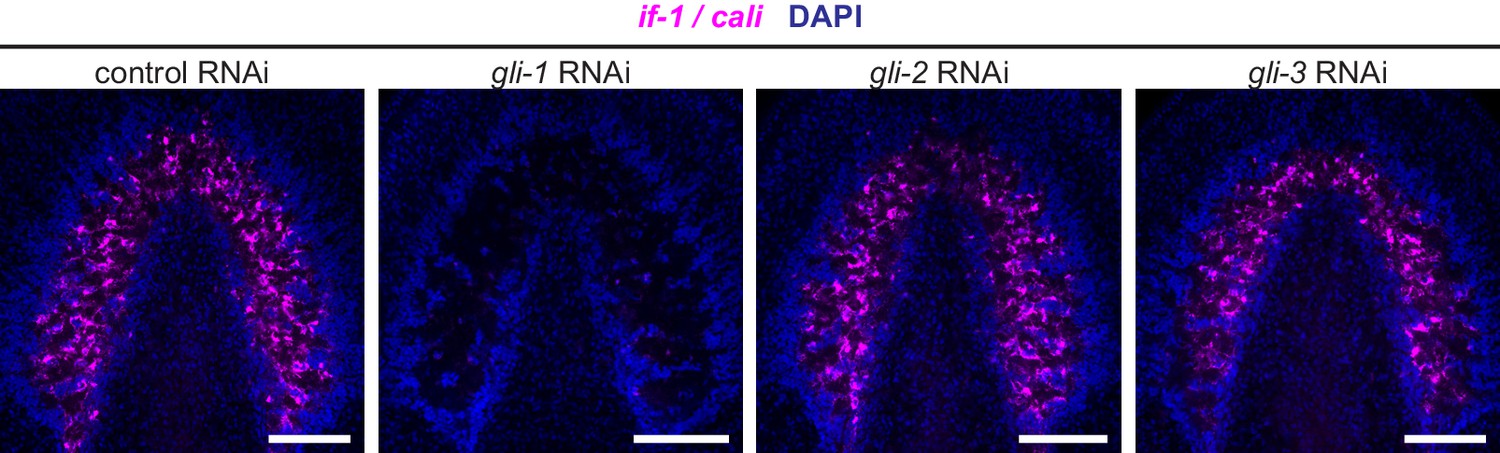
if-1 and cali expression following inhibition of gli transcription factors.
FISH for if-1/cali (magenta) in animals following inhibition of a control gene, gli-1, gli-2, or gli-3. Nuclei labeled with DAPI (blue). Anterior up, ventral side shown for all. Scale bars: 100 um for all.
Figure 3 with 6 supplements
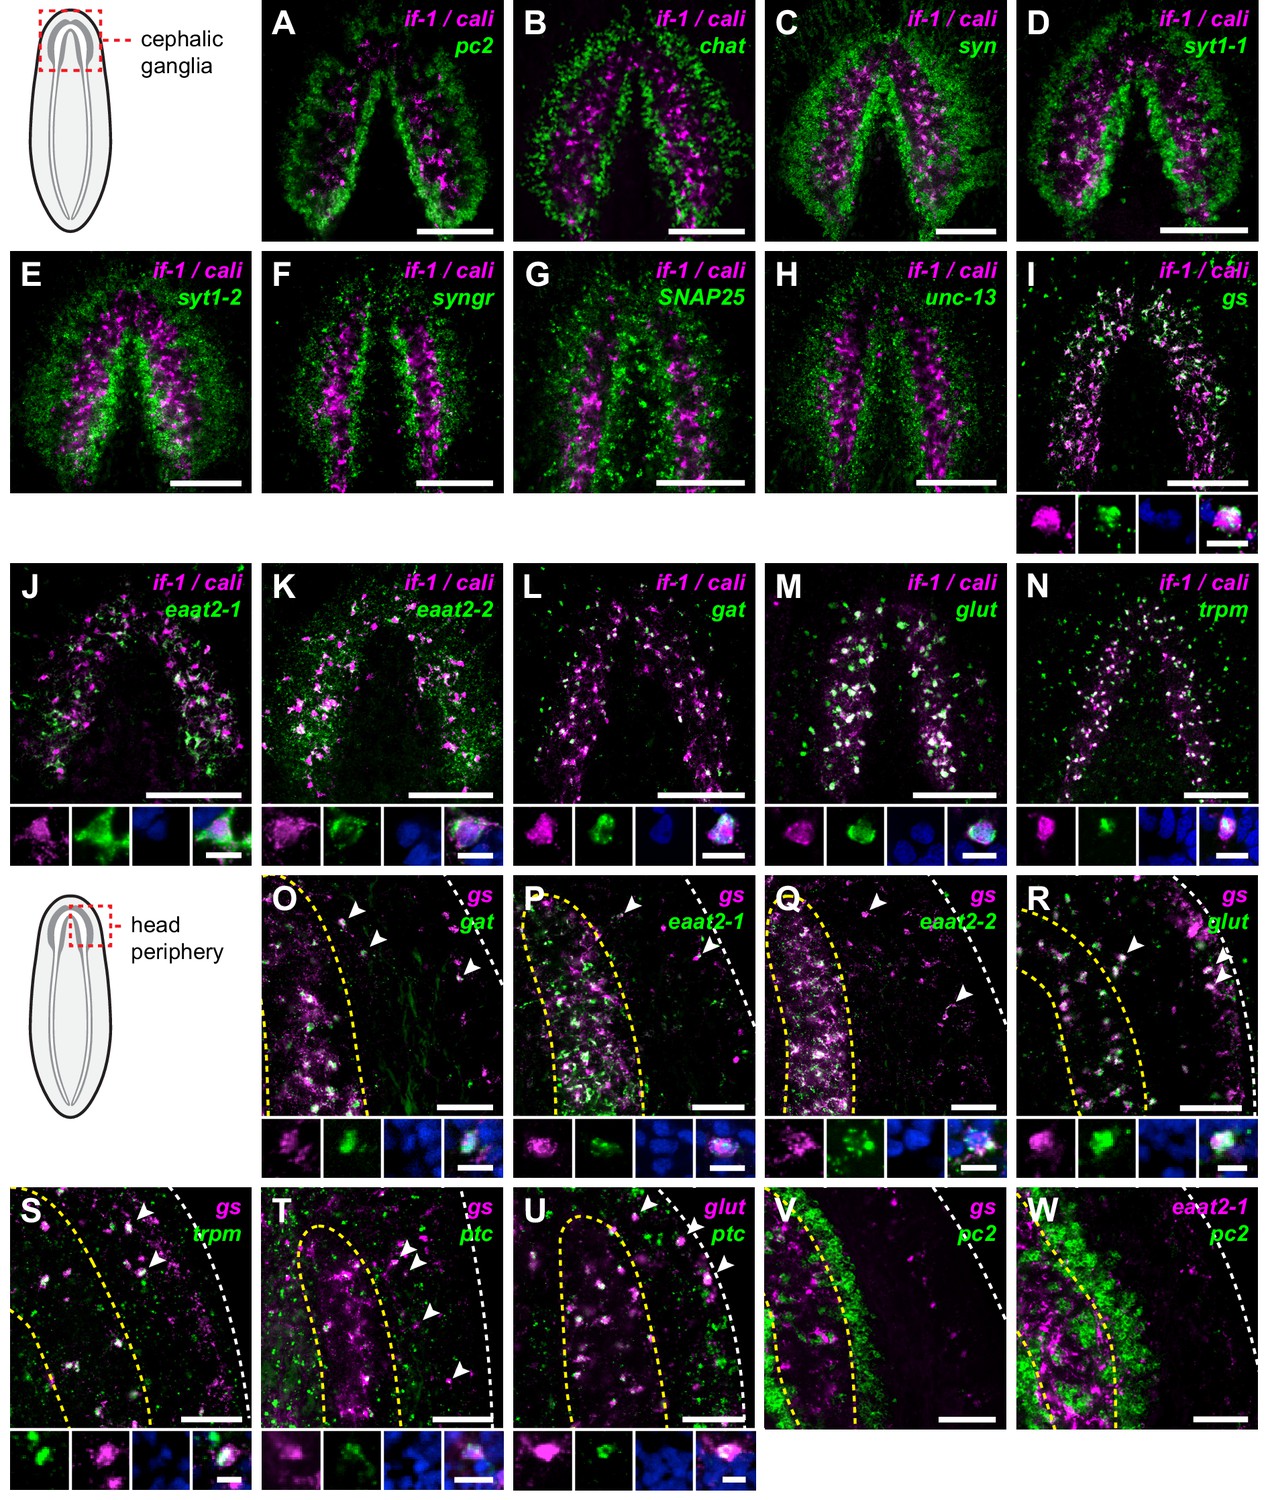
if-1+/cali+ cells express neurotransmitter reuptake and metabolism genes.
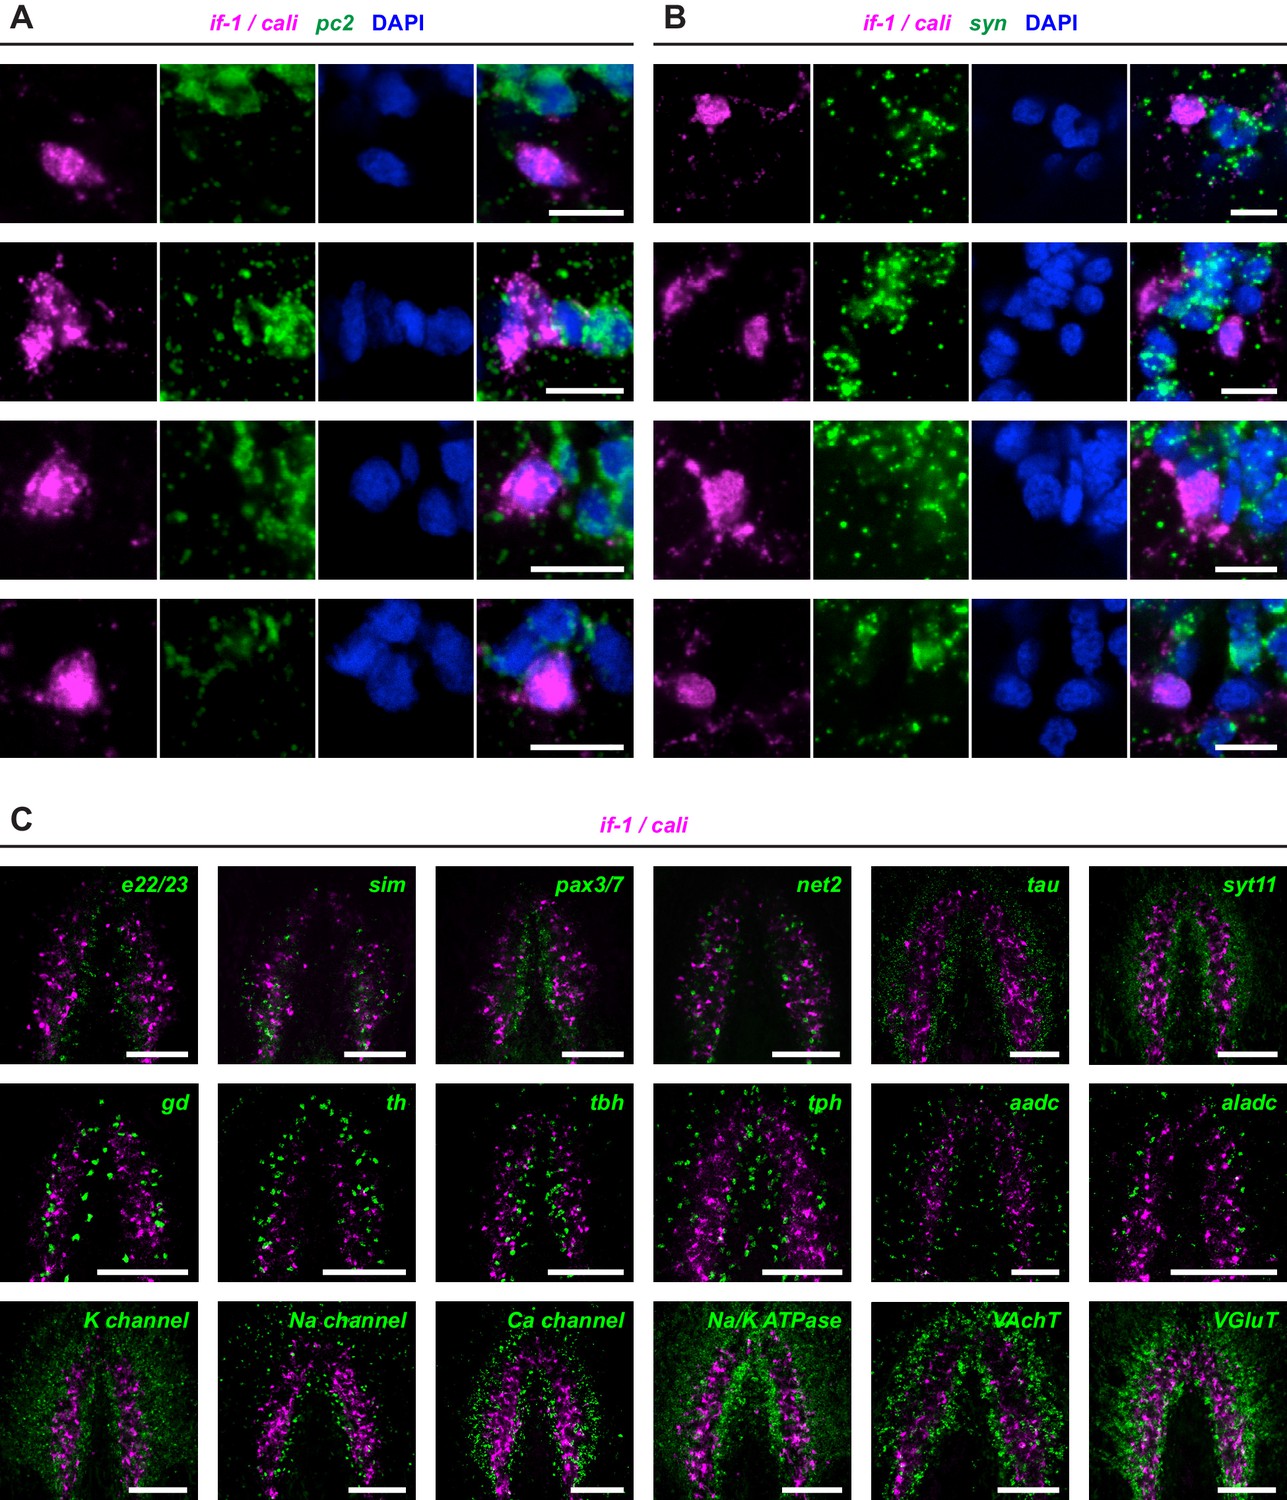
(A–N) Schematic indicates region of focus. (A–H) Double FISH of if-1/cali (magenta) and neural markers (A) pc2, (B) chat, (C) syn, (D) syt1-1, (E) syt1-2, (F) syngr, (G) SNAP25, and (H) unc-13 (green). No co-expression was observed between neural markers and if-1 and cali. (I–N) Double FISH of if-1/cali (magenta) with orthologs of vertebrate astrocyte markers (I) gs, (J) eaat2-1, (K) eaat2-2, (L) gat, (M) glut, and (N) trpm (green). Lower panels show high magnification images of, from left to right, if-1/cali (magenta), astrocyte marker ortholog (green), DAPI (blue), and merged channels from a representative double-positive cell. (O–W) Schematic indicates region of focus. The images show one hemisphere of the cephalic ganglia and the lateral parenchymal space. White dotted line delineates the edge of animal. Yellow dotted line delineates borders of the neuropil. (O–S) Double FISH of gs (magenta) with (O) gat, (P) eaat2-1, (Q) eaat2-2, (R) glut, and (S) trpm (green). 98.7 ± 1.4% of glut+ cells in the neuropil and 99.7 ± 0.7% of glut+ cells outside the neuropil expressed gs. 96.8 ± 4.6% of trpm+ cells in the neuropil and 93.8 ± 4.5% of trpm+ cells outside the neuropil expressed gs. Arrowheads denote double-positive cells outside the neuropil. Lower panels show high magnification images of, from left to right, gs (magenta), astrocyte marker ortholog (green), DAPI (blue), and merged channels from a representative double-positive cell. (T–U) Double FISH of ptc (green) with (T) gs and (U) glut (magenta). 99.3 ± 0.7% of glut+ cells in the neuropil and 90.4 ± 4.5% of glut+ cells outside the neuropil expressed ptc. Arrowheads denote double-positive cells. Lower panels show high magnification images of, from left to right, gs or glut (magenta), ptc (green), DAPI (blue), and merged channels from a representative double-positive cell. (V–W) Double FISH of pc2 (green) with (V) gs and (W) eaat2-1 (magenta). No double-positive cells were observed in both cases. Anterior up, ventral side shown for all. Maximum intensity projections shown for I–N. Scale bars: 100 um for overviews, 10 um for insets for A–N; 50 um for overviews, 10 um for insets for O–W.
-
Figure 3—source data 1
Cell counts for glia marker co-expression.
- https://doi.org/10.7554/eLife.16996.015
-
Figure 3—source data 2
Accession numbers of protein sequences used in phylogenetic analysis of excitatory amino acid transporters.
Text in gray represents hypothetical proteins or sequences with high BLASTX similarity.
- https://doi.org/10.7554/eLife.16996.016
-
Figure 3—source data 3
Accession numbers of protein sequences used in phylogenetic analysis of GABA transporters.
Text in gray represents hypothetical proteins or sequences with high BLASTX similarity.
- https://doi.org/10.7554/eLife.16996.017
-
Figure 3—source data 4
Accession numbers of protein sequences used in phylogenetic analysis of glucose transporters.
Text in gray represents hypothetical proteins or sequences with high BLASTX similarity.
- https://doi.org/10.7554/eLife.16996.018
-
Figure 3—source data 5
Accession numbers of protein sequences used in phylogenetic analysis of transient receptor potential channels.
Text in gray represents hypothetical proteins or sequences with high BLASTX similarity.
- https://doi.org/10.7554/eLife.16996.019
Figure 3—figure supplement 1
if-1 and cali expression does not overlap with neuronal marker expression.
(A–B) Double FISH for if-1/cali and (A) pc2 or (B) syn. Each row shows high magnification images of, from left to right, if-1/cali (magenta), pc2 or syn (green), DAPI (blue), and merged channels from a representative cell cluster. (C) Double FISH for if-1/cali and other described neuronal markers in wild-type untreated animals. See Figure 1—source data 1 for more information of neural markers used in co-expression studies. Anterior up, ventral side shown for C. Scale bars: 10 um for A, B; 100 um for C.
Figure 3—figure supplement 2
Expression patterns of markers for if-1+/cali+ cells.
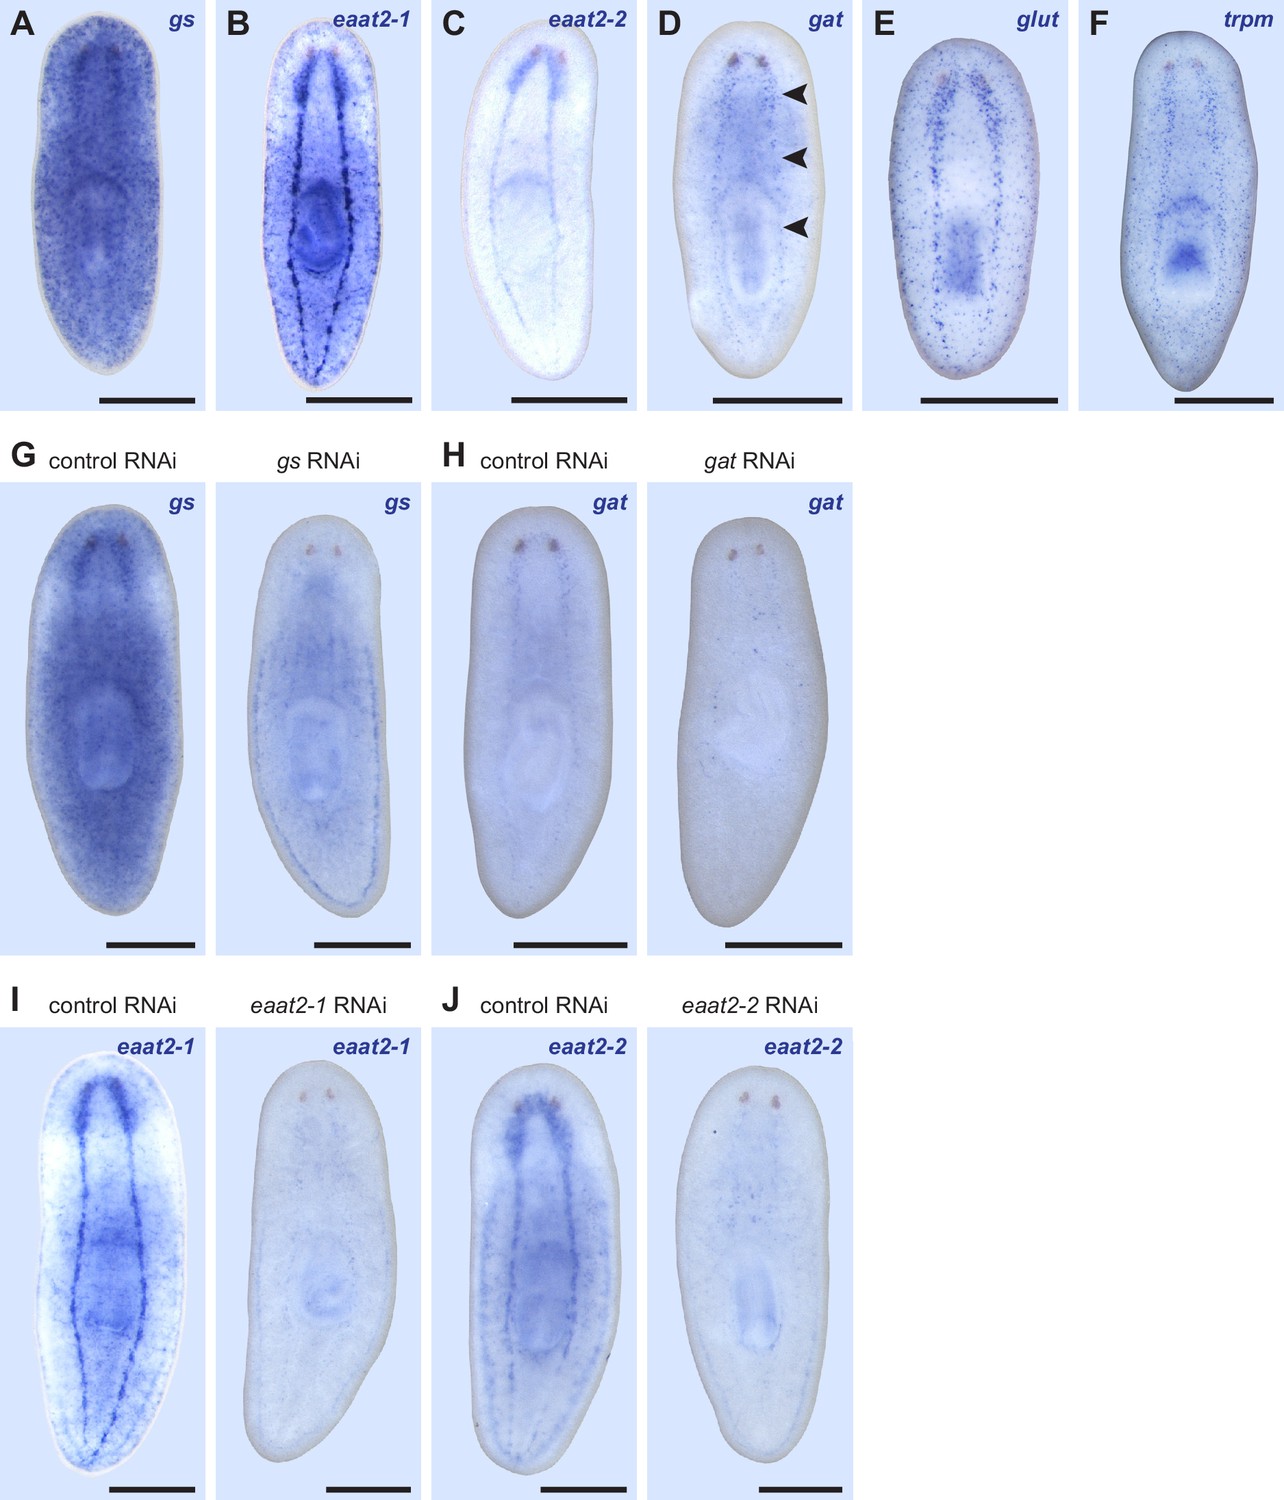
(A–F) WISH for (A) gs, (B) eaat2-1, (C) eaat2-2, (D) gat, (E) glut, and (F) trpm. Black arrowheads indicate light staining. (G) gs(RNAi) animals display reduced gs expression in the CNS compared to control animals (n = 4/4). (H) gat(RNAi) animals display slightly reduced gat expression in the CNS compared to control animals (n = 4/5). (I) eaat2-1(RNAi) animals display reduced eaat2-1 expression in the CNS compared to control animals (n = 9/9). (J) eaat2-2(RNAi) animals display reduced eaat2-2 expression in the CNS compared to control animals (n = 6/6). Anterior up, ventral side shown. Scale bars: 500 um.
Figure 3—figure supplement 3
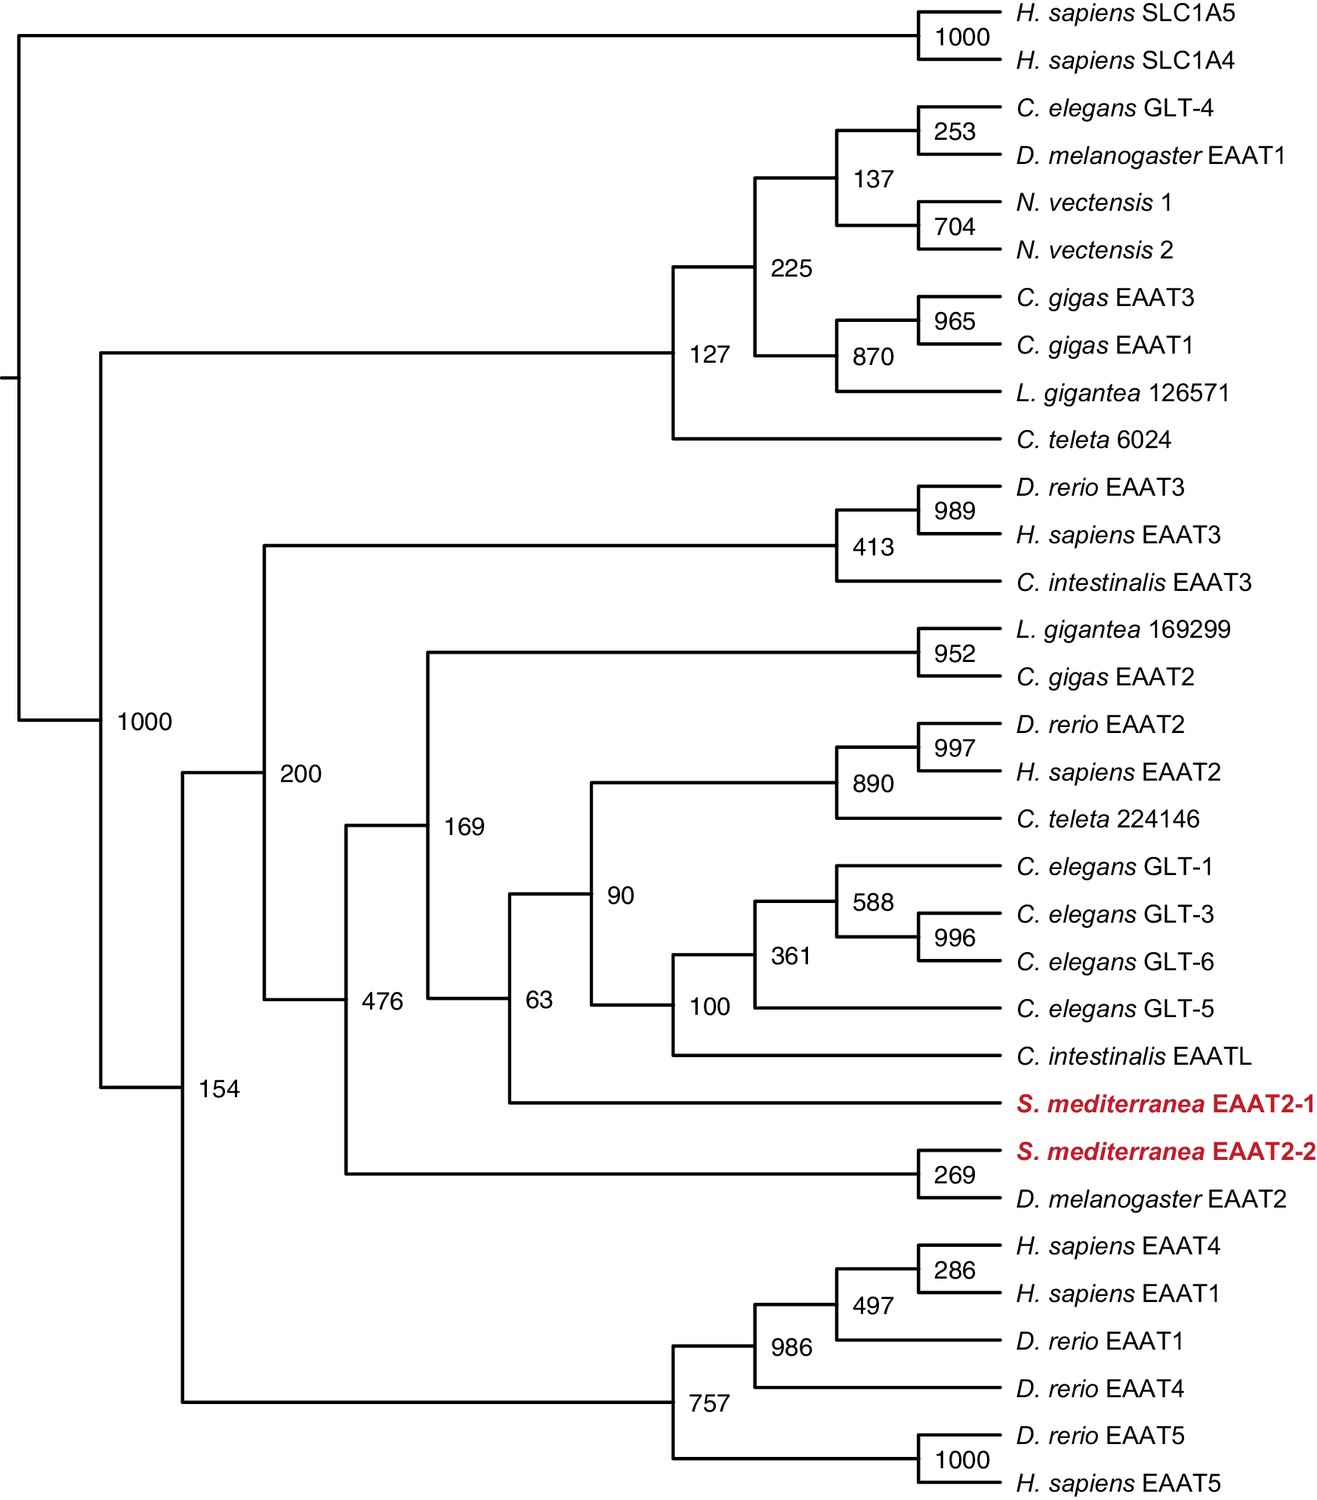
Maximum likelihood cladogram for excitatory amino acid transporters.
S. mediterranea EAAT2-1 and EAAT2-2 fall within the excitatory amino acid transporter 2 clade.
Neutral amino acid transporter proteins SLC1A5 and SLC1A6 were used as an outgroup to root the tree. Topology of vertebrate excitatory amino acid transporters roughly recapitulates previous results (Gesemann et al., 2010). Bootstrap support values listed at branch junctions. Accession numbers of protein sequences used in the analysis listed in Figure 3—source data 2.
Figure 3—figure supplement 4
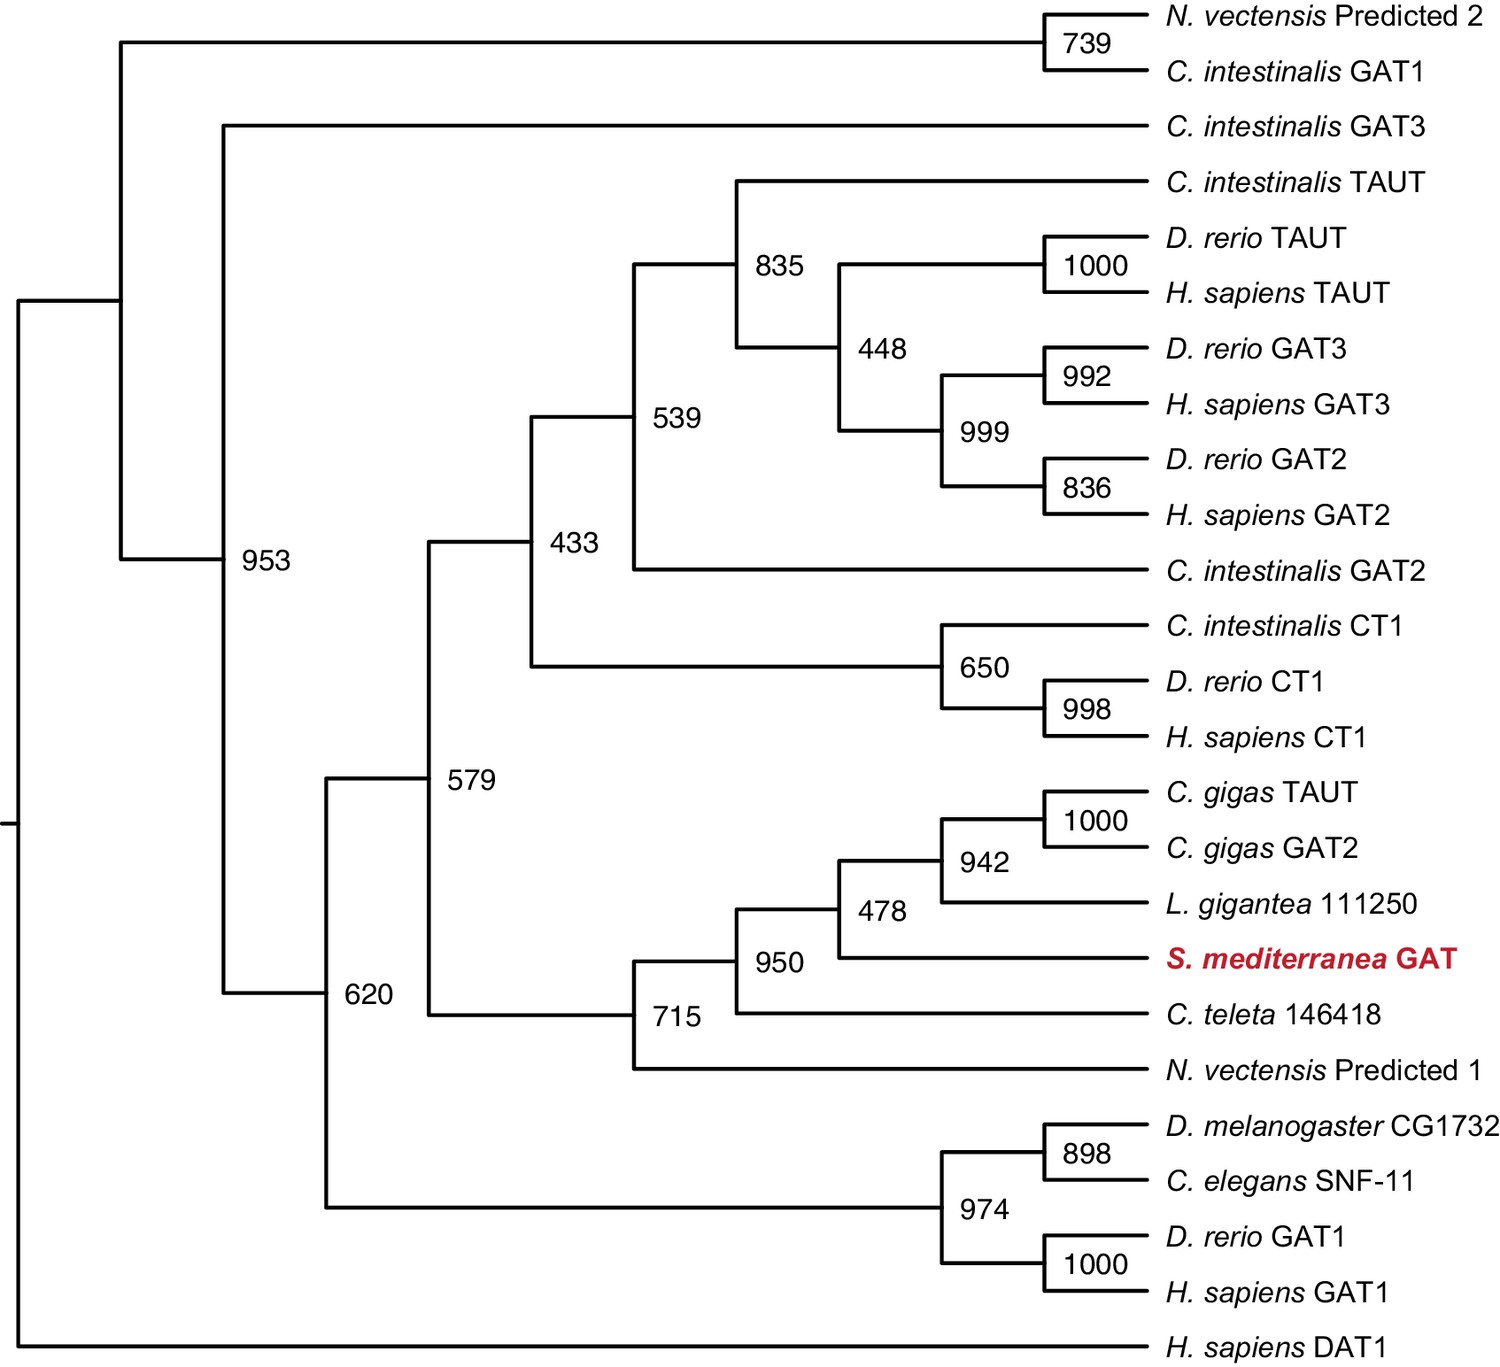
Maximum likelihood cladogram for GABA transporters.
S. mediterranea GAT is placed with other Protostome GABA transporters, which have diverged from the vertebrate branch that includes GAT-2, GAT-3, CT1, and TAUT. Dopamine transporter DAT1 was used as an outgroup to root the tree. Topology roughly recapitulates previous results (Kinjo et al., 2013). Bootstrap support values listed at branch junctions. Accession numbers of protein sequences used in the analysis listed in Figure 3—source data 3.
Figure 3—figure supplement 5
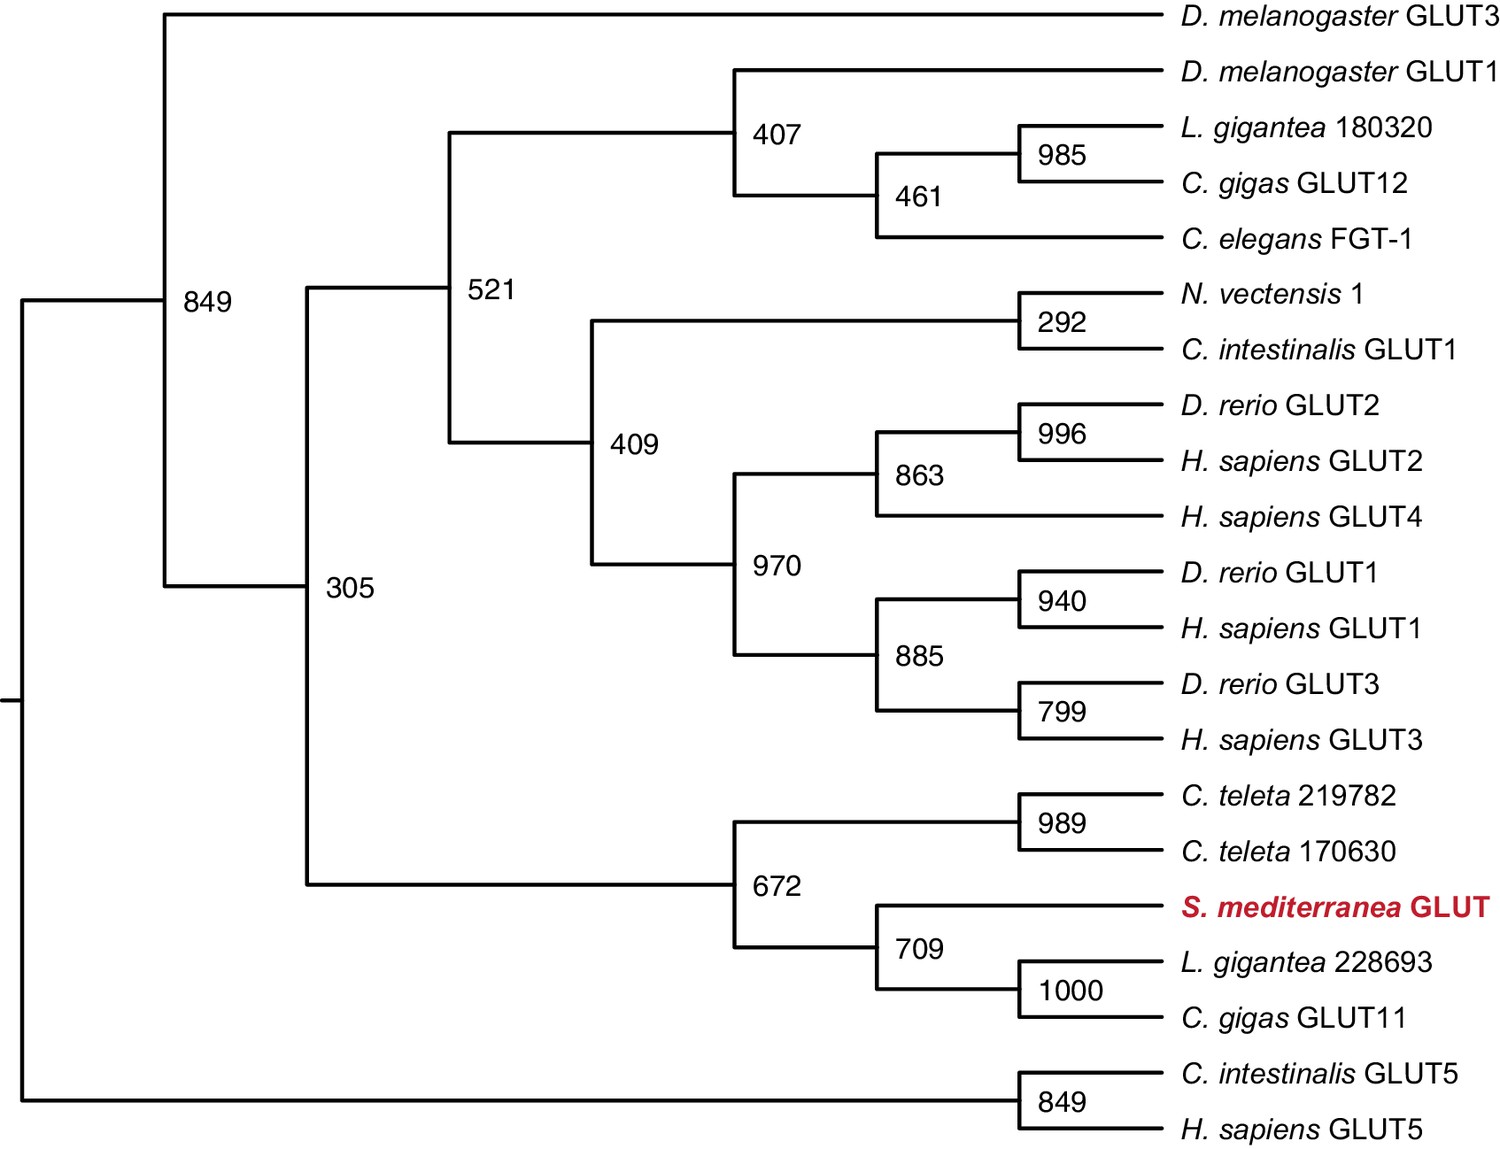
Maximum likelihood cladogram for glucose transporters.
S. mediterranea GLUT clusters with other Lophotrochozoan glucose transporters, which diverged prior to the vertebrate glucose transporter radiation. Fructose transporter GLUT5 was used as an outgroup to root the tree. Bootstrap support values listed at branch junctions. Accession numbers of protein sequences used in the analysis listed in Figure 3—source data 4.
Figure 3—figure supplement 6
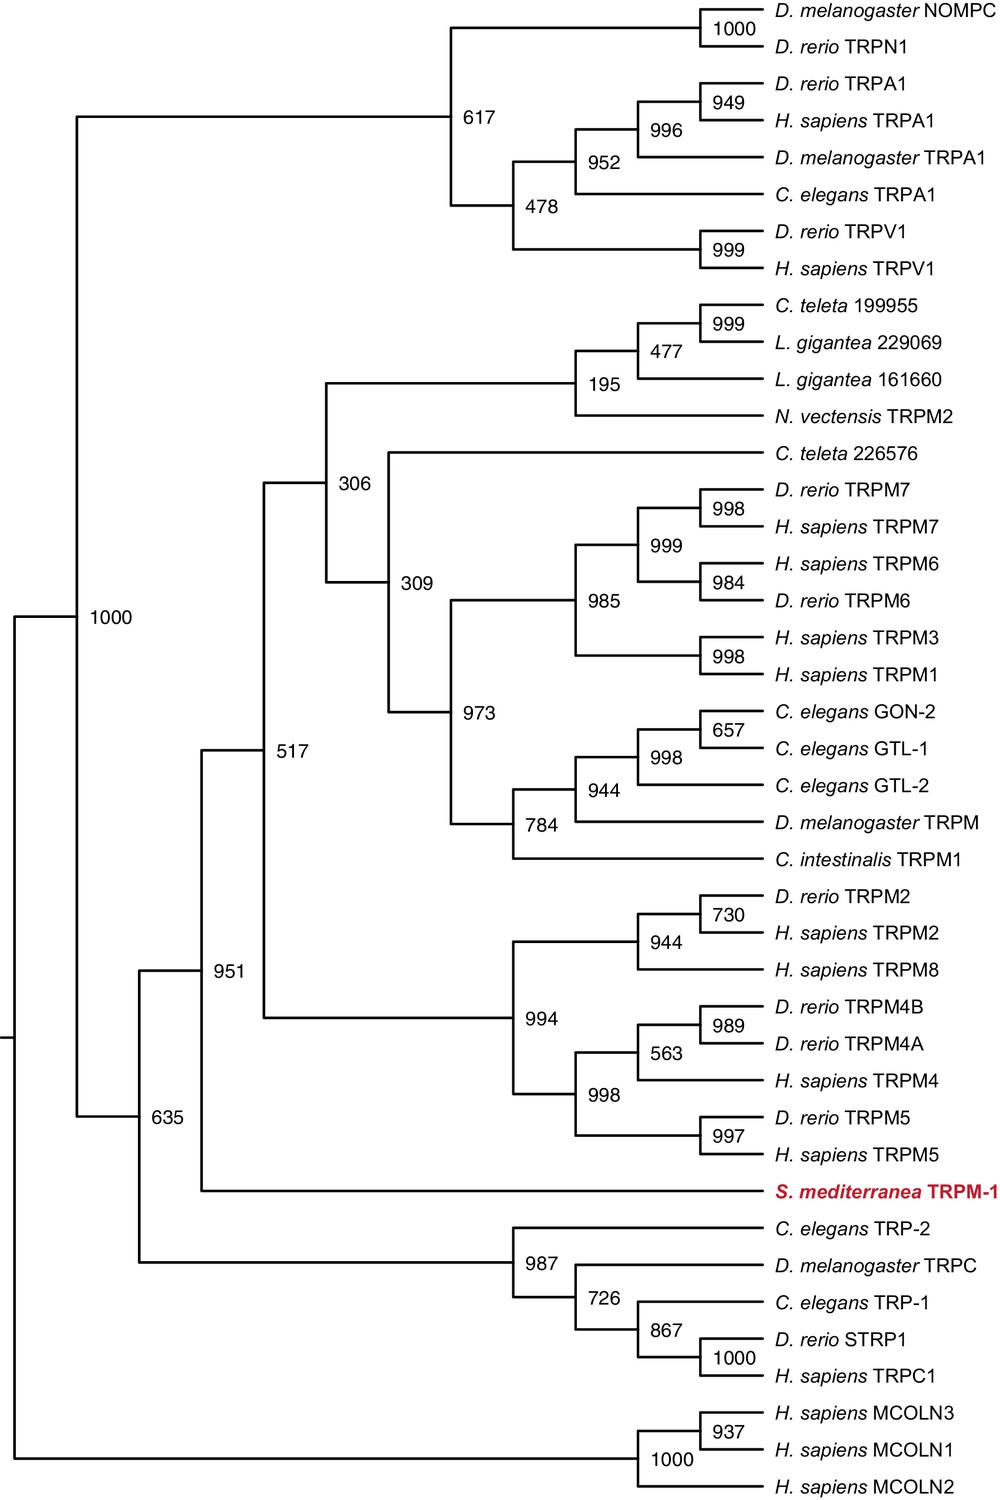
Maximum likelihood cladogram for transient receptor potential channels.
S. mediterranea TRPM falls outside the cluster of other TRPM proteins but apart from the nearest subfamily, TRPC. Maximum likelihood tree of transient receptor potential channels constructed by PhyML with 1000 bootstrap replicates. Mucolipins were used as an outgroup to root the tree. Topology roughly recapitulates previous results (Matsuura et al., 2009). Bootstrap support values listed at branch junctions. Accession numbers of protein sequences used in the analysis listed in Figure 3—source data 5.
Figure 4 with 2 supplements
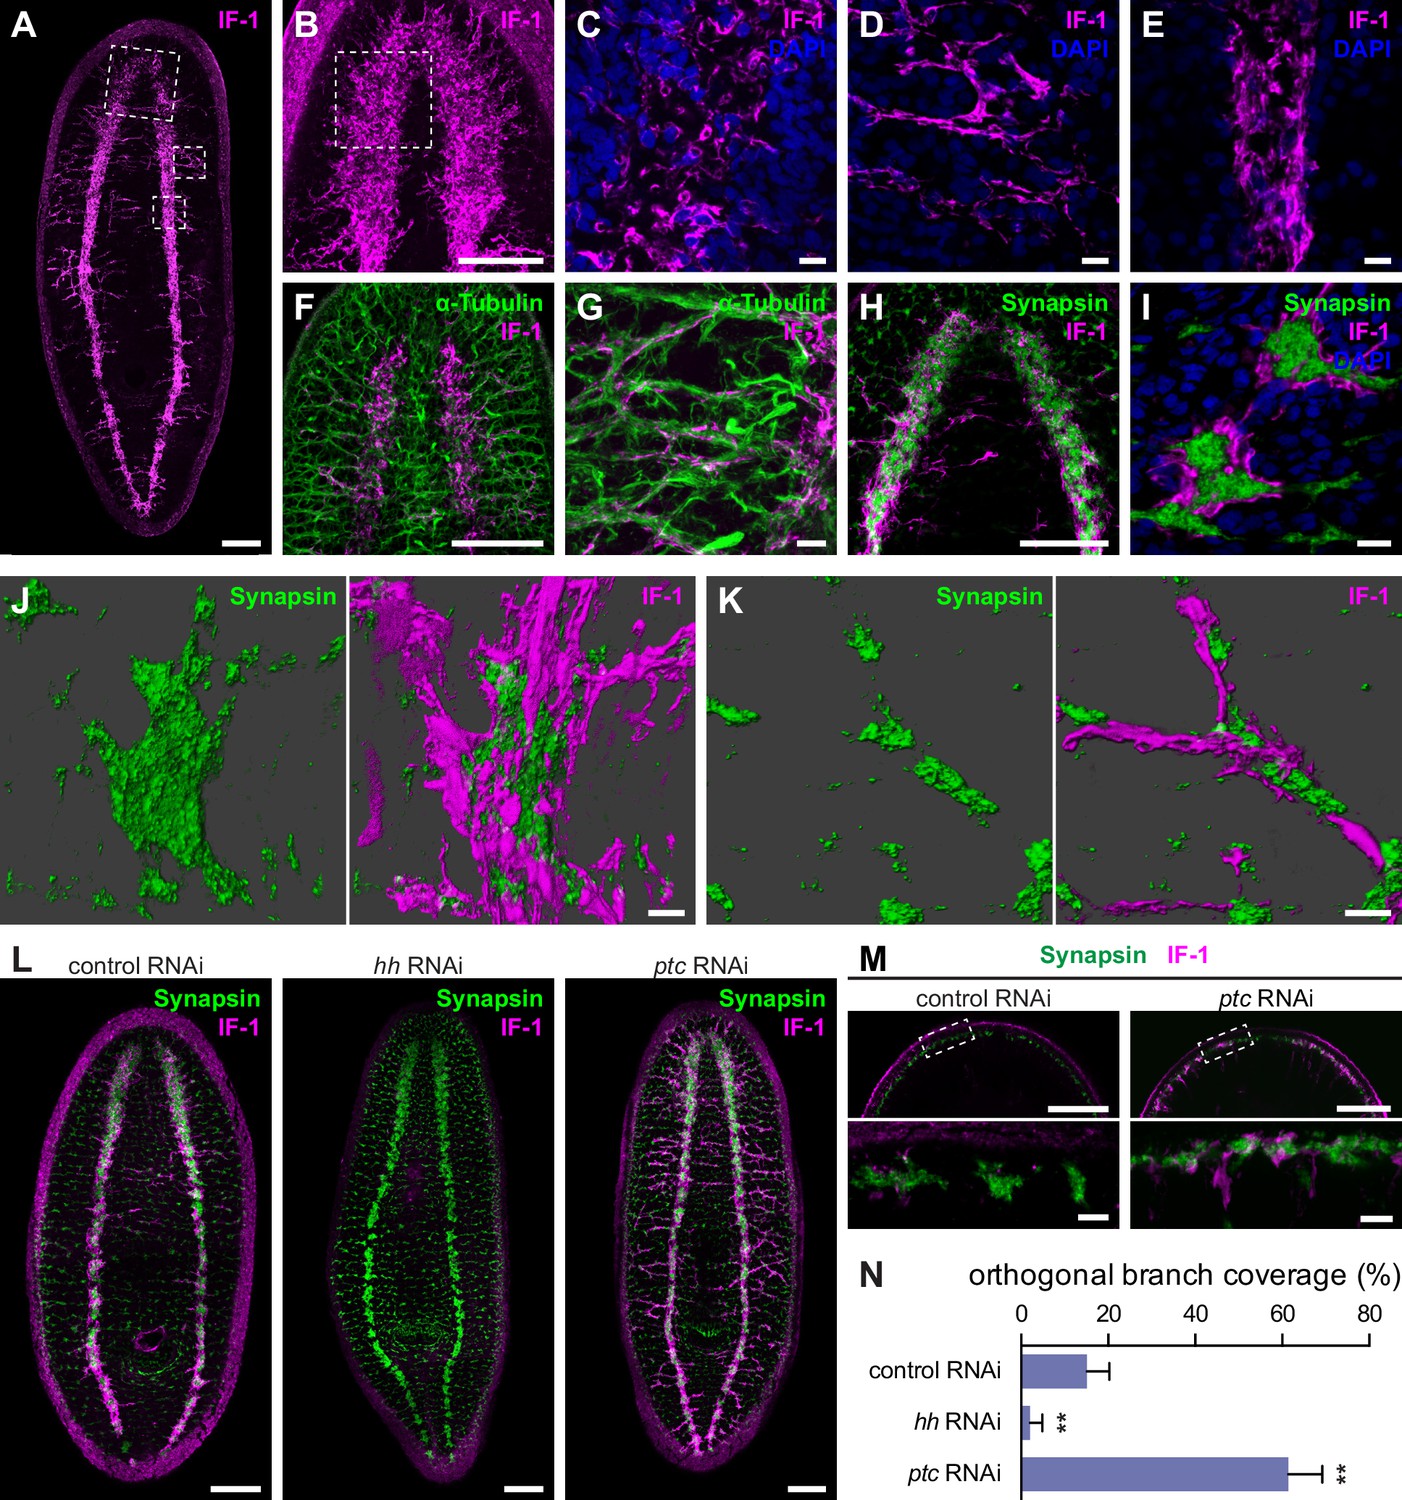
if-1+/cali+ cells have processes that closely associate with neurons.
(A) Whole-mount immunofluorescence for IF-1 protein (magenta) in wild-type untreated animals. (B) Maximum intensity projection of IF-1 localization (magenta) in the cephalic ganglia. Depicted region is indicated by top dotted box in panel A. (C) IF-1 localization (magenta) in the cephalic ganglion neuropil. Depicted region is indicated by dotted box in panel B. (D) IF-1 localization in the lateral ventral parenchyma. Depicted region is indicated by middle dotted box in panel A. (E) IF-1 localization in the ventral nerve cord. Depicted region is indicated by bottom dotted box in panel A. (F–G) Immunofluorescence of IF-1 (magenta) and α-Tubulin (green) in (F) the head and (G) the lateral ventral parenchyma of wild-type untreated animals. (H–I) Immunofluorescence of IF-1 (magenta) and Synapsin (green) in (H) the head and (I) the ventral nerve cord of wild-type untreated animals. (J–K) 3D renderings of confocal stacks of (J) a synaptic glomerulus in the ventral nerve cord or (K) an orthogonal branch labeled with anti-IF-1 (magenta) and anti-Synapsin (green). Image on left is Synapsin only and image on right is Synapsin and IF-1. (L) Immunofluorescence of IF-1 (magenta) and Synapsin (green) following inhibition of hh, ptc, or a control gene. (M) Detail of immunofluorescence of IF-1 (magenta) and Synapsin (green) in the head rim of animals following inhibition of a control gene or ptc. Dotted box in top row refers to the corresponding image in the bottom row. (N) Quantification of hh(RNAi) and ptc(RNAi) phenotypes based on percentage of orthogonal axon bundles in contact with IF-1+ processes. In control(RNAi) animals, 15.1 ± 5.1% of orthogonal axon bundles contained IF-1+ processes (n = 5 animals). In hh(RNAi) animals, 2.1 ± 2.8% of orthogonal axon bundles contained IF-1+ processes (n = 5 animals). In ptc(RNAi) animals, 61.4 ± 7.8% of orthogonal axon bundles contained IF-1+ processes (n = 4 animals). The differences between both hh RNAi and ptc RNAi vs control were statistically significant (**p<0.001, two-tailed t test). Anterior up, ventral side shown for all. Scale bars: 100 um for A, B, F, H, L, top row of M; 10 um for C, D, E, G, I, J, K, bottom row of M.
-
Figure 4—source data 1
Orthogonal branch coverage counts following Hh pathway perturbation.
- https://doi.org/10.7554/eLife.16996.027
Figure 4—figure supplement 1
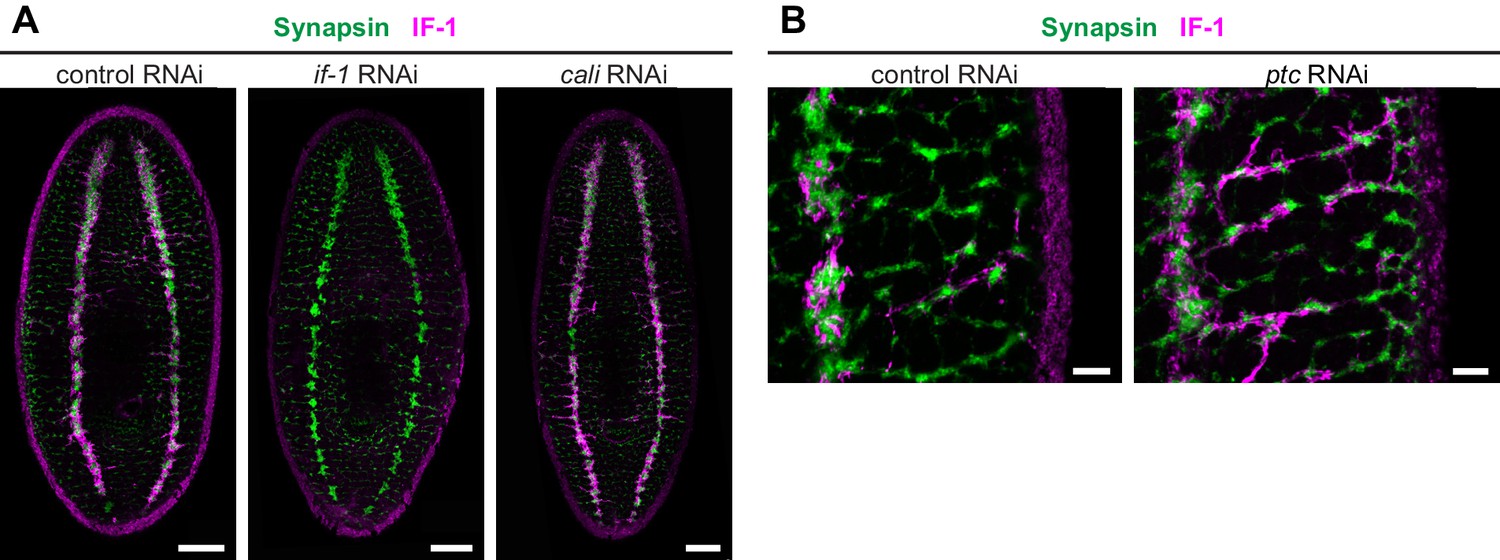
IF-1 protein accumulates in ptc(RNAi) animals.
(A) Immunofluorescence of IF-1 (magenta) and Synapsin (green) in animals following inhibition of a control gene, if-1, or cali. (B) Detail of immunofluorescence of IF-1 (magenta) and Synapsin (green) in lateral ventral parenchyma of the trunk following inhibition of a control gene or ptc. Anterior up, ventral side shown for all. Scale bars: 100 um for A; 20 um for B.
Figure 4—figure supplement 2
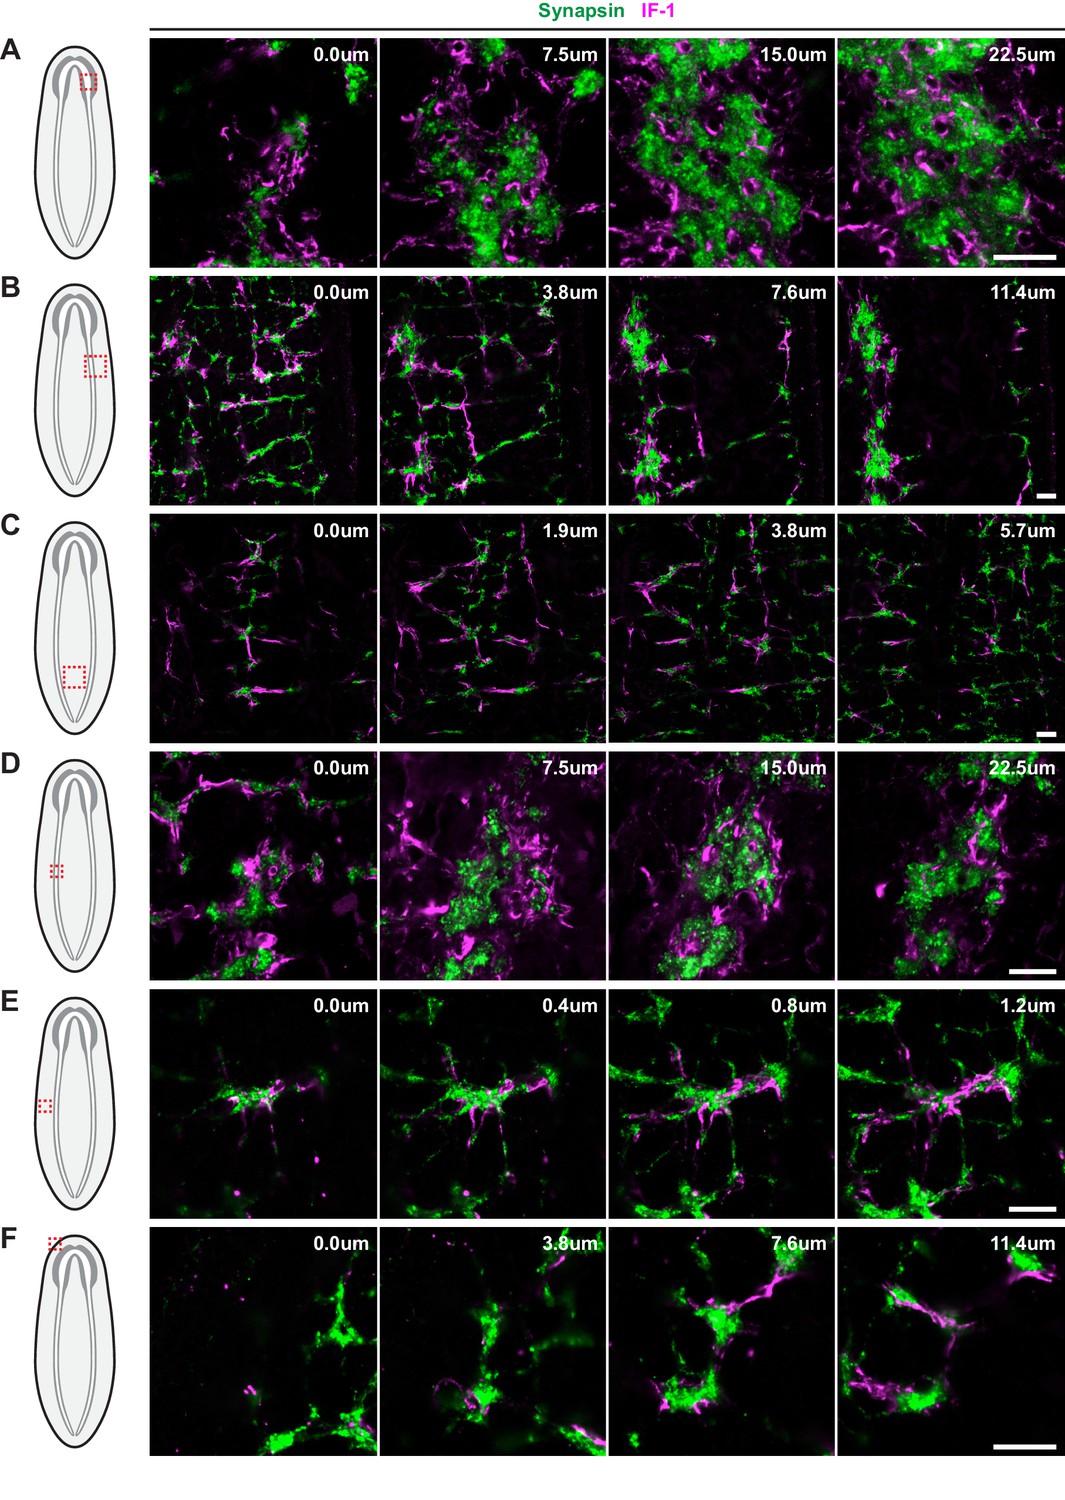
IF-1 protein-containing processes associated with Synapsin+ clusters.
Overview of the (A) CNS, (B) VNC and flank, and (C) region between the VNCs, and detail of a (D) synaptic glomeruli, (E) Orthogon branch, and (F) head rim from an animal stained for IF-1 (magenta) and Synapsin (green). Schematics in left-most column indicate the region of the animal displayed in images. Each row represents four planes of a single confocal stack. Relative depth is indicated in the top right corner of each frame. Anterior up, ventral side shown for all. Scale bars: 20 um for all.
Figure 5 with 2 supplements
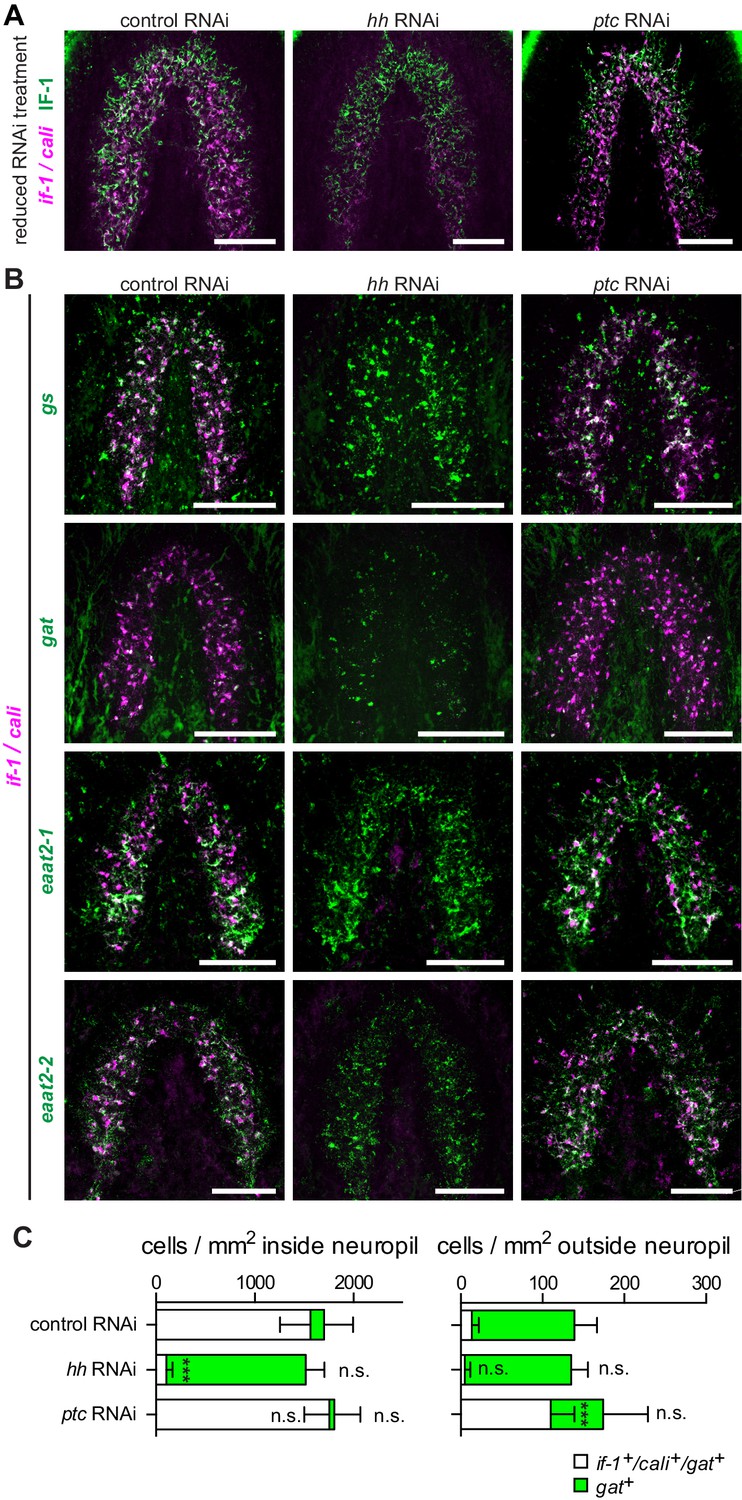
hh inhibition does not ablate planarian glia.
(A) FISH of if-1/cali (magenta) and immunofluorescence of IF-1 (green) in animals following reduced RNAi treatment (fed d0, d4, d8, fixed d12) of a control gene, hh, or ptc. (B) Double FISH for if-1/cali (magenta) with gs (first row), gat (second row), eaat2-1 (third row), or eaat2-2 (fourth row) (green) following inhibition of a control gene (first column), hh (second column), or ptc (third column). (C) Stacked bar graph of the number of cells per square millimeter of cephalic ganglia inside the neuropil (left) and number of cells per square millimeter of the head outside the neuropil (right) expressing gat following inhibition of a control gene, hh, or ptc. Bar sections denote the ratio of if-1+/cali+subpopulation (white) to if-1-/cali-subpopulation (green). Statistical significance indicated by labels (n.s., not significant, ***p≤ 0.0001, two-tailed t test). Anterior up, ventral side shown for A–B. Scale bars: 100 um for A–B.
-
Figure 5—source data 1
Cell counts for co-expression of if-1/cali and gat following Hh pathway perturbation.
- https://doi.org/10.7554/eLife.16996.039
Figure 5—figure supplement 1
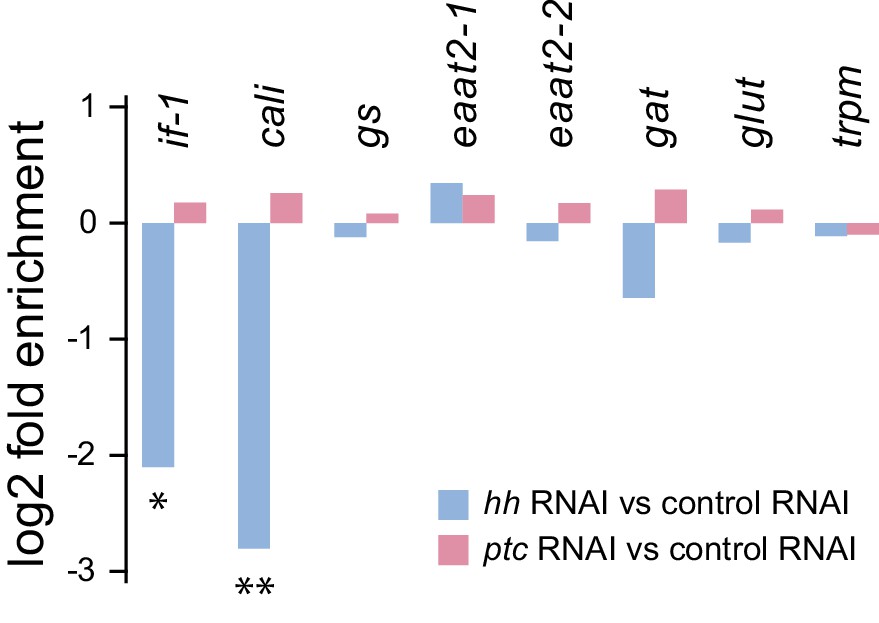
Glial marker expression levels in RNA-seq datasets.
Comparison of gene expression levels from cephalic ganglia tissue samples following inhibition of hh or ptc. Differential expression magnitudes are statistically significant for if-1 and cali only (*padj≤0.05, **padj≤0.01).
Figure 5—figure supplement 2
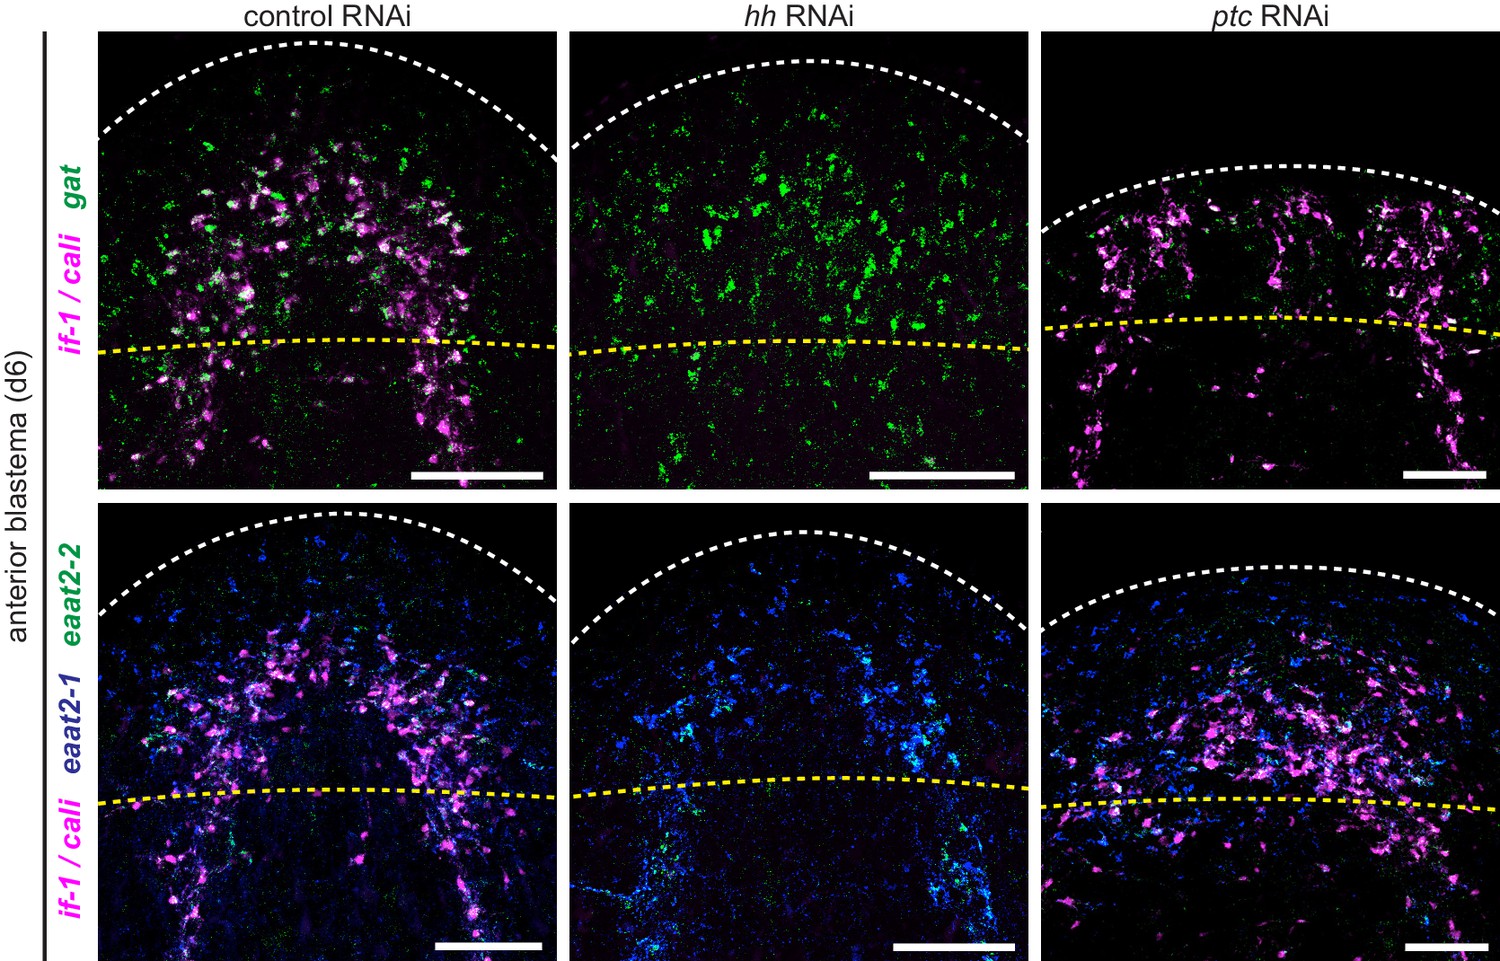
Expression of glial markers in anterior blastemas.
Double FISH for if-1 and cali (magenta) and gat (green) or triple FISH for if-1 and cali (magenta), eaat2-1 (blue), and eaat2-2 (green) in d6 anterior blastemas of trunks following inhibition of a control gene (left column), hh (middle column), or ptc (right column). White dotted line delineates edge of animal. Yellow dotted line delineates approximate amputation plane. Anterior up, ventral side shown. Scale bars: 100 um.
Figure 6 with 1 supplement

Hh signaling is required for if-1 and cali expression in planarian glia.
(A) FISH of if-1/cali (magenta) and glut (green) in animals following lethal irradiation and subsequent RNAi treatment (irradiated d0, fed d0, d4, d8, fixed d11). Yellow boxed area indicates region detailed in B. (B) Detail of if-1+/cali+/glut+ cells in the head region lateral to cephalic ganglia in ptc(RNAi) animal. (C) Quantification of if-1+/cali+ cells in irradiated control(RNAi), hh(RNAi), and ptc(RNAi) animals from (A). Control(RNAi) animals had 1730.29 ± 274.57 cells/mm2 inside and 63.51 ± 33.93 cells/mm2 outside the neuropil (n = 8 animals). hh(RNAi) animals had 758.51 ± 160.33 cells/mm2 inside and 15.02 ± 9.10 cells/mm2 outside the neuropil (n = 8 animals). ptc(RNAi) animals had 1888.48 ± 206.34 cells/mm2 inside and 293.20 ± 46.69 cells/mm2 outside the neuropil (n = 9 animals). Differences between control(RNAi) and hh(RNAi) animals (*p<0.05, two-tailed t test), and between control(RNAi) and ptc(RNAi) animals (***p<0.0001, two-tailed t test) are significant. (D) Stacked bar graph of the number of cells per square millimeter of cephalic ganglia inside the neuropil (left) and number of cells per square millimeter of head outside the neuropil (right) expressing glut following inhibition of a control gene, hh, or ptc. Bar sections denote ratio of if-1+/cali+subpopulation (white) to if-1-/cali-subpopulation (green). Statistical significance indicated by labels (n.s., not significant, *p≤0.05, ***p≤0.0001, two-tailed t test). Anterior up, ventral side shown for all. Scale bars: 100 um for A, 20 um for B.
-
Figure 6—source data 1
Cell counts for co-expression of if-1/cali and glut following lethal irradiation and Hh pathway perturbation
- https://doi.org/10.7554/eLife.16996.043
Figure 6—figure supplement 1
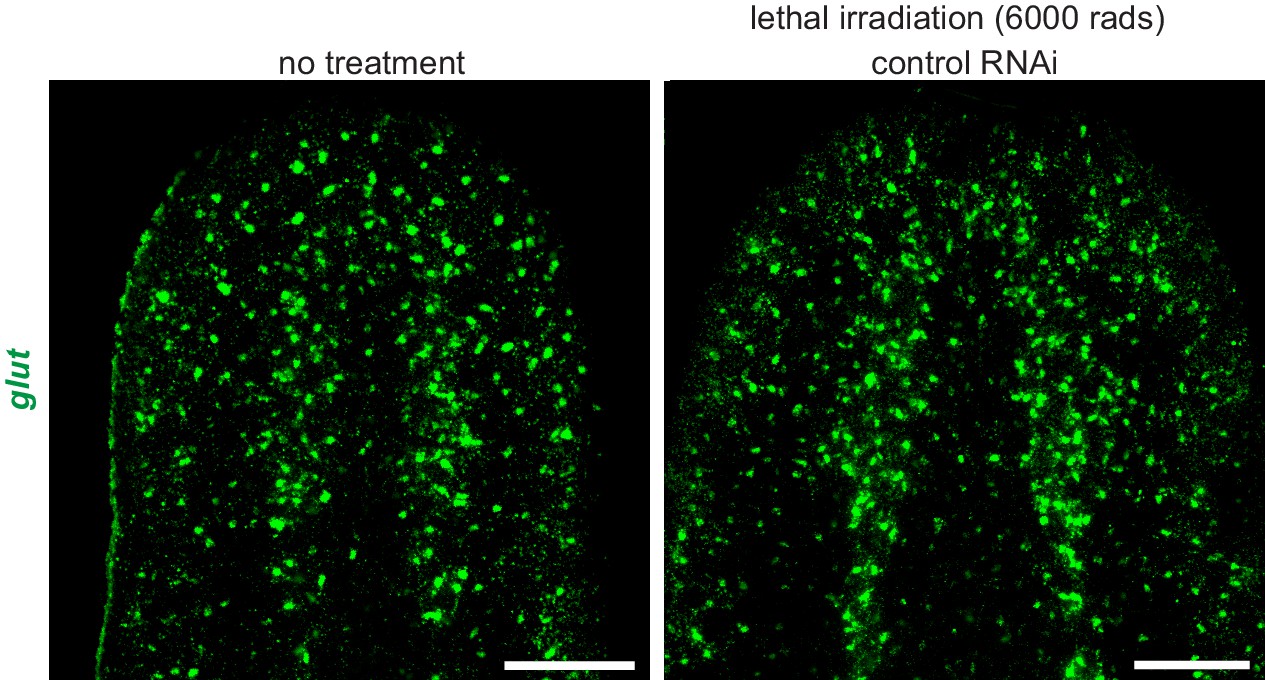
Expression of glut is not affected by lethal irradiation.
FISH for glut (green) in untreated animals (left) and in control(RNAi) animals following lethal irradiation (right). Images are maximum intensity projections of confocal stacks. Anterior up. Scale bars: 100 um.
Figure 7
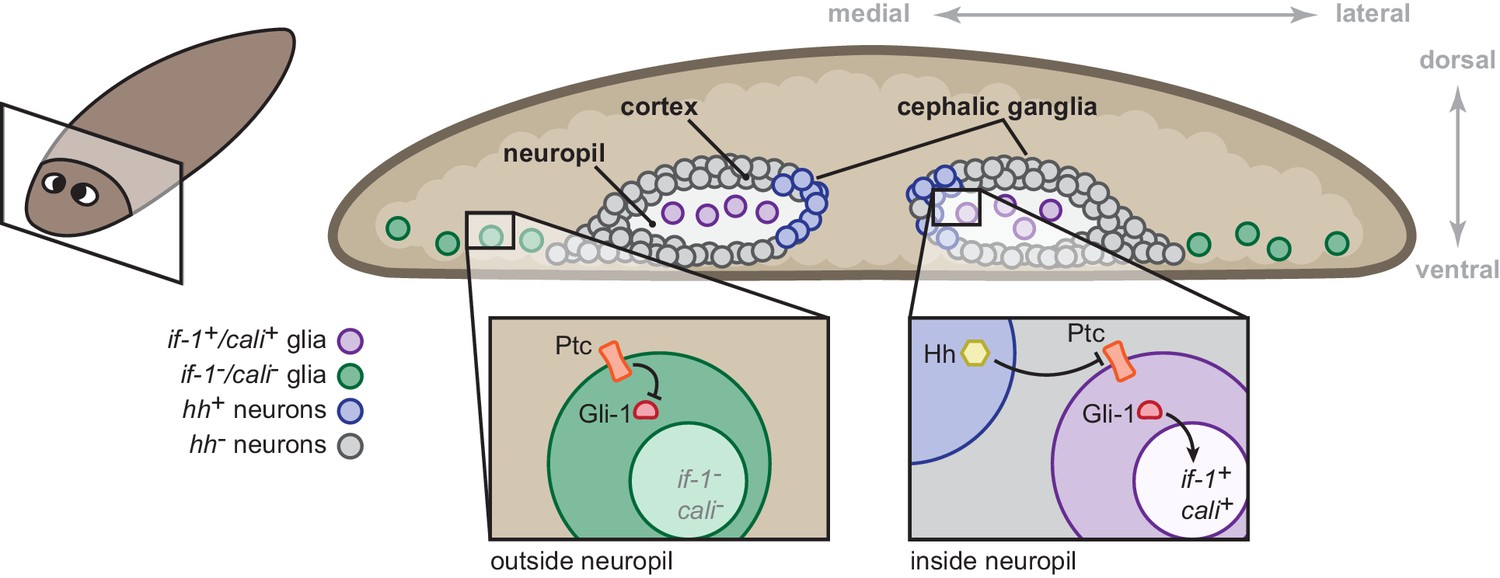
Model for the role of the Hh signaling pathway in regulation of planarian glia.
Planarian glia are distributed throughout the nervous system and concentrated in the neuropil. if-1 and cali expression is normally repressed in these cells by high Ptc activity. A subset of these cells, however, is adjacent to Hh-secreting neurons in the medial cortex and express if-1 and cali because of inhibition of Ptc by Hh. Upon global inhibition of hh by RNAi, Ptc remains high in all cells and if-1 and cali are repressed in glia. Upon global inhibition of ptc by RNAi, expression of if-1 and cali is derepressed in glia.
Videos
Video 1
Confocal stack of single synaptic glomerulus.
Immunofluorescence for IF-1 (magenta) and Synapsin (green) followed by protein-retention expansion microscopy. Anterior up, ventral side shown. Scale bar: 50 um.
Video 2
3D rendering from confocal stack of single synaptic glomerulus.
Immunofluorescence for IF-1 (magenta) and Synapsin (green) followed by protein-retention expansion microscopy. 3D rendering based on confocal stack from Video 1. Anterior up, ventral side shown. Scale bar: 50 um.
Video 3
Confocal stack of multiple synaptic glomeruli.
Immunofluorescence for IF-1 (magenta) and Synapsin (green) followed by protein-retention expansion microscopy. Anterior up, ventral side shown. Scale bar: 50 um.
Video 4
3D rendering from confocal stack of multiple synaptic glomeruli.
Immunofluorescence for IF-1 (magenta) and Synapsin (green) followed by protein-retention expansion microscopy. 3D rendering based on confocal stack from Video 3. Anterior up, ventral side shown. Scale bar: 50 um.
Video 5
Confocal stack of lateral orthogonal branch.
Immunofluorescence for IF-1 (magenta) and Synapsin (green) followed by protein-retention expansion microscopy. Anterior up, ventral side shown. Scale bar: 50 um.
Video 6
3D rendering from confocal stack of lateral orthogonal branch.
Immunofluorescence for IF-1 (magenta) and Synapsin (green) followed by protein-retention expansion microscopy. 3D rendering based on confocal stack from Video 5. Anterior up, ventral side shown. Scale bar: 30 um.
Video 7
Confocal stack of medial orthogonal branch.
Immunofluorescence for IF-1 (magenta) and Synapsin (green) followed by protein-retention expansion microscopy. Anterior up, ventral side shown. Scale bar: 50 um.
Video 8
3D rendering from confocal stack of medial orthogonal branch.
Immunofluorescence for IF-1 (magenta) and Synapsin (green) followed by protein-retention expansion microscopy. 3D rendering based on confocal stack from Video 7. Anterior up, ventral side shown. Scale bar: 50 um.
Download links
A two-part list of links to download the article, or parts of the article, in various formats.
Downloads (link to download the article as PDF)
Open citations (links to open the citations from this article in various online reference manager services)
Cite this article (links to download the citations from this article in formats compatible with various reference manager tools)
Hedgehog signaling regulates gene expression in planarian glia
eLife 5:e16996.
https://doi.org/10.7554/eLife.16996


