The C9ORF72 GGGGCC expansion forms RNA G-quadruplex inclusions and sequesters hnRNP H to disrupt splicing in ALS brains
- Columbia University, United States
- Columbia University Medical Center, United States
Figures
Figure 1 with 1 supplement
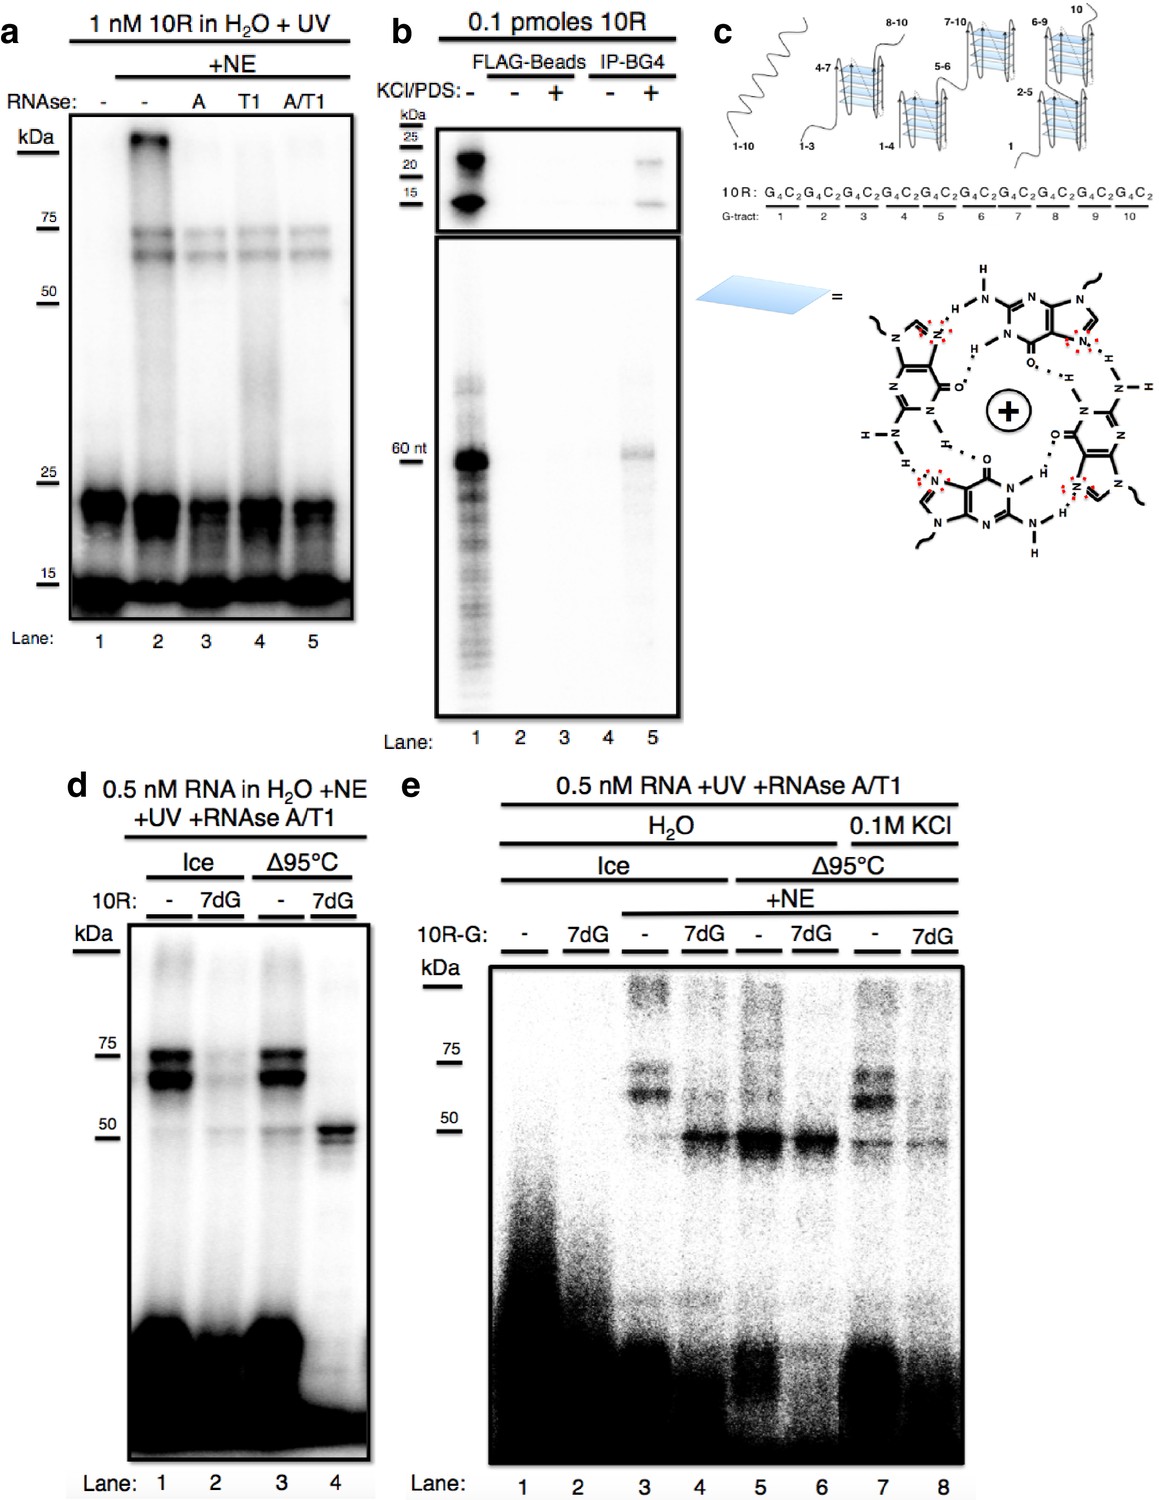
The GGGGCC expansion forms stable multimeric G-quadruplexes (G-Qs).
(a) 10R UV crosslinked to U87 nuclear extract (NE) and digested with RNAse A (0.5 ug) (lane 3), RNAse T1 (10U) (lane 4), both (0.5ug RNAse A/10U RNAse T1) (lane 5), or nothing (lane 2), and separated by 10% SDS-PAGE. (b) 0.1 pmoles of 10R in water (lanes 1, 2 and 4) or 200 mM KCl and 500 μM pyridostatin (PDS) (lanes 3 and 5), IPed with BG4 antibody (lanes 4 and 5) or beads alone (lanes 2 and 3). Products were separated by 10% SDS-PAGE (top) and by 8M Urea/10% PAGE (bottom). (c) Representative G-Q folding conformations of 10 repeats of GGGGCC RNA. Numbers indicate G-tracts that participate in GQs or linear fragments. The right most conformation represents 8 consecutive G-tracts forming an octamer. Beneath, a depiction of one quartet, with the N7 (replaced with C in 7-deaza GTP) position surrounded by red dashed oval (d) 10R (lanes 1 and 3) and 10R-7dG (lanes 2 and 4) heated to 95°C (lanes 3 and 4) or left on ice (lanes 1 and 2), crosslinked to NE, digested with RNAse A/T1 (.5 ug/10U) and separated by 10% SDS-PAGE. (e) 10R-G (lanes 1, 3, 5 and 7) and 10R-G7dG (lanes 2, 4, 6 and 8) heated to 95°C in water (lanes 5 and 6) or 100 mM KCl (lanes 7 and 8) or left on ice (lanes 3 and 4), crosslinked to NE, digested with RNAse A/T1 (0.5 μg/10 U) and separated by 10% SDS-PAGE. This gel was cropped to remove two intervening lanes between lanes 6 and 7.
Figure 1—figure supplement 1
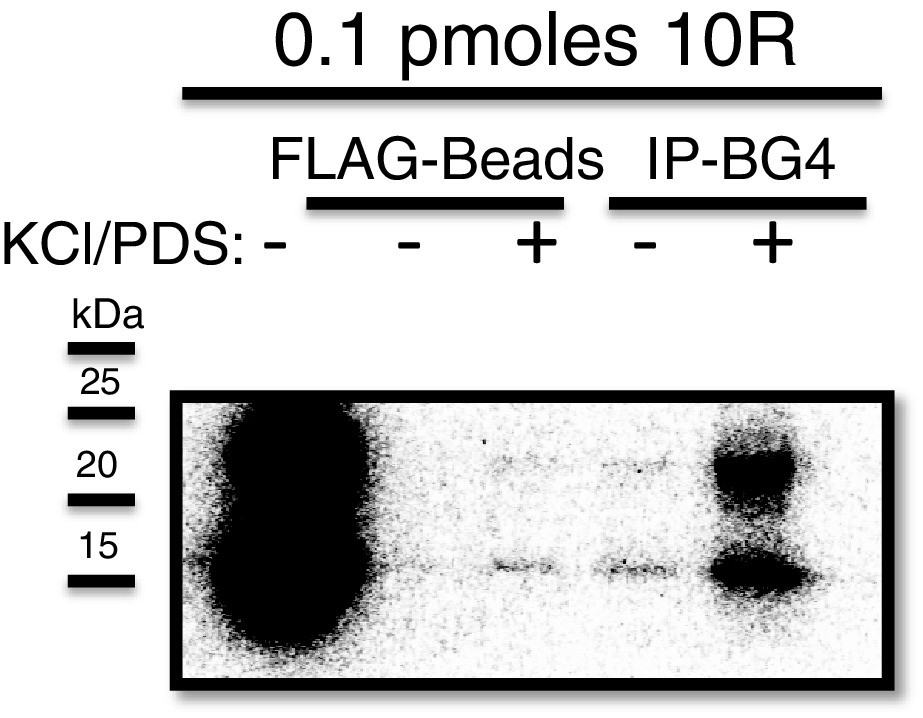
Immunoprecipitation of 10R with BG4.
Dark exposure of Figure 1b (top) depicting recovery of 10R in water (lane 4) using the BG4 antibody.
Figure 2 with 1 supplement
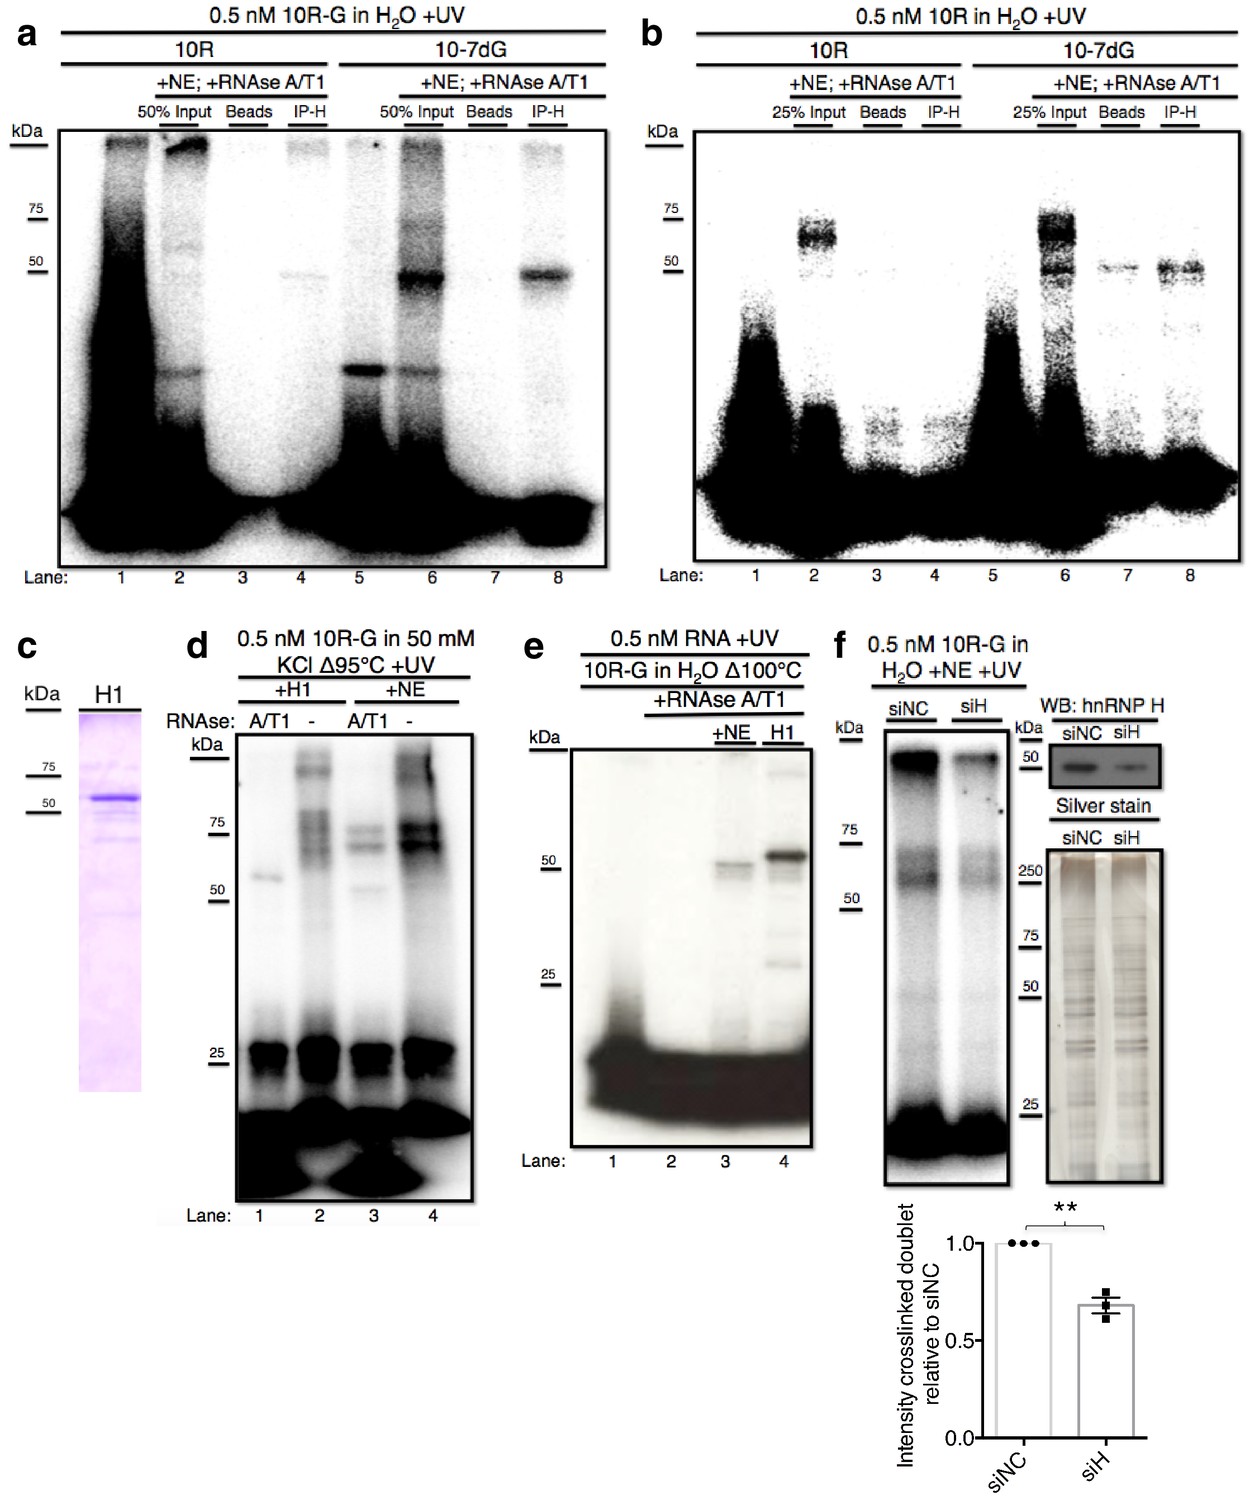
hnRNP H associates with ten G4C2 repeat RNA in vitro.
(a) IP of 10R-G (lane 5) and 10R-7dG (lane 10) crosslinked to U87 nuclear extract (NE), digested with RNAse A/T1 (0.5 ug/10U) and separated by 10% SDS-PAGE. (b) IP of 10R (lane 4) and 10R-G7dG (lane 8) crosslinked to U87 NE, digested with RNAse A/T1 (.5 ug/10U) and separated by 10% SDS-PAGE. (c) 6X-HIS tagged hnRNP H1 (H1) produced in E. coli. (d) 10R-G heated to 95°C in 50 mM KCl and crosslinked to purified H1 (lanes 1 and 2) or NE (lanes 3 and 4) and digested with RNAse A/T1 (.5 ug/10U) (lanes 1 and 3) or nothing (lanes 2 and 4), and separated by 10% SDS-PAGE. (e) 10R-G heated to 100°C in H2O and crosslinked to NE (lane 3) or purified H1 (4) and digested with RNAse A/T1 (0.5 ug/10U) (lanes 3 and 4). (f) (Left panel)10R-G crosslinked to NE prepared from U87 cells treated with negative control siRNA (siNC) or siRNA against hnRNP H (siH), digested with RNAse A/T1 (0.5 μg/10 U) and separated by 10% SDS-PAGE. (Right panel, upper) Western blot of hnRNP H in siNC and siH nuclear extracts. (Right panel, lower) Silver stain of siNC and siH nuclear extracts. (Lower panel) Quantification of crosslinked doublet from three experiments with siNC and siH nuclear extracts.
Figure 2—figure supplement 1
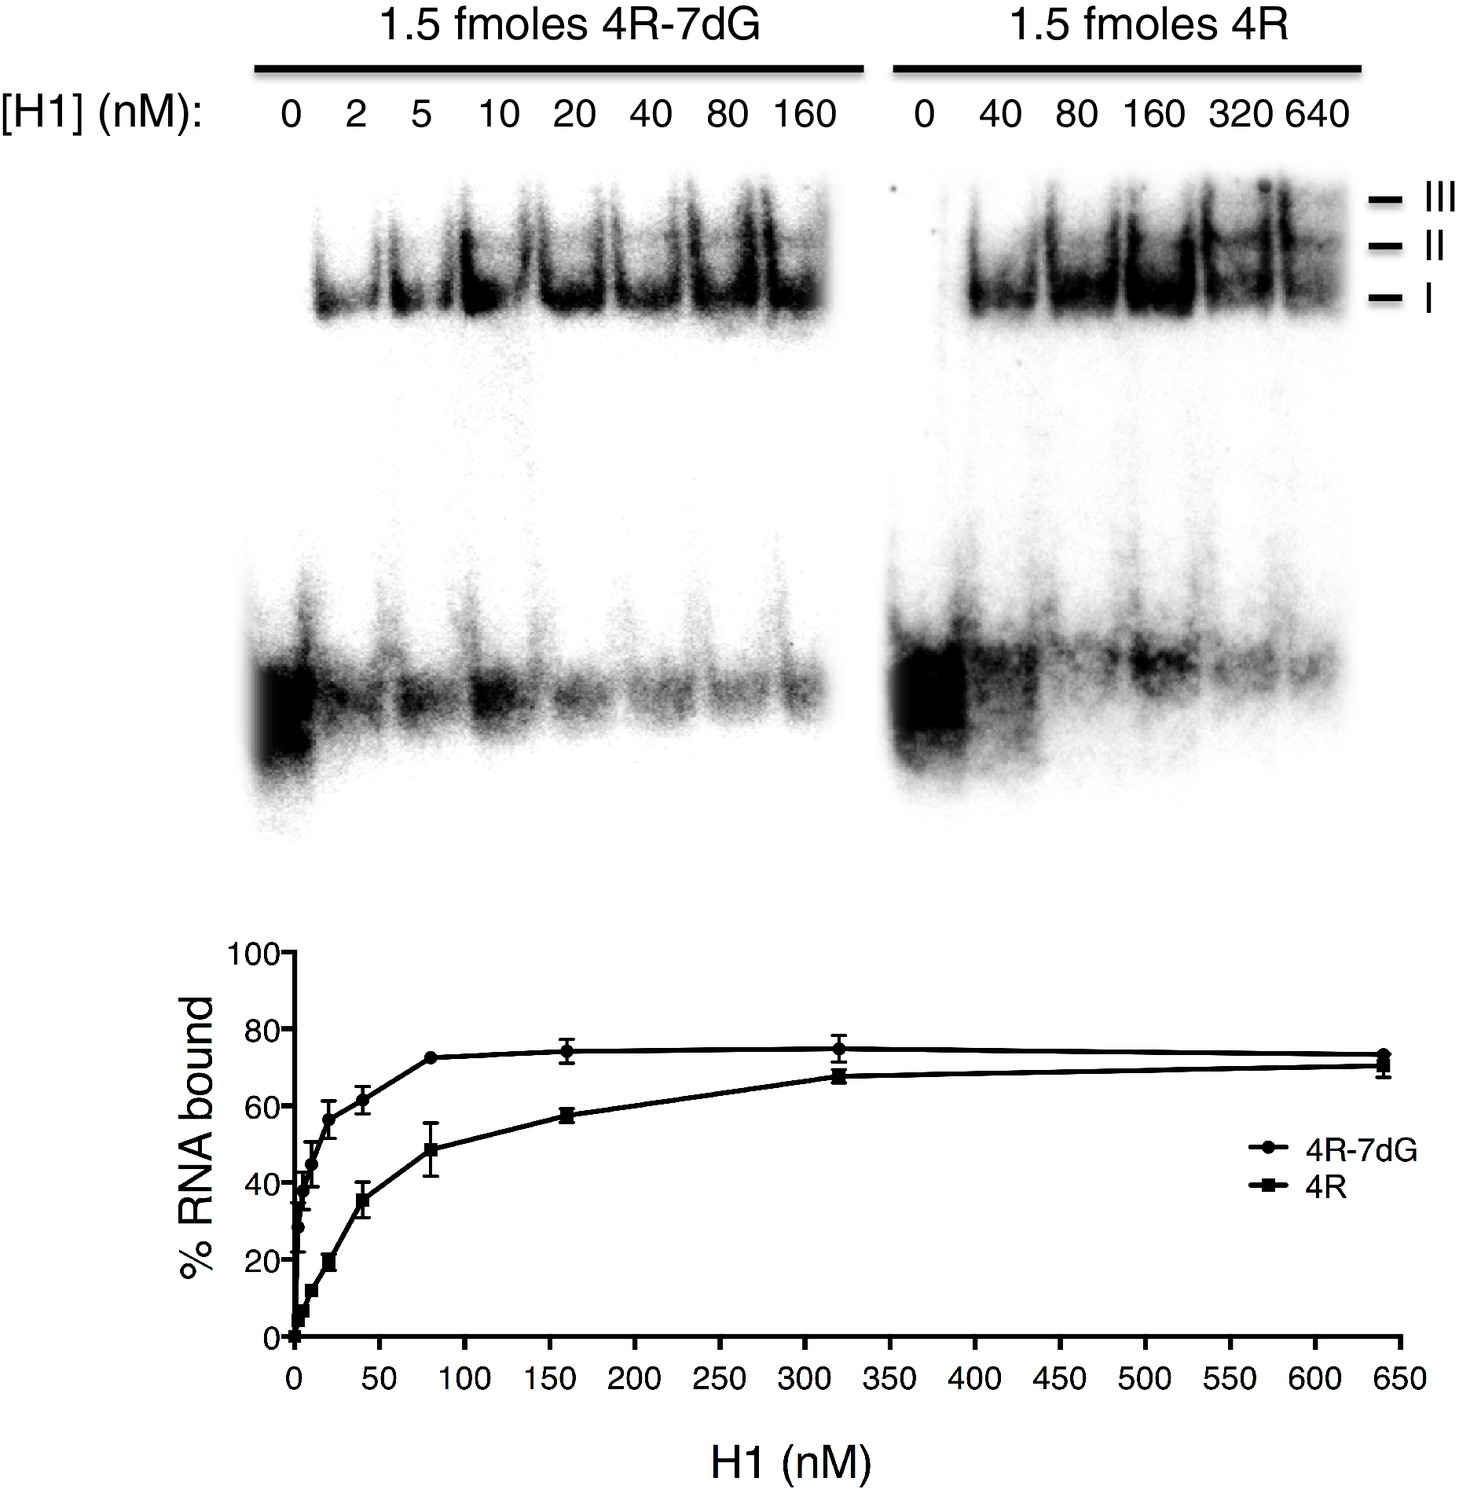
Gel shift assays with 4R and 4R-7dG.
(Top, left) Native gel with 1.5 fmoles 4R-7dG incubated with H1 diluted to a range of concentrations from 0 to 160 nM. (Top, right) Native gel with 1.5 fmoles 4R incubated with H1 diluted to a range of concentrations from 0 to 640 nM. Multimeric complexes are indicated with roman numerals II and III. (Bottom) Binding curve for 4R and 4R-7dG based upon three independent repeats. Error bars are plotted to the SEM.
Figure 3 with 2 supplements
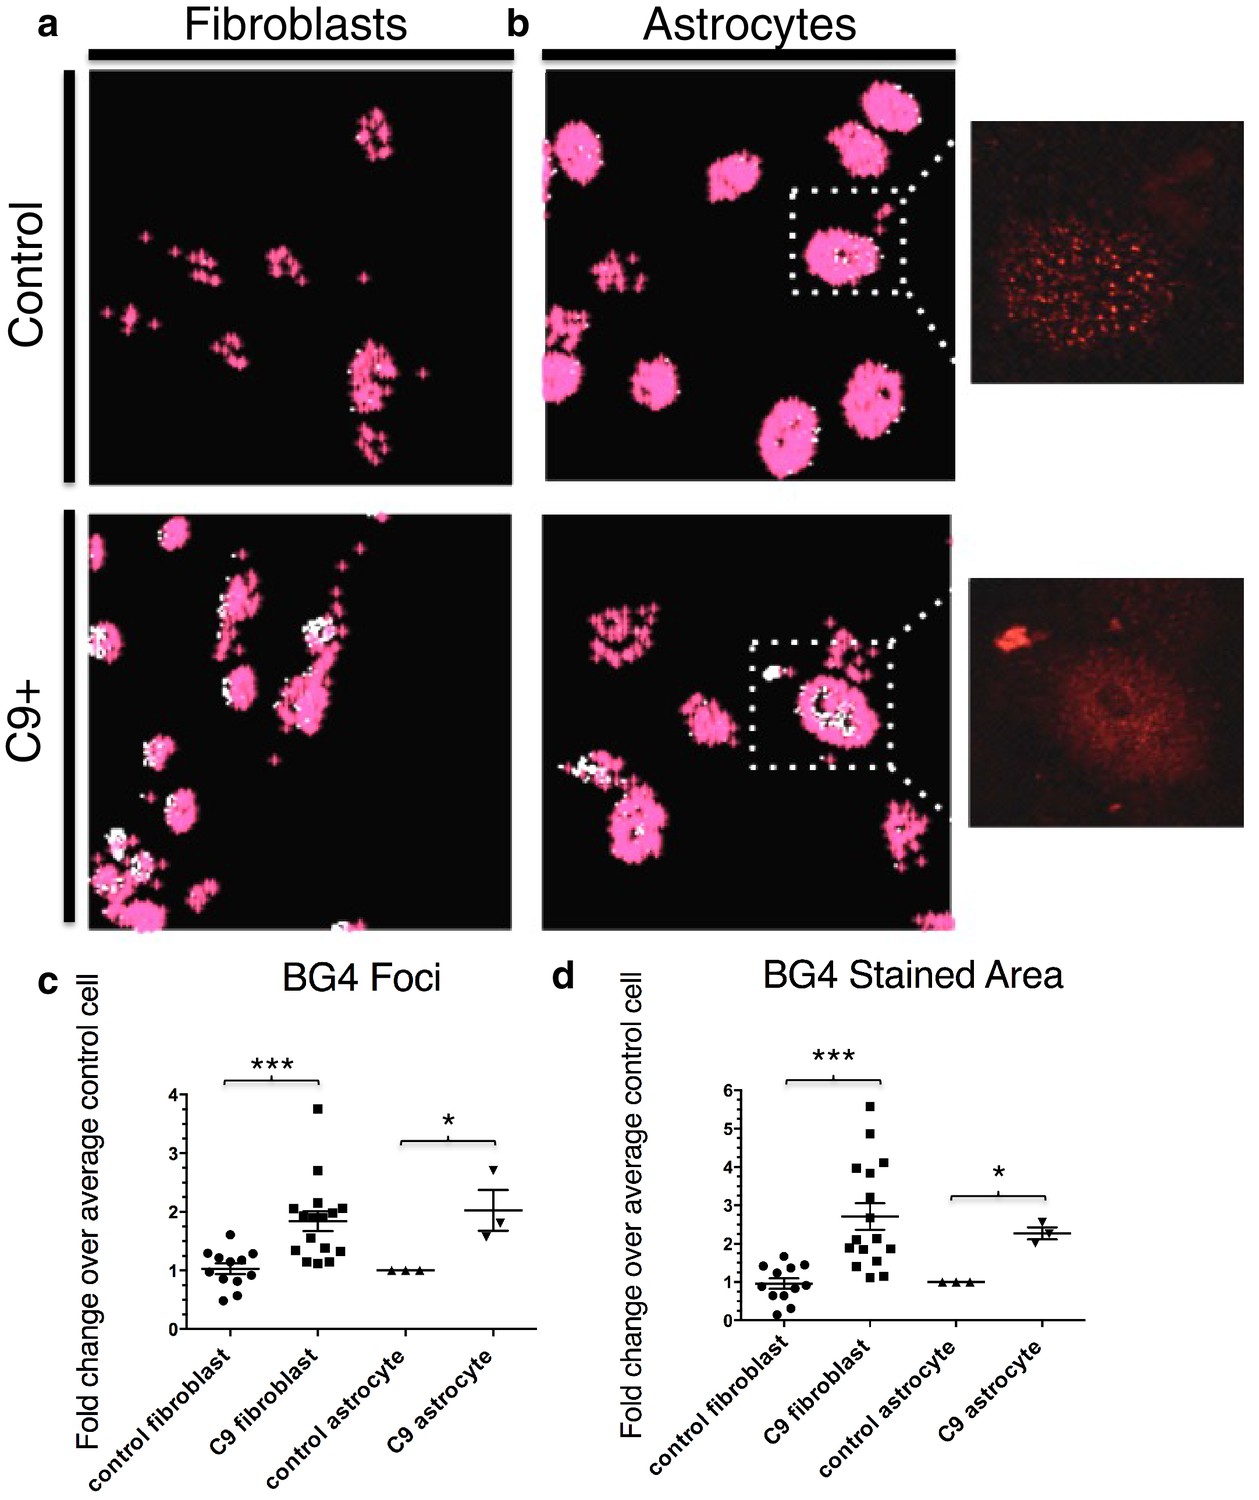
Quantification of BG4 stained foci and area in fibroblasts and astrocytes from C9 ALS/FTD patients and controls.
Representative nonALS and C9ALS fibroblasts (a) and astrocytes (b) showing the projection created by 'BG4 Count' that represents all stained area above the determined threshold (0.1) in red, with areas of particularly dense staining in white. Inset depicts source image showing only the red (BG4-FLAG) channel. (c) Number of foci and total stained area (d) as fold change over the average number of foci, or area, respectively, per control cell for C9 fibroblasts (n replicates = 16), control fibroblasts (n replicates = 12), C9 astrocytes (n replicates = 3), and control astrocytes (n replicates = 3) (*p<0.05, **p<0.01, ***p<0.001). Error bars are plotted to SEM.
Figure 3—figure supplement 1
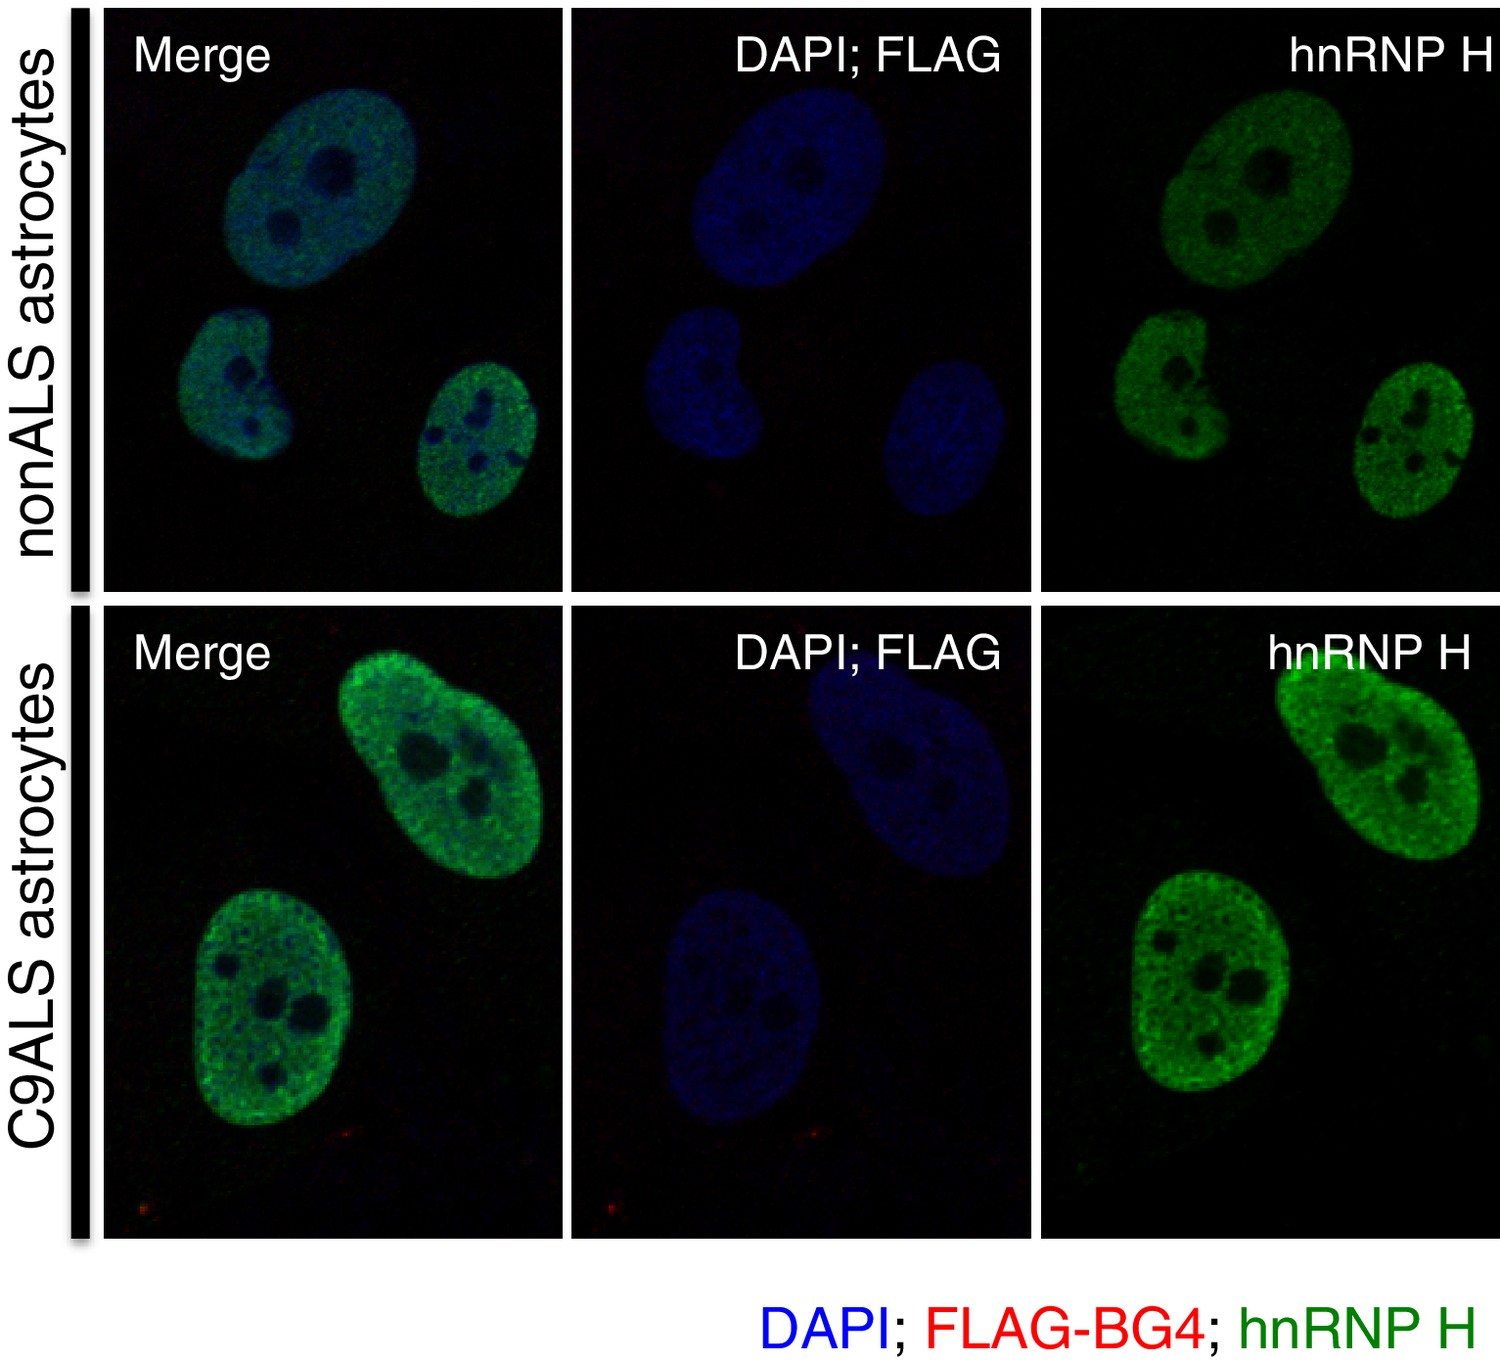
Immunofluorescence with FLAG antibody without prior BG4 incubation.
nonALS and C9ALS astrocytes lacking BG4 antibody incubation. DAP1 = blue; hnRNP H = green; FLAG-BG4 = red.
Figure 3—figure supplement 2
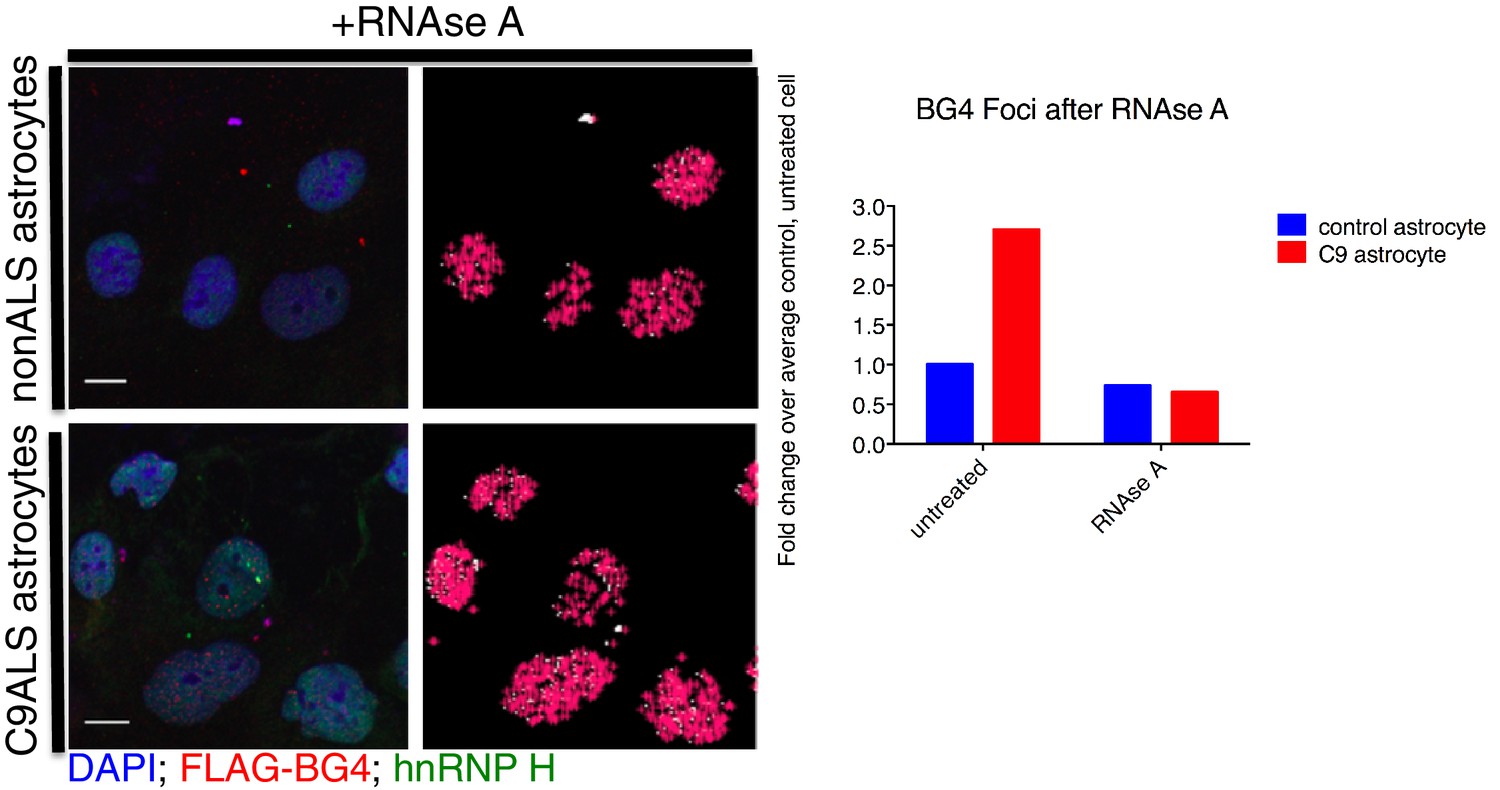
BG4 quantification of RNAse A treated astrocytes.
(Left) Immunofluorescence and BG4 count depiction of nonALS control and C9ALS astrocytes. (Right) Quantification of BG4 foci with and without RNAse A treatment, normalized to the average control, untreated cell. DAP1 = blue; hnRNP H = green; FLAG-BG4 = red. Scale bar = 10 microns.
Figure 4 with 2 supplements

Visualization of nuclear and cytoplasmic BG4/hnRNP H colocalization in C9 patient cells and controls.
C9 patient astrocytes with nuclear hnRNP H/BG4 foci (a, c) nuclear redistribution of hnRNP H towards high BG4 staining (b) and large cytoplasmic foci (d). (e) Percentage of control and C9 patient astrocytes containing nuclear and cytoplasmic hnRNP H colocalization events. (f) The single, small nuclear hnRNP H/BG4 nuclear foci in control astrocyte. (g) Nuclear hnRNP H/BG4 inclusion in C9 patient fibroblasts. (h) C9 patient fibroblasts with cytoplasmic hnRNP H/BG4 foci in DAPI-positive cytoplasm. (i) Summary of all fibroblasts counted and the number of colocalization event. All objects are indicated with arrow or dashed box (c), and all scale bars = 3 microns with the exception of (h), 10 microns.
Figure 4—figure supplement 1
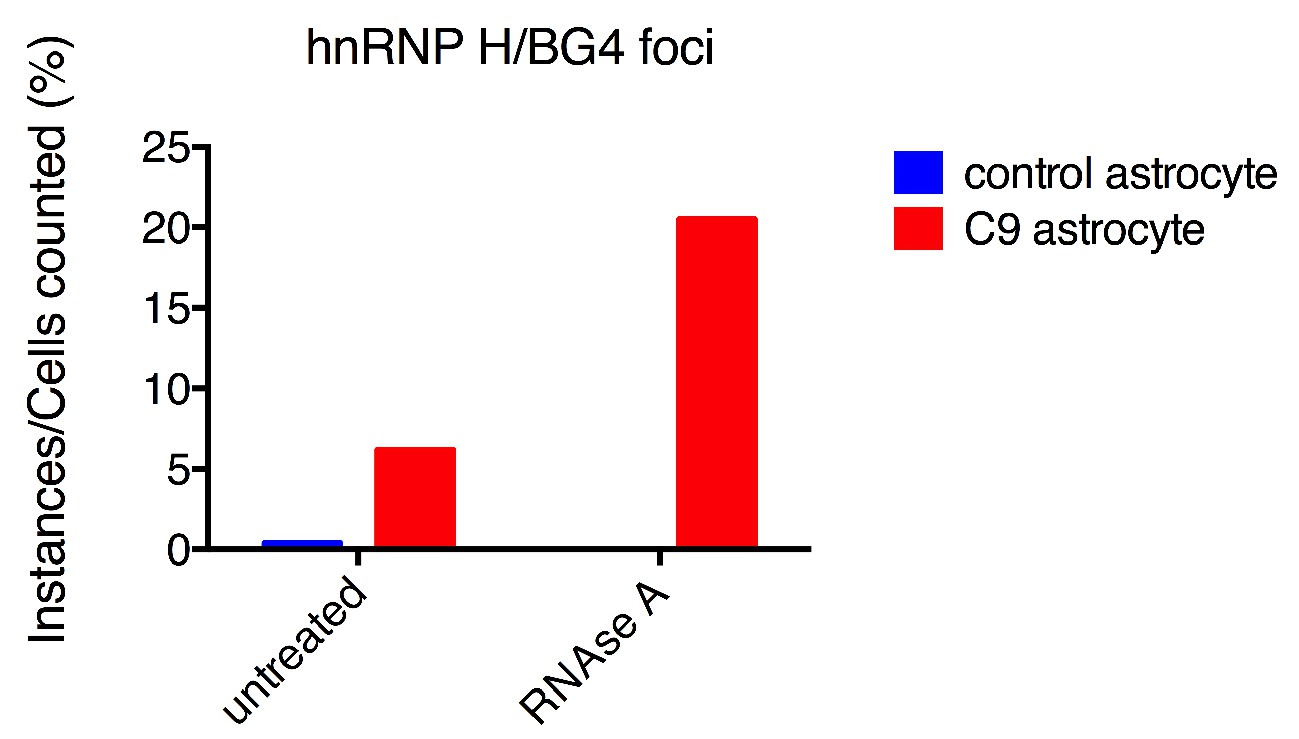
hnRNP H/BG4 colocalization in events in RNAse A treated astrocytes.
Percentage of cells with hnRNP H/BG4 colocalization without treatment and after RNAse A treatment.
Figure 4—figure supplement 2
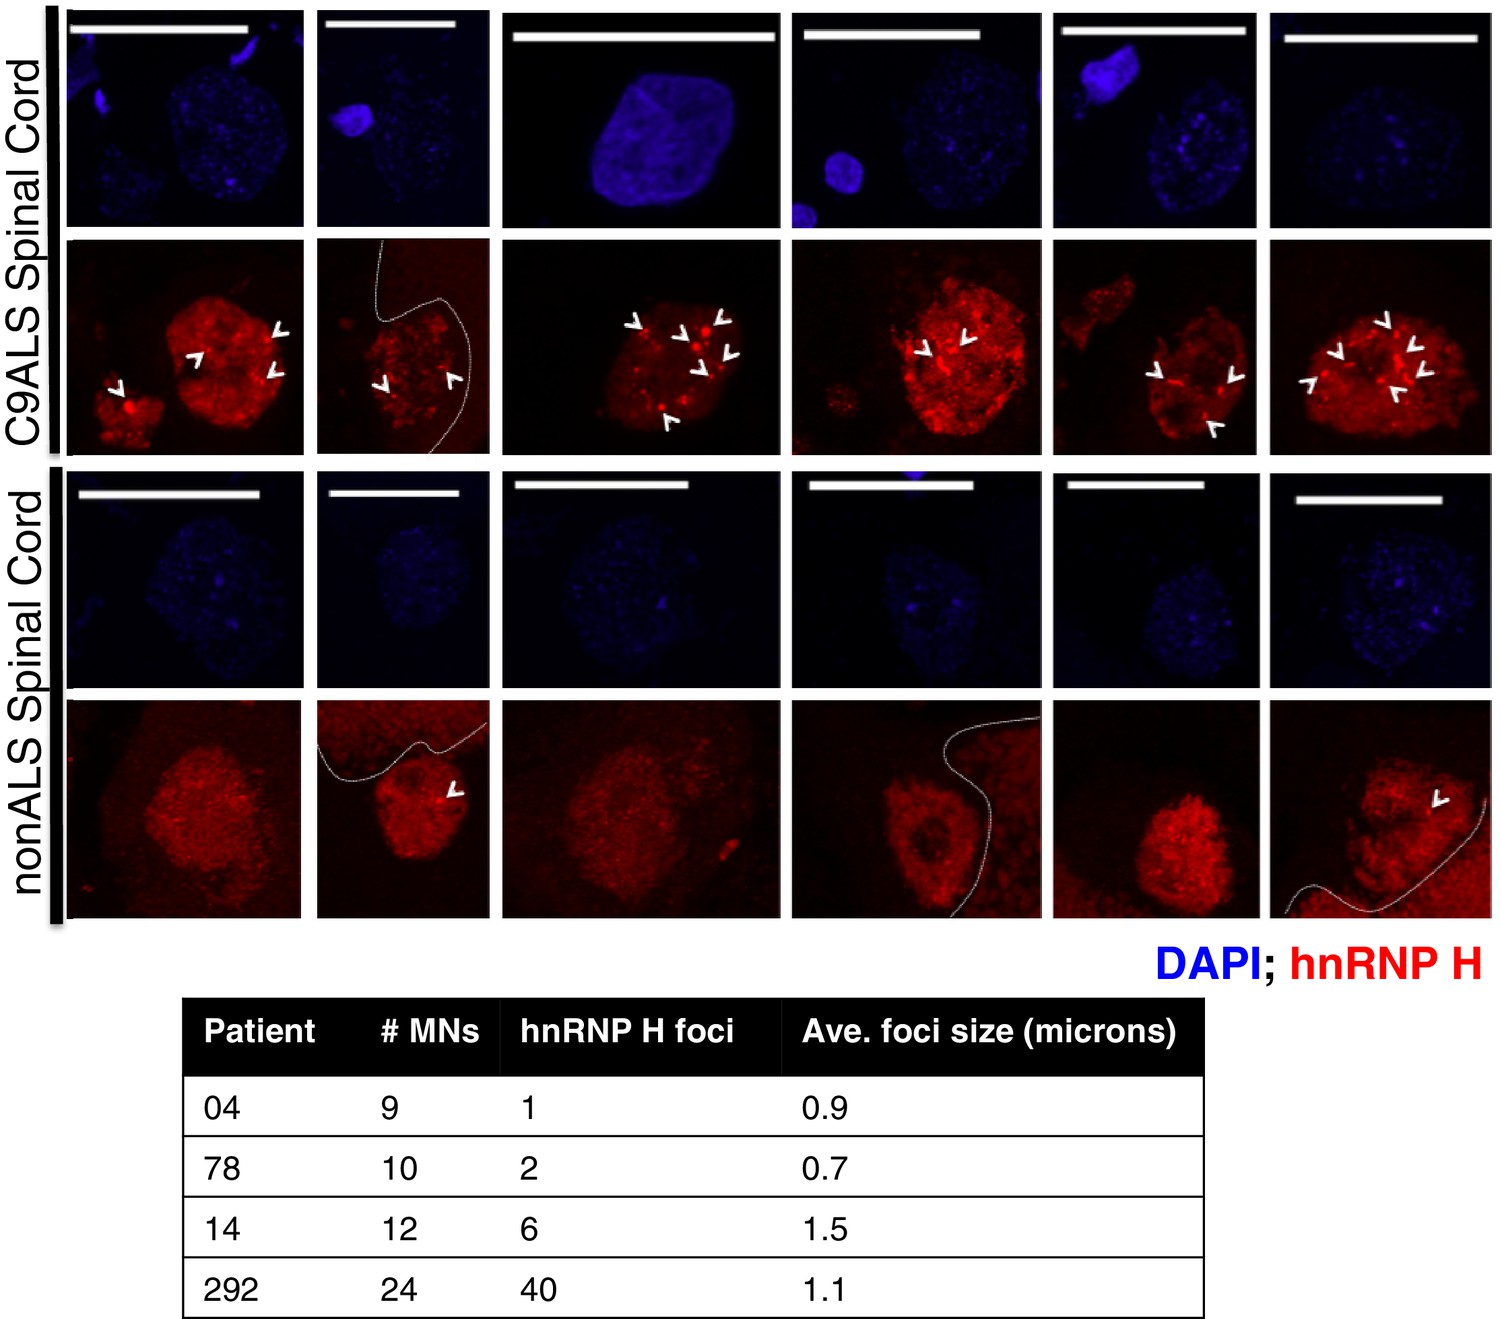
hnRNP H foci in post-mortem human spinal motor neurons.
(Top) Representative motor neurons (MNs) from C9ALS patients (upper panel) and from nonALS patients (lower panel). DAPI = blue; hnRNP H = red, scale bar = 25 microns. Arrows indicate foci larger than 0.5 microns, dashed lines indicate lipofuscin. (Bottom) Table summarizing motor neurons counted, number of hnRNP H foci, and average foci size.
Figure 5 with 4 supplements

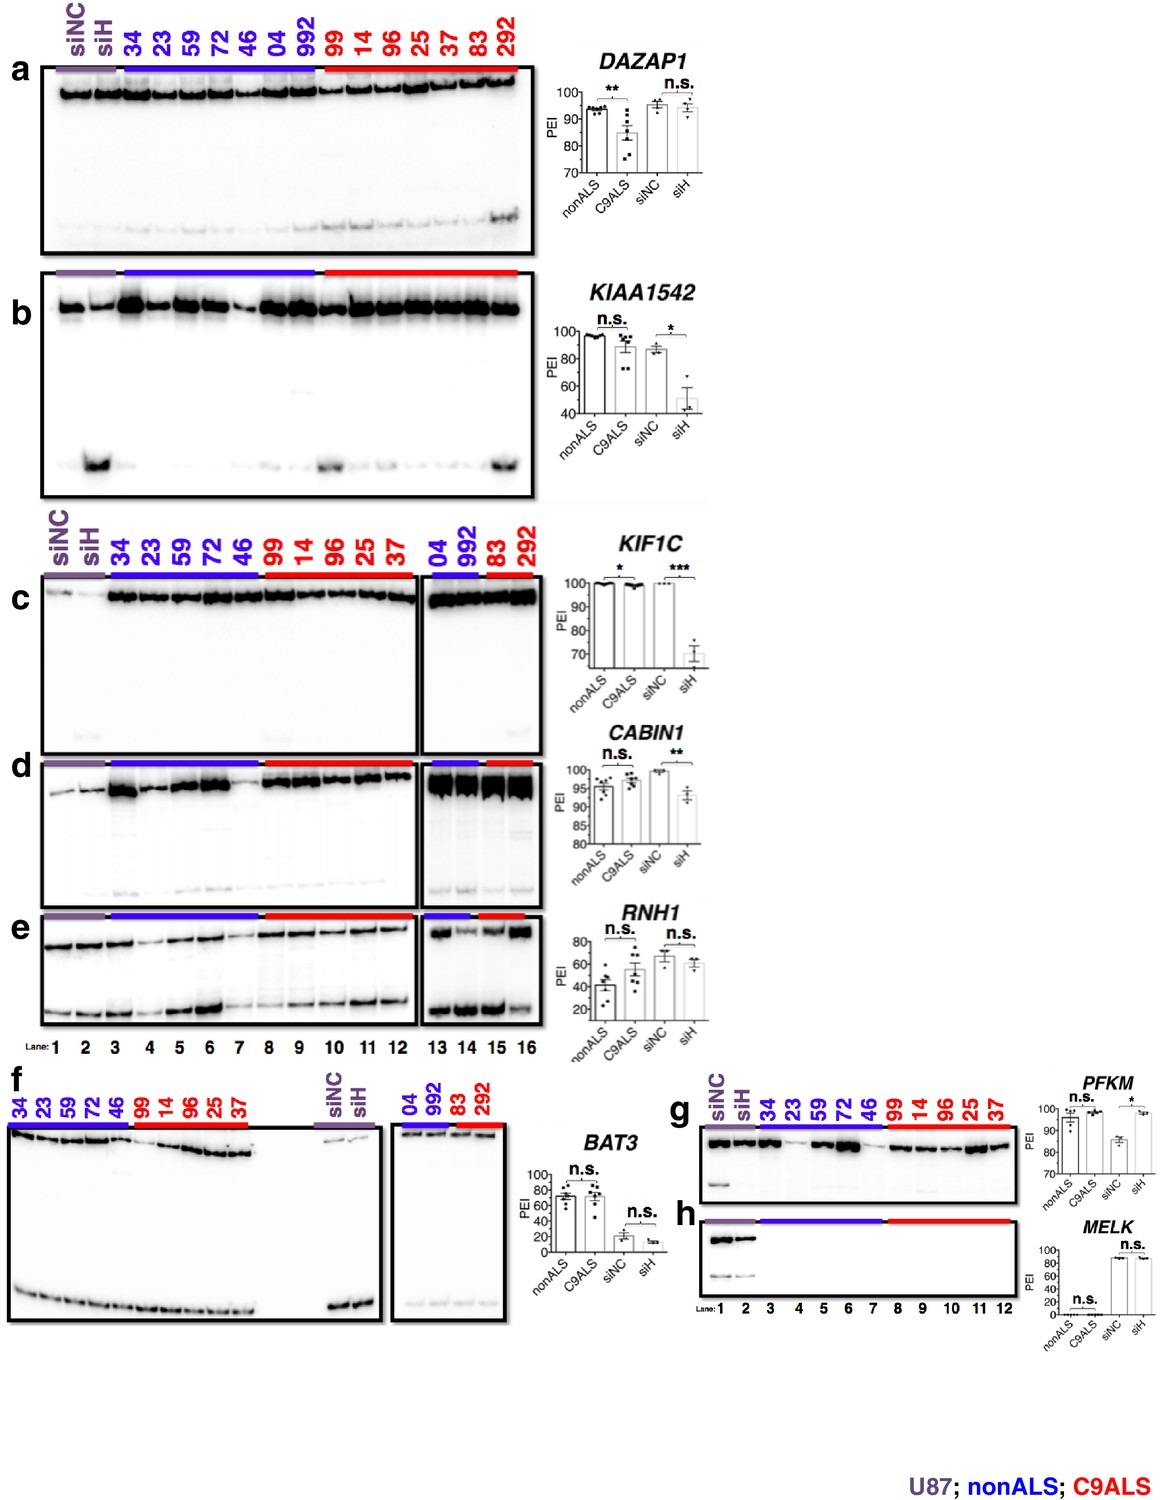
Missplicing of hnRNP H target exons in C9 ALS patient brains.
(a) Western blot of hnRNP H knockdown in U87 cells. (b) (Left) Diagram of representative hnRNP H target exons with small blue rectangles depicting the relative locations of inclusion-enhancing intronic (upper) and repressive exonic (lower) G-Q binding motifs, listed at right. (c–l) Representative hnRNP H target exons perturbed in C9ALS patient brains. (Left) 32P-RT-PCR across alternatively spliced exon for siRNA-treated U87 cells (lanes 1 and 2), nonALS control cerebellum (lanes 3–7, 13 and 14) and C9ALS cerebellum (lanes 8–12, 15 and 16). Star symbols (k and l) denote non-specific PCR artifact bands. (Right) Graph depicting the average percent inclusion of each target exon, all values listed in Supplementary file 2. PEI = percent exon inclusion. For lanes 4 and 7, see sample quality note in Supplementary file 1 (*p<0.05, **p<0.01, ***p<0.001, ****p<0.0001). Error bars are plotted to SEM. (m) Linear regression of percent inclusion values for each of the 18 significantly affected (p<0.05) target exons as a function of the average percent inclusion of these genes in each C9ALS sample. Solid lines are used for genes with positive slopes, dashed lines for genes with negative slopes. Error bars are plotted to SEM.
Figure 5—figure supplement 1
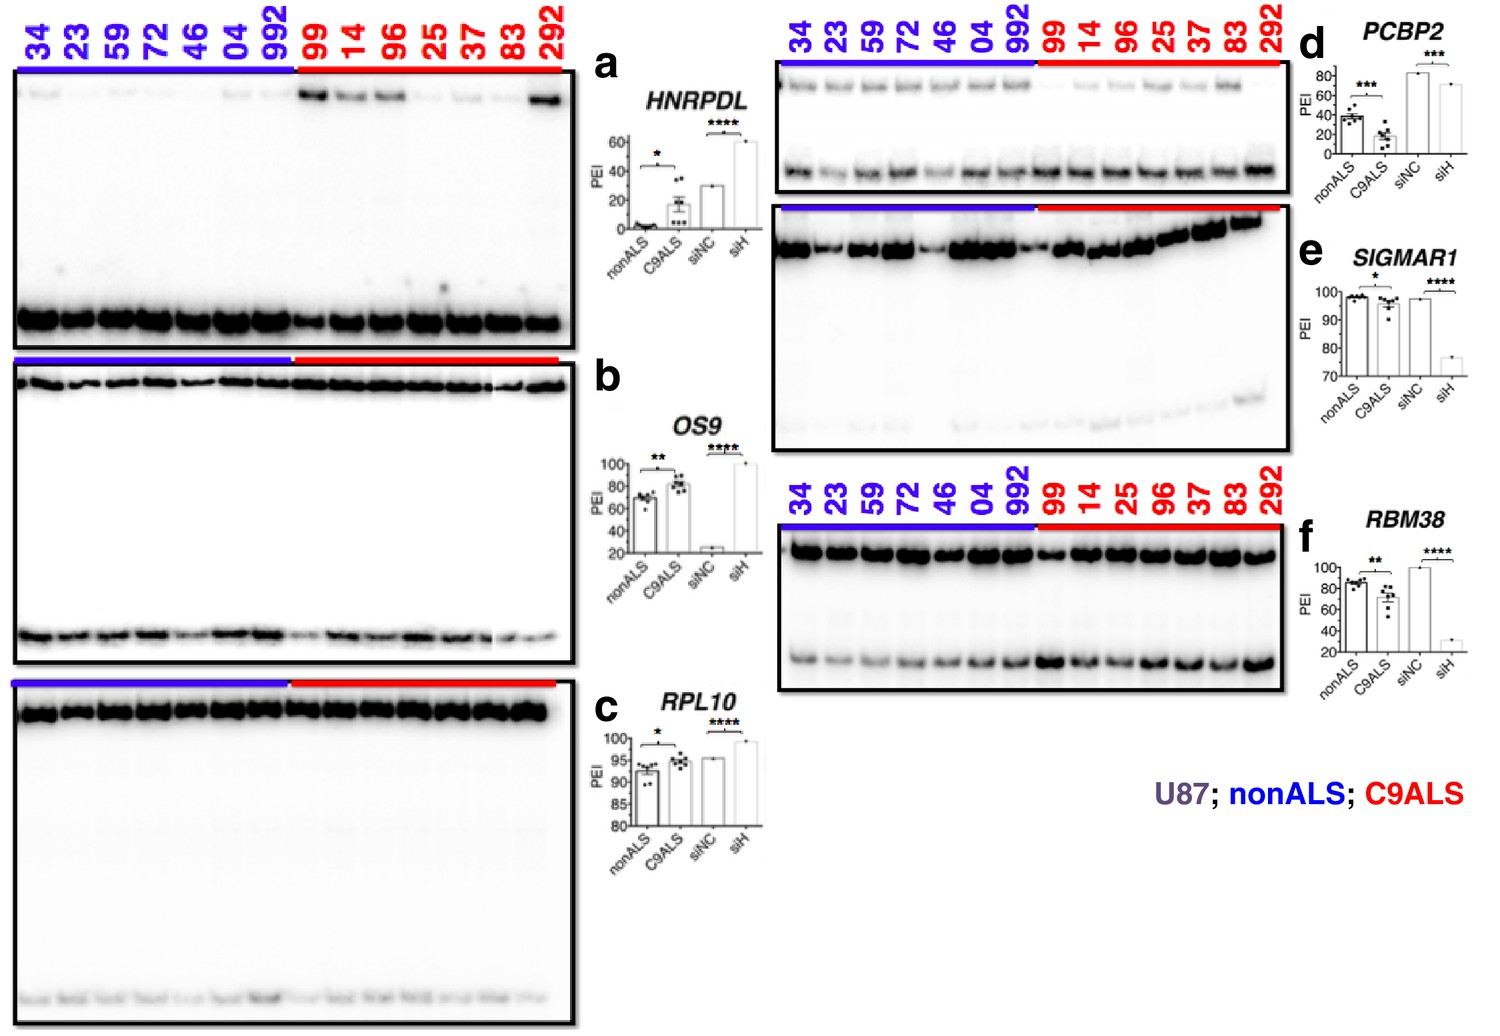
(Left) 32P-RT-PCR across alternatively spliced exons for siRNA-treated U87 cells (a–h lanes 1 and 2), nonALS control cerebellum (a,b) lanes 3–9; c–f lanes 3–7, 13 and 14; g,h lanes 3–7) and C9ALS cerebellum (a,b 10–16; c–f lanes 8–12, 15 and 16; g,h lanes 8–12).
(Right) Graph depicting the average percent inclusion of each target exon, all values listed in Supp. Table 2. PEI = percent exon inclusion. (*p<0.05, **p<0.01, ***p<0.001), ****p<0.0001). Error bars are plotted to SEM.
Figure 5—figure supplement 2
(Left) 32P-RT-PCR across alternatively spliced exons for nonALS control cerebellum (lanes 1–7) and C9ALS cerebellum (lanes 8–14).
(Right) Graph depicting the average percent inclusion of each target exon, all values listed in Supp. Table 2. PEI = percent exon inclusion. (*p<0.05, **p<0.01, ***p<0.001), ****p<0.0001). Error bars are plotted to SEM.
Figure 5—figure supplement 3
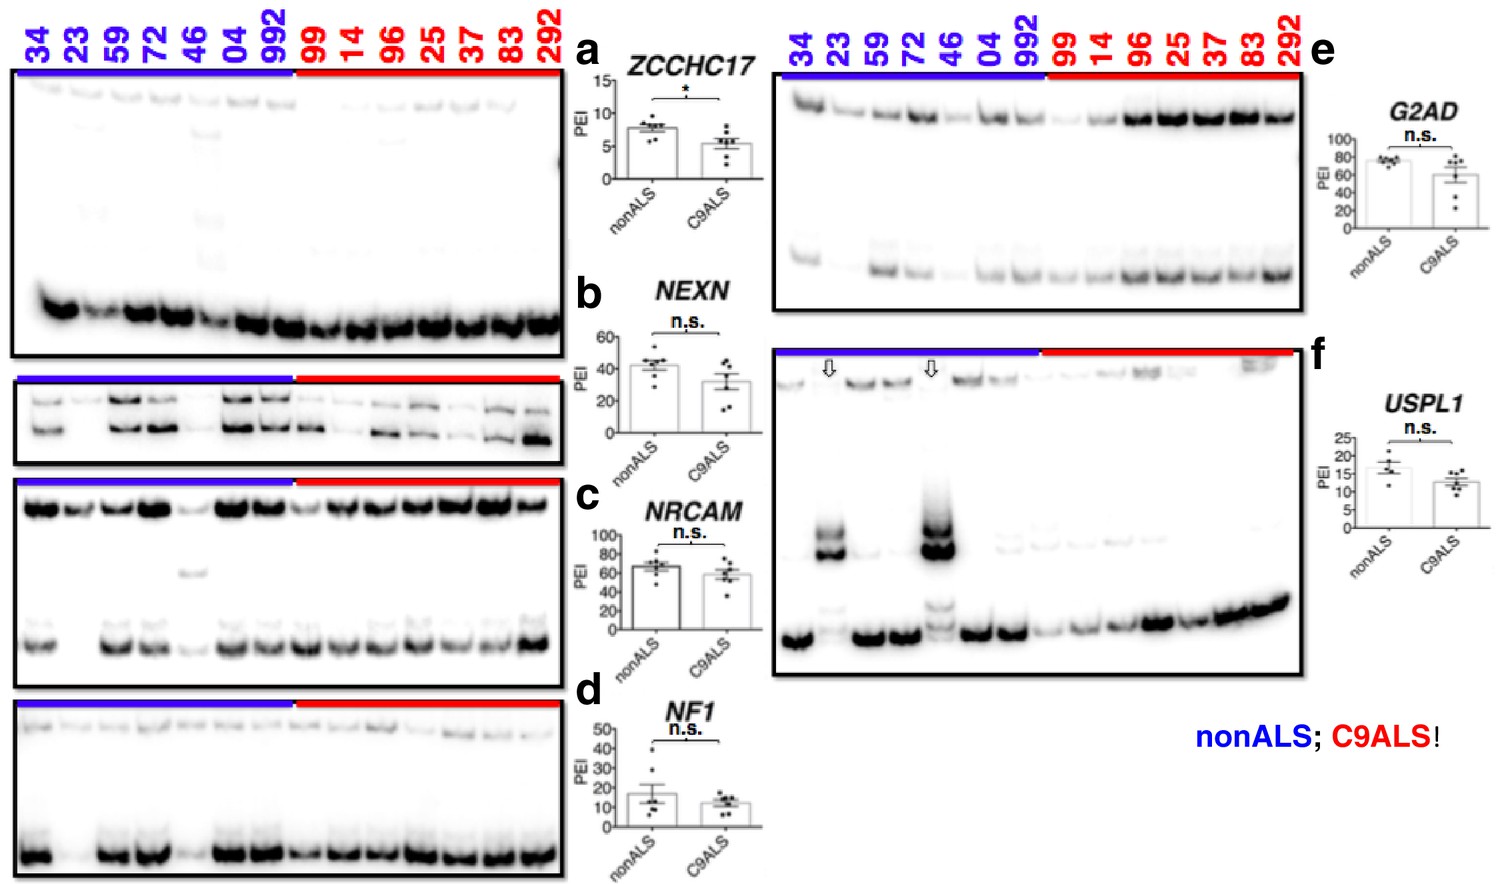
(Left) 32P-RT-PCR across alternatively spliced exons for nonALS control cerebellum (lanes 1–7) and C9ALS cerebellum (lanes 8–14).
(Right) Graph depicting the average percent inclusion of each target exon, all values listed in Supp. Table 2. PEI = percent exon inclusion. Downward arrows in (f) indicate lanes with abnormal PCR products; these samples were omitted from t test for this gene. (*p<0.05, **p<0.01, ***p<0.001), ****p<0.0001). Error bars are plotted to SEM.
Figure 5—figure supplement 4
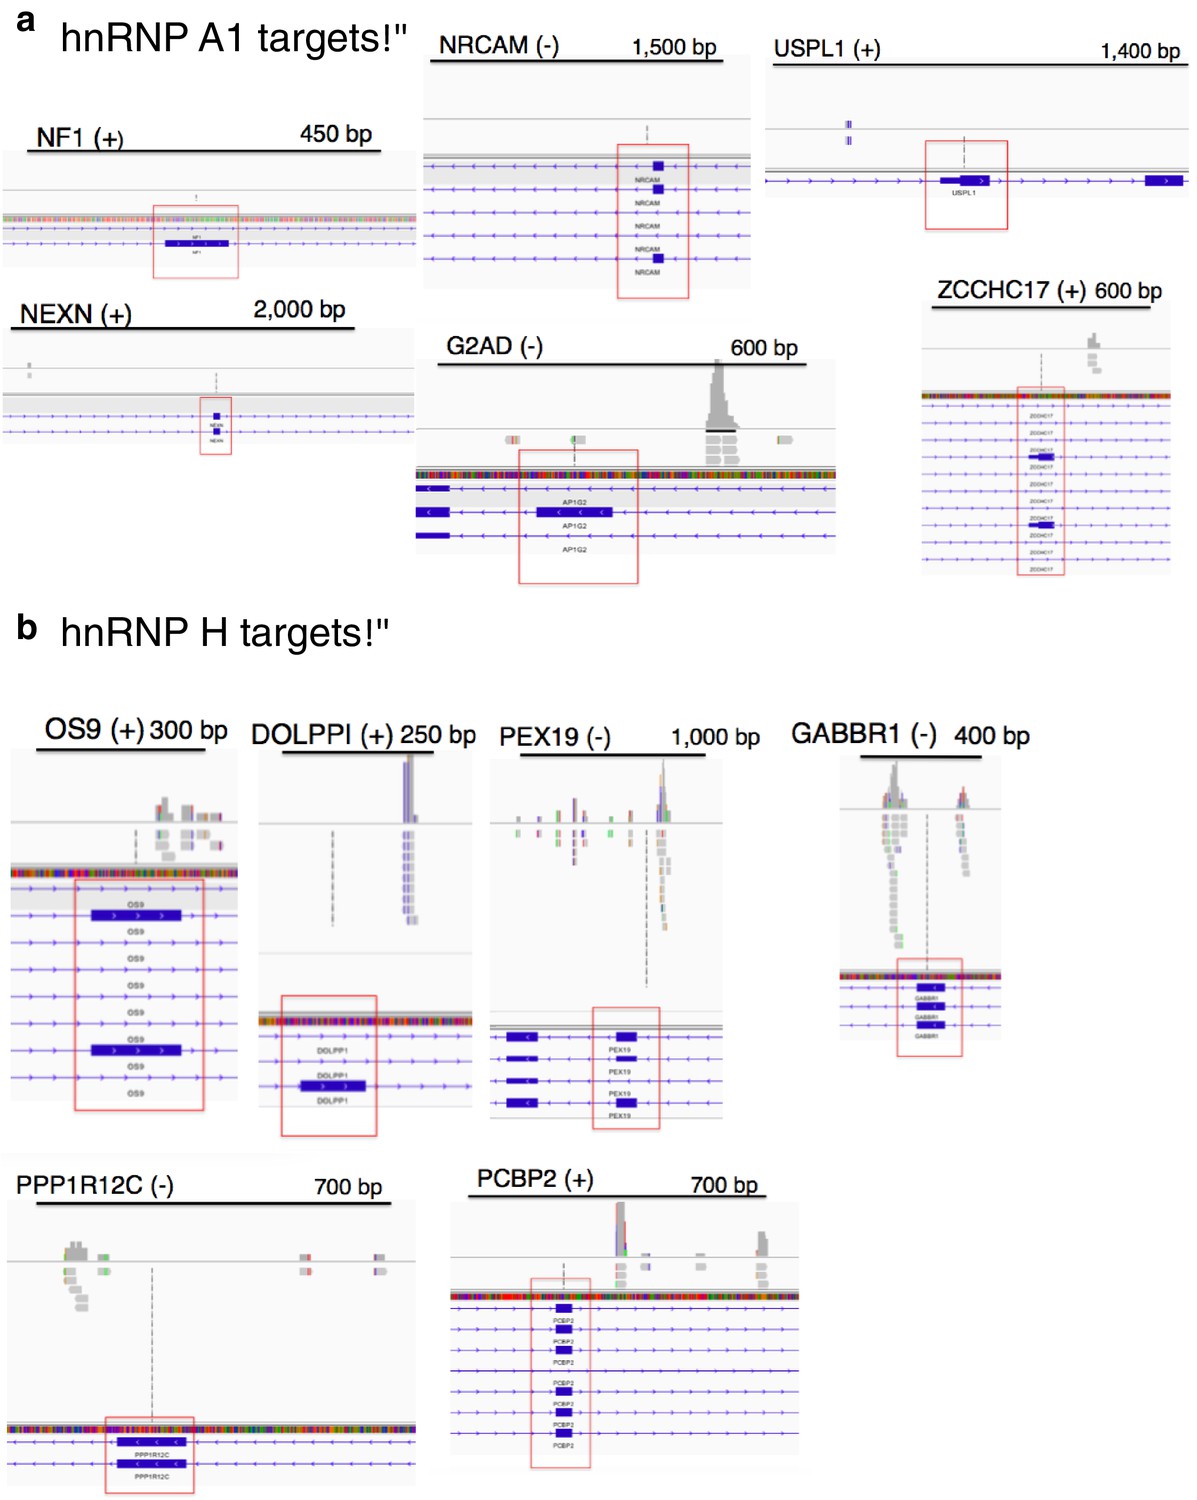
CLIP-seq of hnRNP A1 and representative hnRNP H target exons.
hnRNP H CLIP-seq reads of exons tested by PCR, mapped to hg38. Name of gene is followed by (+) or (−) to indicate forward or reverse strand, respectively. Regulated exon is surrounded by red box. Bars are drawn to indicate the number of basepairs specified. hnRNP A1 targets are shown in (a) and hnRNP H targets are shown in (b).
Figure 6 with 1 supplement
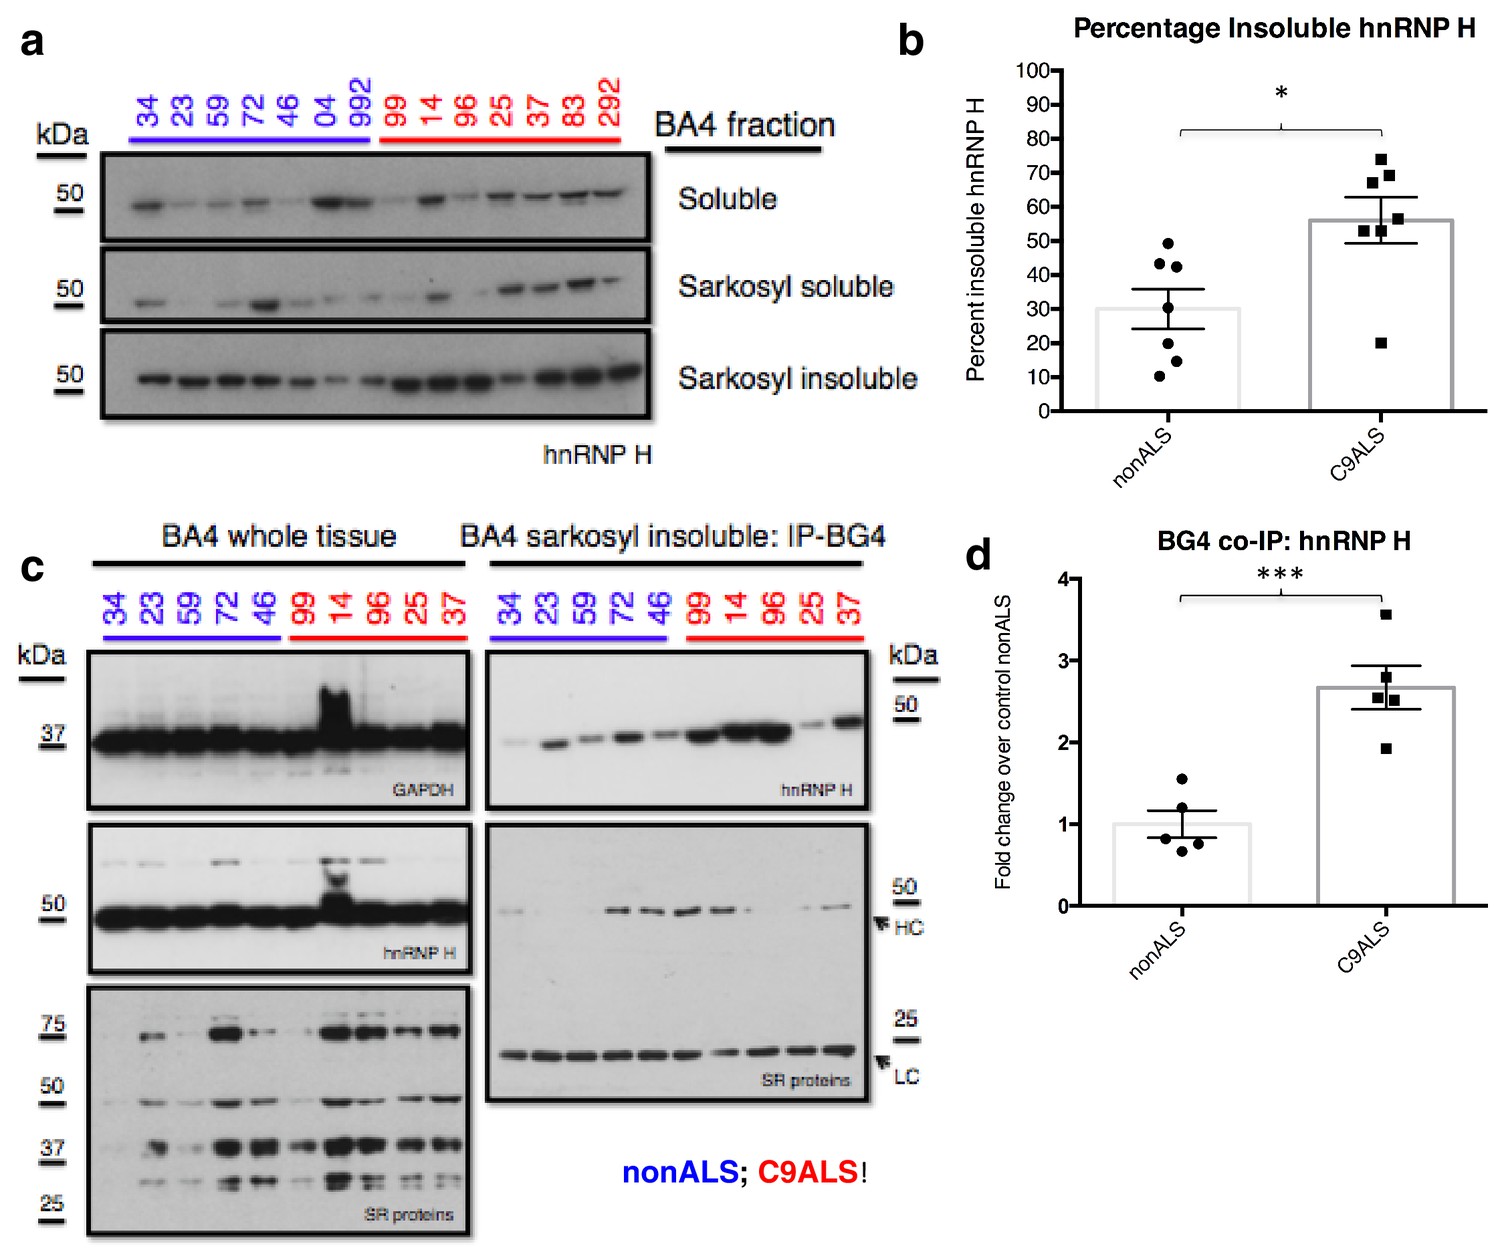
C9ALS brains are enriched with insoluble G-Q bound hnRNP H.
(a) Western blot analysis of hnRNP H in each of three fractions (soluble, sarkosyl soluble, sarkosyl insoluble). (b) Graph of the percentage of insoluble hnRNP H in each of the 14 patients (c) IP with BG4 (IP-BG4) from the resuspended sarkosyl insoluble fraction of motor cortex (BA4). (Left) Western blots of input unfractionated tissue probed with anti-GAPDH, hnRNP H and SR protein antibodies. (Right) Western blot of IP-BG4 probed with anti-hnRNP H and SR protein antibodies. HC and LC refer to IgG heavy chain and light chain, respectively. (d) Quantification of hnRNP H co-IPed with BG4 (n = 3 replicates) in each of ten non-ALS and C9ALS samples. (*p<0.05, **p<0.01, ***p<0.001, ****p<0.0001). Error bars are plotted to SEM.
Figure 6—figure supplement 1
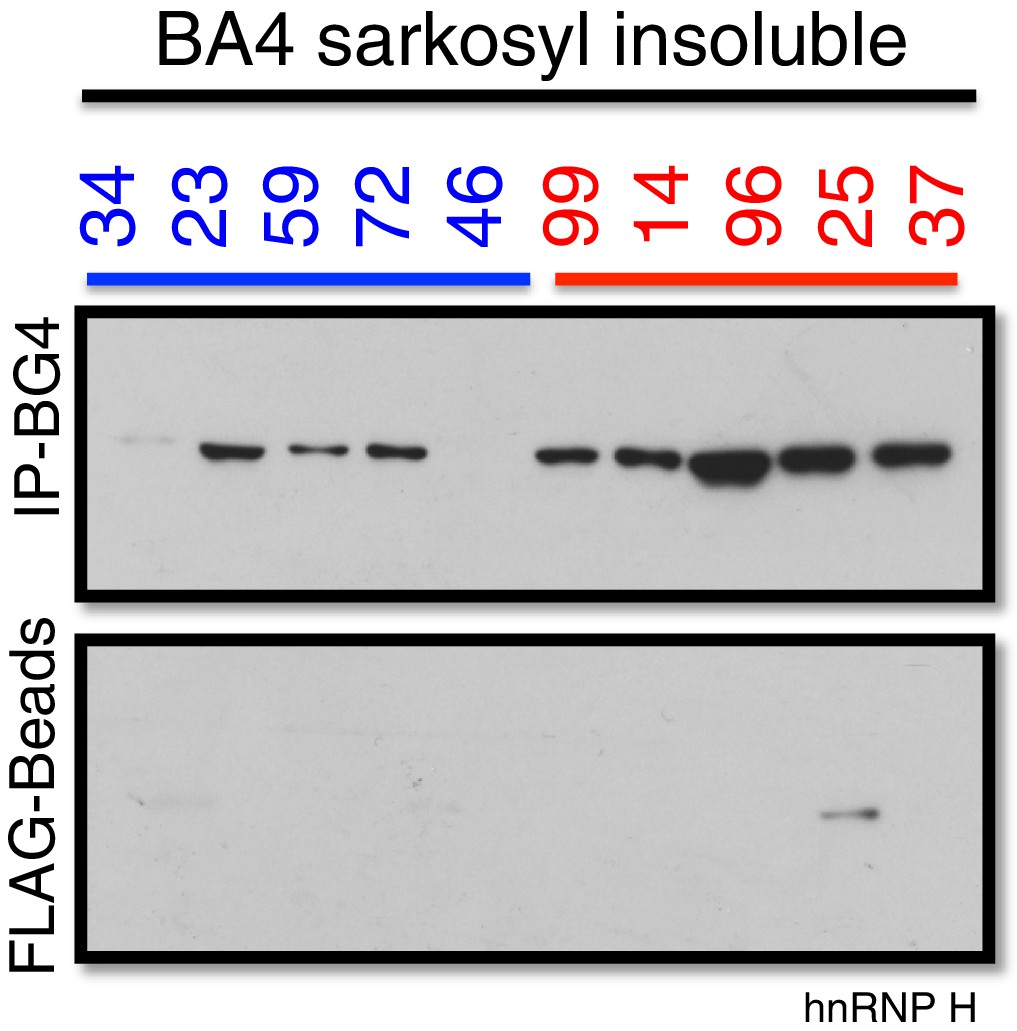
Co-immunoprecipitation of BG4 from the Sarkosyl insoluble fraction of patient motor cortex (BA4).
Western blot of BG4 pulldown (IP-BG4) and FLAG-beads alone control IP, probed with anti-hnRNP H antibody.
Additional files
-
Supplementary file 1
Patient and control information.
CBL = cerebellum, BA4 = Brodmann Area 4, SC = spinal cord, LE = lower extremity, UE = upper extremity, MND = motor neuron disease, COPD = chronic obstructive pulmonary disease, ***minimal clinical information available.
- https://doi.org/10.7554/eLife.17820.019
-
Supplementary file 2
Genes analyzed.
Names and genomic locations of genes with cassette exon inclusion/exclusion analyzed by RT-PCR (*p<0.05, **p<0.01, ***p<0.001), ****p<0.0001).
- https://doi.org/10.7554/eLife.17820.020
-
Supplementary file 3
Template, siRNA and primer sequences.
- https://doi.org/10.7554/eLife.17820.021
-
Supplementary file 4
Growth medium recipes.
- https://doi.org/10.7554/eLife.17820.022
Download links
A two-part list of links to download the article, or parts of the article, in various formats.
Downloads (link to download the article as PDF)
Open citations (links to open the citations from this article in various online reference manager services)
Cite this article (links to download the citations from this article in formats compatible with various reference manager tools)
The C9ORF72 GGGGCC expansion forms RNA G-quadruplex inclusions and sequesters hnRNP H to disrupt splicing in ALS brains
eLife 5:e17820.
https://doi.org/10.7554/eLife.17820


