Prosurvival long noncoding RNA PINCR regulates a subset of p53 targets in human colorectal cancer cells by binding to Matrin 3
- National Cancer Institute, National Institutes of Health, United States
- University of Illinois at Urbana-Champaign, United States
- National Library of Medicine, National Institutes of Health, United States
- National Institute of Child Health and Human Development, National Institutes of Health, United States
- Ionis Pharmaceuticals, United States
- University of Minnesota, United States
Figures
Figure 1 with 6 supplements
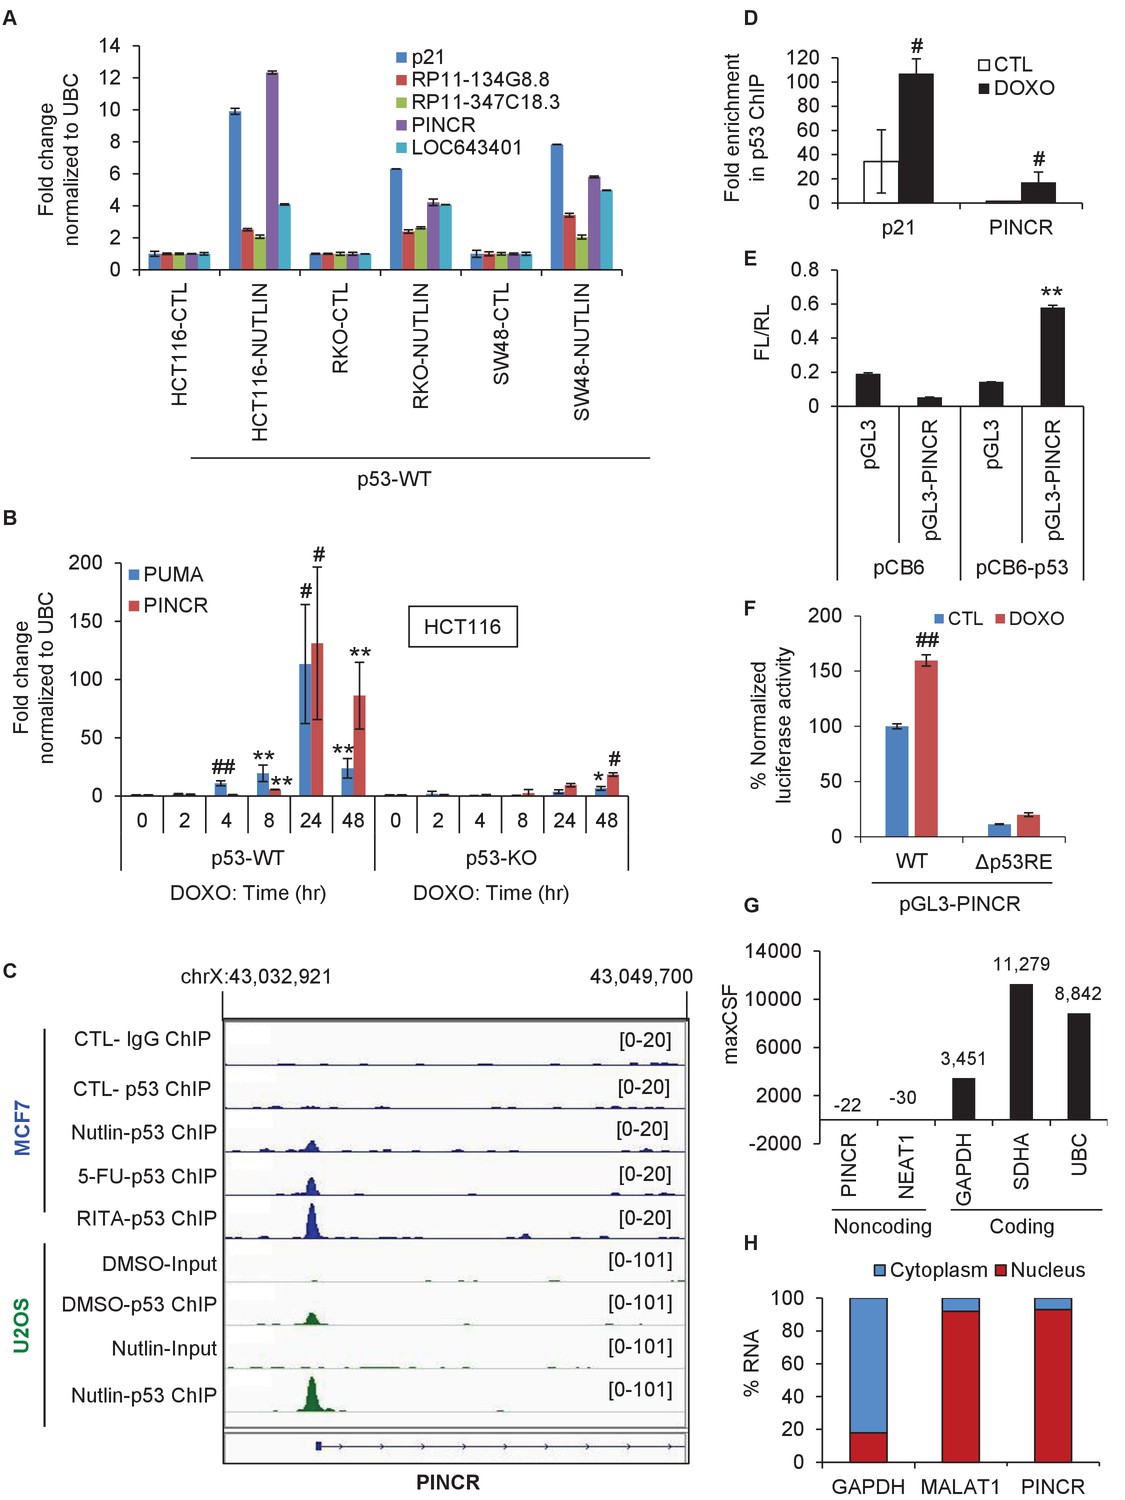
PINCR is a nuclear lncRNA directly induced by p53 after DNA damage.
(A) qRT-PCR analysis from HCT116, SW48 and RKO cells untreated or treated with Nutlin-3 for 8 hr. Error bars represent SD from two independent experiments. (B) qRT-PCR analysis for PINCR and the known p53 target PUMA from isogenic p53-WT and p53-KO HCT116 cells untreated or treated with DOXO for the indicated times. (C) Snapshot of p53 ChIP-seq data of the PINCR promoter from MCF7 and U2OS cells untreated or treated with Nutlin or 5-FU or RITA. (D) HCT116 cells were untreated or treated with DOXO for 16 hr and qPCR using primers spanning the p53RE of p21 and PINCR was performed from Input and p53-ChIP. (E) HCT116 cells were co-transfected for 48 hr with pGL3 or pGL3 containing the PINCR promoter, and pCB6 or pCB6-p53. Luciferase assays were performed using pRL-TK as internal control. (F) Luciferase assays were performed from untreated (CTL) or DOXO-treated HCT116 cells co-transfected for 48 hr with the internal control pRL-TK and pGL3 containing the PINCR wild-type (WT) promoter or pGL3 containing the PINCR promoter in which the p53RE was deleted (△p53RE). (G) Maximum CSF scores of PINCR as well as other coding and noncoding RNAs determined by analysis with PhyloCSF. (H) qRT-PCR analysis from nuclear and cytoplasmic fractions of DOXO-treated HCT116 cells; the cytoplasmic GAPDH mRNA and the nuclear lncRNA MALAT1 were used as controls. Error bars in B, D-F represent SD from three independent experiments. #p<0.01; **p<0.005; ##p<0.001.
Figure 1—figure supplement 1
Identification of p53-regulated lncRNAs.
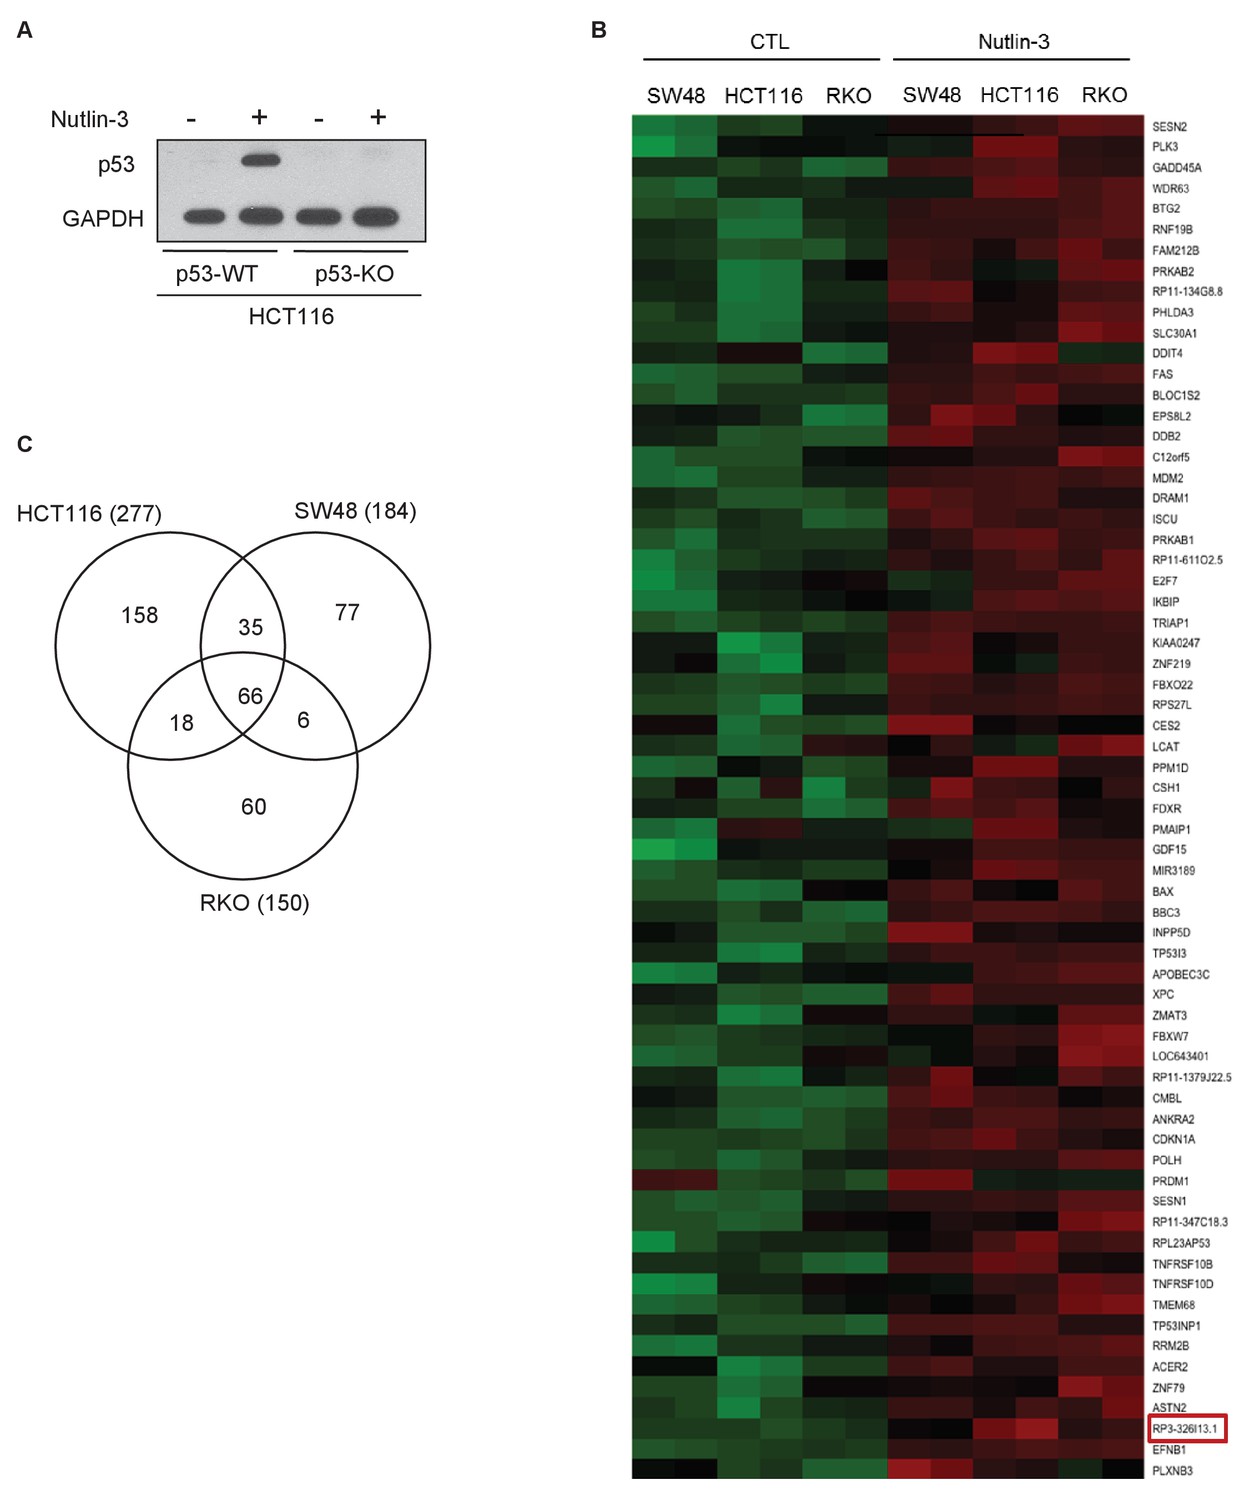
(A) Isogenic p53-WT and p53-KO HCT116 cells were untreated or treated with Nutlin-3 for 8 hr and immunoblotting was performed for p53 and the loading control GAPDH. (B) Heat map is shown for the differentially expressed mRNAs and lncRNAs identified by microarrays performed in duplicate from HCT116, SW48 and RKO cells untreated or treated with Nutlin-3 for 8 hr. Upregulated genes are shown in red and downregulated genes in green. PINCR (RP3-326I13.1) is shown in the red box. (C) Venn diagram showing the overlap between the transcriptomes upregulated ≥1.5-fold after Nutlin-3 treatment of HCT116, SW48 and RKO cells.
-
Figure 1—figure supplement 1—source data 1
p53 immunoblot for Figure 1—figure supplement 1A.
- https://doi.org/10.7554/eLife.23244.005
Figure 1—figure supplement 2
PINCR is highly induced after DNA damage in SW48 cells.
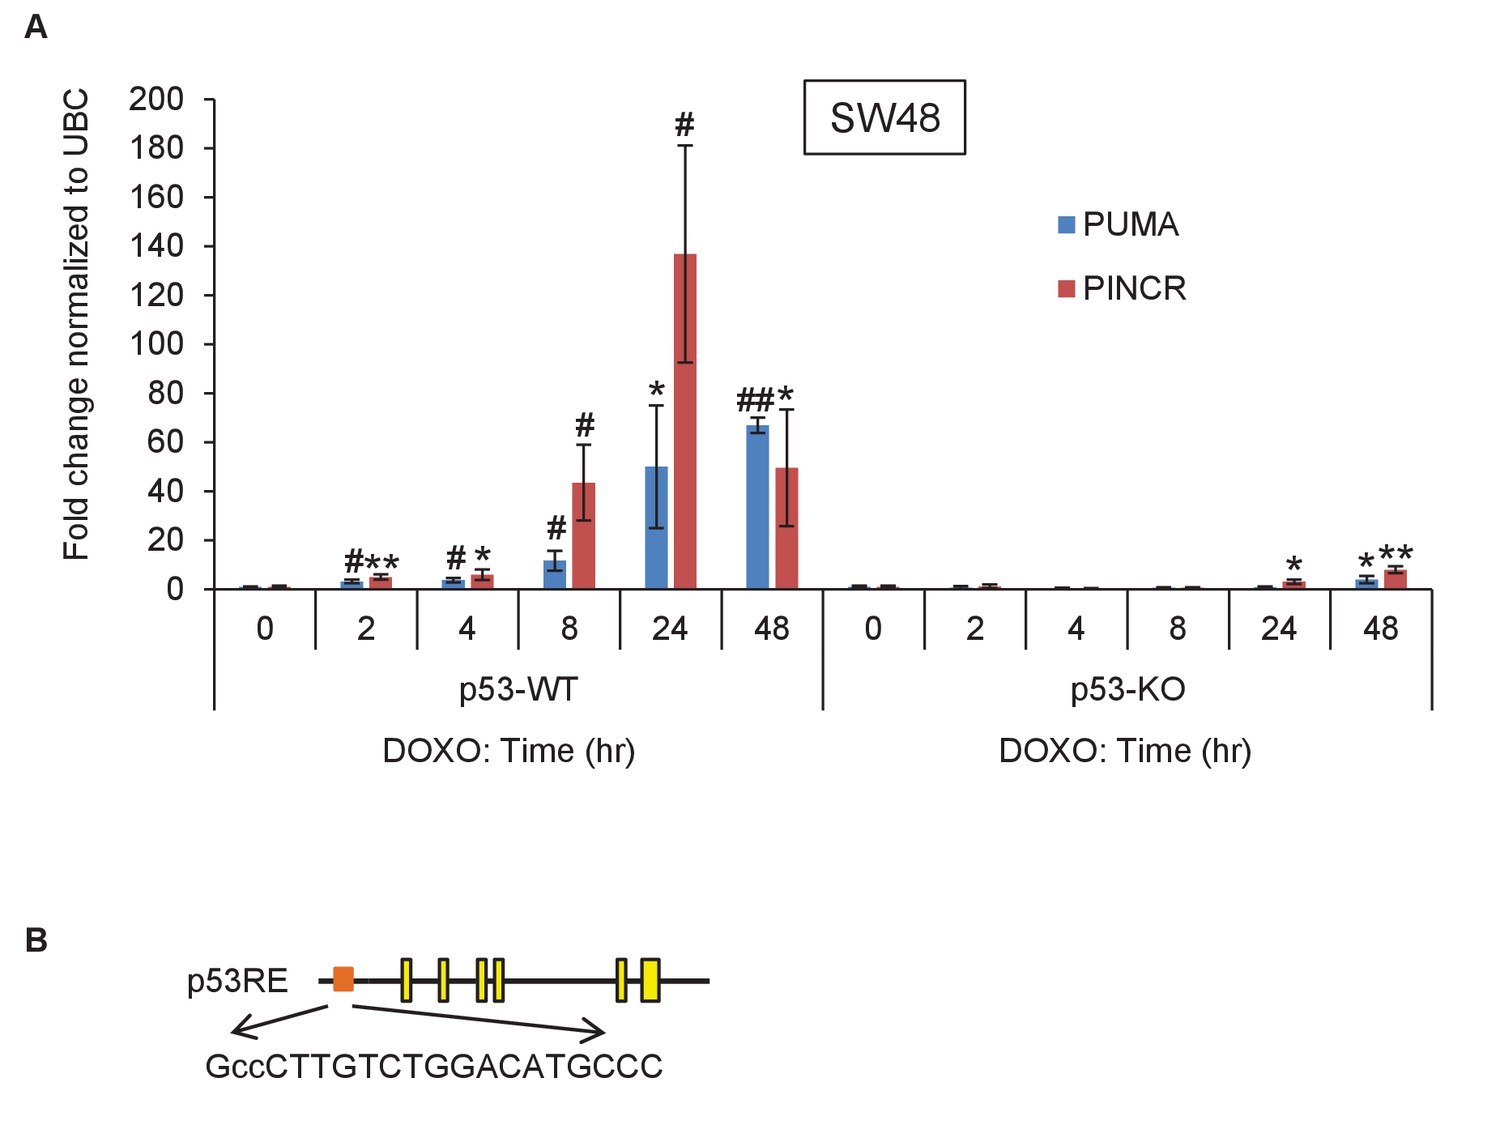
(A) qRT-PCR analysis of PINCR and the known p53 target PUMA from isogenic p53-WT and p53-KO SW48 cells untreated or treated with DOXO for the indicated times. (B) Pictorial representation of PINCR locus and the p53 response element (p53RE) located 118 bp upstream of the first exon. Error bars represent SD from three biological replicates. *p<0.05; #p<0.01; **p<0.005; ##p<0.001.
Figure 1—figure supplement 3
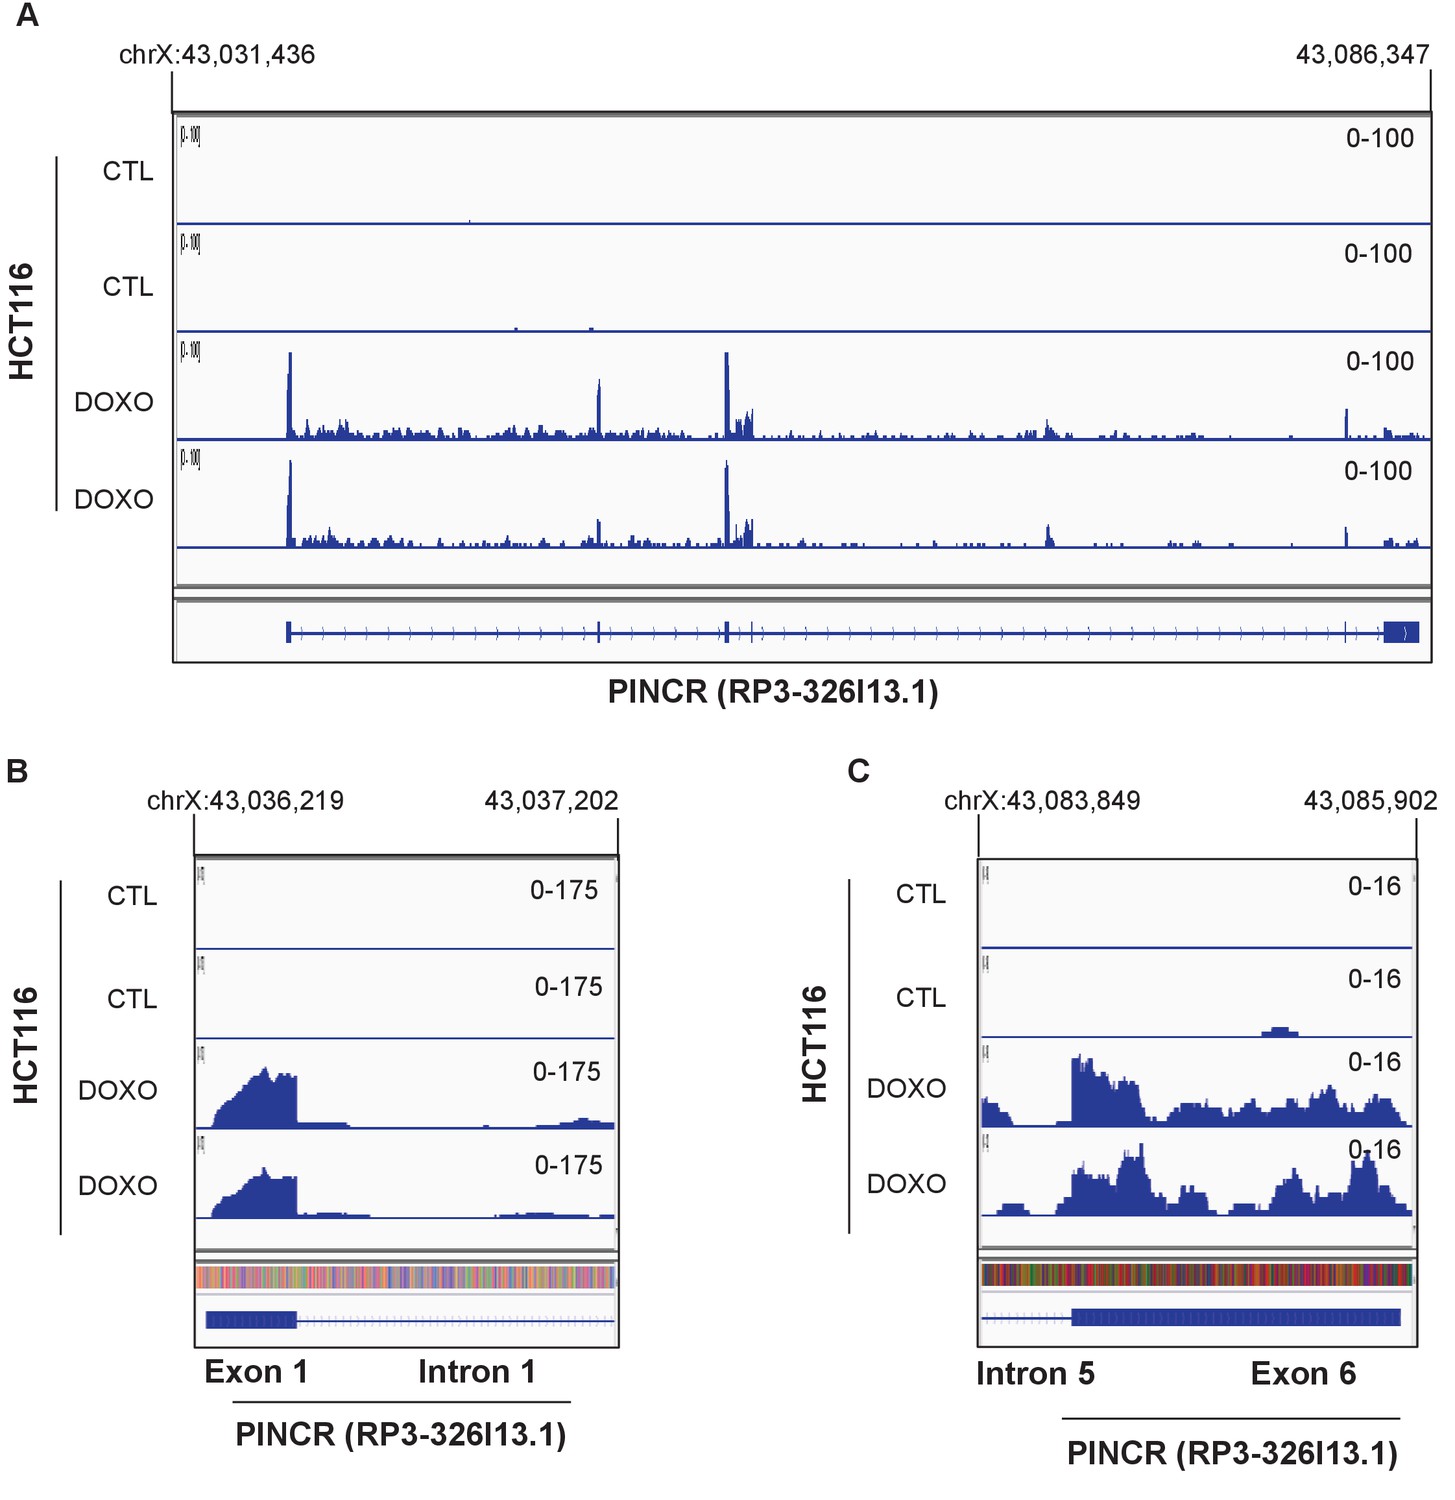
RNA-seq was performed in duplicate from HCT116 cells untreated (CTL) or treated with DOXO (300 nM) for 16 hr (Li et al., unpublished).
Snapshot of the RNA-seq data for the PINCR locus (A), 5’end of PINCR (B) and 3’end of PINCR (C) is shown.
Figure 1—figure supplement 4
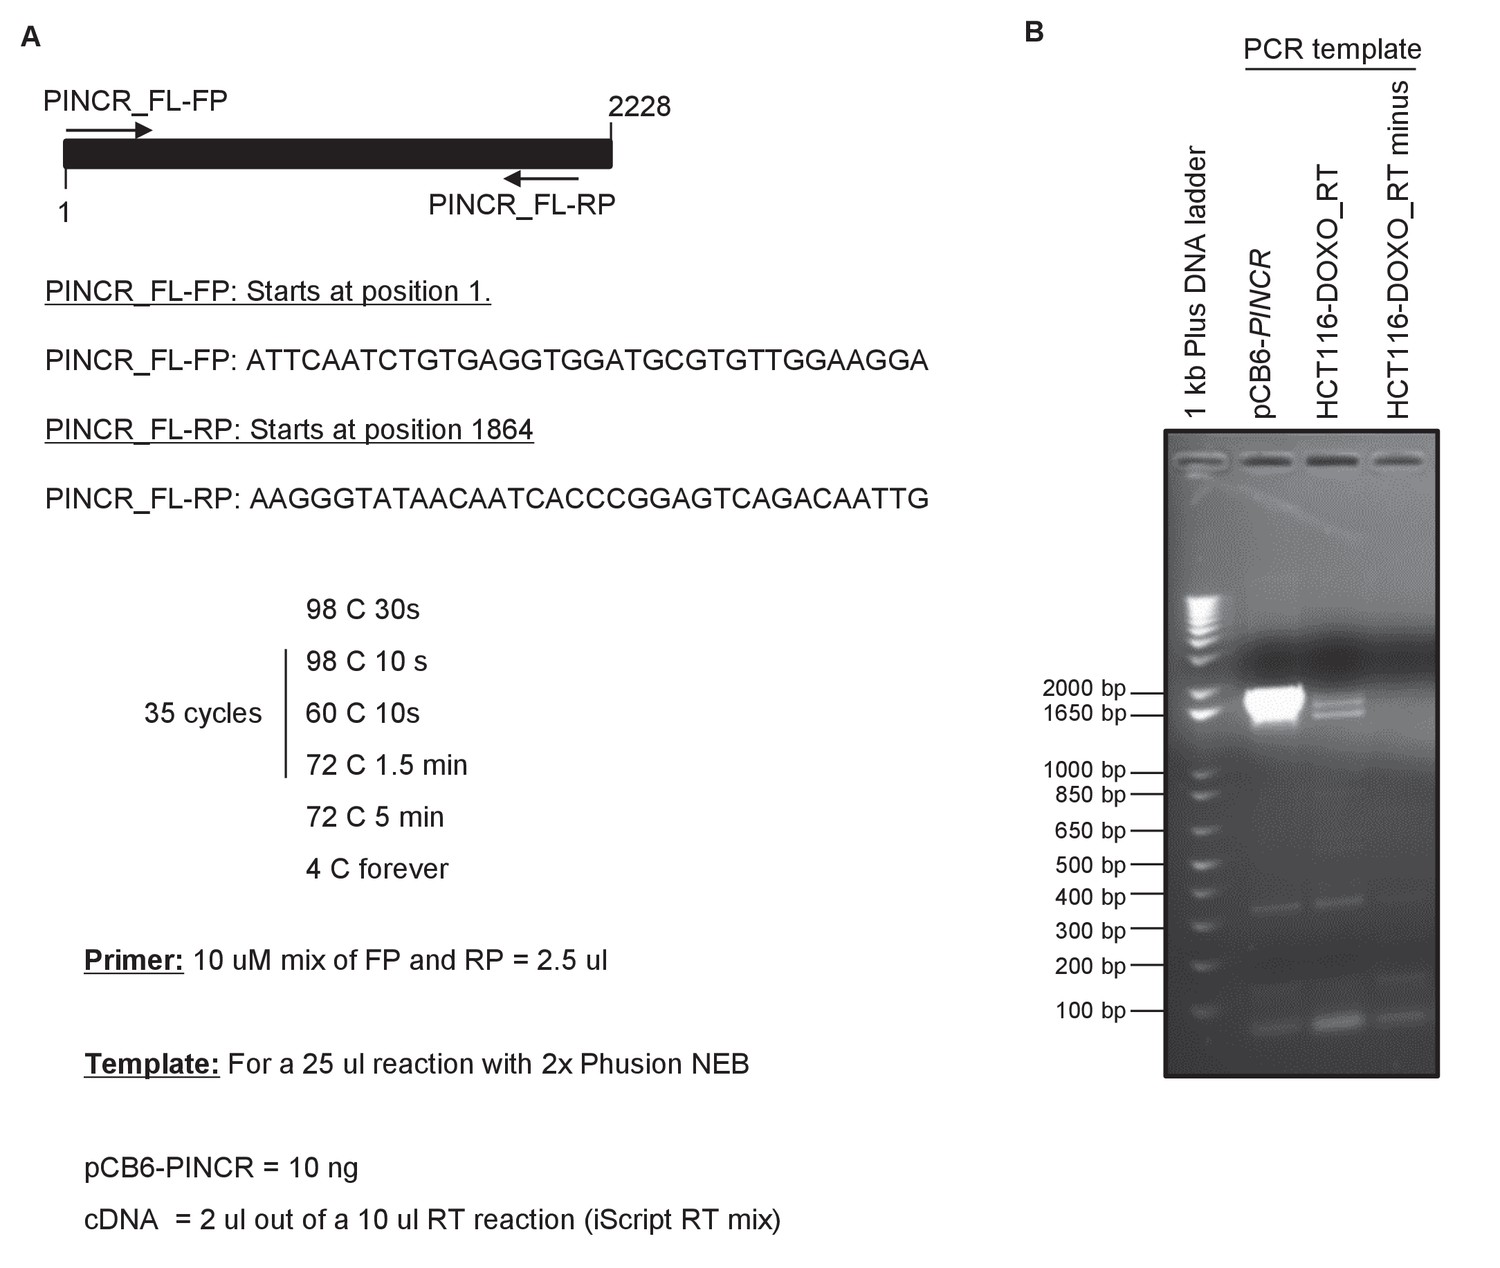
RT-PCR analysis of full-length PINCR.
RT-PCR for PINCR was performed using cDNA prepared from HCT116 DOXO-treated total RNA or pCB6-PINCR. The forward primer starts at the 5’end of the annotated PINCR RNA and the reverse primer is located near the 3’end of PINCR RNA. Location of the primers and conditions for PCR are shown in (A). Picture of the agarose gel after electrophoresis is shown in (B). pCB6-PINCR was used as positive control. RT minus refers to a control reaction in which the total RNA was used as template for PCR.
Figure 1—figure supplement 5
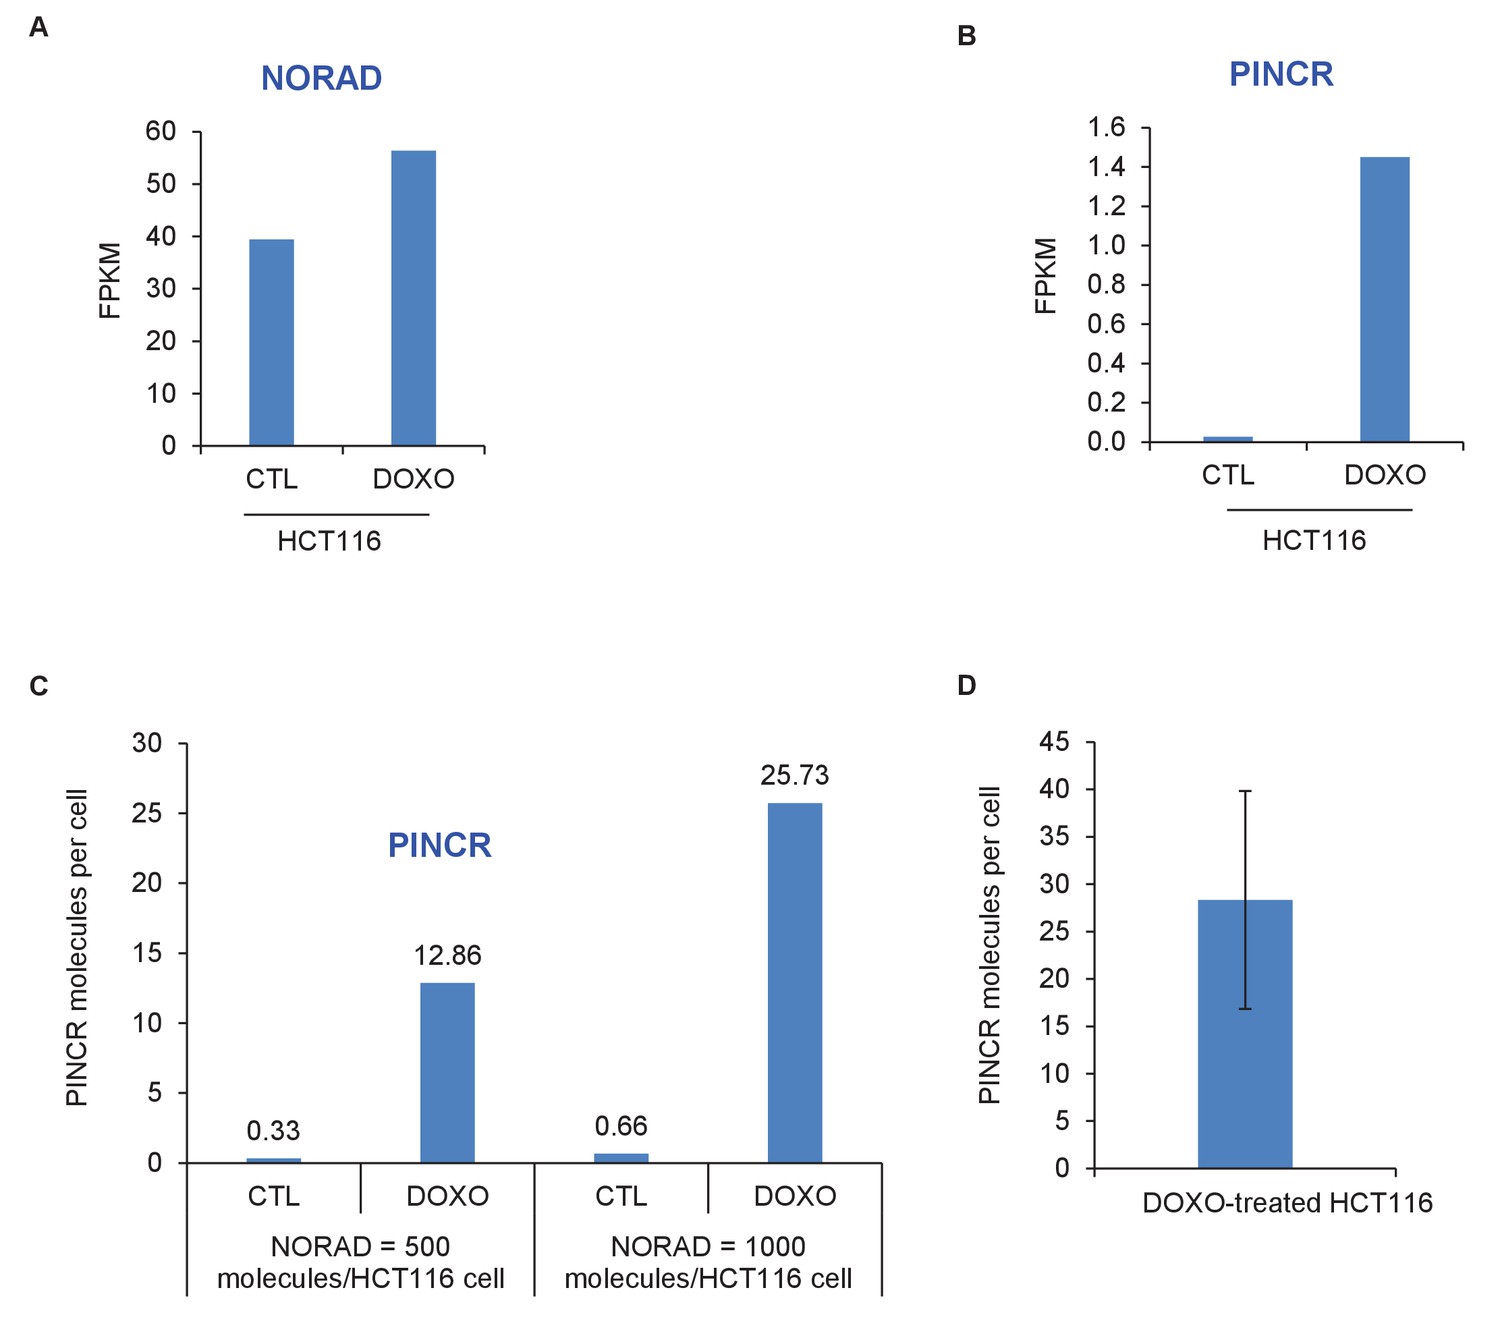
PINCR molecules per HCT116 cell.
The number of molecules of PINCR RNA per HCT116 cell was determined by two approaches. First (A–C), using RNA-seq from HCT116 cells (Li et al., unpublished): The FPKM of PINCR from CTL and DOXO-treated HCT116 cells was compared to NORAD, a lncRNA known to be expressed at 500–1000 molecules/HCT116 cell (Lee et al., 2016). Second (D), by qRT-PCR from DOXO-treated HCT116 cells using in vitro transcribed PINCR RNA as standard.
Figure 1—figure supplement 6
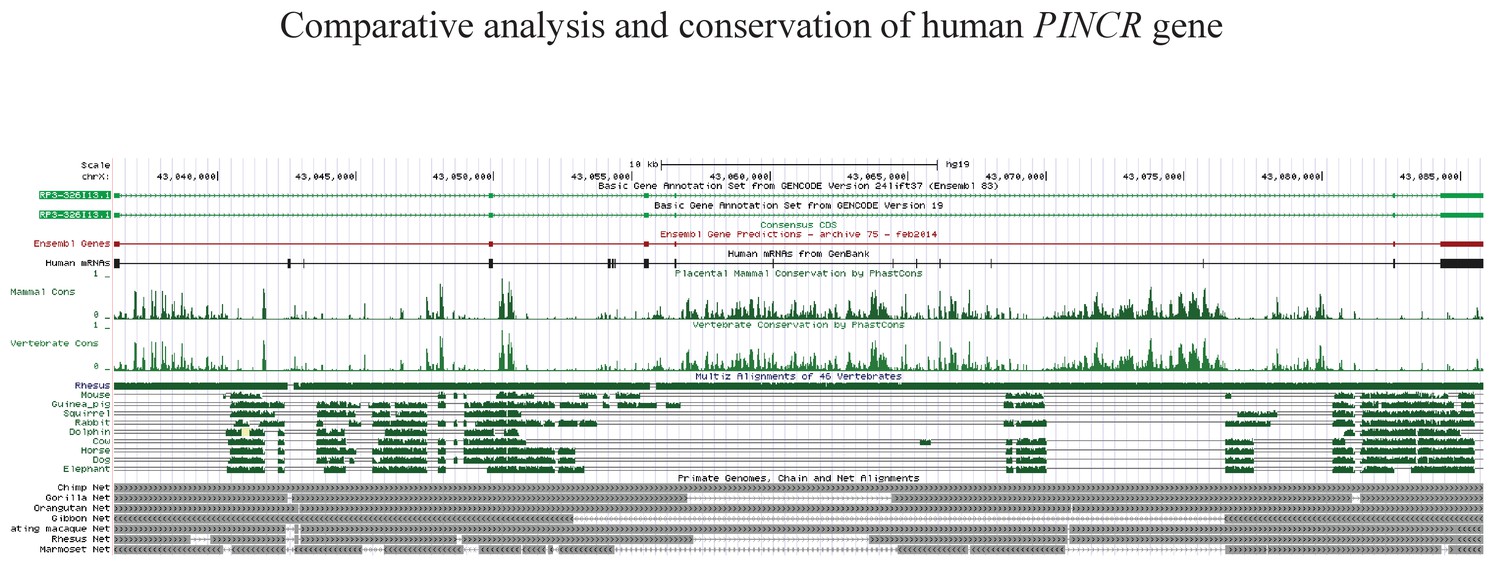
Conservation of PINCR.
Schematic diagrams of PINCR (RP3-326I12.1) genomic DNA alignments include multiple alignment of some mammalian species from the ‘Multiz Alignments of 46 Vertebrates’ track (shown in green), measurements of evolutionary conservation by the PhastCons method (Mammal Cons, Vertebrate Cons), and primate genomes (net track, grey) alignments. The net track shows the best human/other chain for PINCR genomic DNA. In the graphical display of primate genomes alignment, the boxes represent ungapped alignments and the line represent gaps. The diagram was downloaded and adapted from the UCSC Genome Browser (https://genome.ucsc.edu).
-
Figure 1—figure supplement 6—source data 1
Multiple sequence alignment of mature PINCR transcript for Figure 1—figure supplement 6.
- https://doi.org/10.7554/eLife.23244.011
-
Figure 1—figure supplement 6—source data 2
Multiple sequence alignment of PINCR promoter for Figure 1—figure supplement 6.
- https://doi.org/10.7554/eLife.23244.012
Figure 2 with 5 supplements

Loss of PINCR impairs G1 arrest and results in increased cell death after DNA damage.
(A) qRT-PCR analysis from PINCR-WT (WT#1 and WT#2) and PINCR-KO clones (KO#1 and KO#2) untreated or treated with DOXO for 16 hr. (B, C) PINCR-WT and PINCR-KO clones were untreated or treated with DOXO for the indicated time points and cell cycle analysis was performed using Propidium iodide (PI) staining followed by flow cytometry analysis (FACS). (D) PINCR-KO cells were stably transfected with pCB6 or pCB6-PINCR and qRT-PCR was performed. (E) PINCR-KO cells stably expressing PINCR were untreated or treated with DOXO in biological duplicates at the indicated times and cell death (sub-G1 cells) was assessed by PI staining followed by FACS. (F) Immunostaining for Nucleoporin and cleaved caspase-3 from PINCR-WT and PINCR-KO clones with or without DOXO treatment for 72 hr. DNA was counterstained with DAPI. (G) PINCR-WT and PINCR-KO clones were untreated or treated with the indicated DOXO concentrations for 4 hr and colony formation assays were performed after 10 days. Error bars in A and D represent SD from three independent experiments. #p<0.01; ##p<0.001.
Figure 2—figure supplement 1
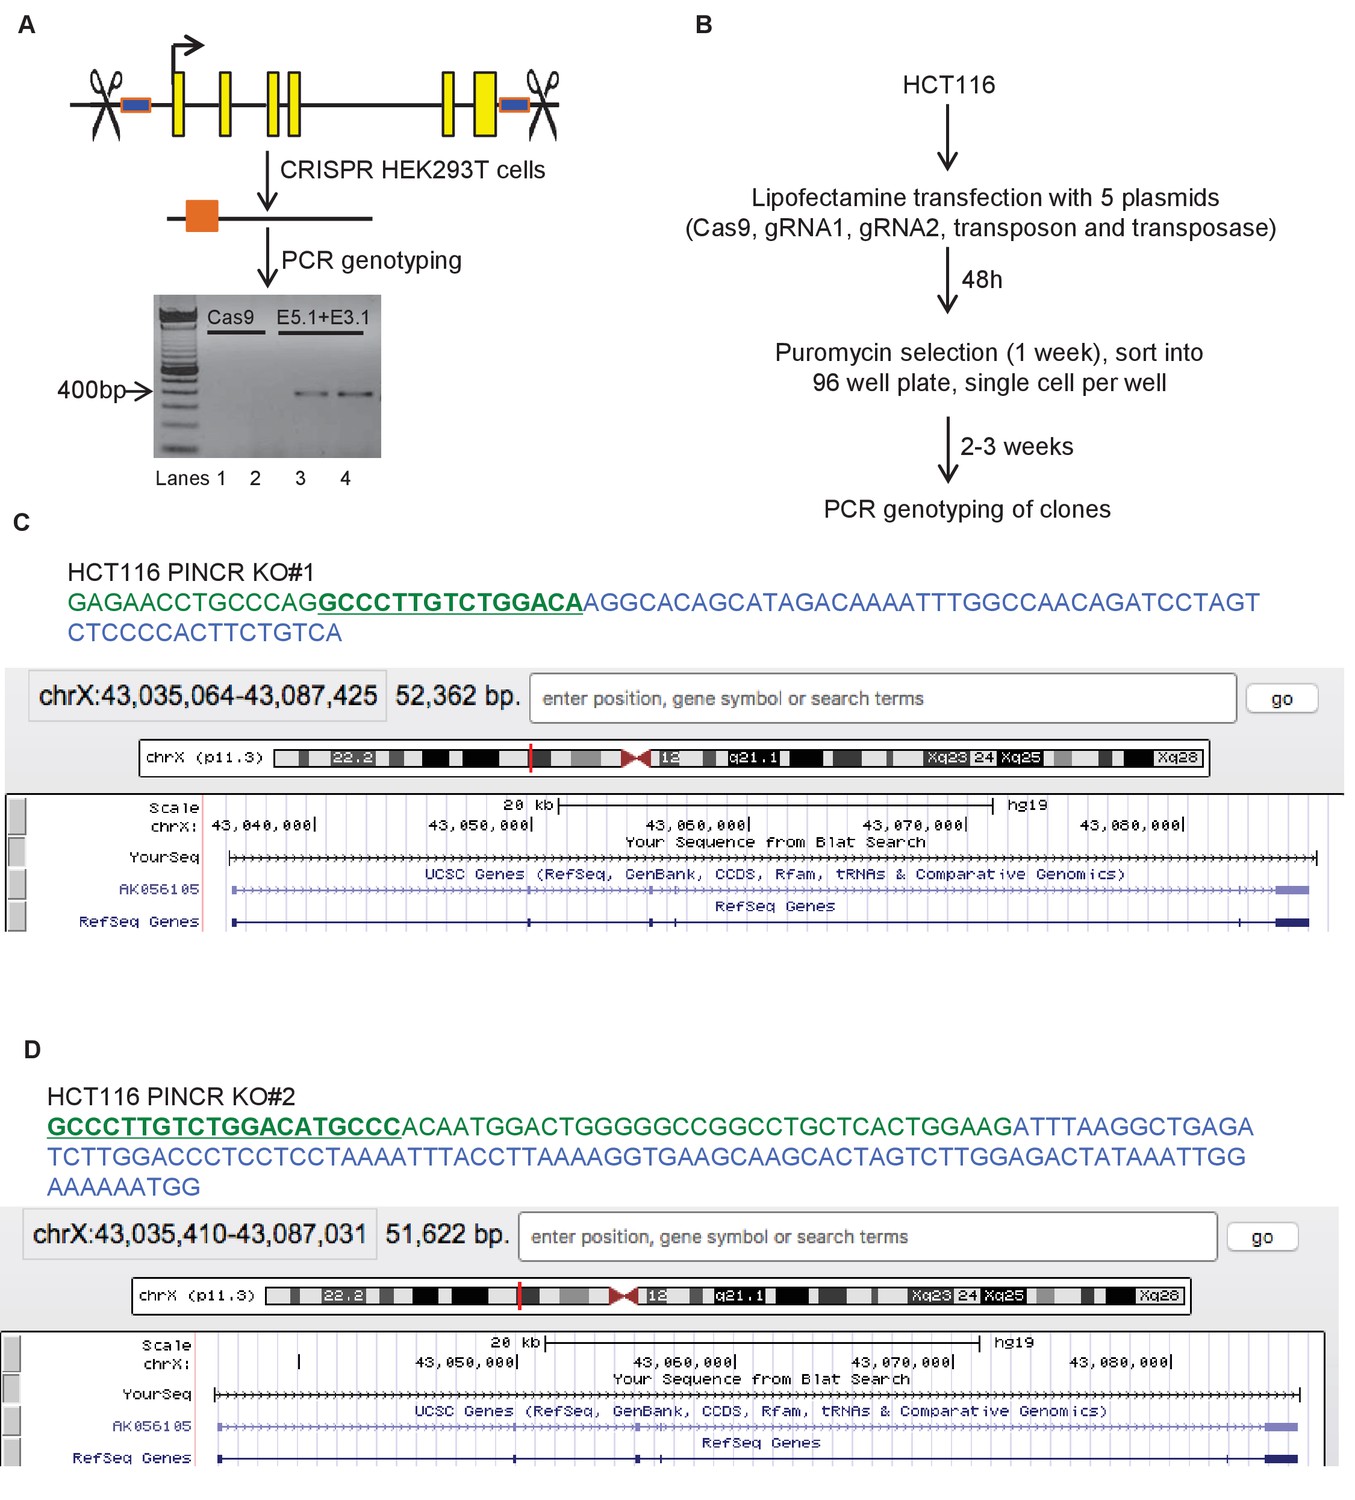
CRISPR deletion of PINCR locus.
(A) Pictorial representation of PINCR genomic locus. Yellow boxes represent annotated exons and blue boxes represent regions targeted by gRNAs (E5.1 and E3.1). HEK293T cells were transfected with Cas9 alone (Lanes 1 and 2) or Cas9 along with gRNAs E5.1 and E3.1 (Lanes 3 and 4). Deletion was confirmed by genomic PCR using PINCR-CRISPR analysis primers. (B) Schematic of generation of PINCR-KO HCT116 cells. (C, D) Partial genomic sequence of PINCR from Sanger sequencing and snap-shot of PINCR locus (using BLAT) for the PINCR-KO#1 and PINCR-KO#2 HCT116 clones is shown. The p53RE is underlined and in green font.
Figure 2—figure supplement 2
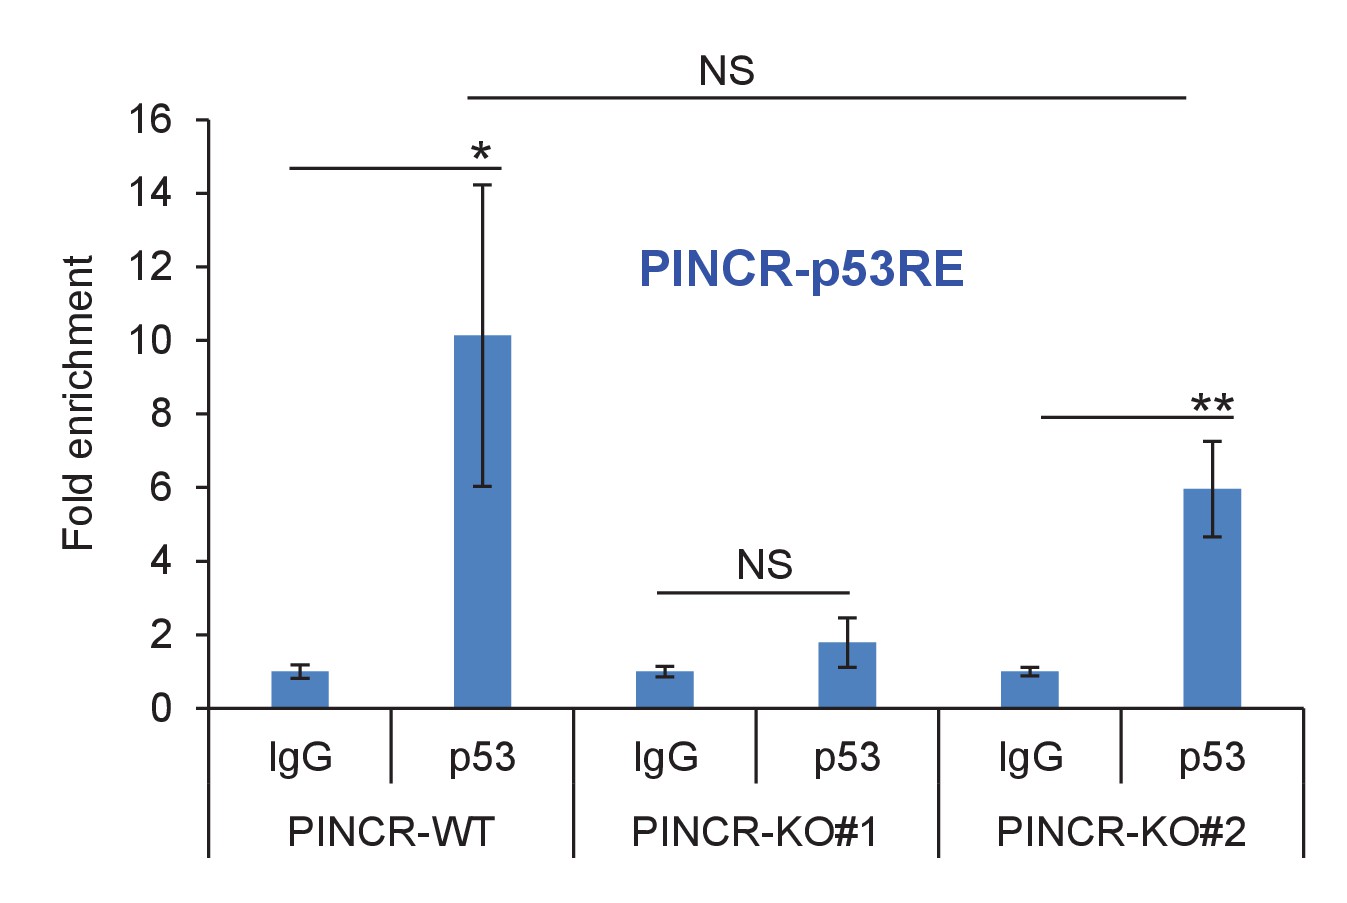
p53 binding to the p53RE of PINCR in PINCR-WT and PINCR-KO cells was assessed by ChIP-qPCR from HCT116 cells (PINCR-WT or PINCR-KO) treated with 5-FU for 24 hr.
Fold enrichment relative to IgG is shown.
Figure 2—figure supplement 3
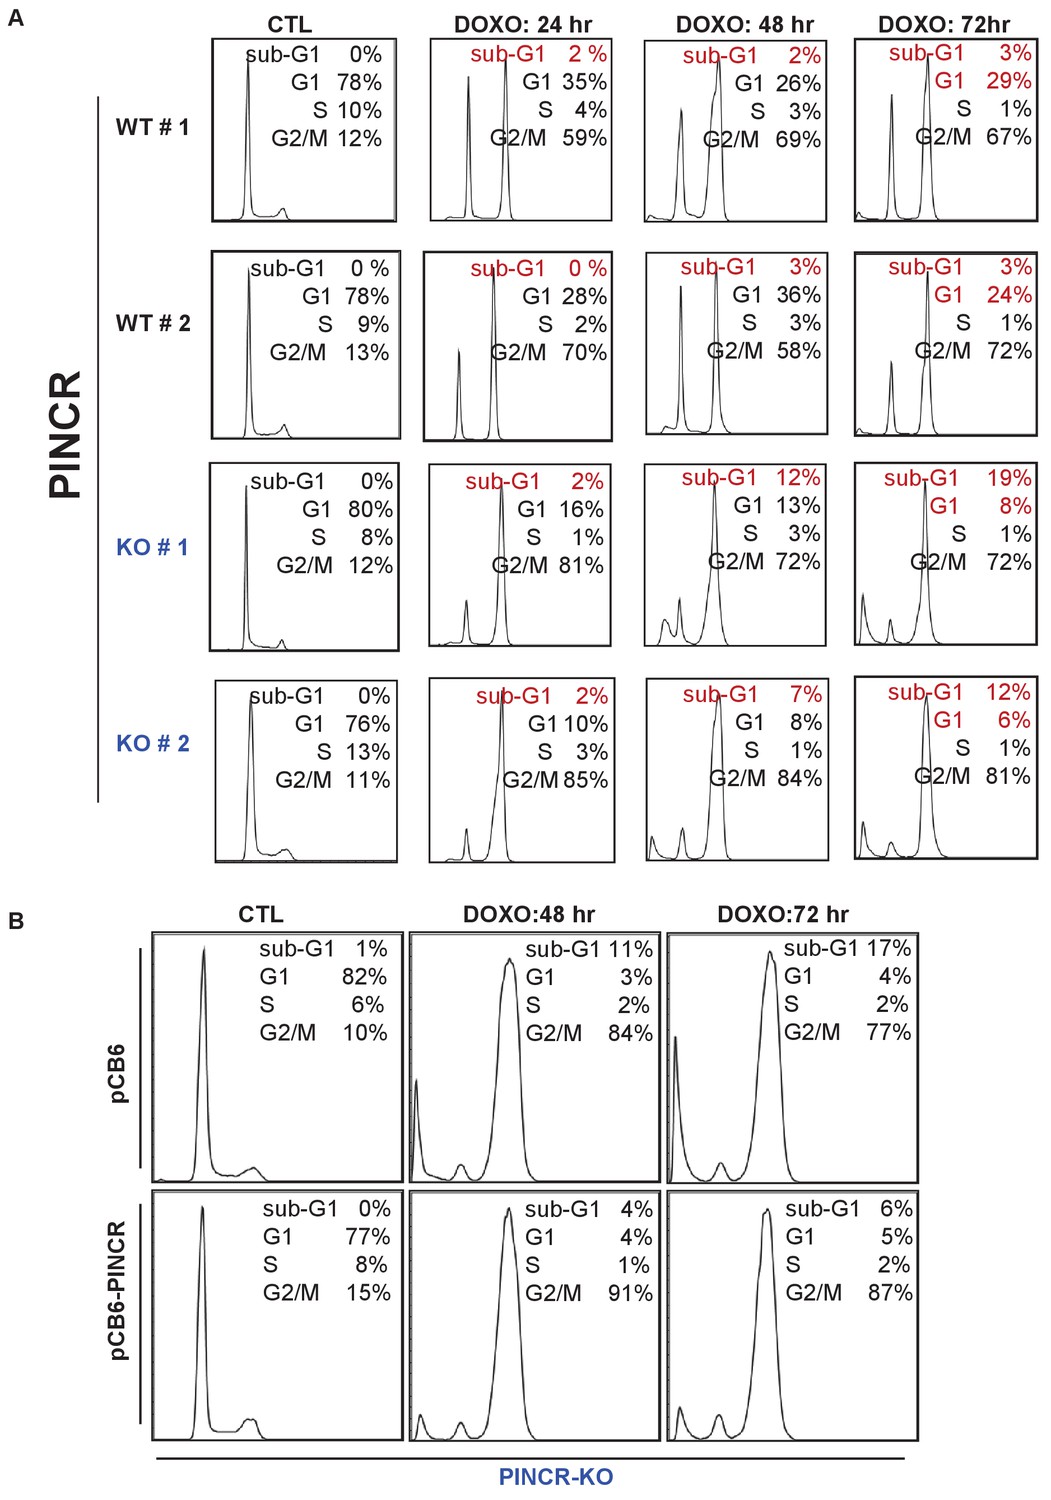
Cell cycle profiles for Figure 2.
(A) Raw cell cycle profiles corresponding to the data in Figure 2B and C are shown. (B) Raw cell cycle profiles corresponding to a representative experiment for Figure 2E are shown.
Figure 2—figure supplement 4
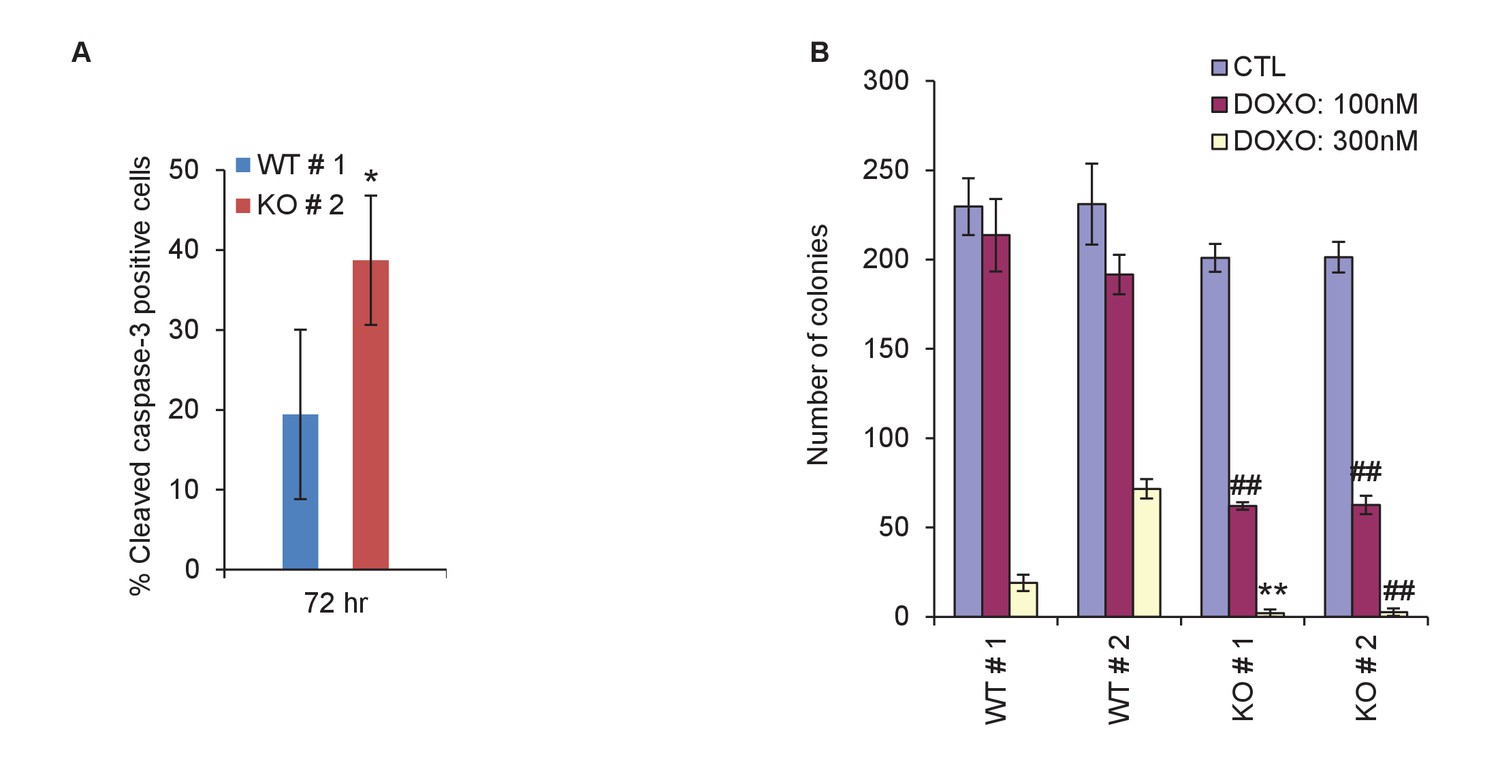
Quantitation for immunostaining and colony formation.
(A) Quantitation for Figure 2F. Percentage cleaved Caspase-3-positive cells in PINCR-WT and PINCR-KO clones after 72 hr DOXO treatment is shown. (B) Quantitation for Figure 2G. Number of colonies in PINCR-WT and PINCR-KO clones untreated or treated for 4 hr with the indicated DOXO concentrations. Error bars represent SD from three experiments. *p<0.05; **p<0.005; ##p<0.001.
Figure 2—figure supplement 5
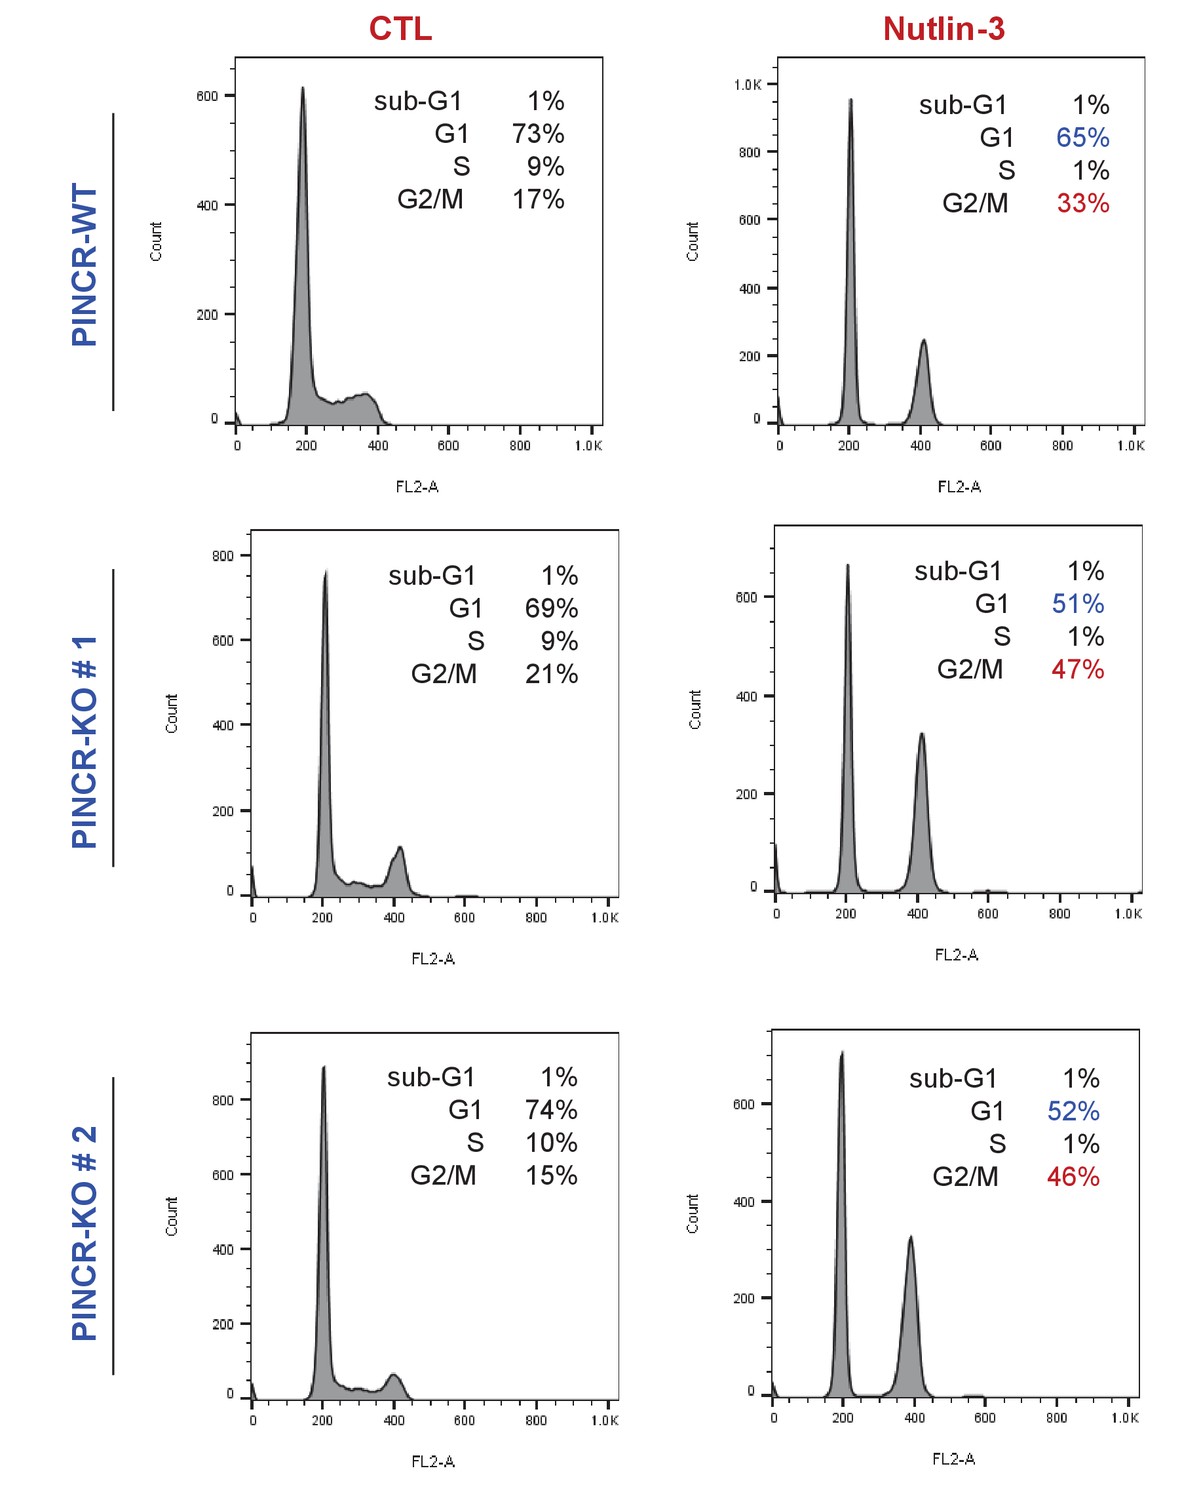
Loss of PINCR results in reduced G1 arrest after Nutlin-3 treatment.
PINCR-WT and PINCR-KO clones were untreated or treated with Nutlin-3 for 24 hr and the cell cycle profiles were examined by PI-staining and FACS analysis.
Figure 3 with 7 supplements
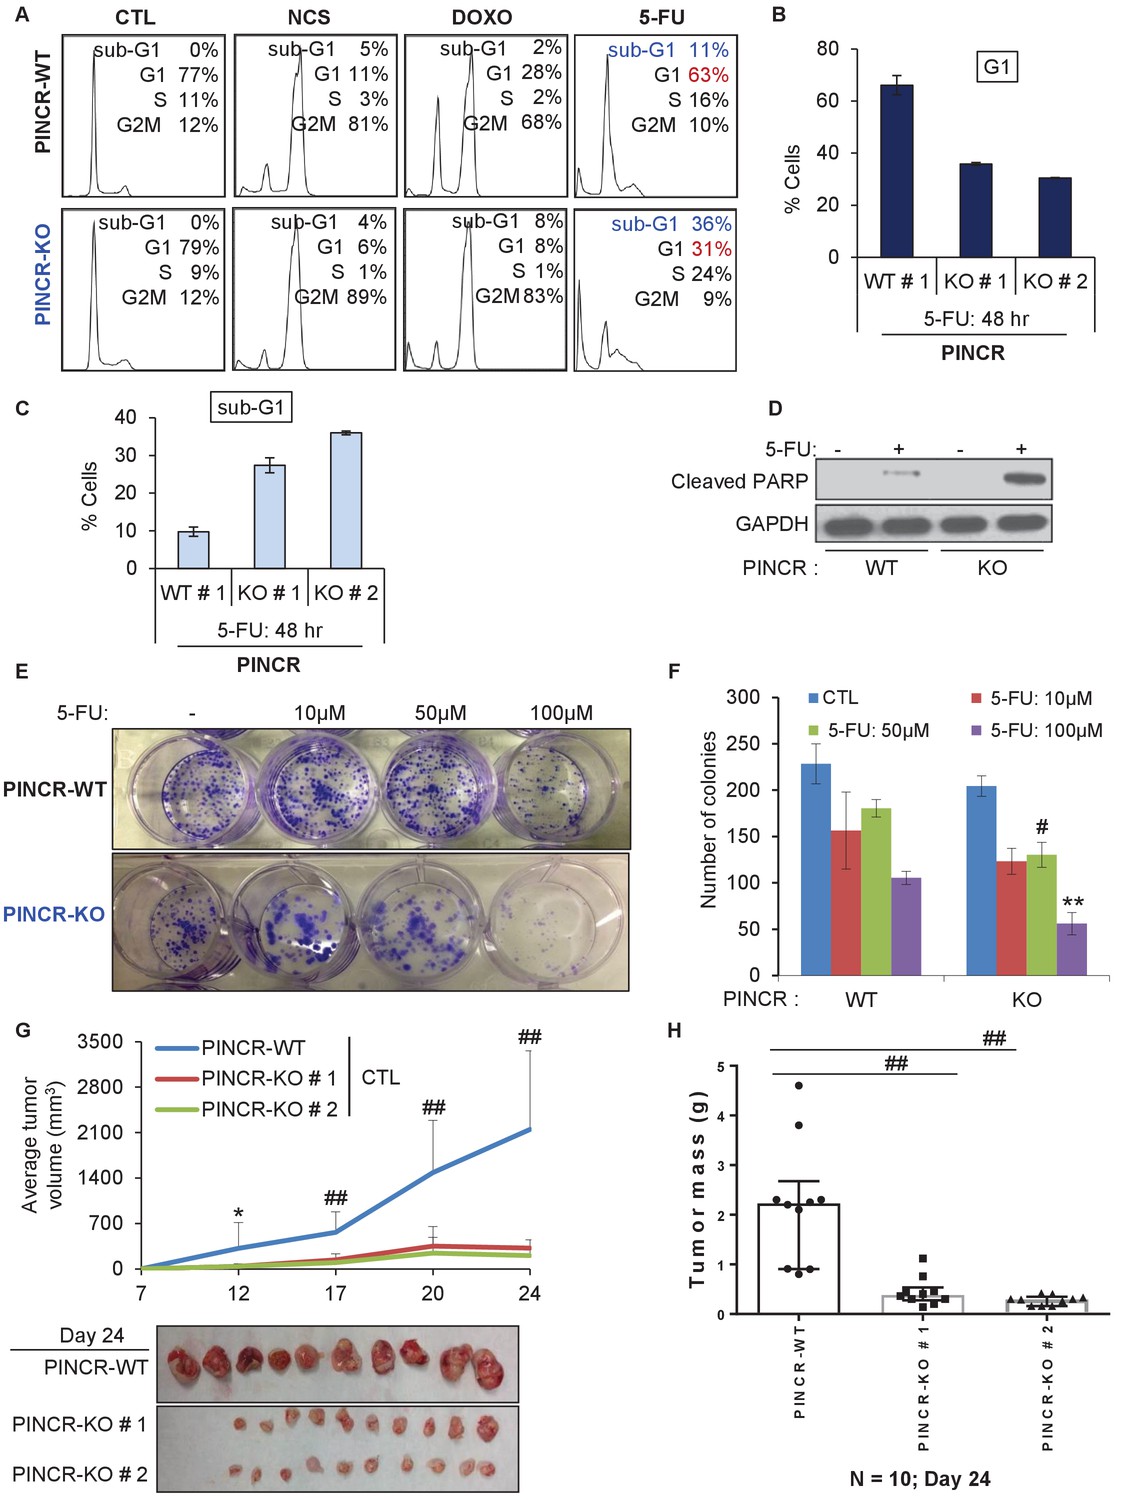
PINCR knockout cells are hypersensitive to 5-FU in vitro and poorly tumorigenic in vivo.
(A) PINCR-WT and PINCR-KO clones were untreated or treated with NCS, DOXO, 5-FU for 48 hr and PI staining followed by FACS analysis was performed. (B, C) PINCR-WT#1 and PINCR-KO (KO#1 and KO#2) clones were untreated or treated with 5-FU in biological duplicates for 48 hr and the effect on G1 arrest and cell death (sub-G1) was assessed by PI staining followed by FACS. (D) PINCR-WT and PINCR-KO cells were untreated or treated with 5-FU for 48 hr and immunoblotting for cleaved PARP and loading control GAPDH was performed. (E, F) PINCR-WT and PINCR-KO cells were untreated or treated with indicated 5-FU concentrations for 4 hr, and colony formation assays were performed after 10 days. (G, H) Untreated PINCR-WT#1 and PINCR-KO (KO#1 and KO#2) cells were injected subcutaneously into the flanks of athymic nude mice (five mice for each group, two tumors per mice). Average tumor volume (G) and tumor mass (H) are shown. Error bars in F represent SD from three experiments. Tumor mass data in H is shown as median +/- interquartile range and p-values were calculated using the Krusal-Wallis test. *p<0.05; #p<0.01; **p<0.005; ##p<0.001.
-
Figure 3—source data 1
Cleaved PARP immunoblot for Figure 3D.
- https://doi.org/10.7554/eLife.23244.020
Figure 3—figure supplement 1
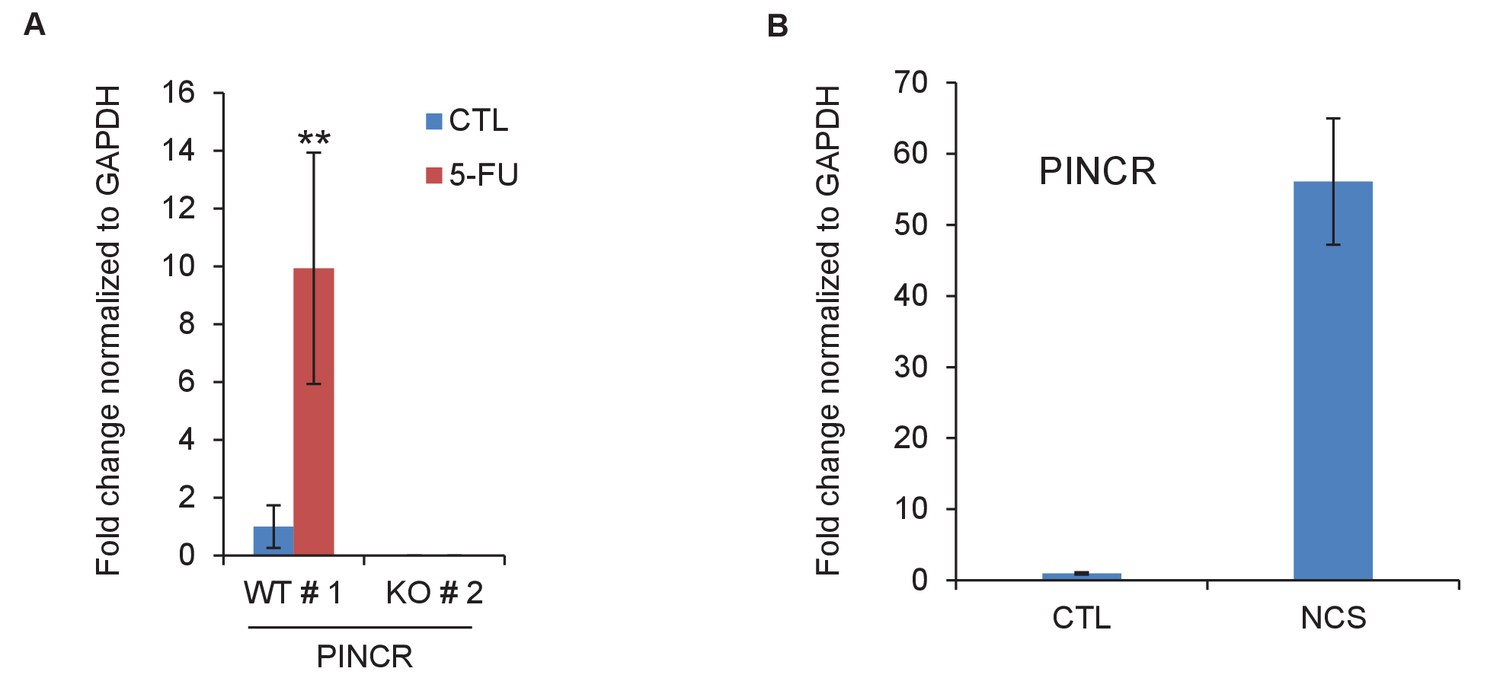
PINCR is induced by 5-FU or NCS.
(A) qRT-PCR analysis from PINCR-WT and PINCR-KO cells untreated or treated with 5-FU for 24 hr. (B) qRT-PCR for PINCR from HCT116 cells untreated or treated with NCS for 24 hr. Error bars represent SD from three biological replicates. **p<0.005.
Figure 3—figure supplement 2
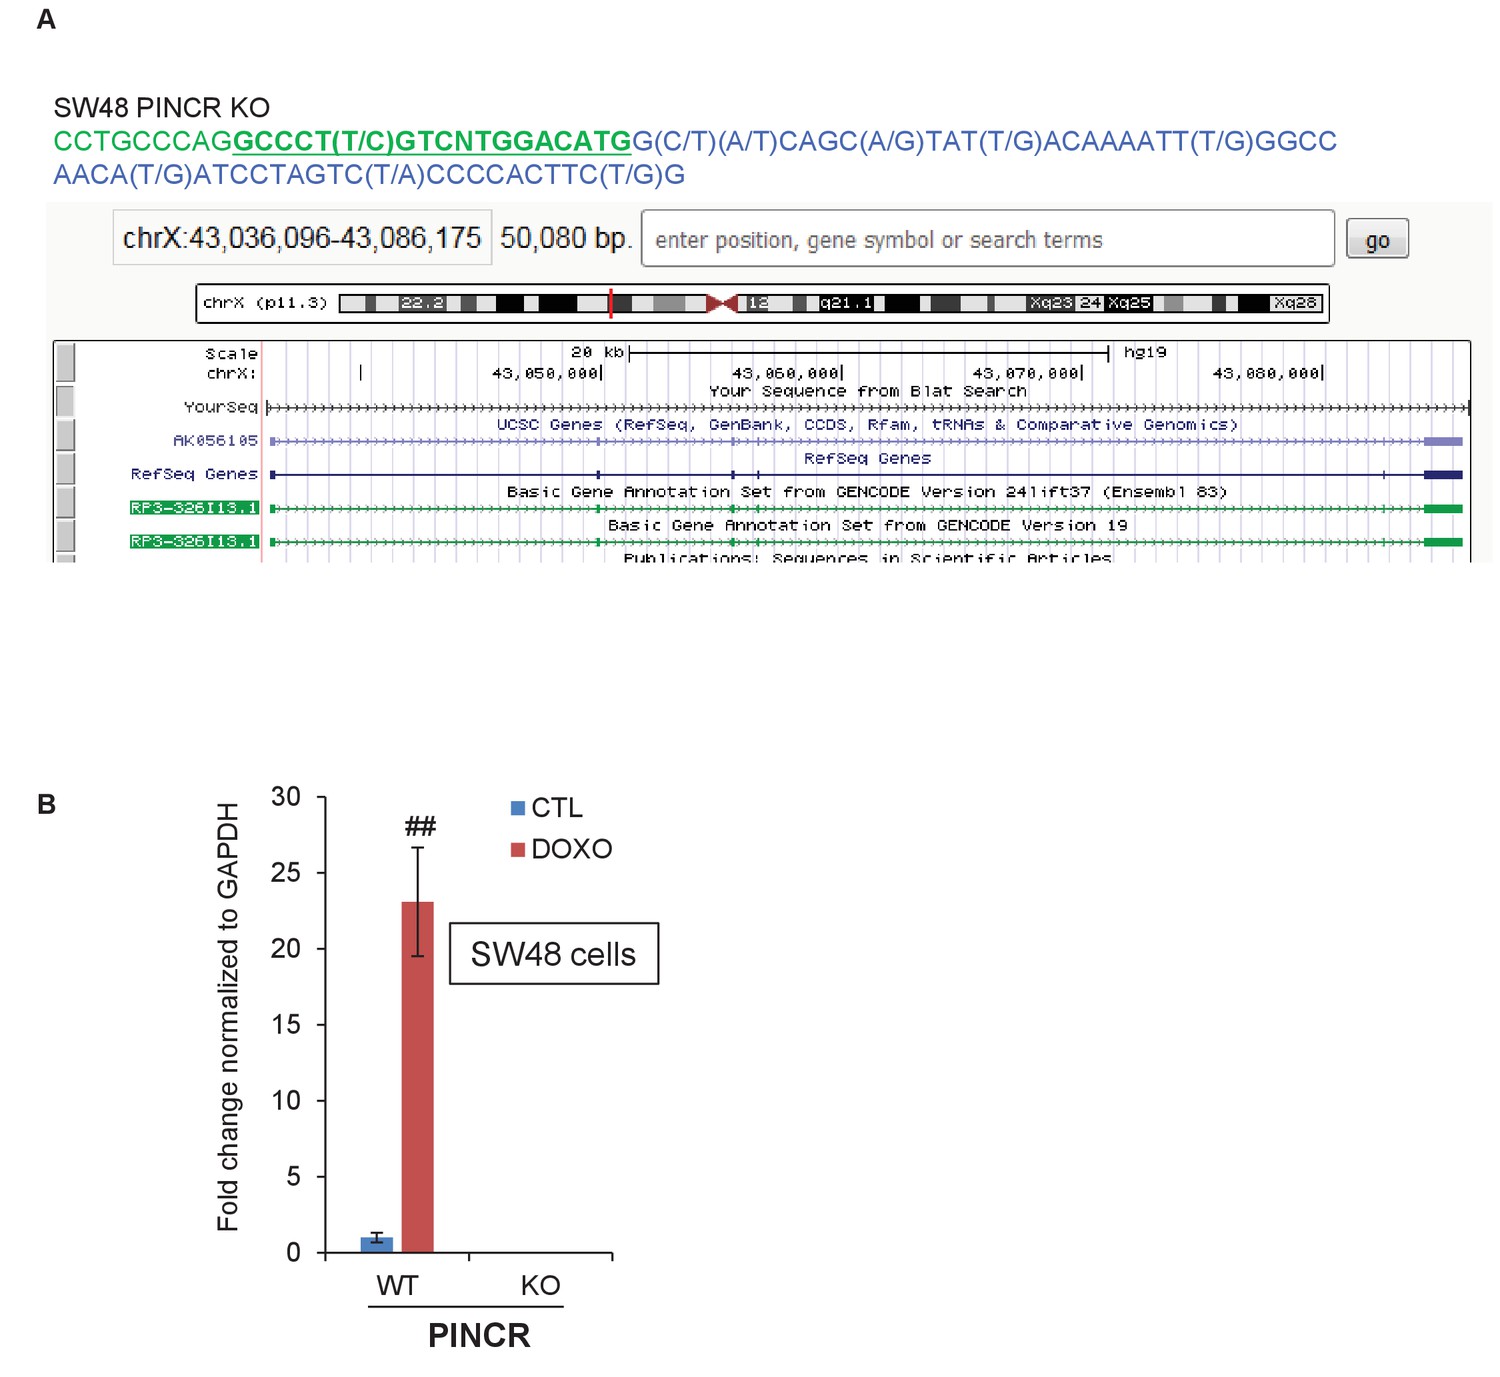
CRISPR knockout of PINCR in SW48 cells.
(A) Partial genomic sequence of PINCR from Sanger sequencing and snap-shot of PINCR locus (using BLAT) for the PINCR-KO SW48 clone is shown. The p53RE is underlined and in green font. (B) qRT-PCR analysis from PINCR-WT and PINCR-KO SW48 cells untreated or treated with 5-FU for 24 hr. Error bars represent SD from three experiments. ##p<0.001.
Figure 3—figure supplement 3
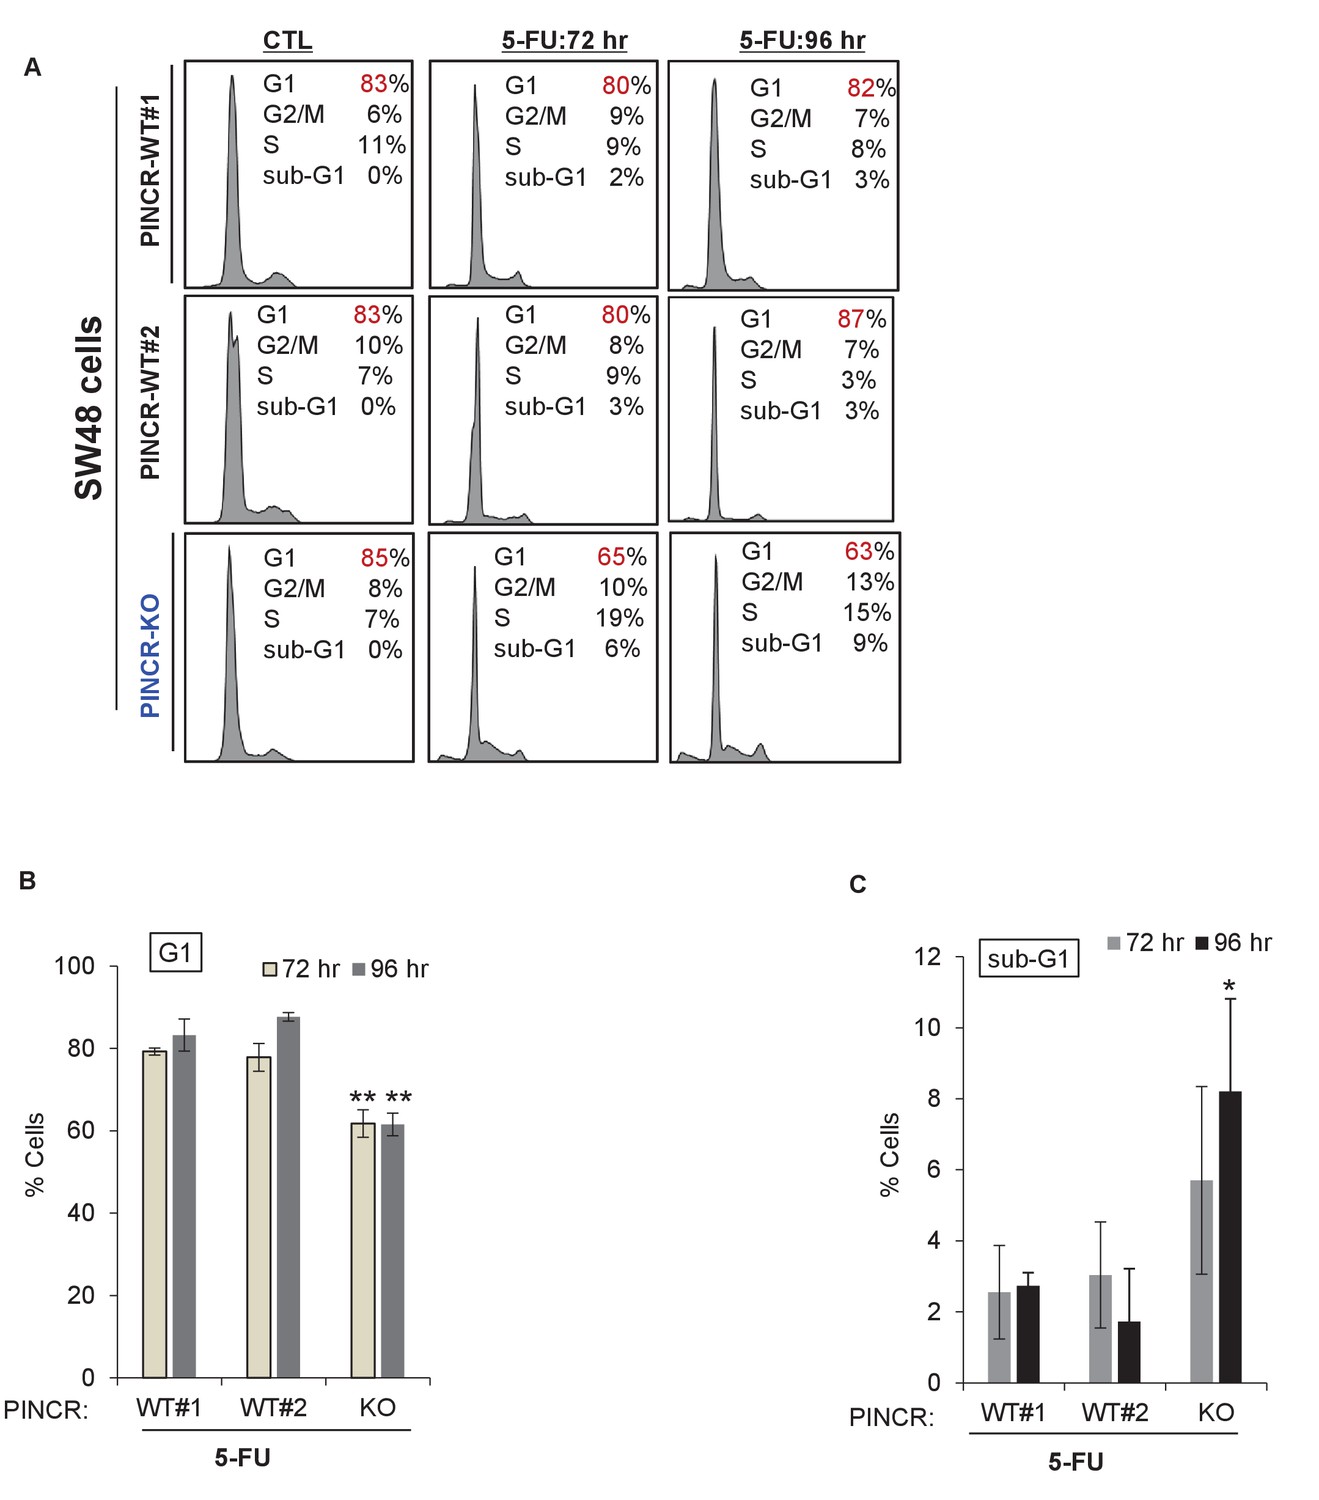
Cell cycle profiles for PINCR-WT and PINCR-KO SW48 cells.
PINCR-WT and PINCR-KO SW48 cells were untreated or treated with 5-FU for 72 hr or 96 hr and the effect on cell cycle and apoptosis was determined by PI-staining and FACS analysis. Raw cell cycle profiles from a representative experiment are shown in (A) and the results from three independent experiments are shown in (B,C). Error bars represent SD from three experiments. *p<0.05; **p<0.005.
Figure 3—figure supplement 4
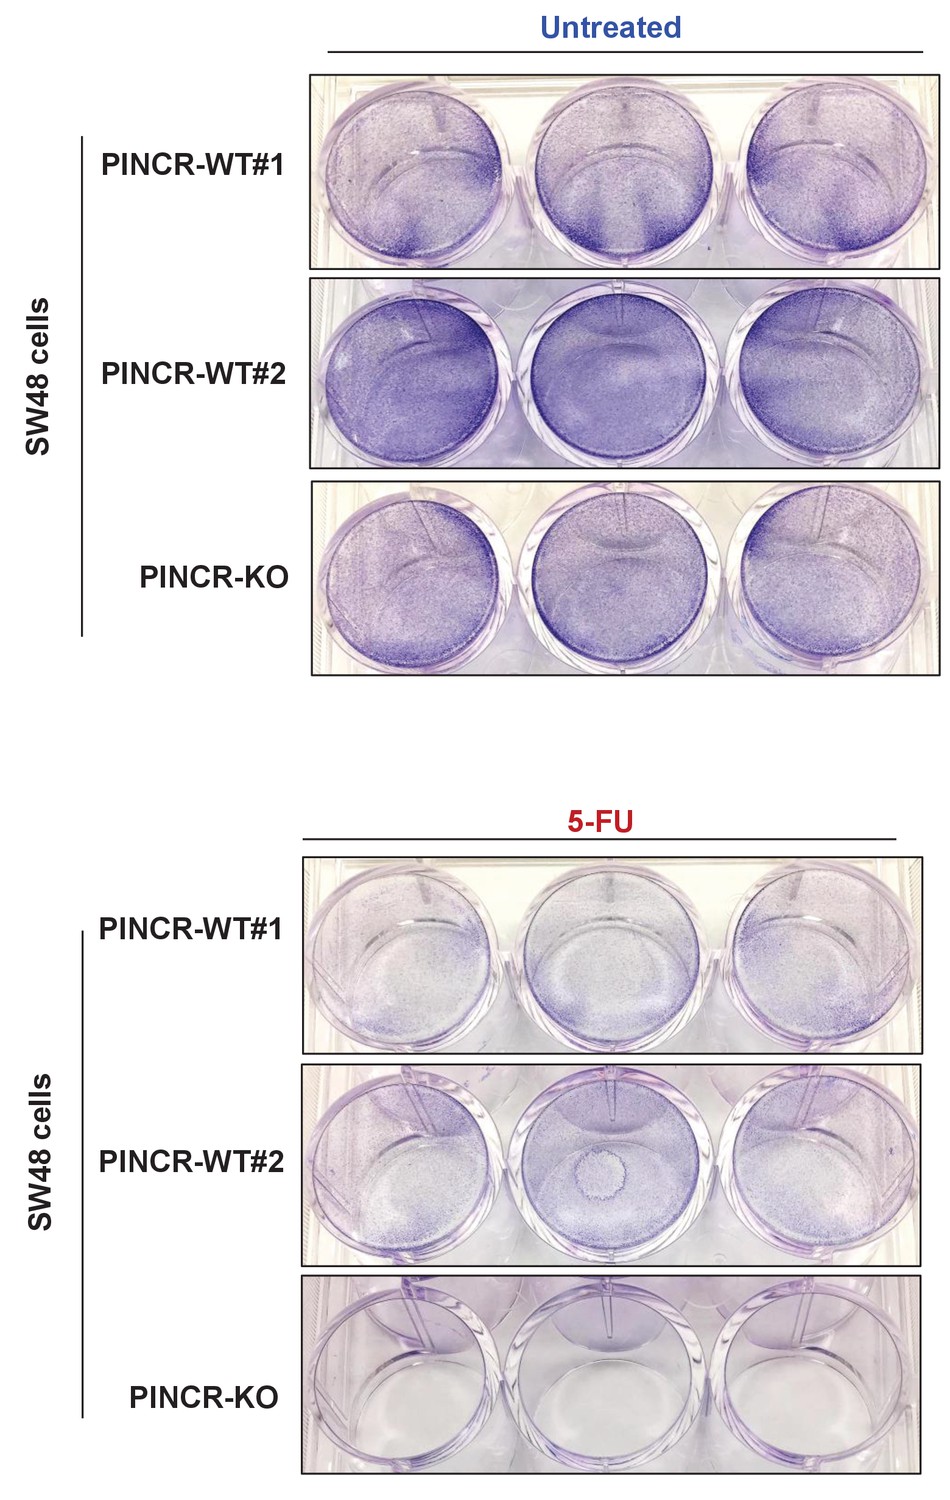
Long term proliferation for PINCR-WT and PINCR-KO SW48 cells.
PINCR-WT and PINCR-KO SW48 cells were untreated or treated with 5-FU. After 7 days, the effect on long-term of these cells was assessed by staining the cells with crystal violet.
Figure 3—figure supplement 5
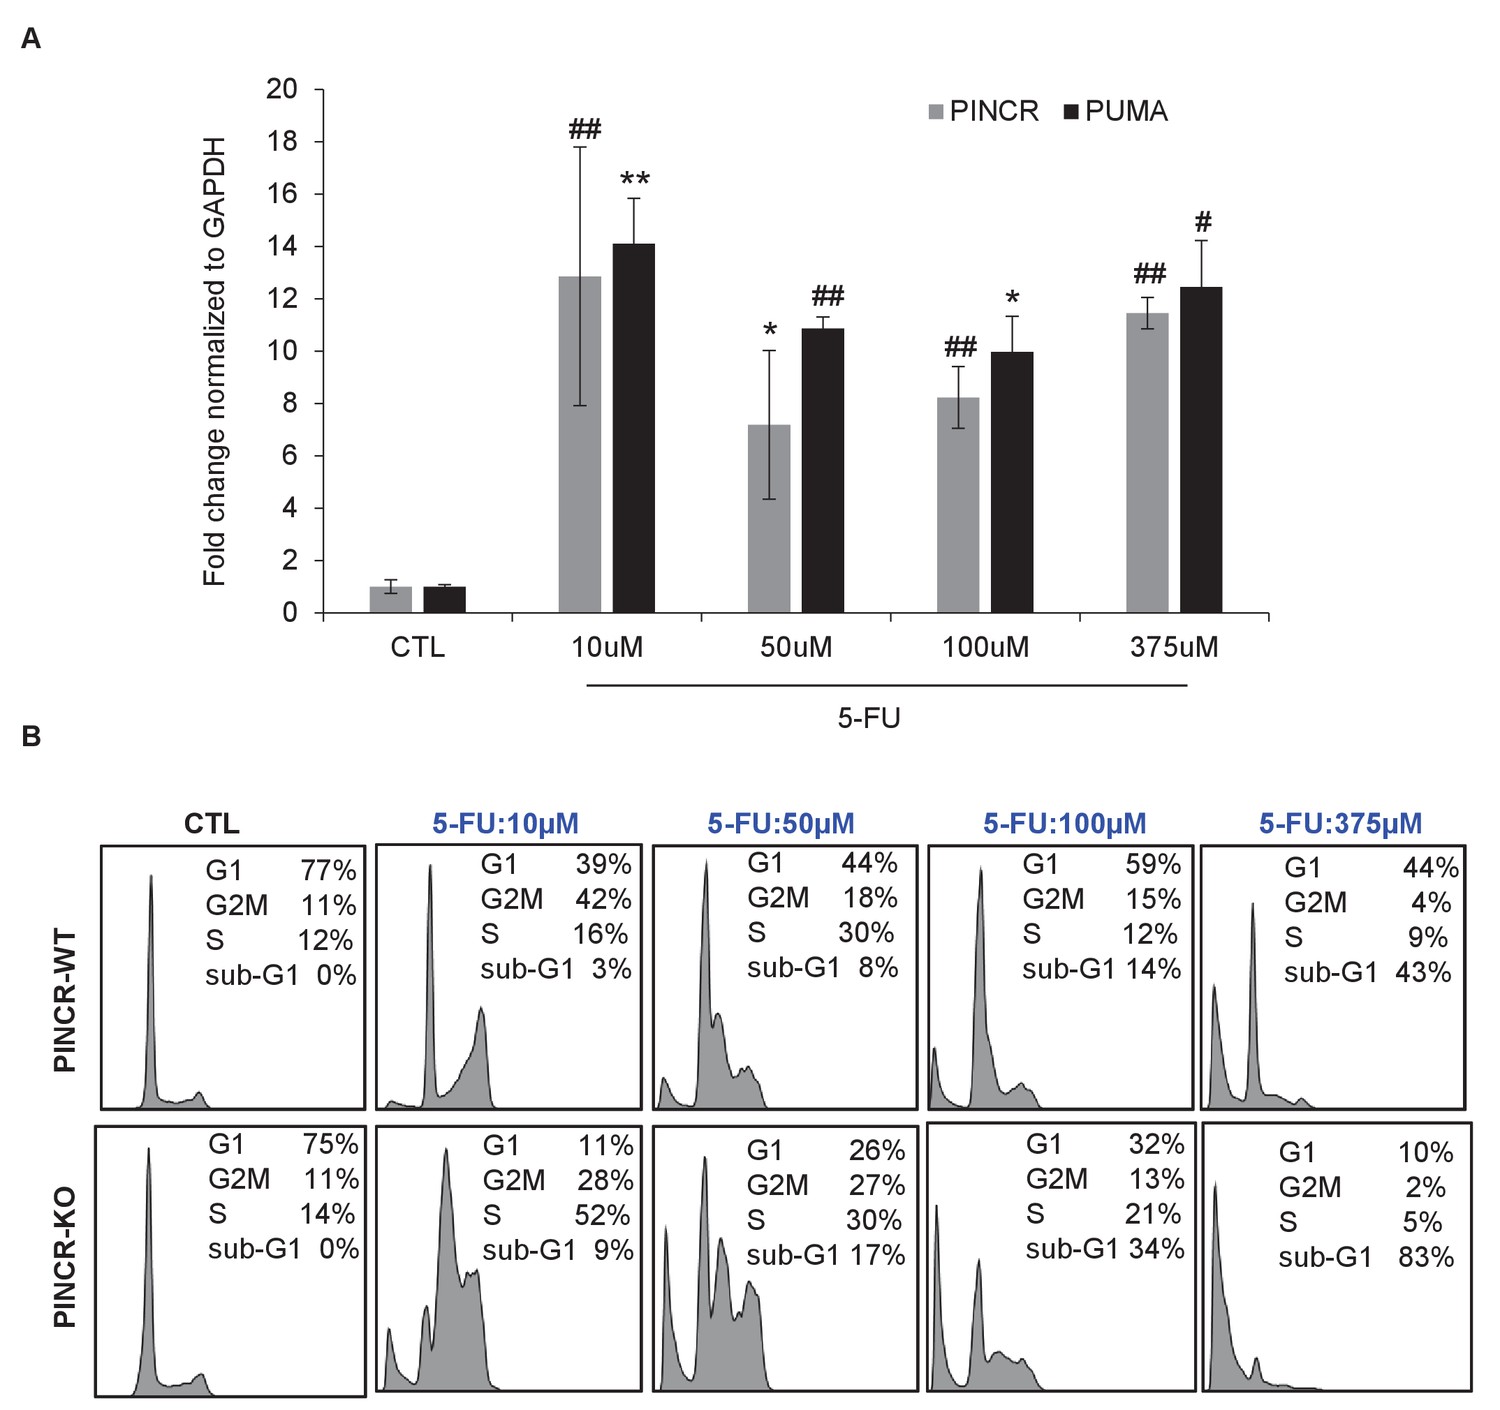
Effect of different doses of 5-FU on PINCR levels and cell survival.
(A) qRT-PCR analysis from HCT116 cells untreated or treated for 24 hr with different doses of 5-FU. (B) HCT116 PINCR-WT and PINCR-KO cells were untreated or treated for 48 hr with different doses of 5-FU and cell cycle profiles were examined by PI-staining and FACS analysis. Error bars represent SD from three experiments. *p<0.05; #p<0.01; **p<0.005; ##p<0.001.
Figure 3—figure supplement 6
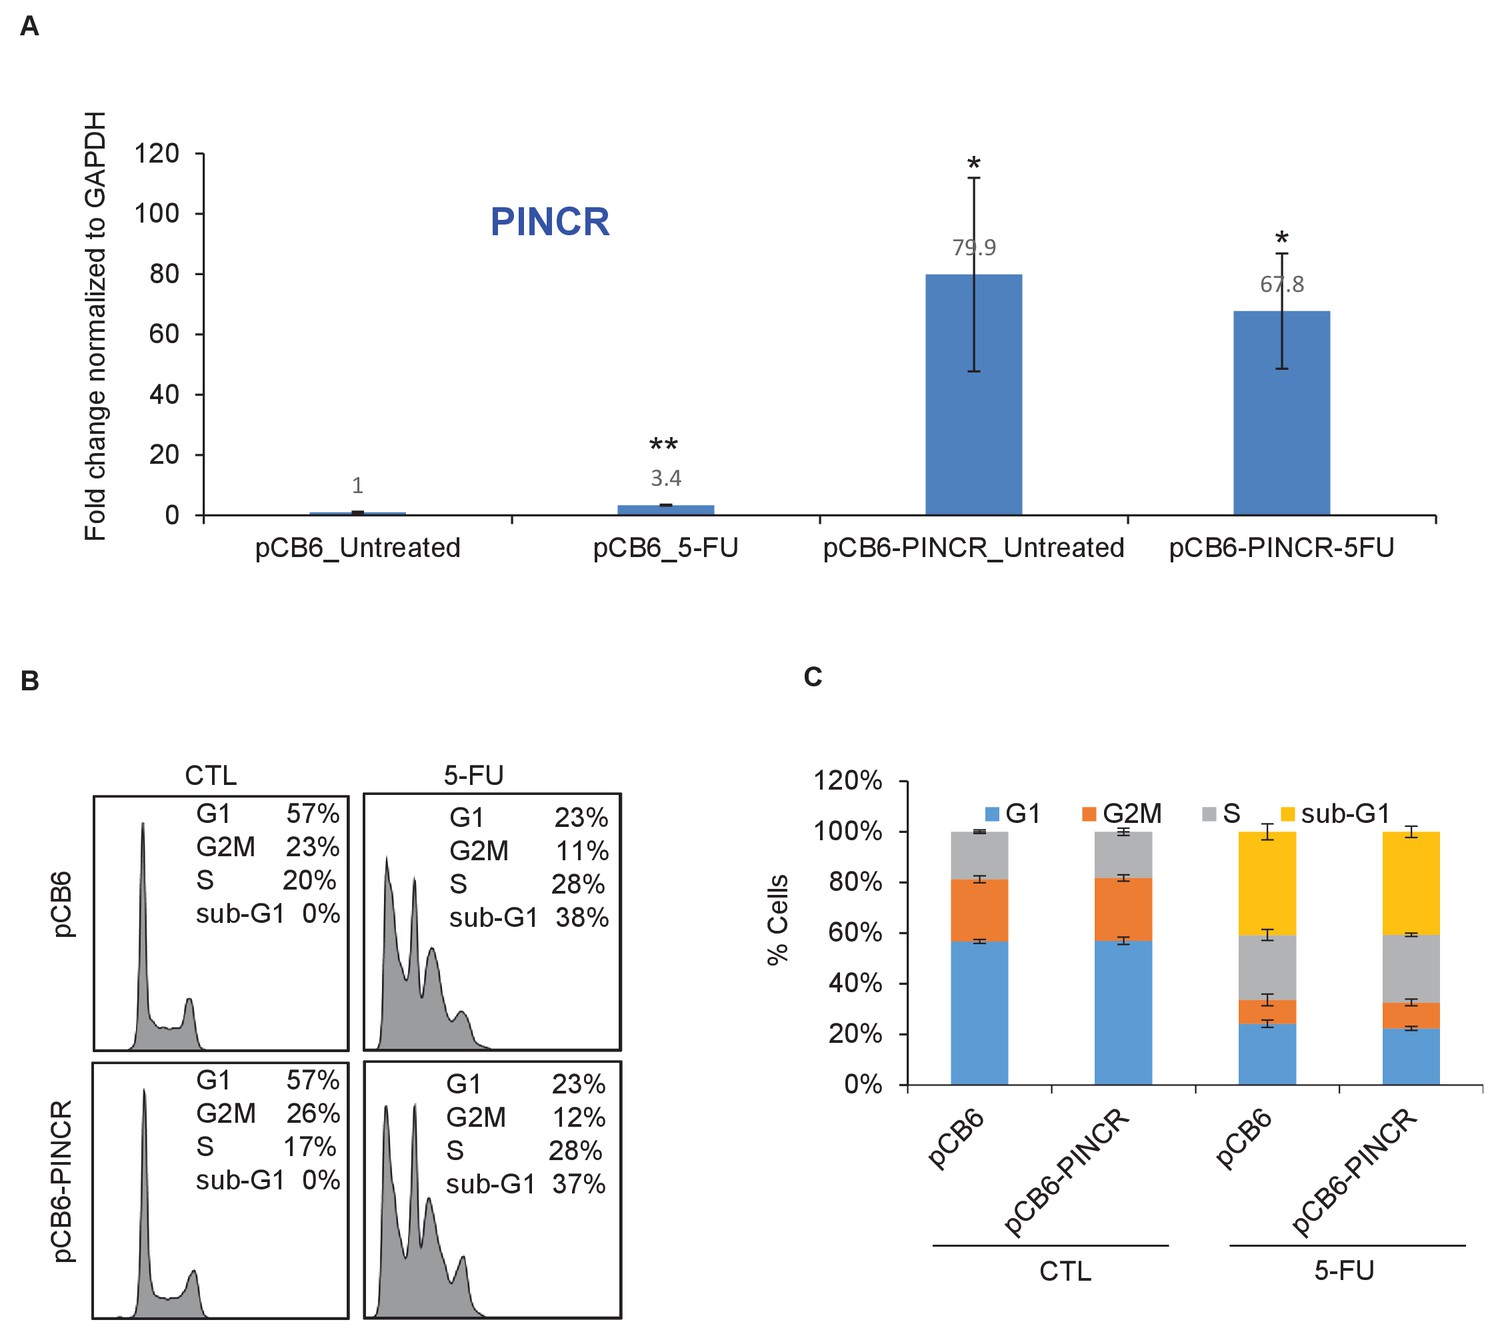
Over-expression of PINCR has no significant effect on cell cycle.
HCT116 cells were transfected with pCB6 or pCB6-PINCR for 24 hr and then left untreated cells or treated with 5-FU for 48 hr. PINCR levels were measured by qRT-PCR (A) and the effect on cell cycle was determined by PI-staining and FACS analysis (B, C). Raw cell cycle profiles from a representative experiment are shown in (B). Cell cycle profiles from three independent experiments are shown in (C). Error bars represent SD from three experiments. *p<0.05; **p<0.005.
Figure 3—figure supplement 7

Immunohistochemical analysis from PINCR-WT and PINCR-KO cells.
Immunohistochemical staining of the PINCR-WT and PINCR-KO tumors for the proliferation marker Ki67 (A), apoptosis marker Cleaved Caspase-3 (B) and H and E staining (C). Arrows indicate Ki67 (A) or Cleaved Caspase-3 (B) positive cells. Error bars represent SD from four biological replicates. ##p<0.001.
-
Figure 3—figure supplement 7—source data 1
Ki67 staining images of PINCR-WT and PINCR-KO tumors for Figure 3—figure supplement 7A.
- https://doi.org/10.7554/eLife.23244.028
Figure 4 with 6 supplements

PINCR regulates the induction of select p53 target genes important for G1 arrest after DNA damage.
(A) Schematic representation of a subset of p53 target genes upregulated after 5-FU treatment in a PINCR-dependent or PINCR-independent manner. (B) qRT-PCR analysis from PINCR-WT and PINCR-KO cells untreated or treated with 5-FU for 24 hr. (C) PINCR-WT and PINCR-KO cells were treated with 5-FU for 24 hr and qPCR for the p53RE of BTG2, RRM2B and GPX1 was performed from IgG-ChIP and p53-ChIP. (D–F) HCT116 cells were reverse transfected with CTL-ASO or PINCR-ASO for 48 hr. The cells were then left untreated or treated with 5-FU for 24 hr (D) or 48 hr (E, F) following which qRT-PCR analysis (D), PI staining and FACS analysis was performed (E, F). Error bars in B-F represent SD from three independent experiments. *p<0.05; #p<0.01; **p<0.005; ##p<0.001.
Figure 4—figure supplement 1

Loss of PINCR results in impaired induction of a subset of p53 targets without altering induction of p53 levels.
(A) Gene set enrichment analysis (GSEA) for the genes upregulated in the microarrays performed in biological triplicates from untreated or 5-FU-treated PINCR-WT and PINCR-KO cells. (B) PINCR-WT and PINCR-KO cells were untreated or treated with 5-FU for 24 hr and immunoblotting for p53 and loading control GAPDH was performed.
-
Figure 4—figure supplement 1—source data 1
p53 immunoblot for Figure 4—figure supplement 1B.
- https://doi.org/10.7554/eLife.23244.031
Figure 4—figure supplement 2
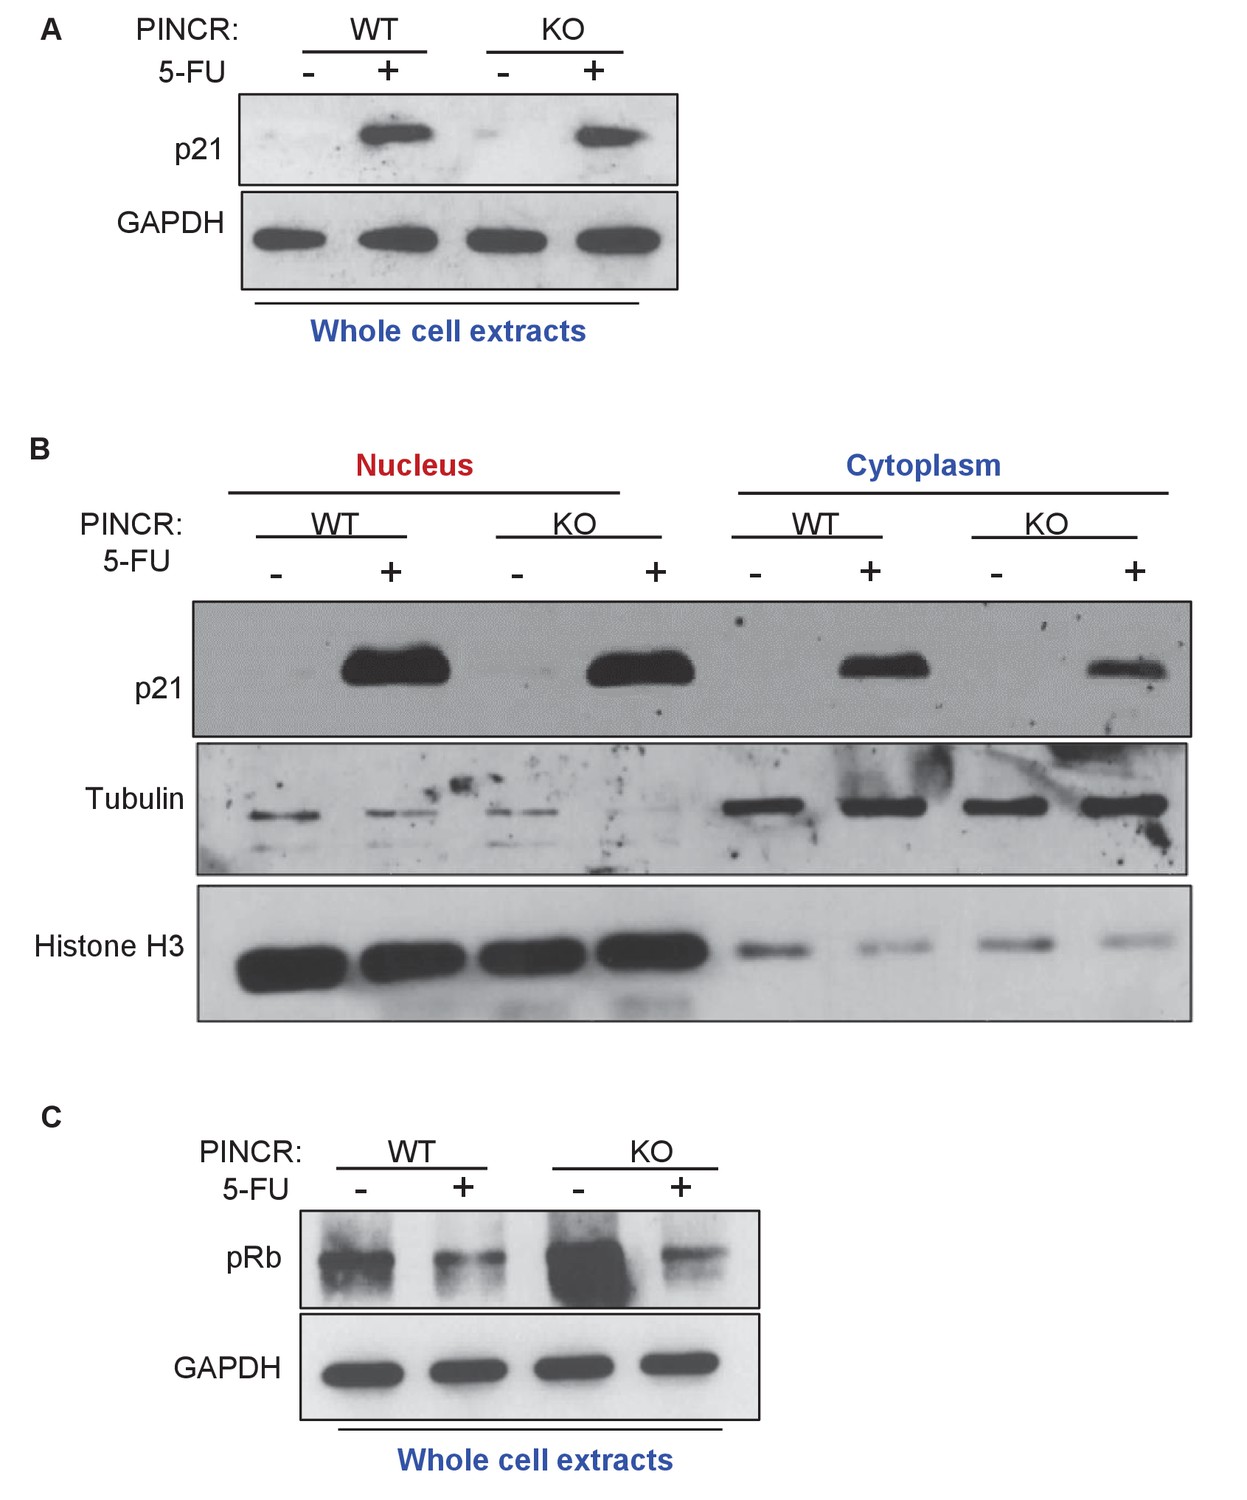
Loss of PINCR does not markedly alter total p21 protein levels, Rb phosphorylation or subcellular localization of p21.
Immunoblotting was performed for p21 (A) and phospho-Rb (pRb) (C) from whole cell extracts prepared from PINCR-WT and PINCR-KO HCT116 untreated or treated with 5-FU for 24 hr. GAPDH was used as loading control. (B) The effect of loss of PINCR on subcellular localization of p21 was determined by immunoblotting from nuclear and cytoplasmic extracts prepared from PINCR-WT and PINCR-KO HCT116 untreated or treated with 5-FU for 24 hr. Tubulin was used as cytoplasmic marker and Histone H3 was used as nuclear marker.
-
Figure 4—figure supplement 2—source data 1
p21 and phospho Rb immunoblots for Figure 4—figure supplement 2A, B and C.
- https://doi.org/10.7554/eLife.23244.033
Figure 4—figure supplement 3
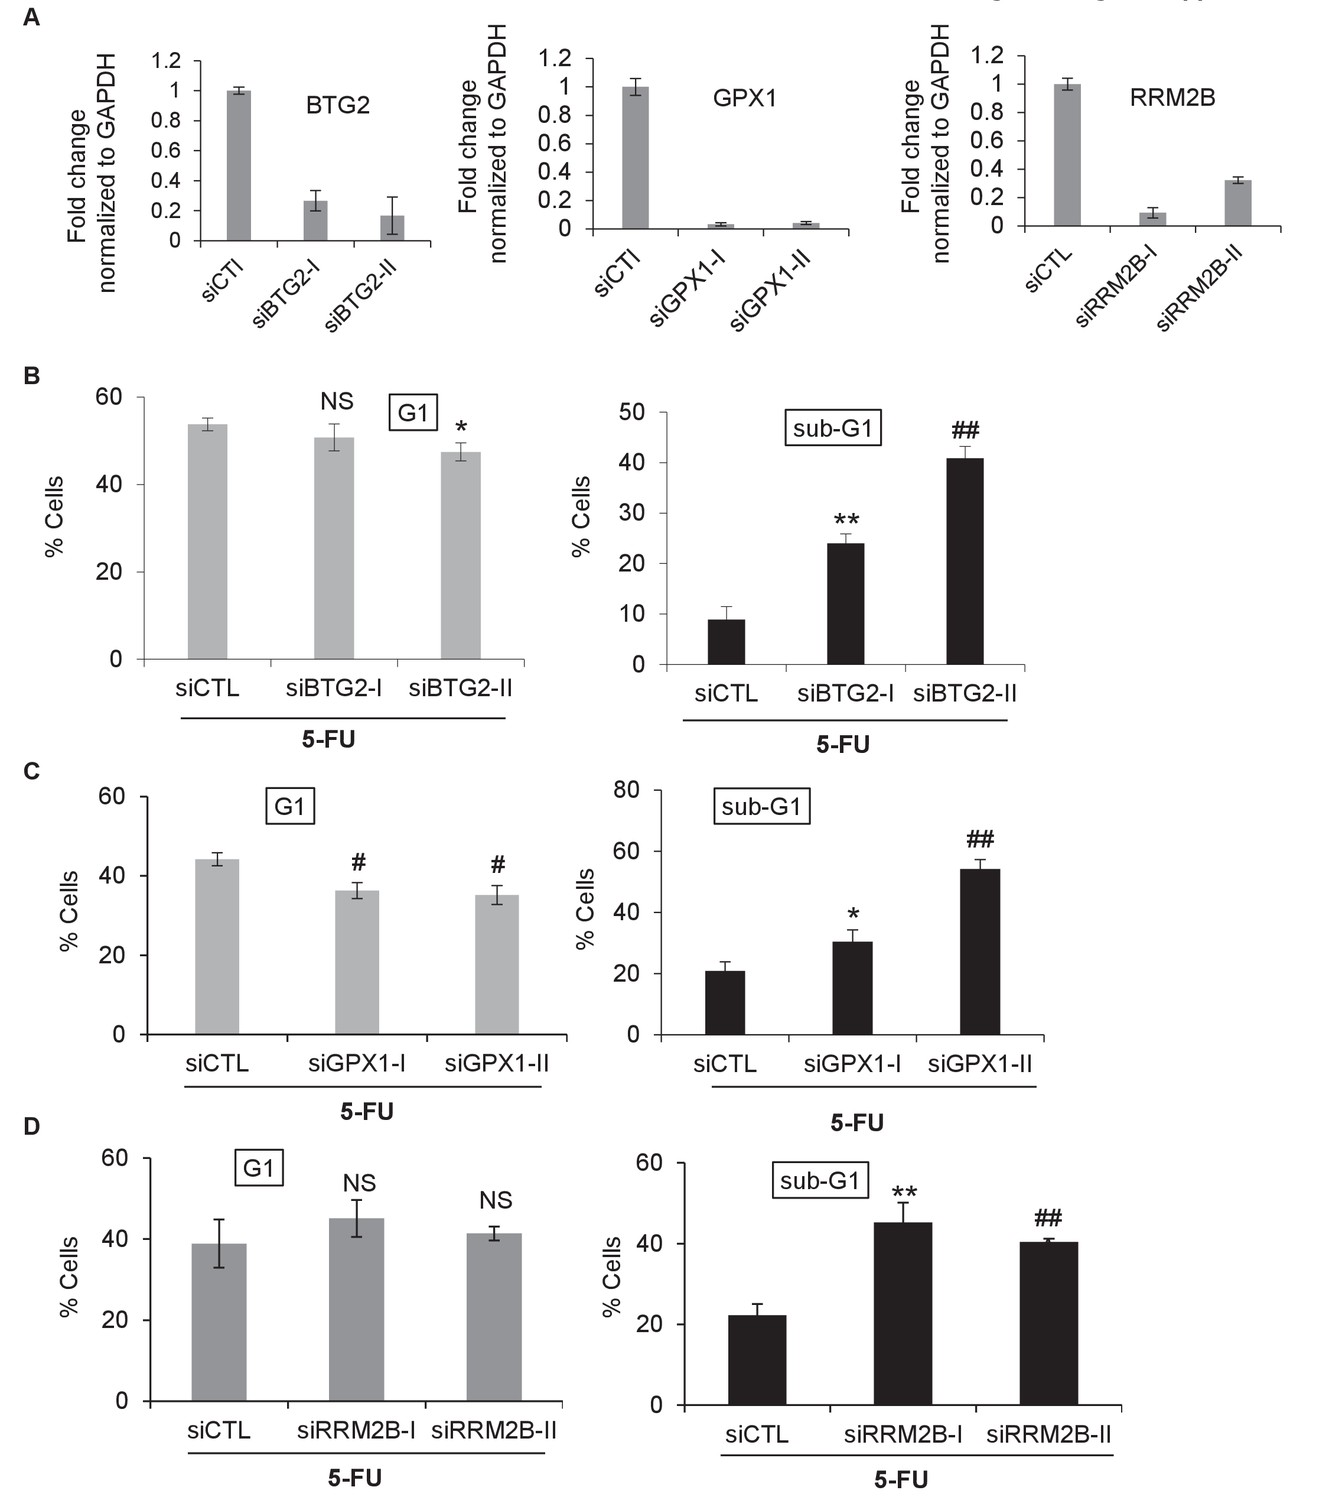
Knockdown of the PINCR targets BTG2, GPX1 or RRM2B phenocopies the effect of PINCR loss.
(A) qRT-PCR analysis from PINCR-WT HCT116 cells transfected for 48 hr with control siRNA (siCTL) or two independent siRNAs (I and II) against BTG2, GPX1 or RRM2B. PI-staining and FACS analysis was performed from PINCR-WT HC116 cells (treated with 5-FU for 48 hr) after knockdown of BTG2, GPX1 or RRM2B. Error bars represent SD from three biological replicates. *p<0.05; #p<0.01; **p<0.005; ##p<0.001.
Figure 4—figure supplement 4
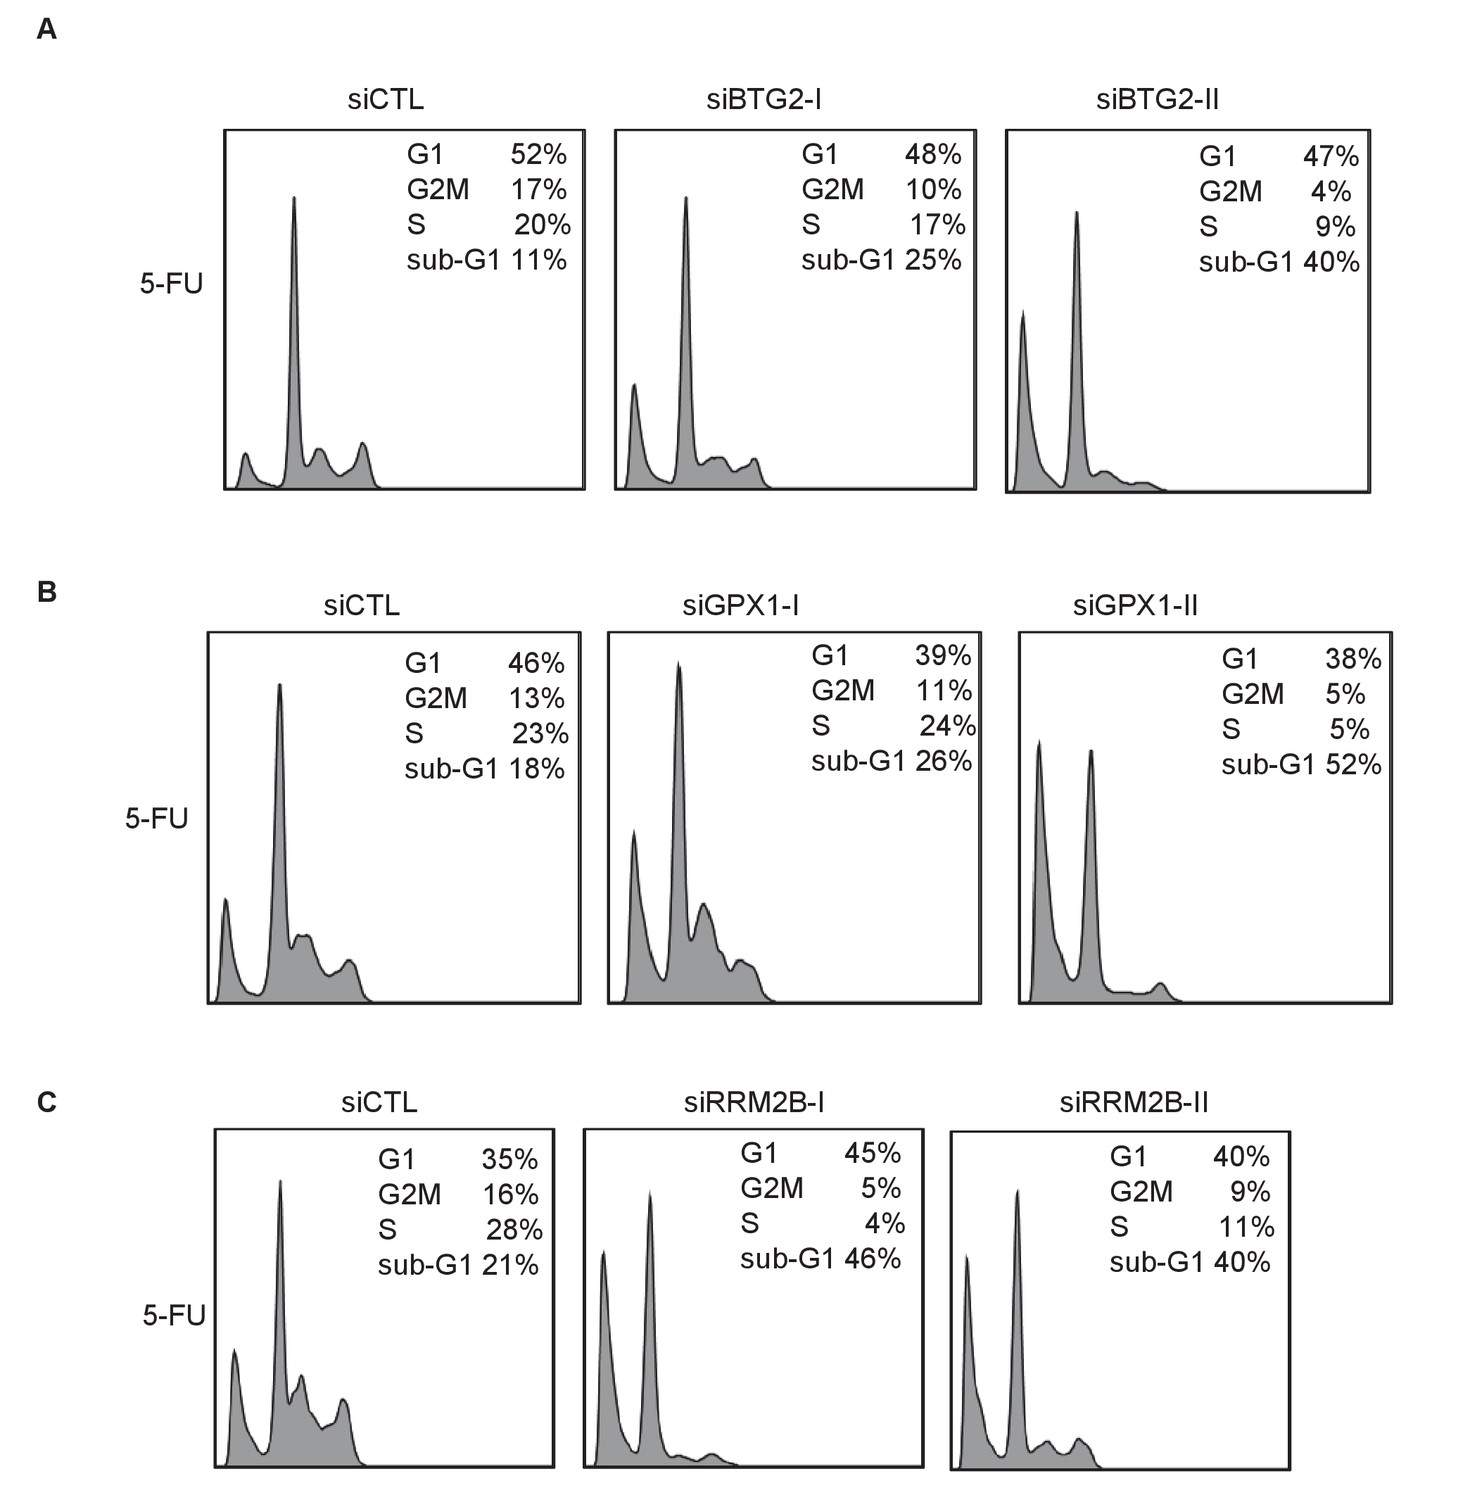
Raw cell cycle profiles showing that knockdown of the PINCR targets BTG2, GPX1 or RRM2B phenocopies the effect of PINCR loss.
Raw cell cycle profiles from the PI-staining and FACS analysis of Figure 4—figure supplement 4 are shown.
Figure 4—figure supplement 5
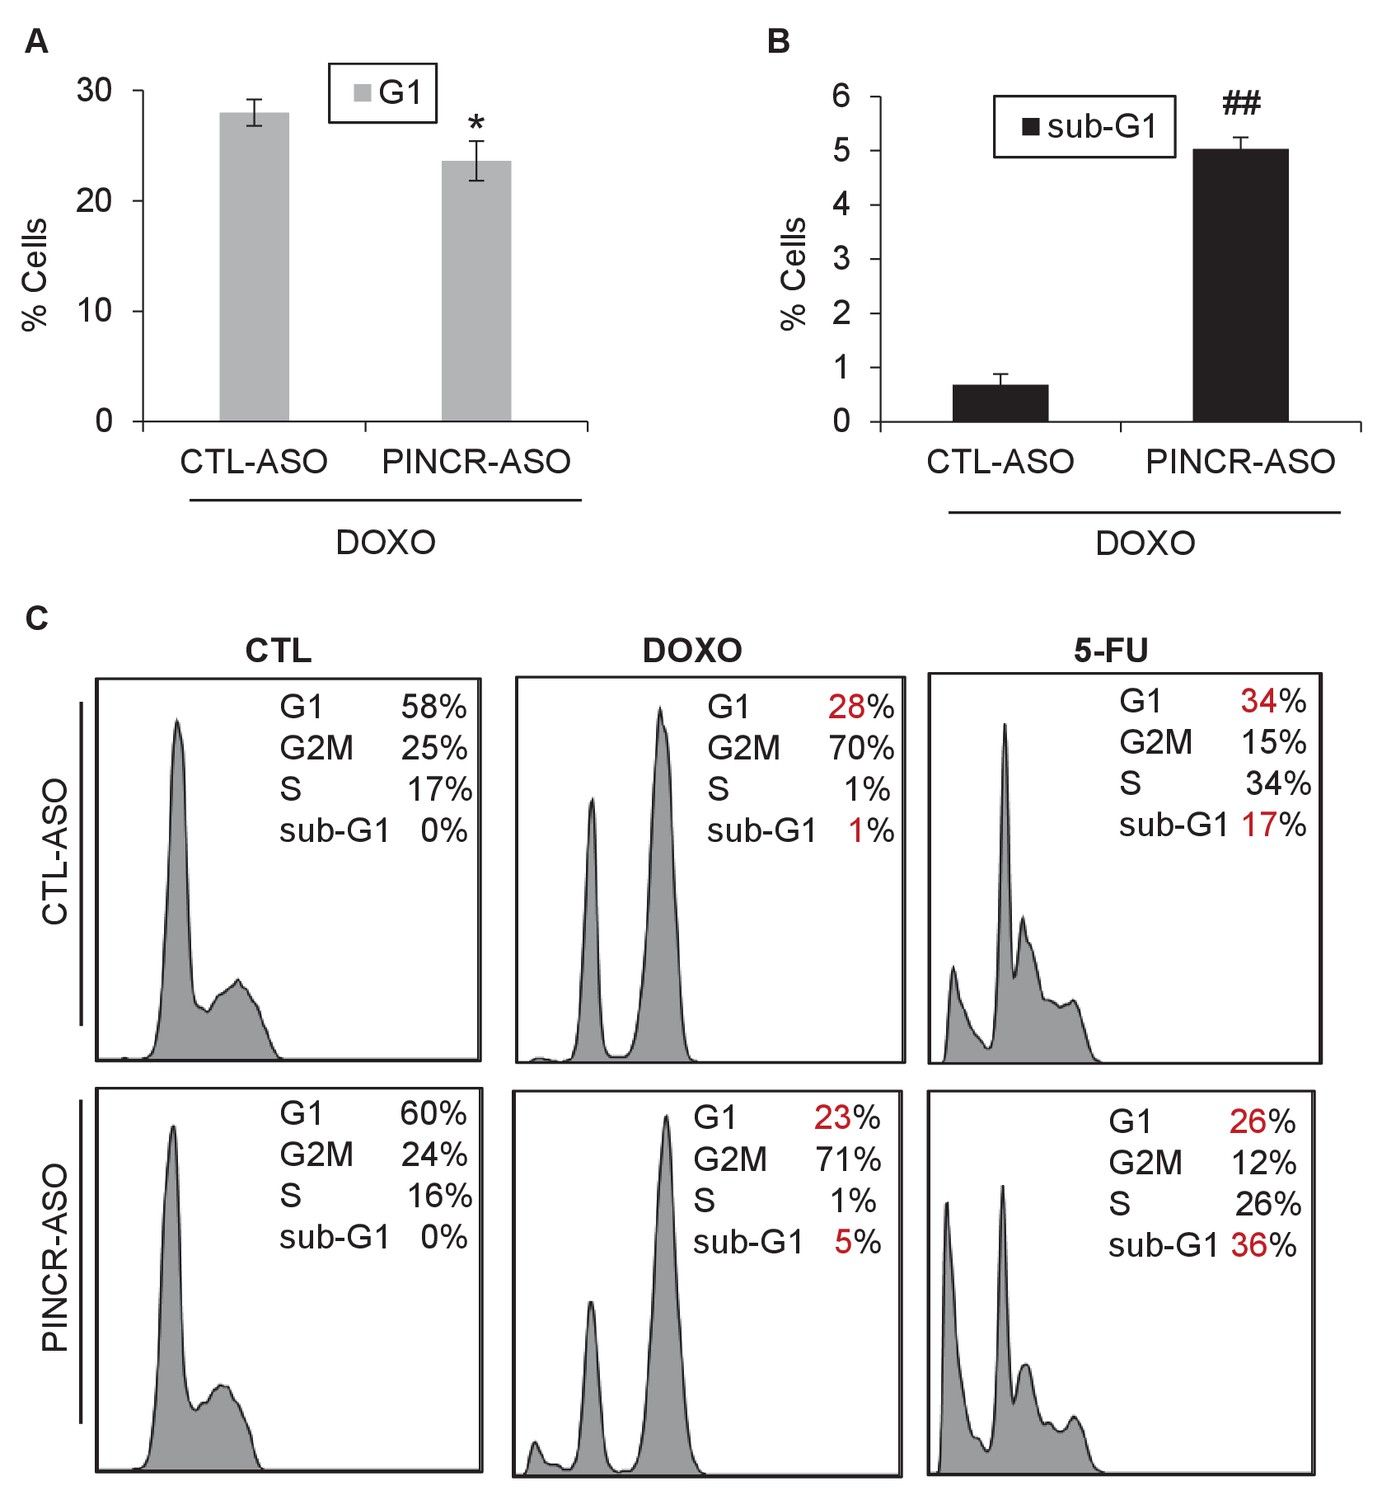
Knockdown of PINCR results in decreased G1 arrest and increased apoptosis.
(A) HCT116 cells were reverse transfected with CTL-ASO or PINCR-ASO for 48 hr and then treated with DOXO for 48 hr. The effect on cell cycle was examined by PI-staining and FACS analysis. Results from three independent experiments are shown in (A). Raw cell cycle profiles from a representative experiment from untreated, DOXO-treated or 5-FU-treated cells (for A and Figure 4E–F) are shown. Error bars represent SD from three experiments. *p<0.05, ##p<0.001.
Figure 4—figure supplement 6
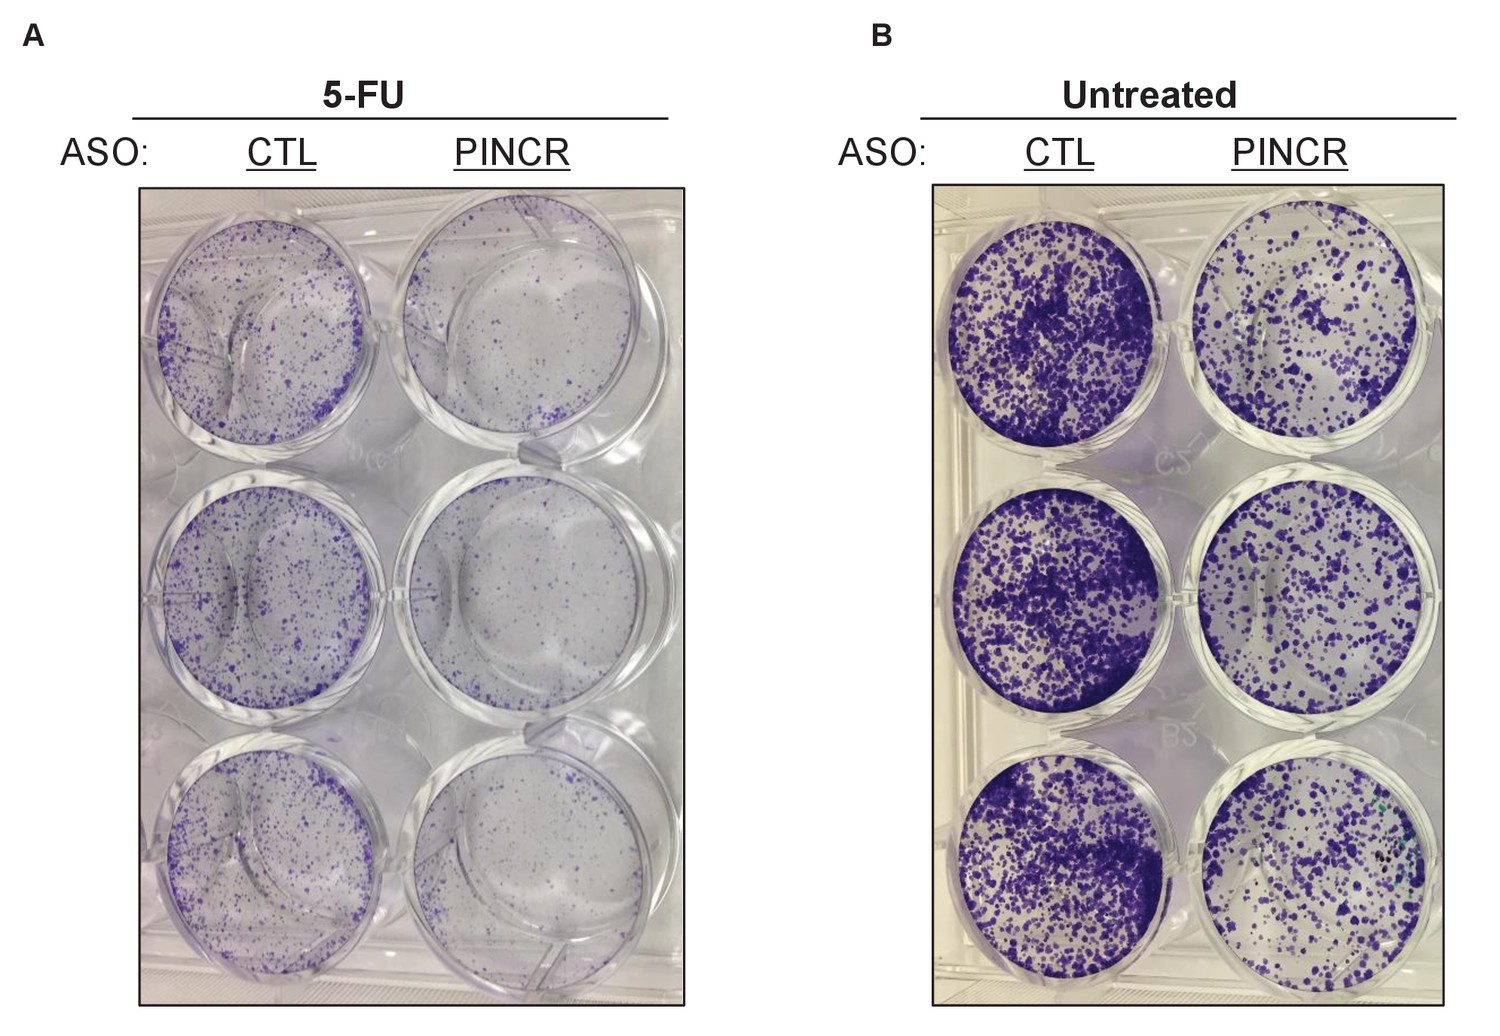
Knockdown of PINCR results in reduced colony formation.
Colony formation assays were performed from HCT116 cells that were treated with 5-FU for 4 hr (A) or untreated (B) after knockdown of PINCR with PINCR-ASO. CTL refers to control (CTL) ASO.
Figure 5 with 5 supplements
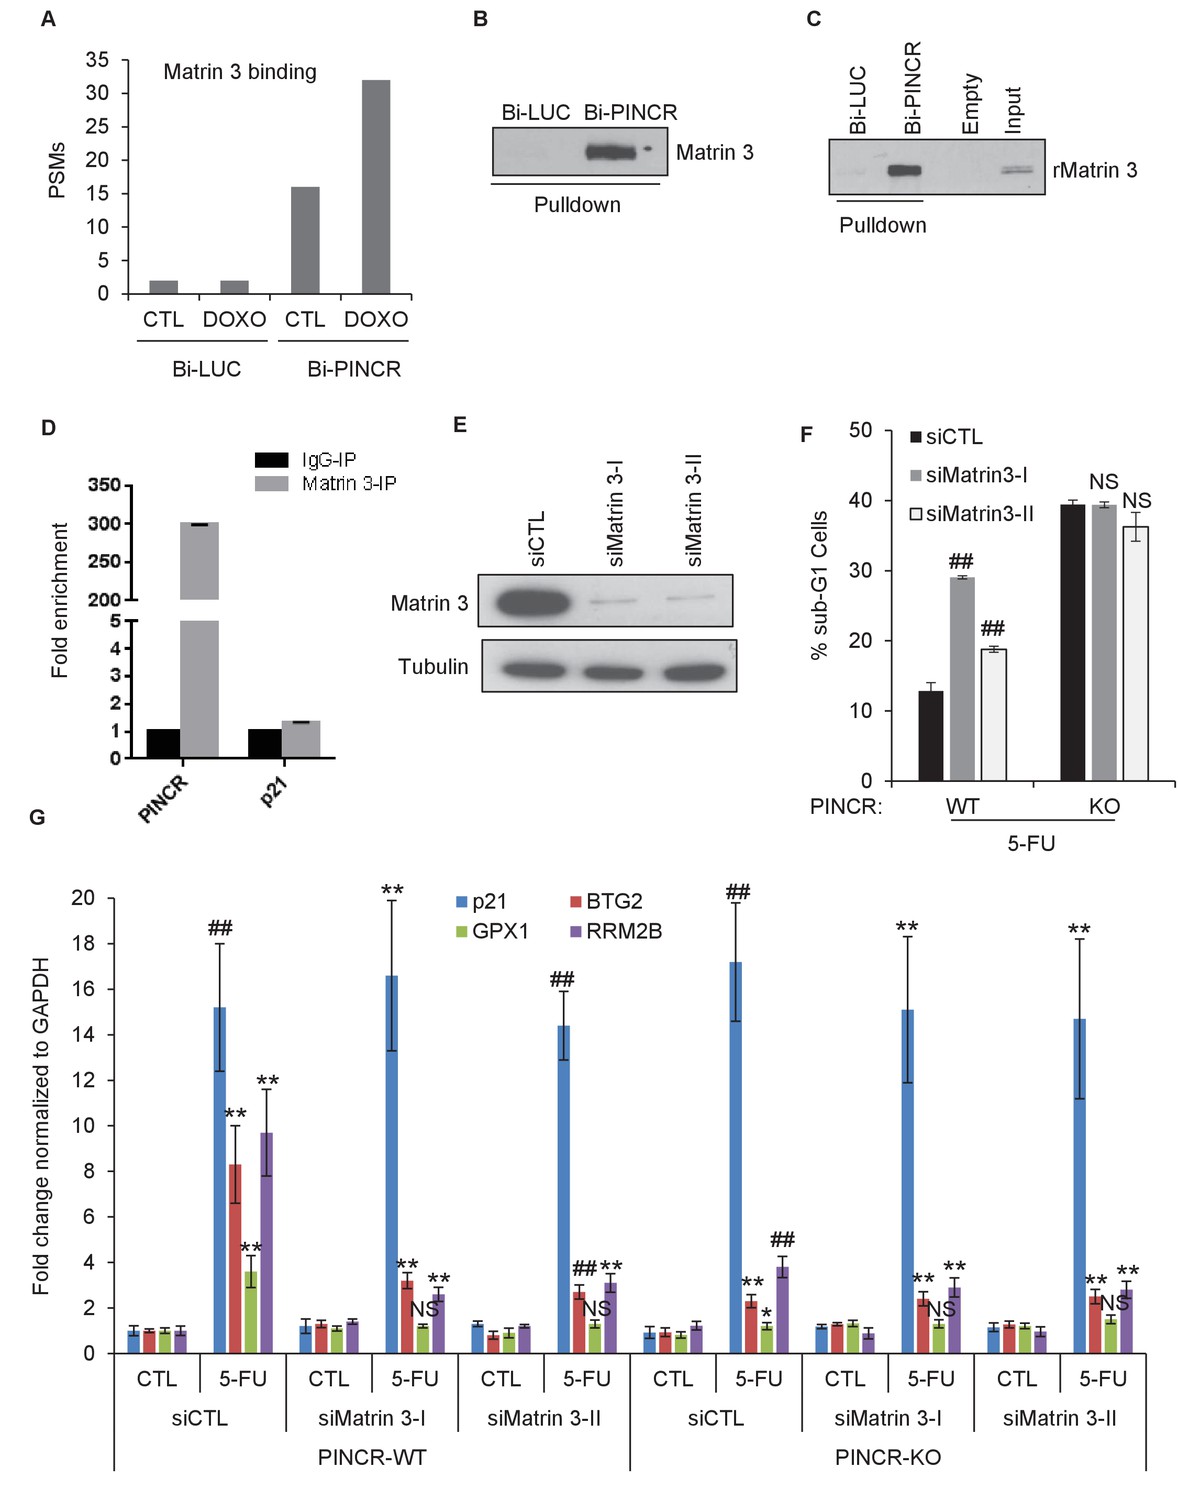
Matrin 3 binds to PINCR and functions as a downstream effector of PINCR.
(A) Peptide spectrum matches (PSMs) corresponding to Matrin 3 in the Bi-LUC and Bi-PINCR pulldowns from mass spectrometry analysis. (B, C) Streptavidin pulldowns followed by immunoblotting was performed following incubation of Bi-LUC and Bi-PINCR RNA with DOXO-treated HCT116 nuclear extracts (B) or recombinant Matrin 3 (rMatrin 3) (C). (D) Specific enrichment of PINCR in the Matrin 3 IPs was assessed by qRT-PCR from 24 hr 5-FU-treated formaldehyde cross-linked HCT116 cells. p21 mRNA was used as negative control. (E) PINCR-WT cells were transfected with CTL or two independent Matrin 3 siRNAs (I and II) for 48 hr and Matrin 3 knockdown was measured by immunoblotting. (F) PINCR-WT and PINCR-KO cells were transfected with CTL or Matrin 3 siRNAs and after 48 hr the cells were untreated or treated with 5-FU for 48 hr. The effect on the sub-G1 population was assessed by PI staining followed by FACS. (G) PINCR-WT and PINCR-KO cells were transfected with CTL or Matrin 3 siRNAs for 48 hr; transfected cells were left untreated or treated with 5-FU for 24 hr and qRT-PCR was performed. Error bars in D, F and G represent SD from three independent experiments. *p<0.05; #p<0.01; **p<0.005.
-
Figure 5—source data 1
Matrin 3 immunoblot for Figure 5B, C and E.
- https://doi.org/10.7554/eLife.23244.039
Figure 5—figure supplement 1

Matrin 3 motifs in PINCR RNA.
(A, B) Putative Matrin 3 binding motif in PINCR RNA. (A) ‘N’ represents the number of times the motif appears in the PINCR RNA. ‘ES’ represents the enrichment score calculated as shown in ‘B’. (C) HCT116 cells were reverse transfected with a control siRNA (siCTL) or siRNAs targeting Matrin 3 (siMatrin 3-I and siMatrin 3-II) for 48 hr and the extent of Matrin 3 knockdown was measured by qRT-PCR for Matrin 3 normalized to GADPH. Error bars represent SD from three independent experiments. ##p<0.001.
Figure 5—figure supplement 2
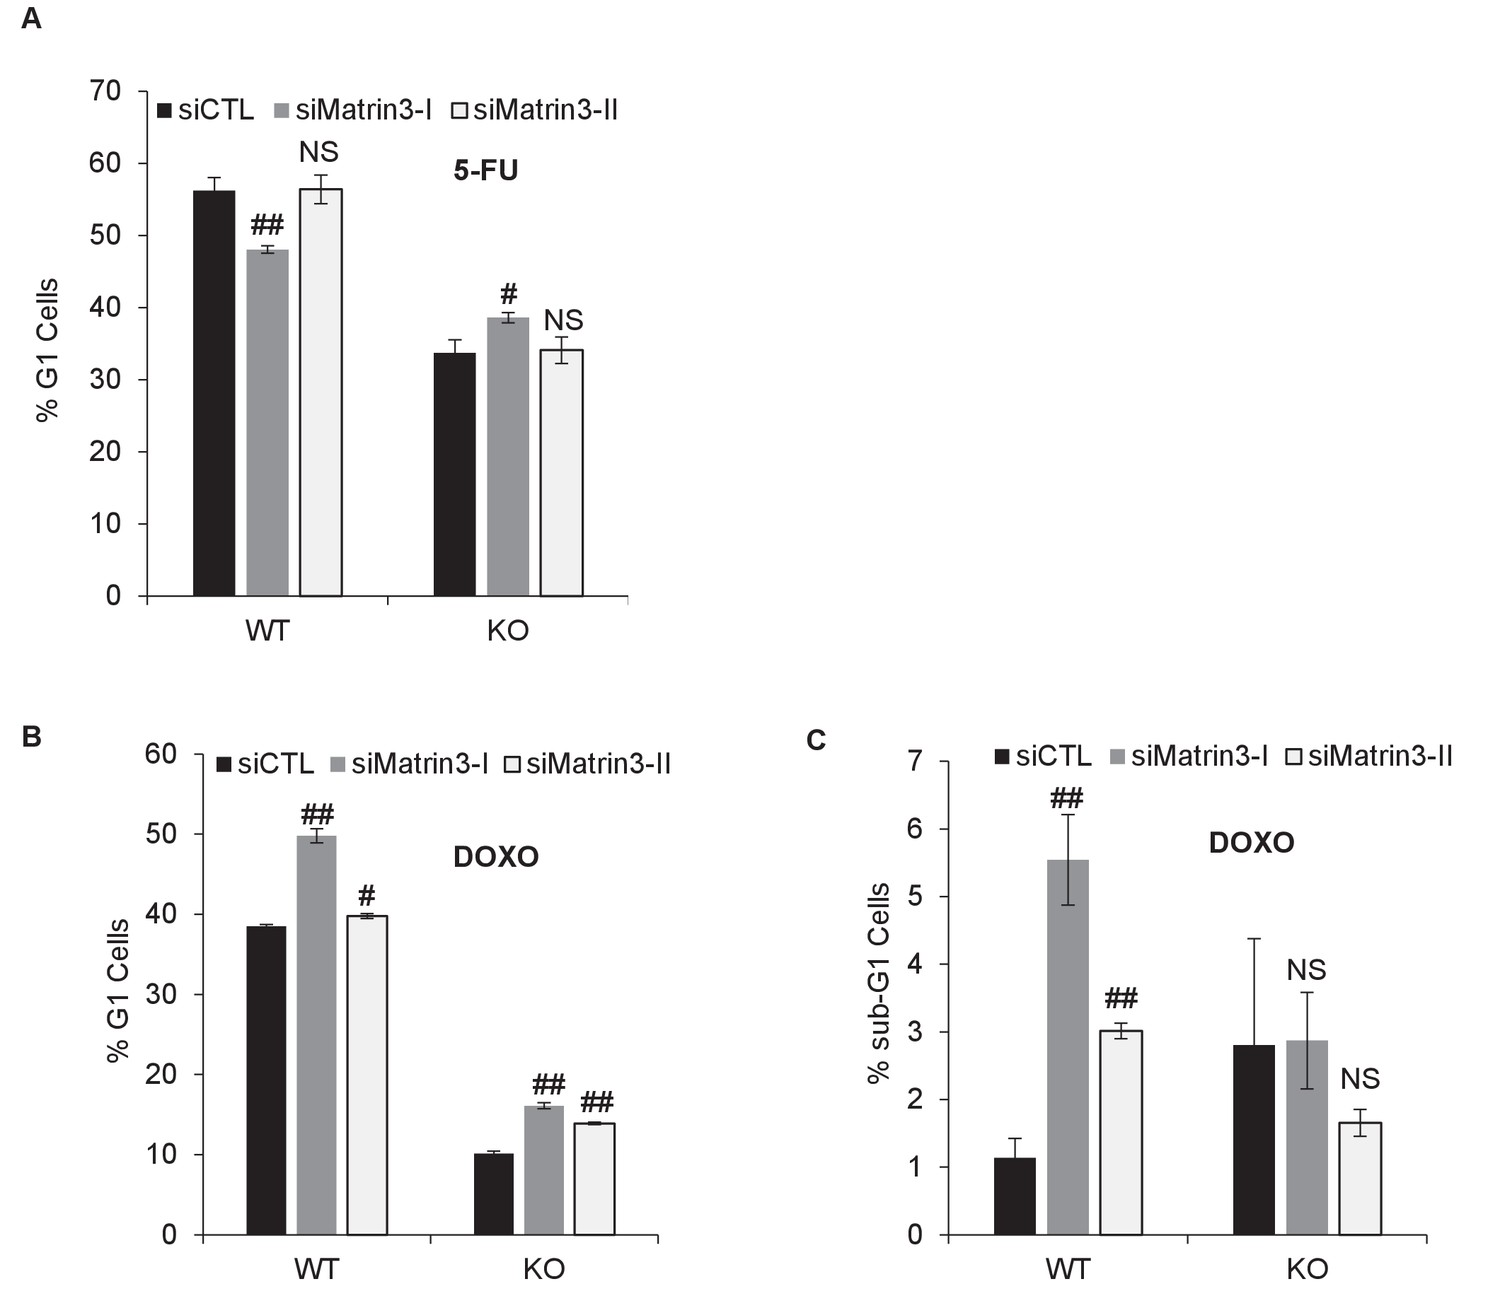
Cell cycle analysis after Matrin 3 knockdown.
PINCR-WT and PINCR-KO HCT116 cells were reverse transfected with a control siRNA (siCTL) or siRNAs targeting Matrin 3 (siMatrin 3-I and siMatrin 3-II) for 48 hr. Transfected cells were left untreated or treated with DOXO or 5-FU for 48 hr. The effect on G1 arrest and apoptosis was examined by PI-staining and FACS analysis. Shown are the results from three independent experiments after 5-FU treatment (A) or DOXO treatment (B, C). Error bars represent SD from three independent experiments. #p<0.01, ##p<0.001.
Figure 5—figure supplement 3
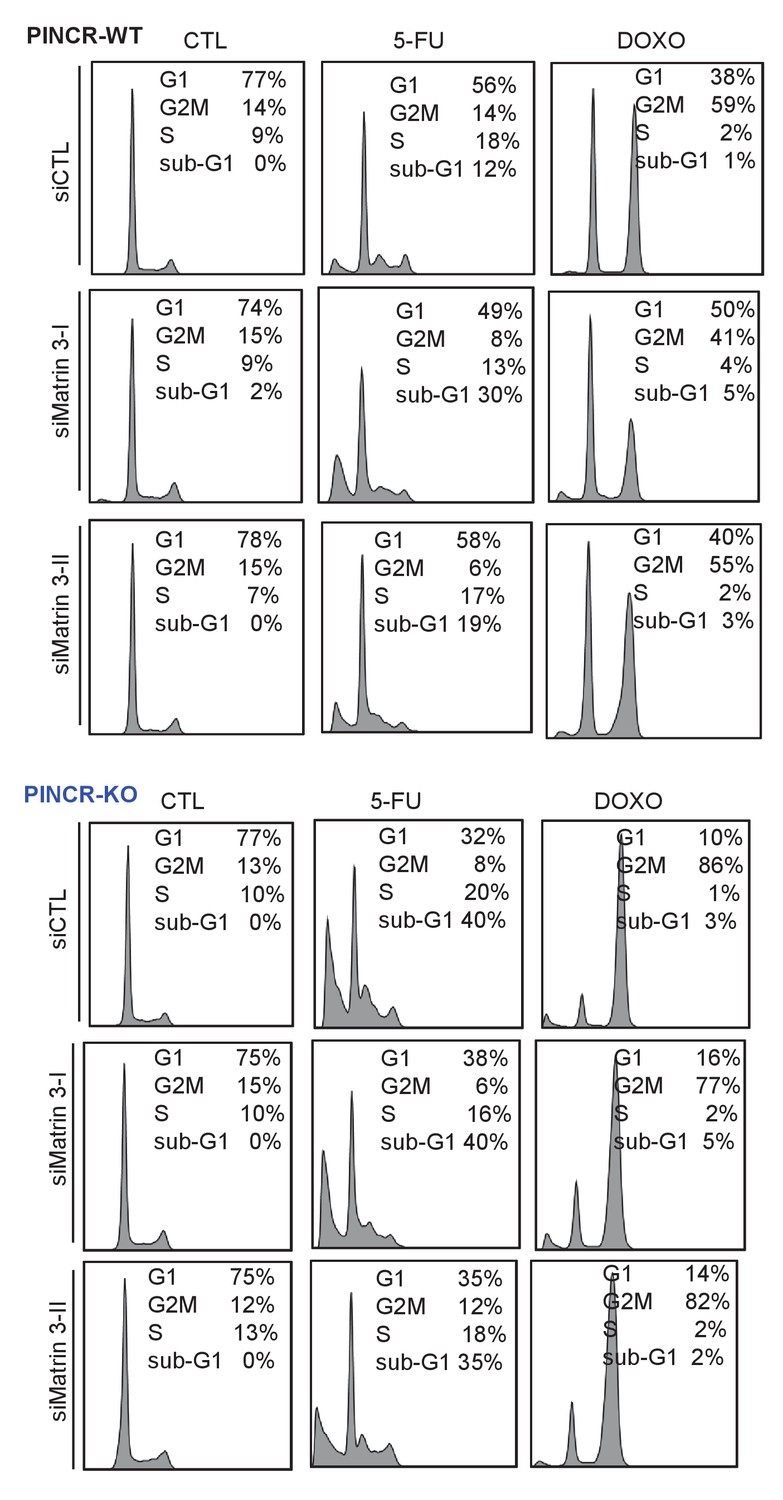
Raw cell cycle profiles from a representative experiment for Figure 5F and Figure 5—figure supplement 3 are shown.
https://doi.org/10.7554/eLife.23244.042
Figure 5—figure supplement 4
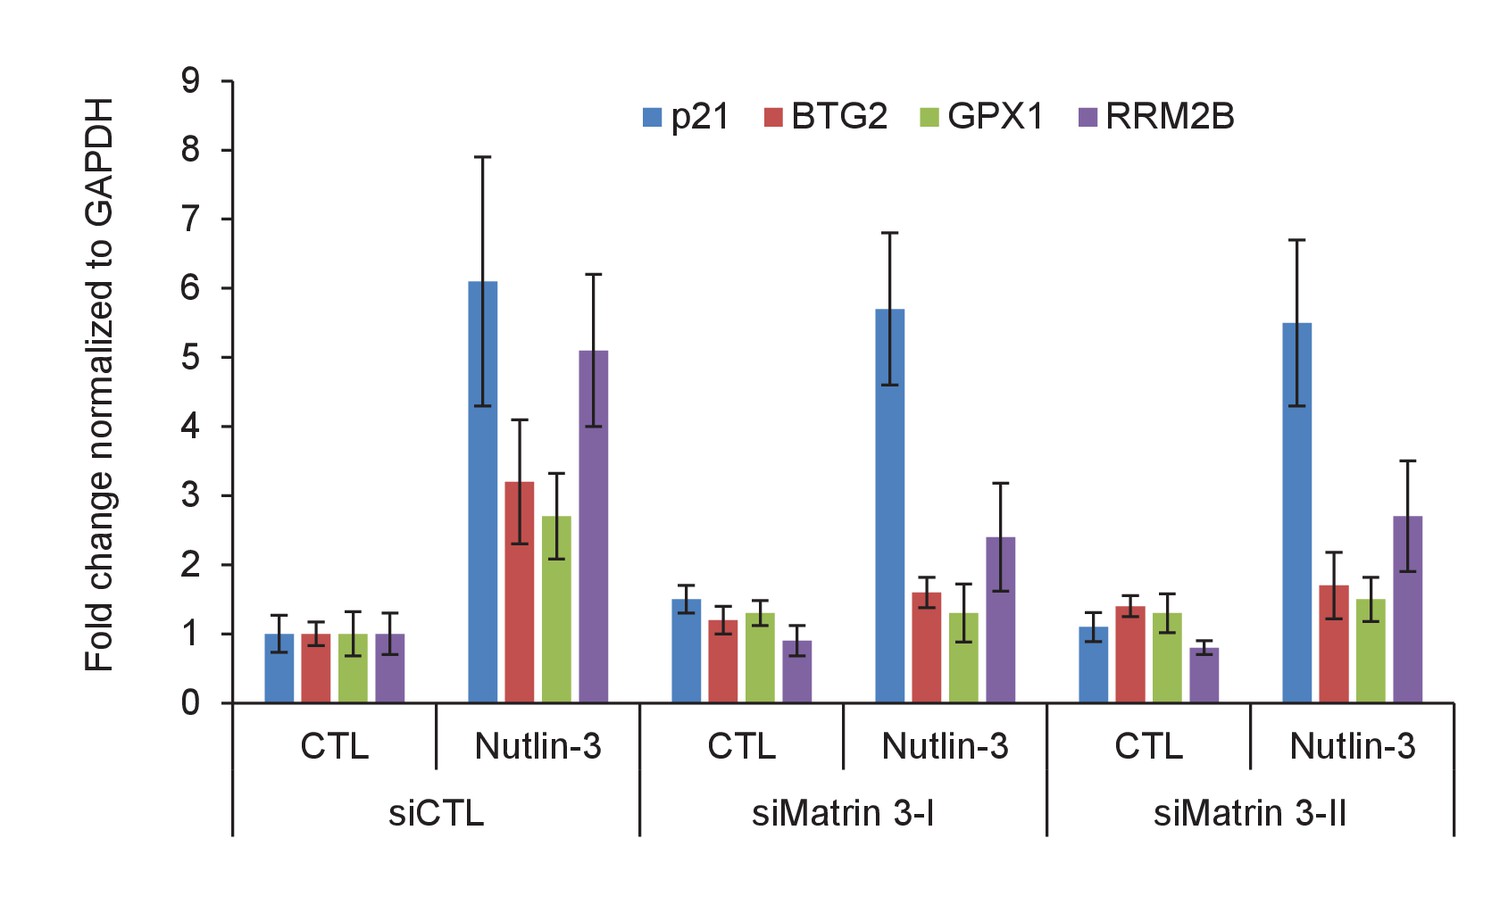
Matrin 3 regulates the induction of PINCR targets upon p53 activation by Nutlin-3.
PINCR-WT HCT116 cells were reverse transfected with CTL siRNA or Matrin-3 siRNAs for 48 hr and then treated with Nutlin-3 for 24 hr. The expression of PINCR targets and the negative control p21, was assessed by qRT-PCR. Error bars represent SD from two independent experiments.
Figure 5—figure supplement 5
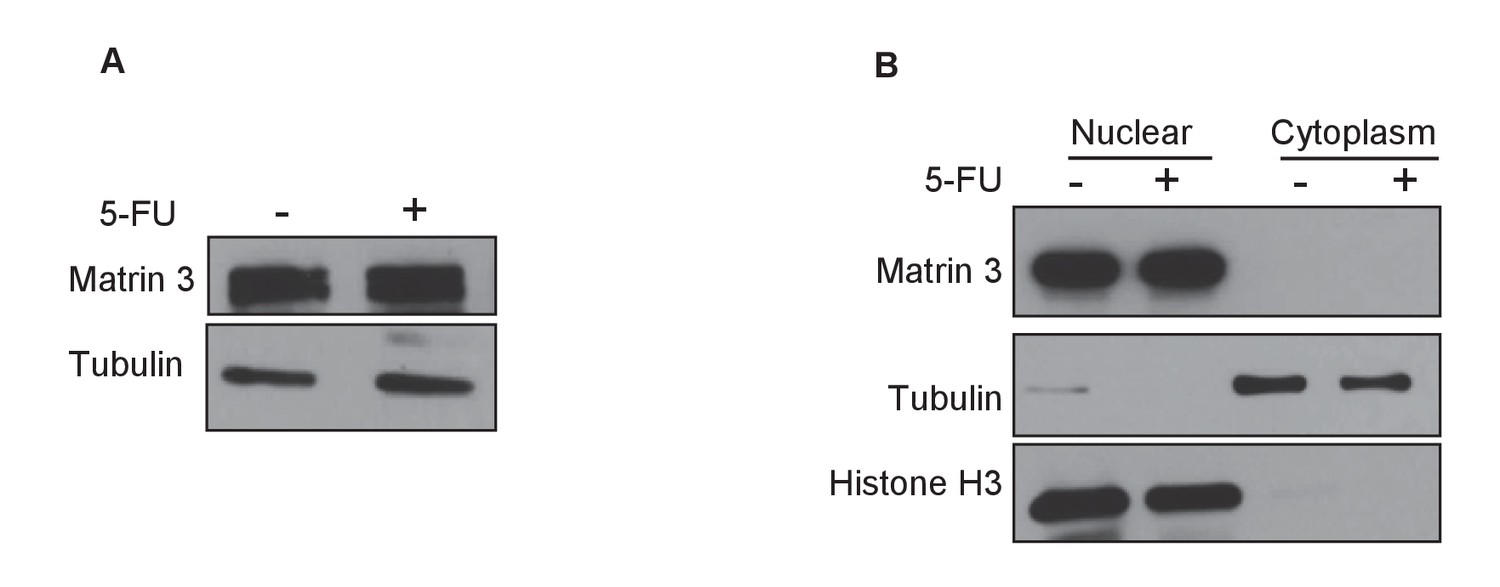
Matrin 3 protein level and subcellular localization is not altered after DNA damage.
HCT116 cells were untreated or treated with 5-FU for 24 hr and immunoblotting for Matrin 3 was performed from whole cell extracts (A) or nuclear and cytoplasmic extracts (B). Tubulin was used as loading control for (A). For (B) Histone H3 was used as nuclear marker and Tubulin was used as cytoplasmic marker.
-
Figure 5—figure supplement 5—source data 1
Matrin 3 immunoblot for Figure 5—figure supplement 5A and B.
- https://doi.org/10.7554/eLife.23244.045
Figure 6 with 2 supplements
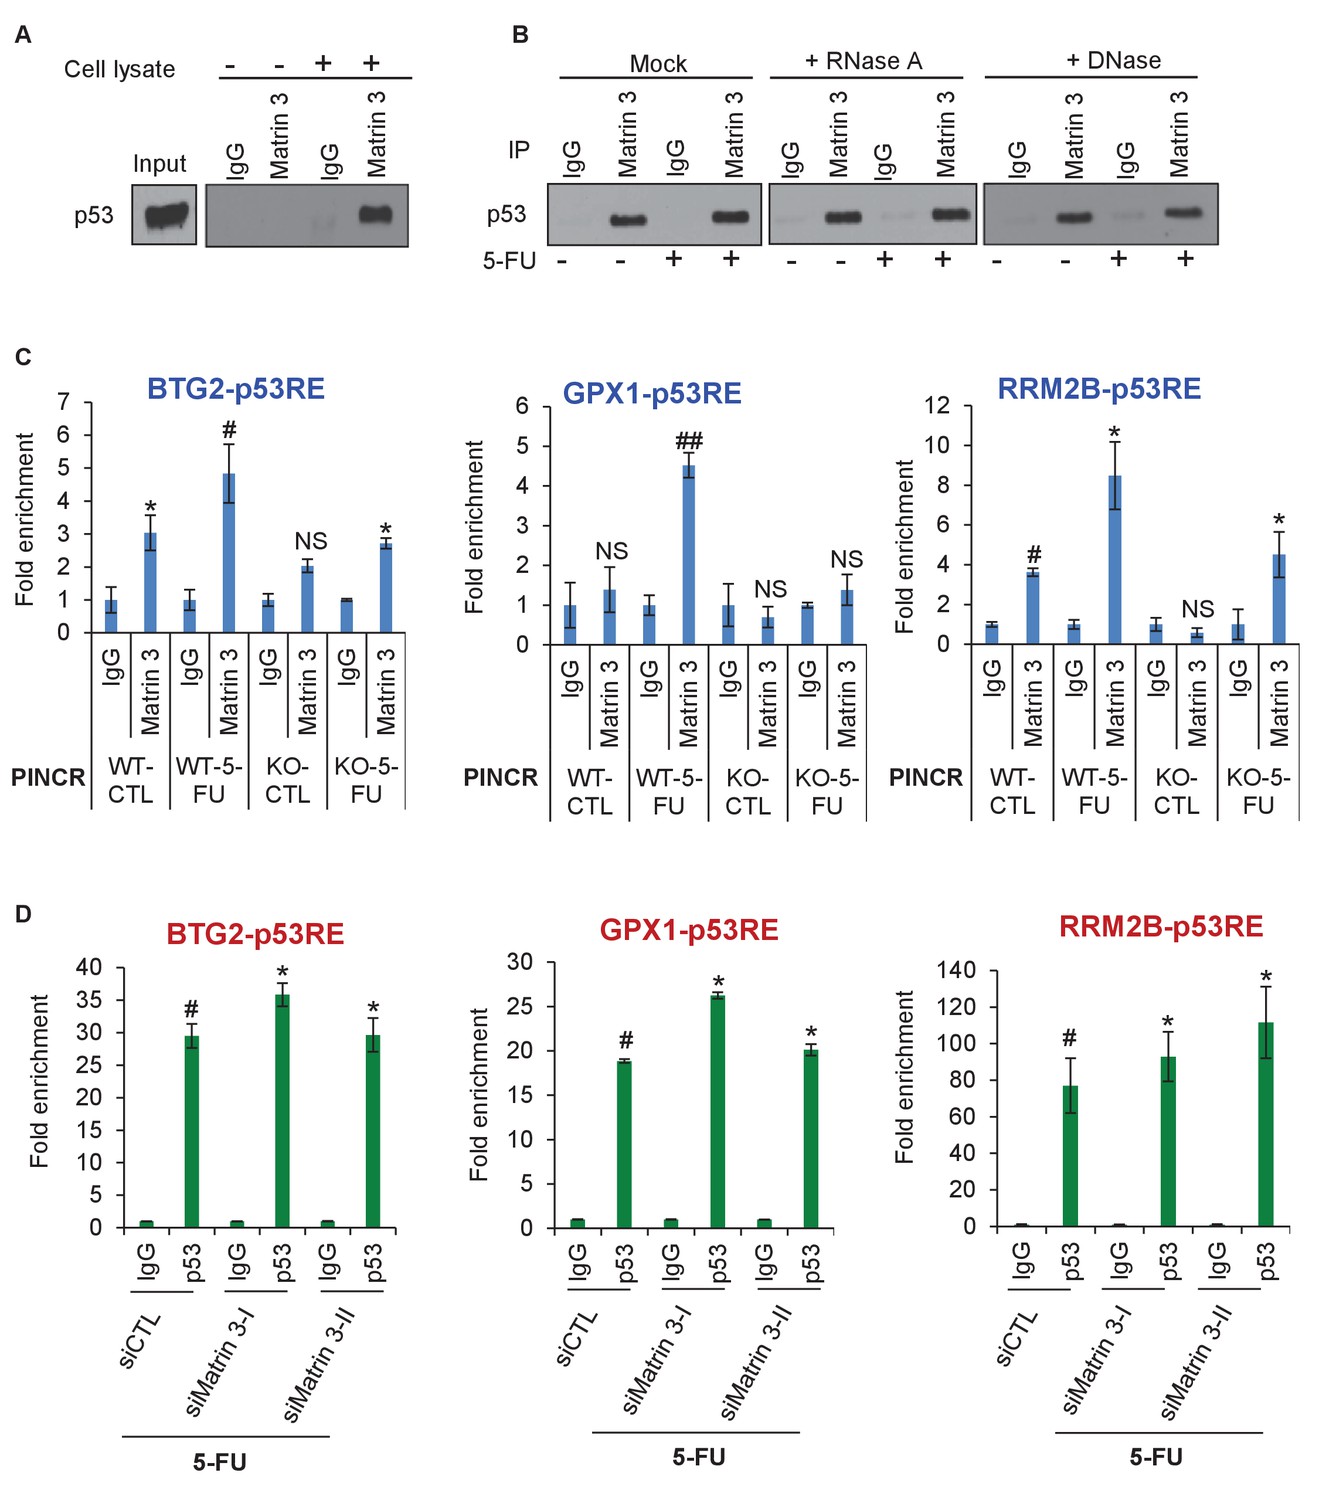
Matrin 3 forms a complex with p53 complex and associates with the p53RE of select PINCR targets.
(A) HCT116 cells were treated with 5-FU for 24 hr and immunoblotting for p53 was performed from input, no cell lysate control and IgG or Matrin 3 IP from whole cell extracts. (B) HCT116 cells were untreated or treated with 5-FU for 24 hr and the interaction between p53 and Matrin 3 was assessed by IPs from Mock (no extract), RNase-treated or DNase-treated whole cell lysates. (C) PINCR-WT and PINCR-KO cells were untreated or treated with 5-FU for 24 hr and qPCR with primers spanning the p53RE of BTG2, RRM2B and GPX1 was performed from IgG-ChIP and Matrin 3-ChIP. (D) PINCR-WT HCT116 cells were reverse transfected with CTL or Matrin 3 siRNAs for 48 hr and then treated with 5-FU for 24 hr. The enrichment of p53 at the p53RE of PINCR targets was determined by ChIP-qPCR. Errors bars in C and D represent SD from three independent experiments. *p<0.05; #p<0.01; ##p<0.001.
-
Figure 6—source data 1
p53 immunoblot for Figure 6A and B.
- https://doi.org/10.7554/eLife.23244.047
Figure 6—figure supplement 1
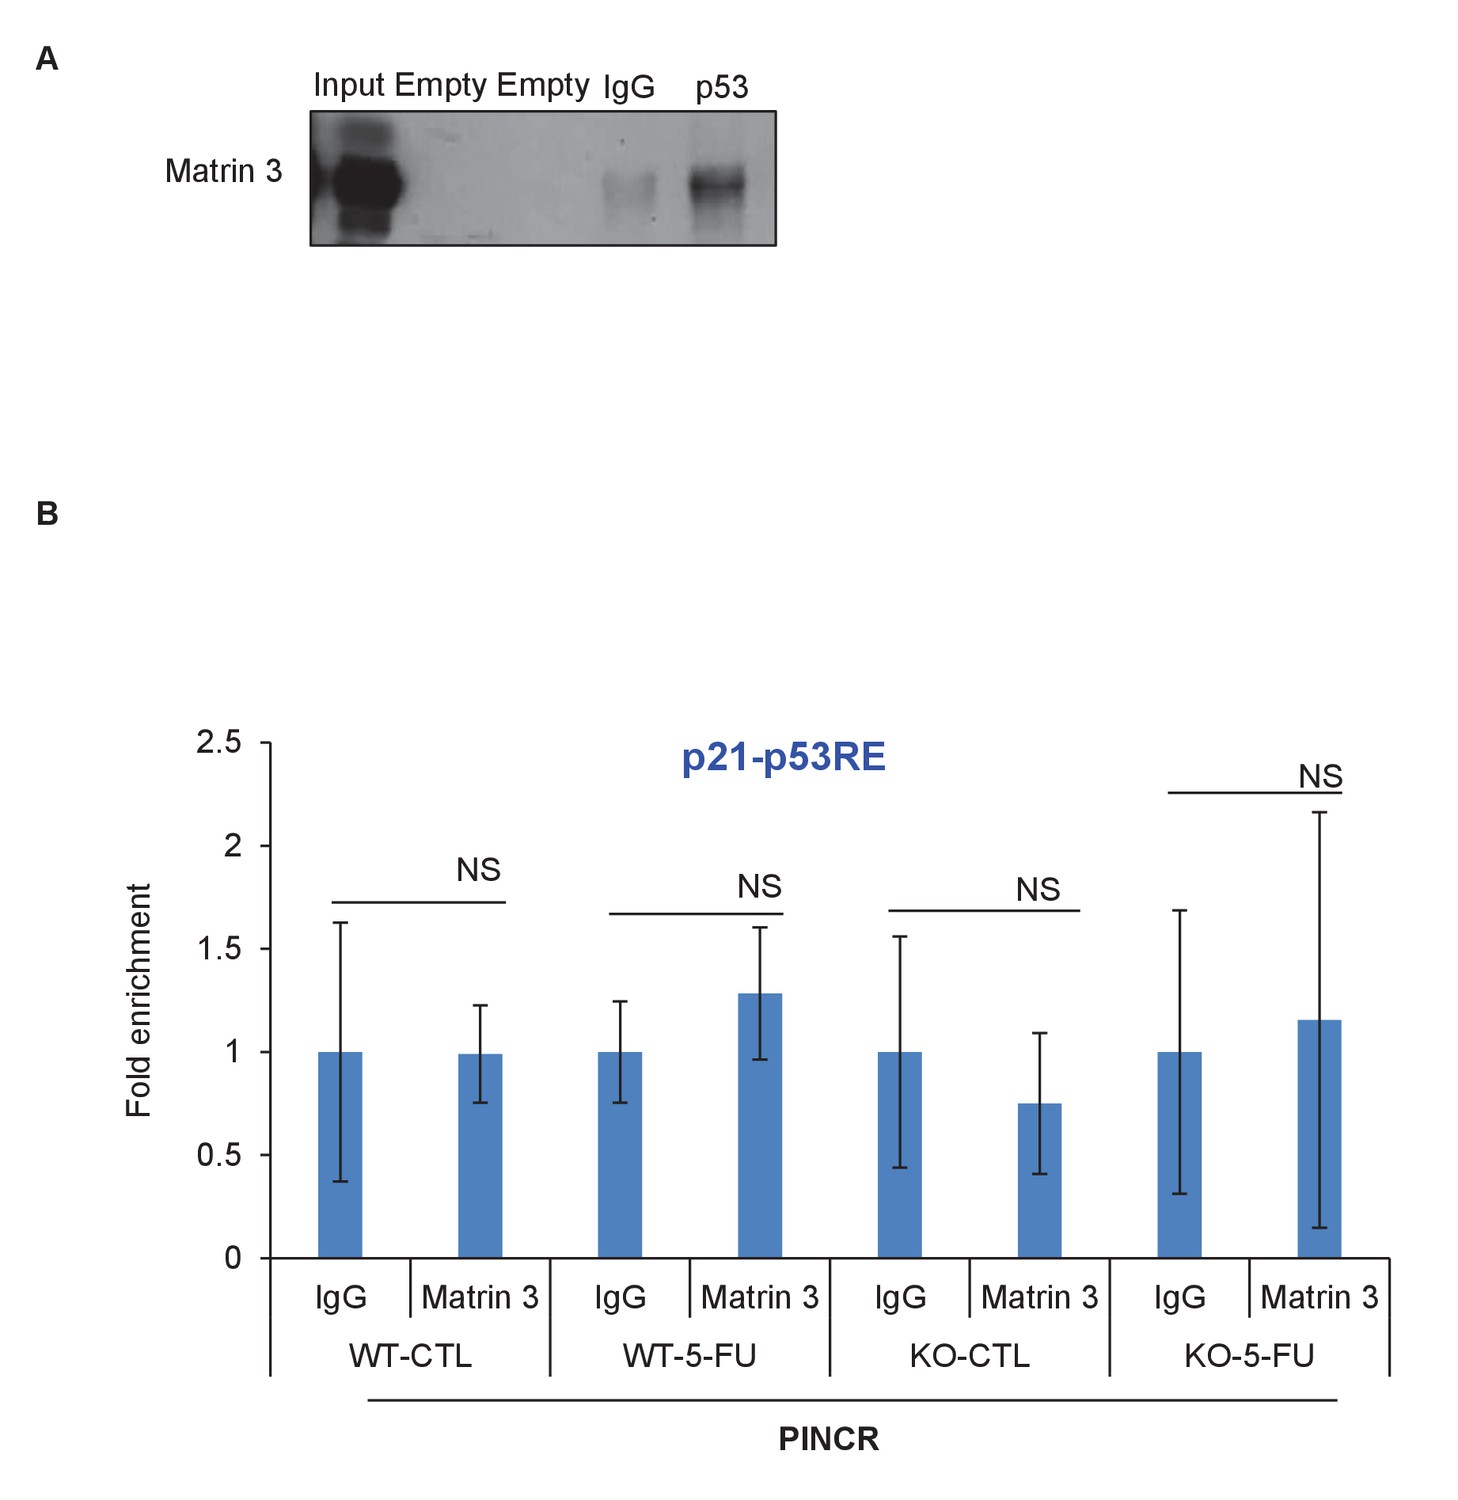
Matrin 3 interacts with p53.
(A) Co-IP was performed from HCT116 cells in which nuclear extracts were incubated with IgG or p53 antibody and immunoblotting for Matrin 3 was performed. (B) Matrin 3 ChIP-qPCR was performed from PINCR-WT and PINCR-KO cells treated with 5-FU and the association with the p53RE in the p21 promoter was determined. Error bars represent SD from three experiments.
-
Figure 6—figure supplement 1—source data 1
Matrin 3 immunoblot for Figure 6—figure supplement 1A.
- https://doi.org/10.7554/eLife.23244.049
Figure 6—figure supplement 2
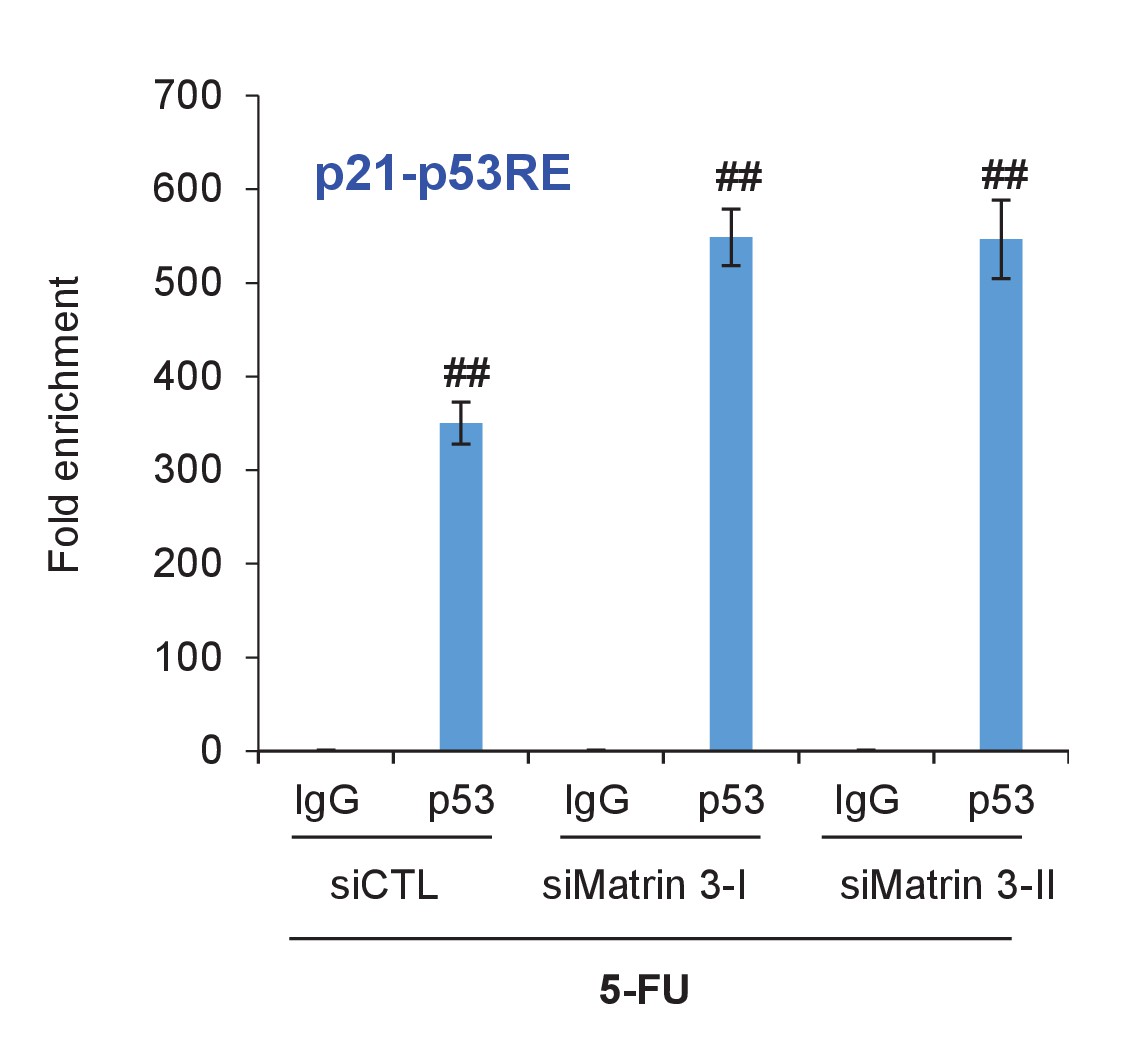
p53 binding to p21 promoter upon Matrin 3 knockdown.
PINCR-WT HCT116 cells were reverse transfected with a control siRNA (siCTL) or siRNAs targeting Matrin 3 (siMatrin 3-I and siMatrin 3-II) for 48 hr. Transfected cells were treated with 5-FU for 24 hr and the binding of p53 to the p53RE of the p21 promoter was determined by ChIP-qPCR. Error bars represent SD from three independent experiments. ##p<0.001.
Figure 7 with 2 supplements

PINCR modulates the association of Matrin 3 with enhancers of PINCR targets within insulated neighborhoods.
(A) Topological domain and looping structure indicated by 3D contact domain profile (top) surrounding BTG2 gene and Hi-C data from (Rao et al., 2014). ChIP-seq data tracks (middle) in HCT116 showing CTCF anchors and loop-enabling cohesion (RAD21), as well as promoter associated histone mark H3K4me3 and active promoter/enhancer associated mark H3K27ac. p53 ChIP-seq in untreated or treated MCF7 is also shown. Candidate regulatory enhancers (used for ChIP-qPCR of Matrin3) are highlighted with an orange box at the tail of an arrow pointing toward the putative target gene. The p53 response element is shown, found at the promoter, where stronger ChIP-seq signal was present upon treatments. The one-dimensional genomic distance between the enhancer and the promoter is indicated between the zoomed in boxes (bottom). (B, C) PINCR-WT and PINCR-KO HCT116 cells were treated with 5-FU for 24 hr and the association of Matrin 3 (B) or p53 (C) with the enhancer of PINCR targets was assessed by ChIP-qPCR. (D) PINCR-WT HCT116 cells were reverse transfected with CTL or Matrin 3 siRNAs for 48 hr and then treated with 5-FU for 24 hr. The enrichment of p53 at the enhancer regions of PINCR targets was determined by ChIP-qPCR. (E) A cartoon showing the chromatin looping between the enhancer and promoter region of BTG2. Errors bars in B, C and D represent SD from three independent experiments. *p<0.05; #p<0.01; **p<0.005; ##p<0.001.
Figure 7—figure supplement 1
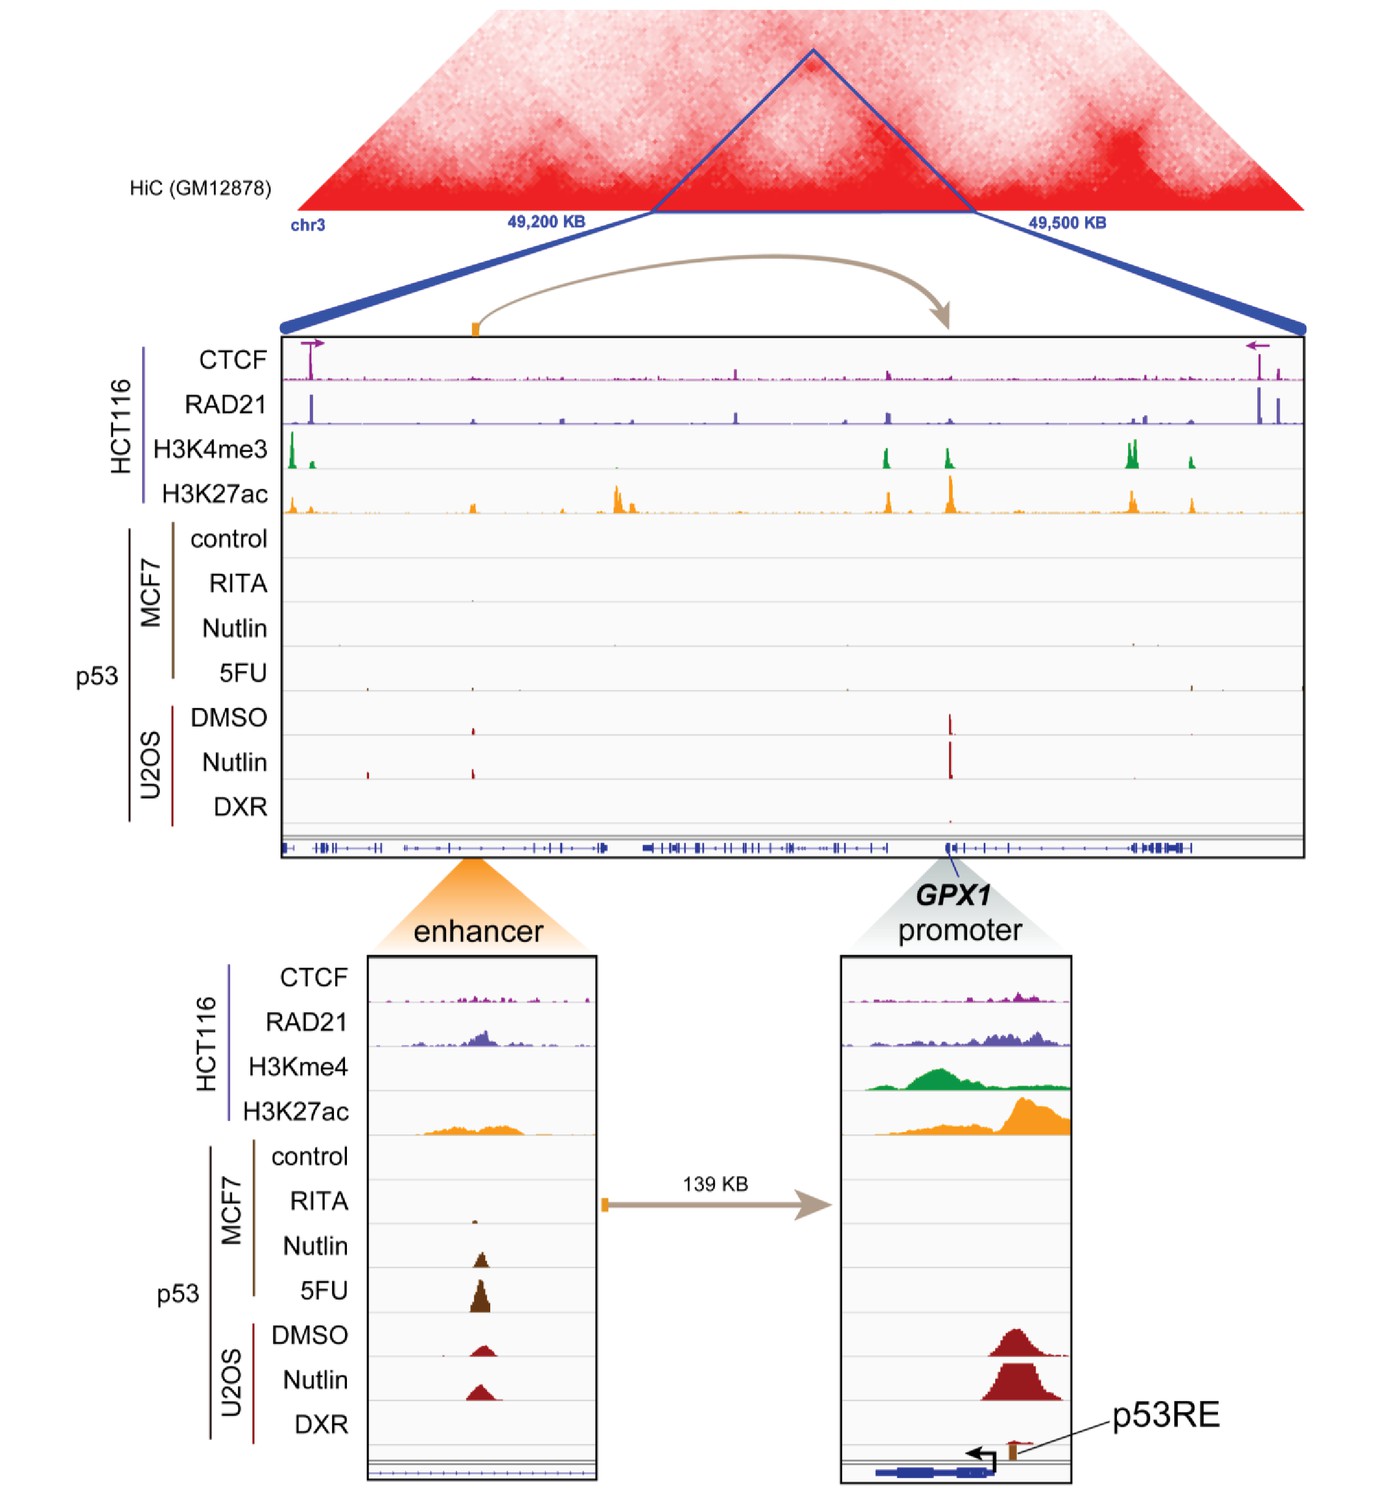
Topological domain and looping structure indicated by 3D contact domain profile (top) surrounding GPX1 gene (chr3:49,200,000–49,500,000) with Hi-C data from (Rao et al., 2014).
ChIP-seq data tracks (middle) in HCT116 showing CTCF anchors (motif direction indicated by arrow) and loop-enabling cohesion (RAD21), as well as promoter-associated histone mark H3K4me3 and active promoter/enhancer-associated mark H3K27ac. ChIP-seq of p53 in treated cells (MCF7 and U2OS) is also shown. Candidate regulatory enhancers (used for ChIP-qPCR of Matrin3) are highlighted with an orange box at the tail of an arrow pointing toward the putative target gene. The p53RE is shown, found at the promoter. The one-dimensional distance between the enhancer and the promoter is indicated between the zoomed in boxes (bottom).
Figure 7—figure supplement 2
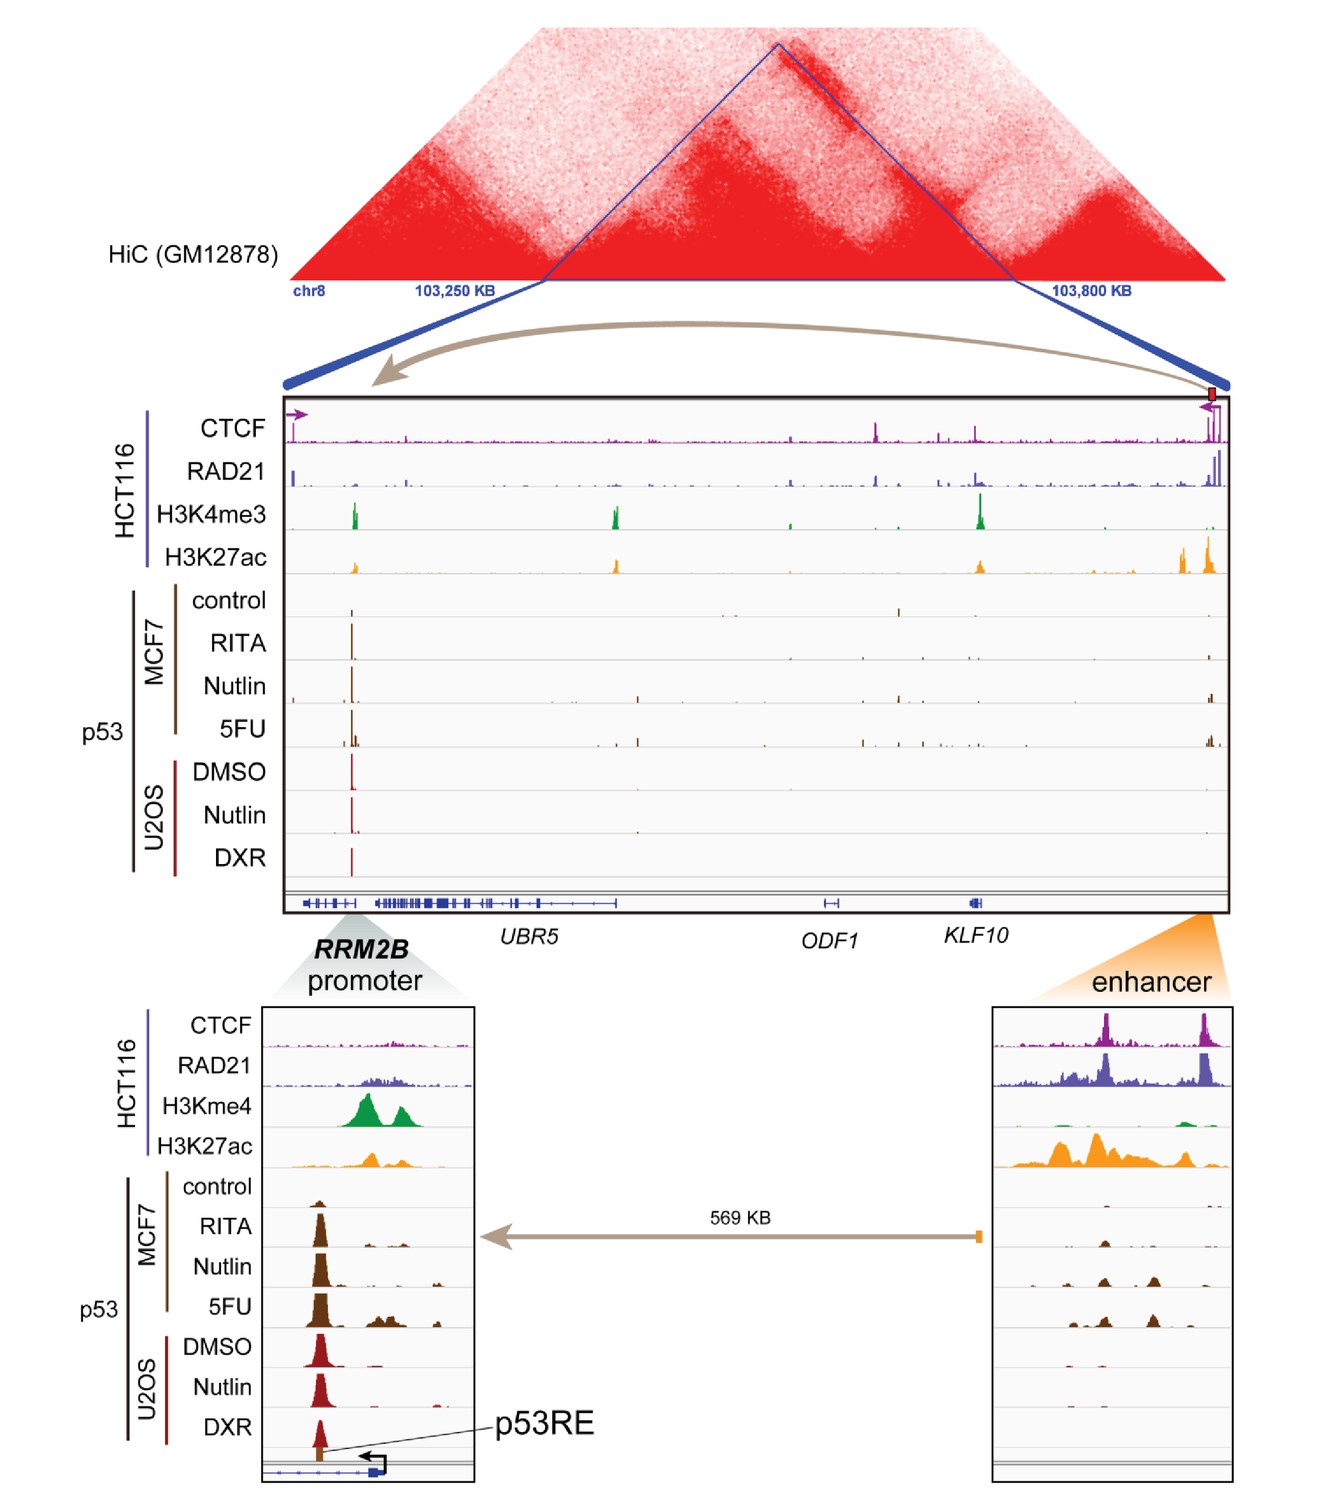
Topological domain and looping structure indicated by 3D contact domain profile (top) surrounding RRM2B gene (chr8:103,250,000–103,800,000) with Hi-C data from (Rao et al., 2014).
ChIP-seq data tracks (middle) in HCT116 showing CTCF (motif direction indicated by arrow), RAD21, H3K4me3 and H3K27ac. ChIP-seq of p53 in treated cells (MCF7 and U2OS) is also shown. Candidate regulatory enhancers (used for ChIP-qPCR of Matrin3) are highlighted with an orange box at the tail of an arrow pointing towards the putative target gene. The p53RE is shown, found at the promoter, where stronger ChIP-seq signal was present upon treatments. The one-dimensional genomic enhancer/promoter distance of 569 KB is indicated (bottom).
Figure 8 with 5 supplements

PINCR associates with the enhancer regions of select p53 targets in a Matrin-3-dependent manner.
Schematic showing knock-in of S1-tag at the 3’end of PINCR. (B) The enrichment of PINCR in the streptavidin pulldowns from PINCR and PINCR-S1 cells treated with 5-FU for 24 hr was assessed by qRT-PCR. (C) PINCR and PINCR-S1 cells were treated with 5-FU for 24 hr and followed by streptavidin pulldown. Interaction between PINCR and Matrin 3 was confirmed by immunoblotting for Matrin 3 or the control Tubulin. (D) PINCR and PINCR-S1 cells were treated with 5-FU for 24 hr and qPCR with primers spanning the p53RE of BTG2, RRM2B and GPX1 was performed following streptavidin pulldown. (E) PINCR-S1 cells were reverse transfected with CTL siRNA, p53 siRNAs or two independent Matrin 3 siRNAs and then treated with 5-FU for 24 hr. The enrichment of PINCR-S1 at the p53RE and enhancer regions of PINCR targets was determined by ChIP-qPCR from the streptavidin pulldown material. Error bars represent SD from three independent experiments. *p<0.05; **p<0.005, ##p<0.001.
-
Figure 8—source data 1
Matrin 3 immunoblot for Figure 8C.
- https://doi.org/10.7554/eLife.23244.055
Figure 8—figure supplement 1
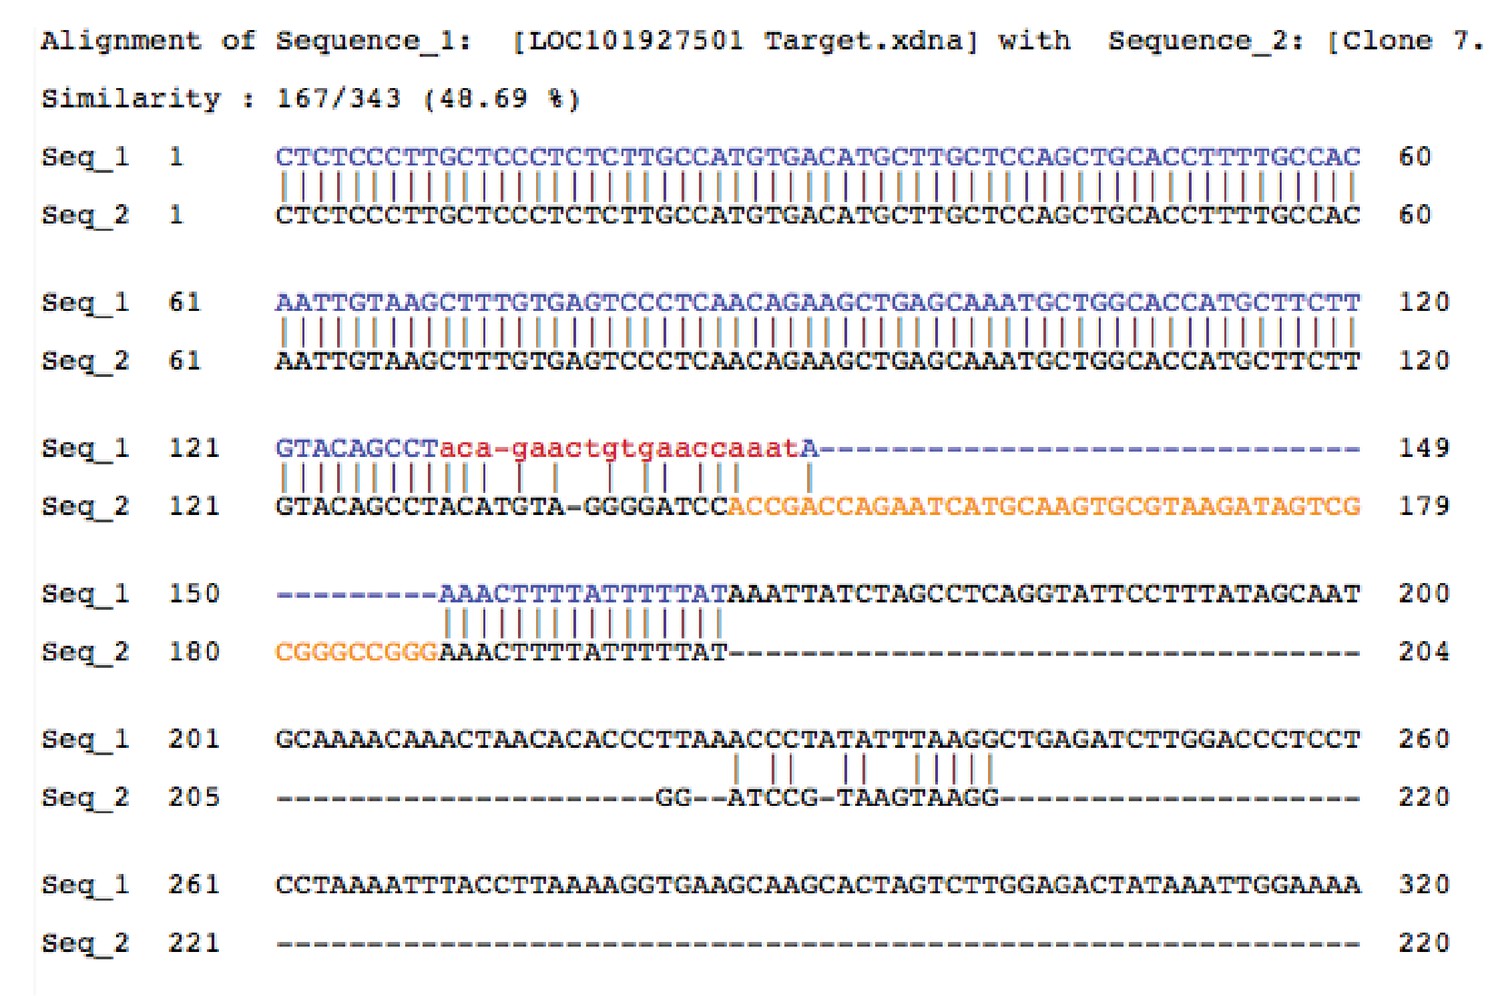
Sequence alignment of gDNA from PINCR (Seq_1) and PINCR-S1 (Seq_2) clones.
Yellow is the 44 nucleotide S1-tag inserted in PINCR-S1.
Figure 8—figure supplement 2
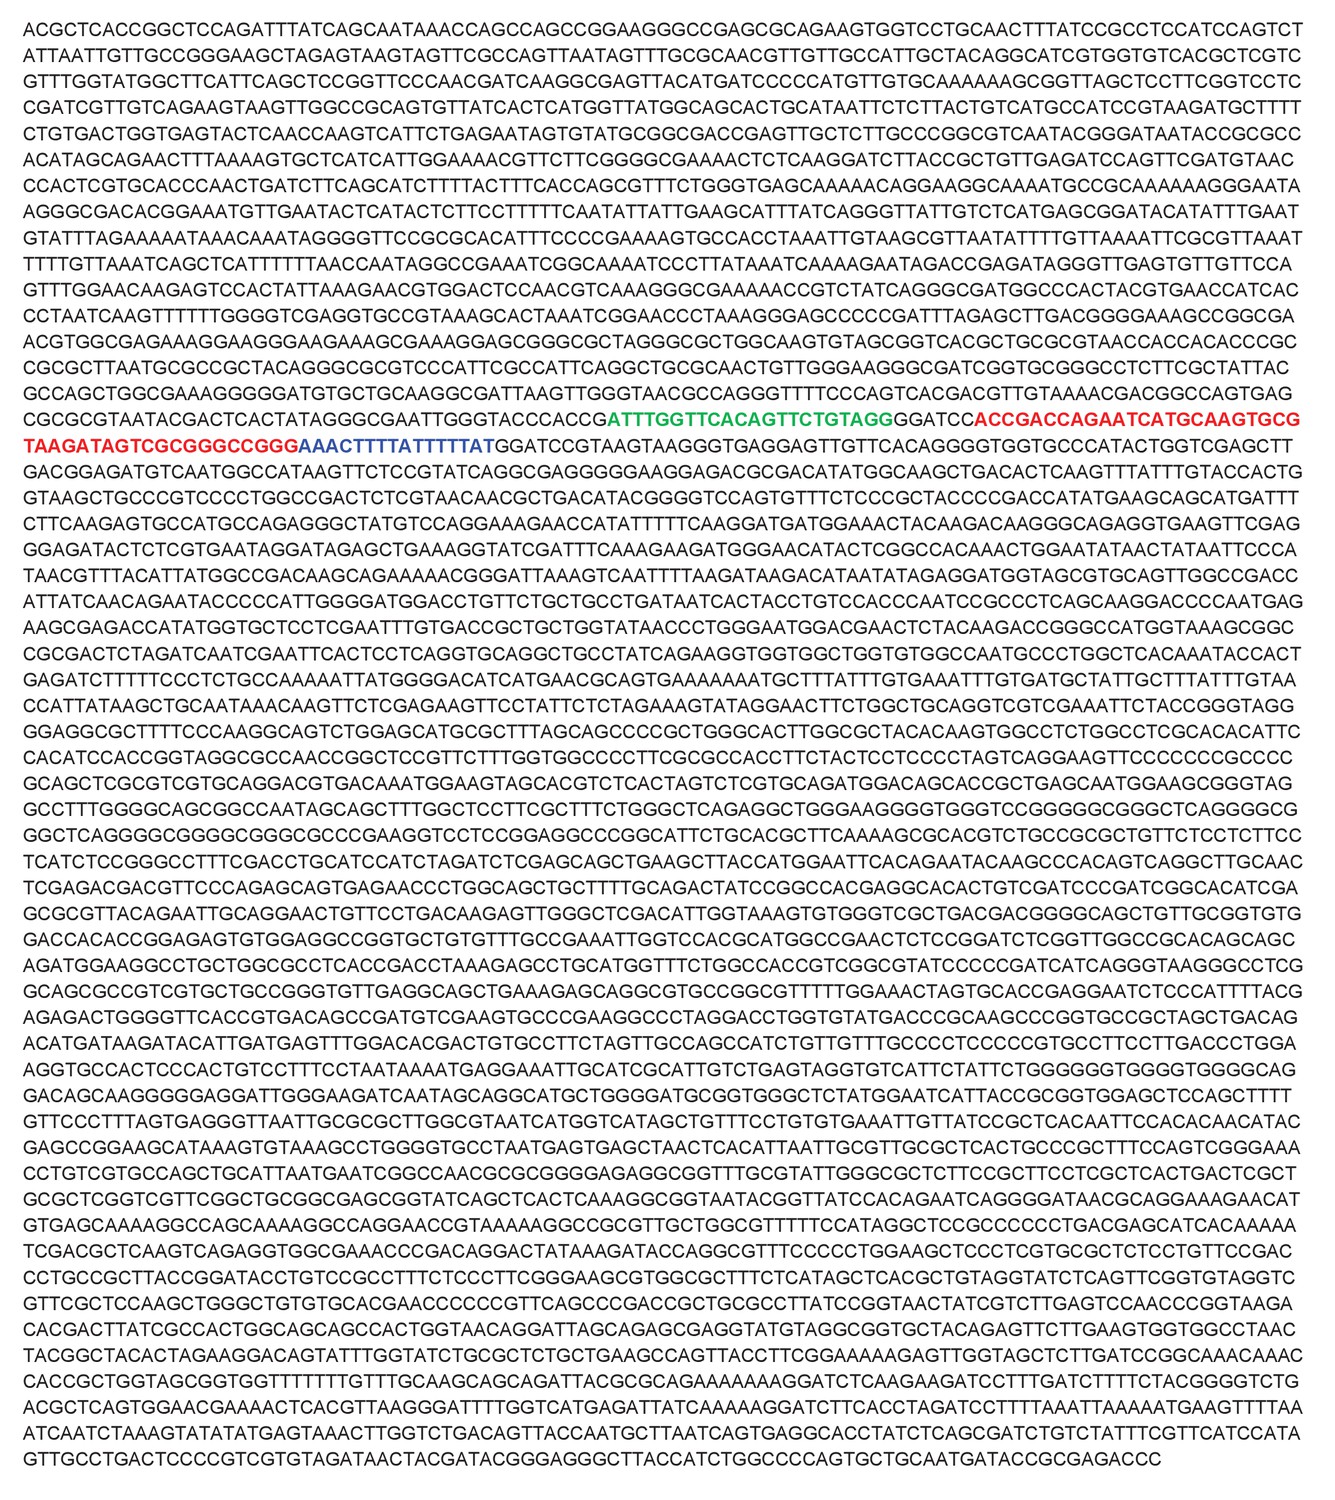
Full sequence of the S1 targeting vector.
Text highlighted in green corresponds to sgRNA target sequence, red is the S1-tag and blue is the 3’ end of PINCR.
Figure 8—figure supplement 3
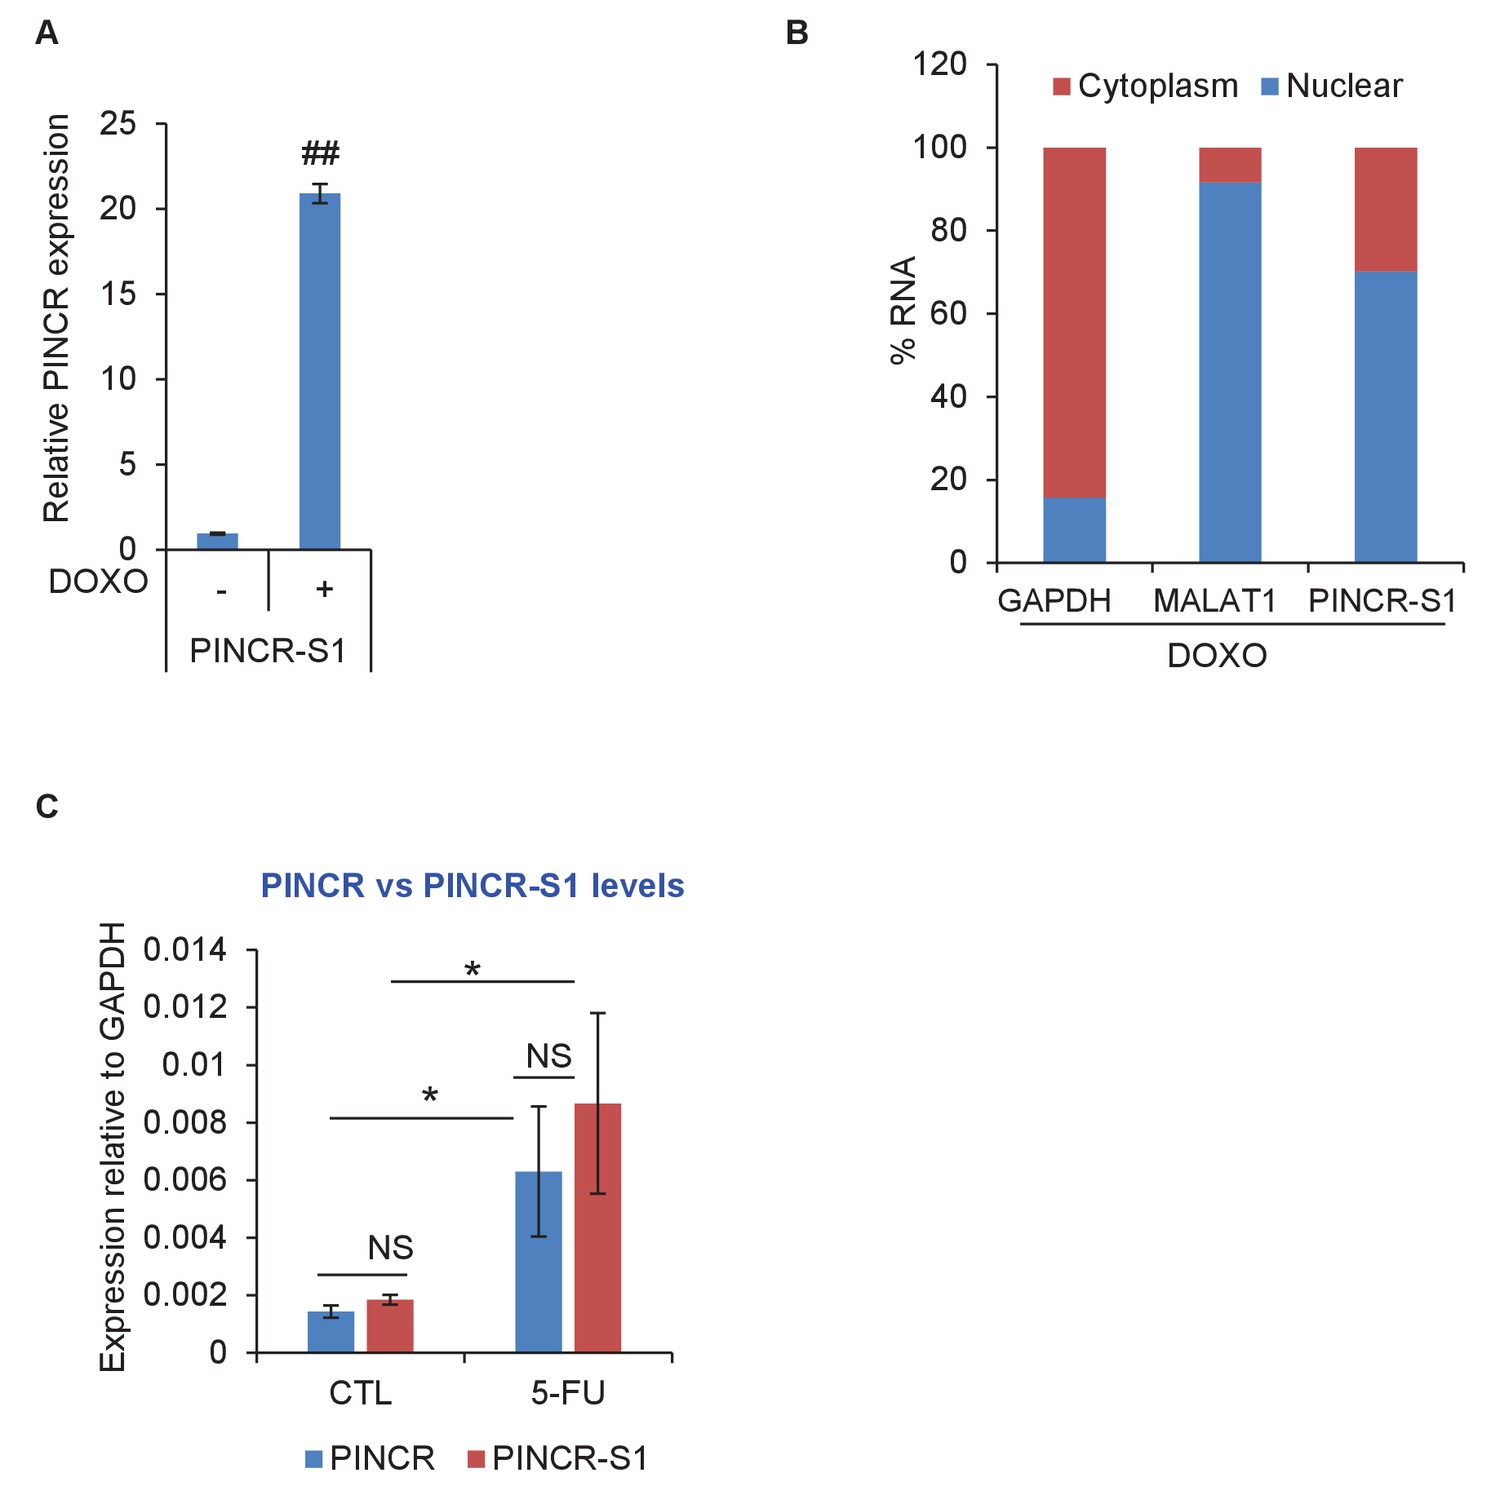
PINCR-S1 is strongly induced after DNA damage and is a predominantly nuclear lncRNA.
(A) PINCR-S1 cells were left untreated or treated with DOXO for 16 hr and the extent of induction of PINCR-S1 RNA was assessed by qRT-PCR. (B) qRT-PCR for PINCR, the cytoplasmic GAPDH and nuclear MALAT1 was performed from nuclear and cytoplasmic fractions of PINCR-S1 cells treated with DOXO for 16 hr. (C) The expression of endogenous PINCR and endogenous PINCR-S1 relative to GAPDH was measured by qRT-PCR from HCT116 cells or PINCR-S1 HCT116 cells untreated or treated with 5-FU for 16 hr. Error bars represent SD from three independent experiments. *p<0.05, ##p<0.001.
Figure 8—figure supplement 4
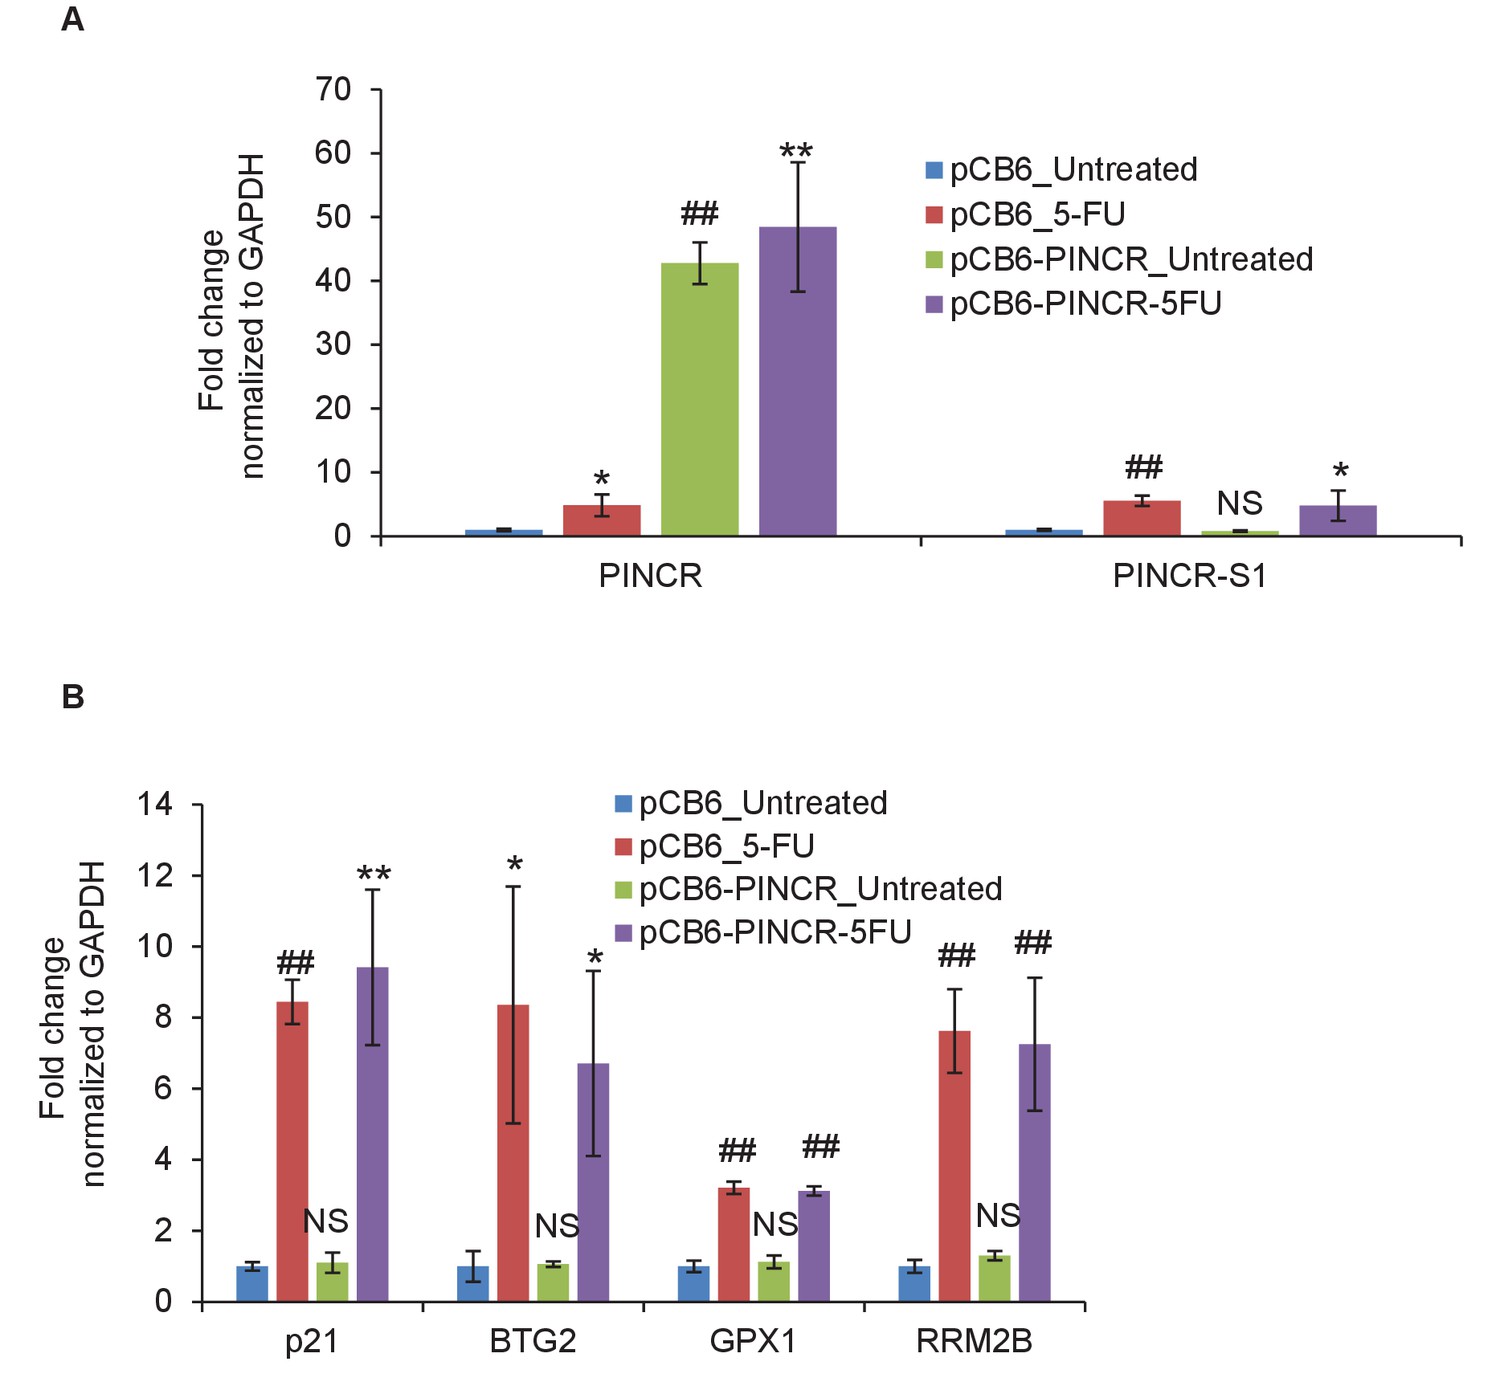
Over-expression of PINCR in PINCR-S1 cells does not alter PINCR-S1 expression or the induction of PINCR targets.
(A, B) PINCR-S1 HCT116 cells were transfected with pCB6 or pCB6-PINCR for 48 hr and then left untreated or treated with 5-FU for 16 hr. The expression of PINCR, PINCR-S1, the PINCR targets BTG2, GPX1 and RRM2B and the negative control p21, was measured by qRT-PCR normalized to GAPDH. Error bars represent SD from three independent experiments. *p<0.05, **p<0.005, ##p<0.001.
Figure 8—figure supplement 5
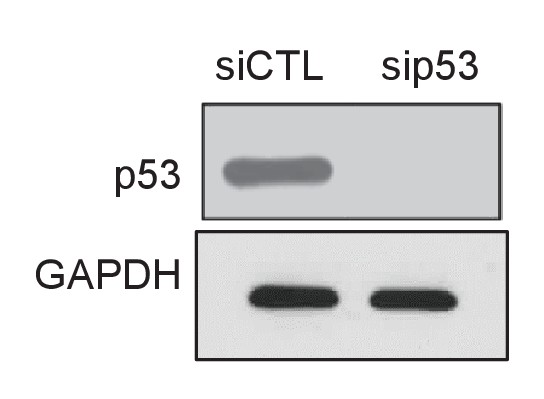
p53 knockdown in PINCR-S1 cells.
PINCR-S1 HCT116 cells were reverse transfected with CTL or p53 siRNAs for 48 hr and immunoblotting was performed from whole cell lysates after treating the transfected cells with 5-FU for 16 hr. GAPDH was used as loading control.
-
Figure 8—figure supplement 5—source data 1
p53 immunoblot for Figure 8—figure supplement 5.
- https://doi.org/10.7554/eLife.23244.061
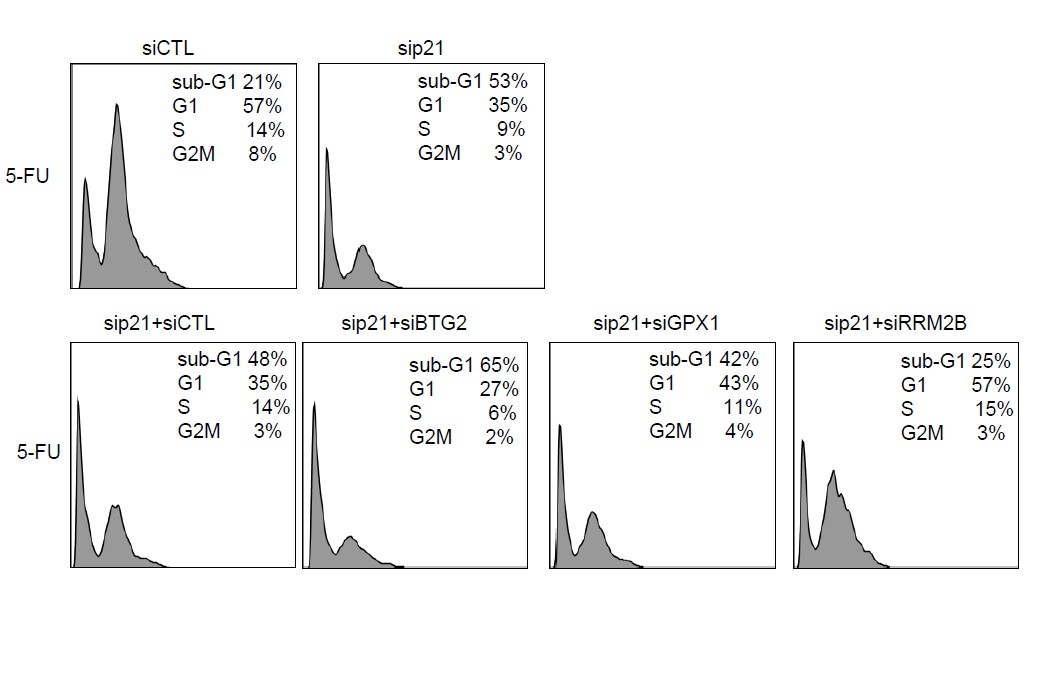
Author response image 1
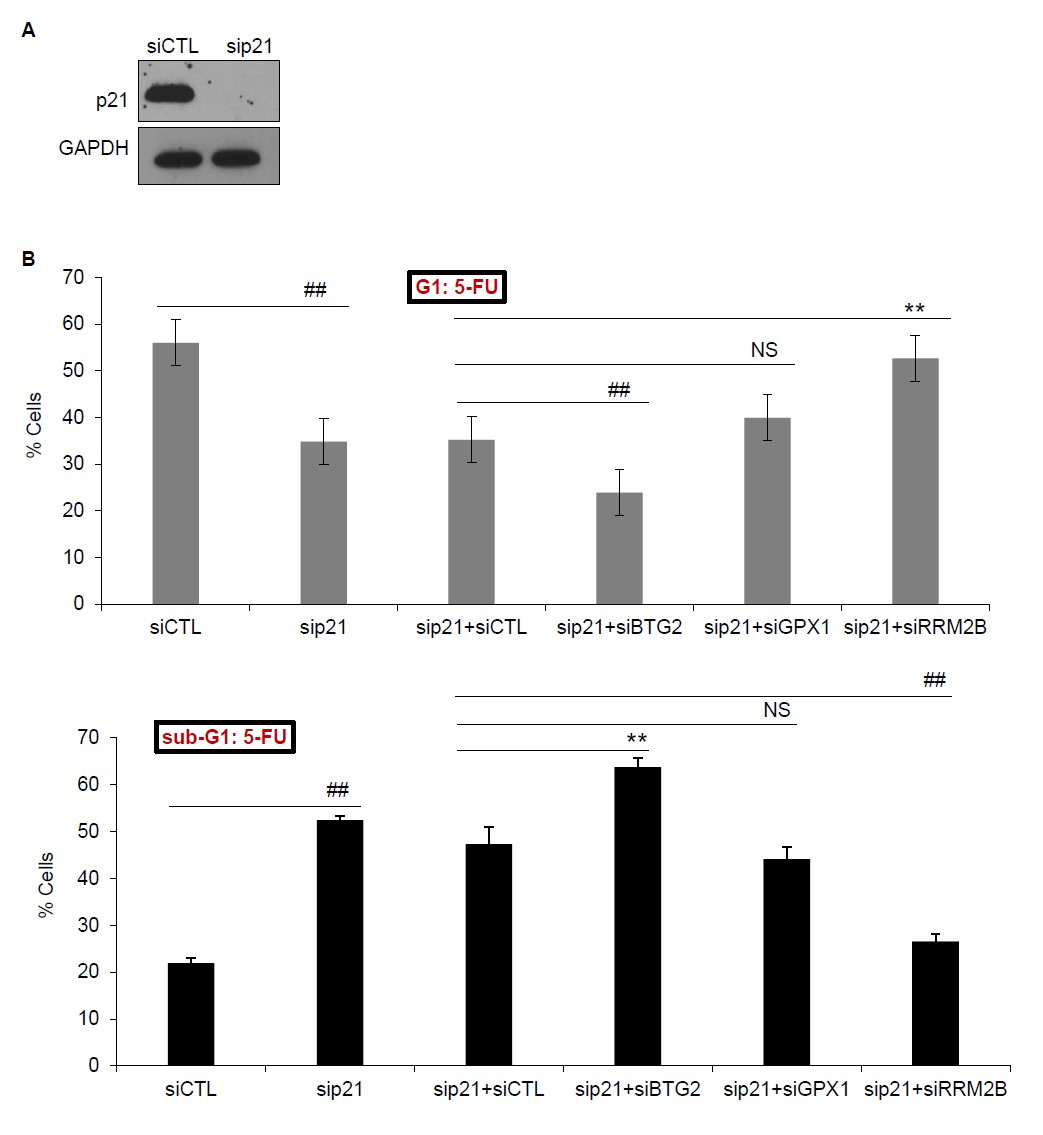
(A) PINCR-WT HCT116 cells were transfected with CTL siRNA (siCTL) or p21 siRNAs (sip21) for 48 hr and p21 knockdown was measured by immunoblotting. GAPDH was used as loading control. (B) PINCRWT HCT116 cells were transfected for 48 hr with siCTL or sip21 or co-transfected with sip21 and siCTL or siBTG2 or siGPX1 or siRRM2B. PI-staining and FACS analysis was performed after 48 hr of 5-FU treatment. Error bars represent SD from three biological replicates. *p<0.05; #p<0.01; **p<0.005; ##p<0.001.
Author response image 2
Raw cell cycle profiles from a representative experiment for Author response image 1.
https://doi.org/10.7554/eLife.23244.069
Author response image 3
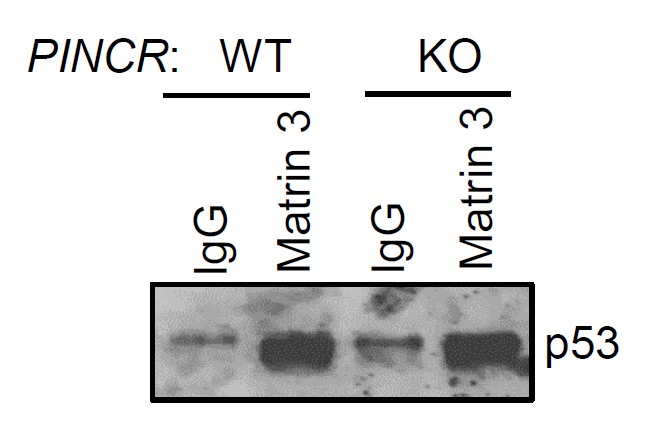
PINCR-WT and PINCR-KO HCT116 cells were treated with 5-FU for 48 hr and the interaction between p53 and Matrin 3 was assessed by immunoblotting for p53 following IgG or Matrin 3 IP.
https://doi.org/10.7554/eLife.23244.070Additional files
-
Supplementary file 1
Transcripts induced upon Nutlin treatment of parental HCT116, RKO and SW48 cells.
- https://doi.org/10.7554/eLife.23244.062
-
Supplementary file 2
LncRNAs induced after Nutlin treatment in HCT116, RKO and SW48 cells.
- https://doi.org/10.7554/eLife.23244.063
-
Supplementary file 3
Microarray analysis from PINCR-WT and PINCR-KO cells untreated or treated with 5-FU (100 uM).
‘KO’ refers to PINCR-KO and WT refers to PINCR-WT. ‘FC’ refers to fold change. The 11 genes regulated by PINCR and also p53 are shown in red.
- https://doi.org/10.7554/eLife.23244.064
-
Supplementary file 4
Mass spectrometry analysis from RNA pulldowns.
PSM refers to peptide-spectrum match. Proteins enrcihed at least twofold in the PINCR pulldowns as compared to Luciferase pulldowns under untreated condition (Unt) and Doxorubicin treatment (DOXO) are shown. To obtain a non-zero fold change a value of ‘1’ was assigned to the PSM if it was zero.
- https://doi.org/10.7554/eLife.23244.065
-
Supplementary file 5
Sequence of primers.
- https://doi.org/10.7554/eLife.23244.066
-
Supplementary file 6
Sequence of guide RNAs.
- https://doi.org/10.7554/eLife.23244.067
Download links
A two-part list of links to download the article, or parts of the article, in various formats.
Downloads (link to download the article as PDF)
Open citations (links to open the citations from this article in various online reference manager services)
Cite this article (links to download the citations from this article in formats compatible with various reference manager tools)
Prosurvival long noncoding RNA PINCR regulates a subset of p53 targets in human colorectal cancer cells by binding to Matrin 3
eLife 6:e23244.
https://doi.org/10.7554/eLife.23244


