Mitochondrial flashes regulate ATP homeostasis in the heart
- Peking-Tsinghua Center for Life Sciences, Peking University, China
- The Fourth Military Medical University, China
Figures
Figure 1 with 1 supplement
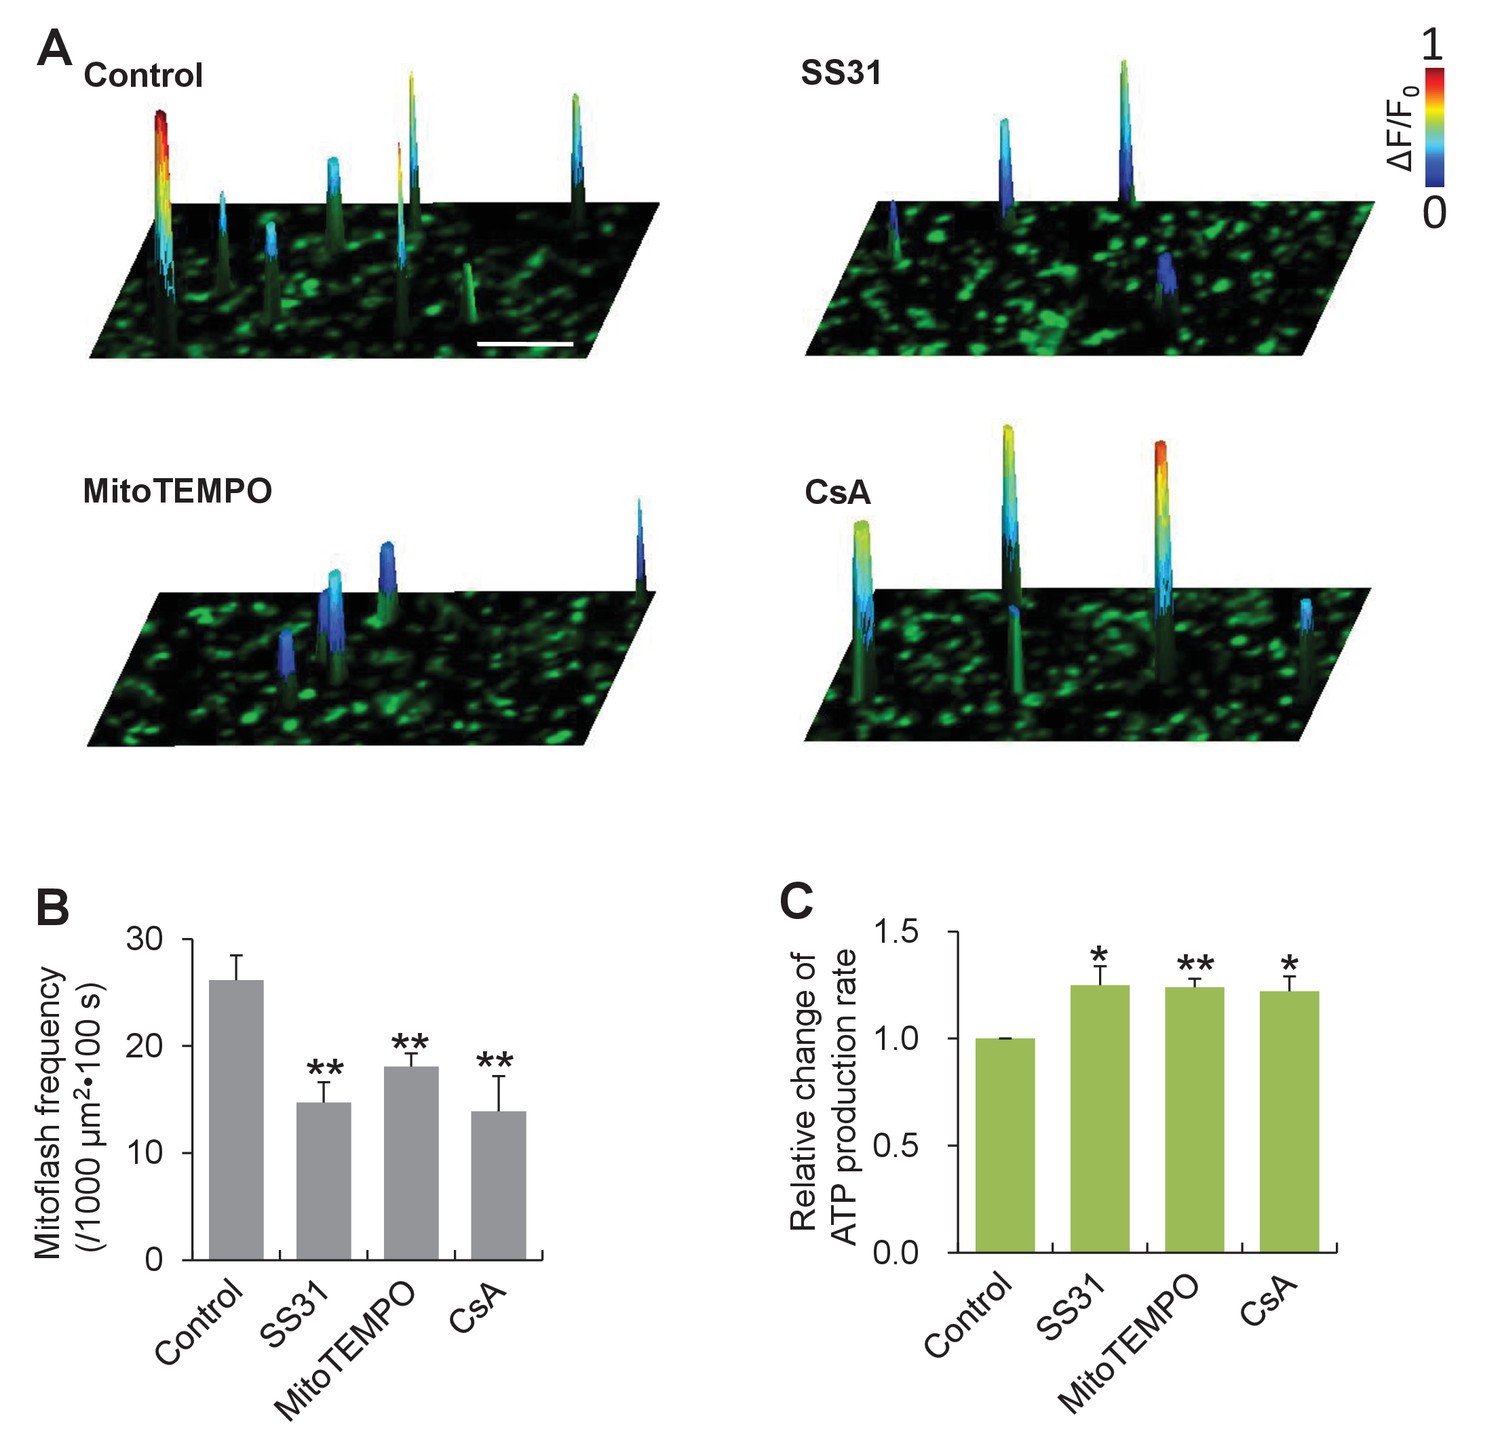
Mitoflashes negatively regulate ATP production in isolated cardiac mitochondria.
(A) Inhibition of mitoflashes by mitochondrial targeted antioxidants, mitoTEMPO (1 μM) or SS31 (50 μM), and the mPTP inhibitor CsA (2 μM). Surface plots show mitoflashes registered in 60 s periods overlaying the respective confocal images. A spike indicates a mitoflash event. Scale bar: 10 μm. (B) Statistics of mitoflash frequency. n = 9–22 image files per group; **p<0.01 versus control. (C) Mitochondrial ATP production measured with the luciferin luminescence assay. Data are expressed as fold-change relative to control group. n = 6 experiments per group; *p<0.05; **p<0.01 versus control.
-
Figure 1—source data 1
Source data for Figure 1.
This file contains raw source data used to make the graphs presented in Figure 1B, Figure 1C and Figure 1—figure supplement 1. Excel software was used to graph all the quantitative data and perform statistical analyses. Student’s t-test was applied to determine the statistical significance.
- https://doi.org/10.7554/eLife.23908.004
Figure 1—figure supplement 1

Averaged traces of mitoflashes aligned by onset.
Data were from isolated cardiac mitochondria treated with mitochondrial targeted antioxidants, SS31 (50 μM) or mitoTEMPO (1 μM), or the mitochondrial permeability transition pore inhibitor CsA (2 μM). n = 117–169 events per group. Note that no significant changes in amplitude or kinetic properties of individual mitoflashes were found.
Figure 2
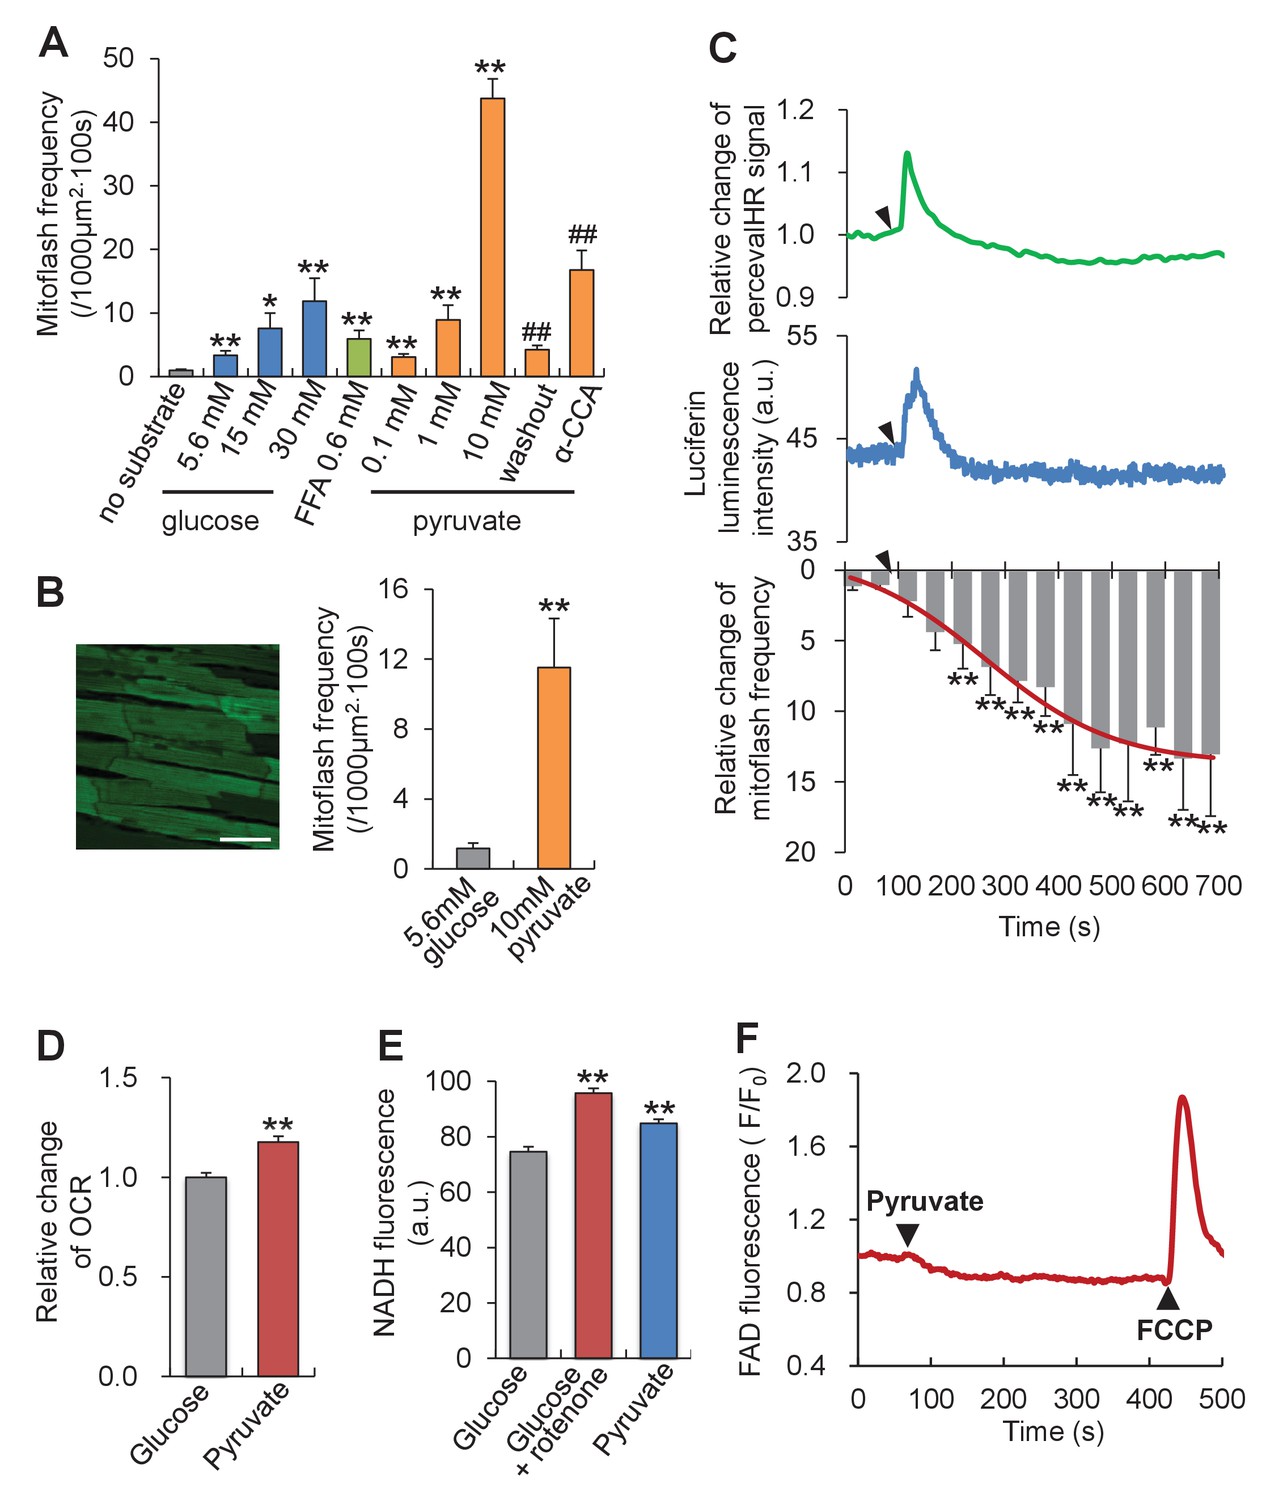
Mitoflash and ATP responses to metabolic stimulation in adult cardiac myocytes.
(A) Mitoflash frequencies in the presence of different metabolic substrates. n = 14–39 cells per group. *p<0.05; **p<0.01 versus substrate-free group; ##p <0.01 versus 10 mM pyruvate group. FFA, free fatty-acid. Here we used 0.6 mM palmitate. (B) Pyruvate (10 mM) stimulation of mitoflashes in perfused heart. Left: Confocal image of epimyocardium in an mt-cpYFP transgenic mouse heart under Langendorff perfusion. Scale bar, 50 μm. Right: statistics. n = 13 cells from three hearts. **p<0.01 versus 5.6 mM glucose group. (C) Time-resolved ATP/ADP ratio (top, indexed by PercevalHR signal change, n = 39 cells), ATP content (middle, indexed by luciferin luminescence, n = 26 cells), and mitoflash frequency (bottom) in response to pyruvate stimulation (10 mM). Arrow heads indicate the time of adding pyruvate. a.u., arbitrary units. The pH-corrected PercevalHR signal is reported as the normalized fluorescence ratio. The smooth curve overlaying the time-course of the mitoflash frequency was drawn by eye. n = 7 cells per datum point; **p<0.01 versus basal conditions. (D) Changes of oxygen consumption rate (OCR) upon pyruvate stimulation (10 mM). n = 5 independent experiments. **p<0.01 versus 5.6 mM glucose group. (E) Changes in NADH content. As a positive control, inhibition of complex I, which oxidizes NADH into NAD+, by 1 μM rotenone increased NADH autofluorescence. n = 54–67 cells per group. **p<0.01 versus 5.6 mM glucose group. a.u. arbitrary units. (F) FAD autofluorescence upon 10 mM pyruvate stimulation. The trace is the averaged data from 16 cells. Arrow heads indicate the time of adding pyruvate or FCCP. Note that a decrease of FAD indicates an increase of FADH2.
-
Figure 2—source data 1
Source data for Figure 2.
This file contains raw source data used to make the graphs presented in Figure 2A–2F. Excel software was used to graph all the quantitative data and perform statistical analyses. Student’s t-test was applied to determine the statistical significance.
- https://doi.org/10.7554/eLife.23908.007
Figure 3 with 1 supplement

Mitoflash and ATP responses to workload changes in adult cardiac myocytes.
(A) Electrical pacing suppressed mitoflash activity. Top: Space-time plots of mitoflashes right before, during, and right after 1 Hz electrical pacing in a cardiac myocyte in the presence of 10 mM pyruvate. Each plot shows events registered in 10 s periods. Scale bar, 10 μm. Middle: Continuous recordings of cell length and Ca2+ transients. Downward and upward deflections indicate cell shortenings and Ca2+ transients reported by Rhod-4 fluorescence, respectively. Bottom: Raster plots of mitoflash incidence in three representative cells subject to the pacing protocol. (B) Inverse relationship between the incidence of mitoflashes during pacing and the pacing frequency at 10 mM pyruvate. n = 12–17 cells per group. **p<0.01 versus resting group. (C) Inverse relationship between the mitoflash frequency during pacing and the pacing frequency at 5.6 mM glucose. n = 8–27 cells per group. *p<0.05; **p<0.01 versus resting group. (D) Real-time measurement of cellular ATP content with the luciferin luminescence assay (n = 37 cells) and ATP/ADP ratio with PercevalHR (n = 8 cells) during pacing at different frequencies. a.u., arbitrary units. The pH-corrected PercevalHR signal is reported as the normalized fluorescence ratio. (E–G) Effects of β-adrenergic stimulation and EGTA treatment on mitoflash activity (E), ATP content (measured with Mg2+-Green) (F), and ATP/ADP ratio (G). Isoproterenol (ISO; 1 μM) or 5 mM EGTA in 0 Ca2+ Tyrode’s solution was used to alter Ca2+ cycling and hence cellular energy expenditure in quiescent cardiac myocytes in 10 mM pyruvate. For panel D, n = 13–19 cells per group. *p<0.05; **p<0.01 versus control. For panel E, n = 7–15 cells per group. For panel F, n = 6–9 cells per group.
-
Figure 3—source data 1
Source data for Figure 3.
This file contains raw source data used to make the graphs presented in Figure 3A–3G. Excel software was used to graph all the quantitative data and perform statistical analyses. Student’s t-test was applied to determine the statistical significance.
- https://doi.org/10.7554/eLife.23908.009
Figure 3—figure supplement 1
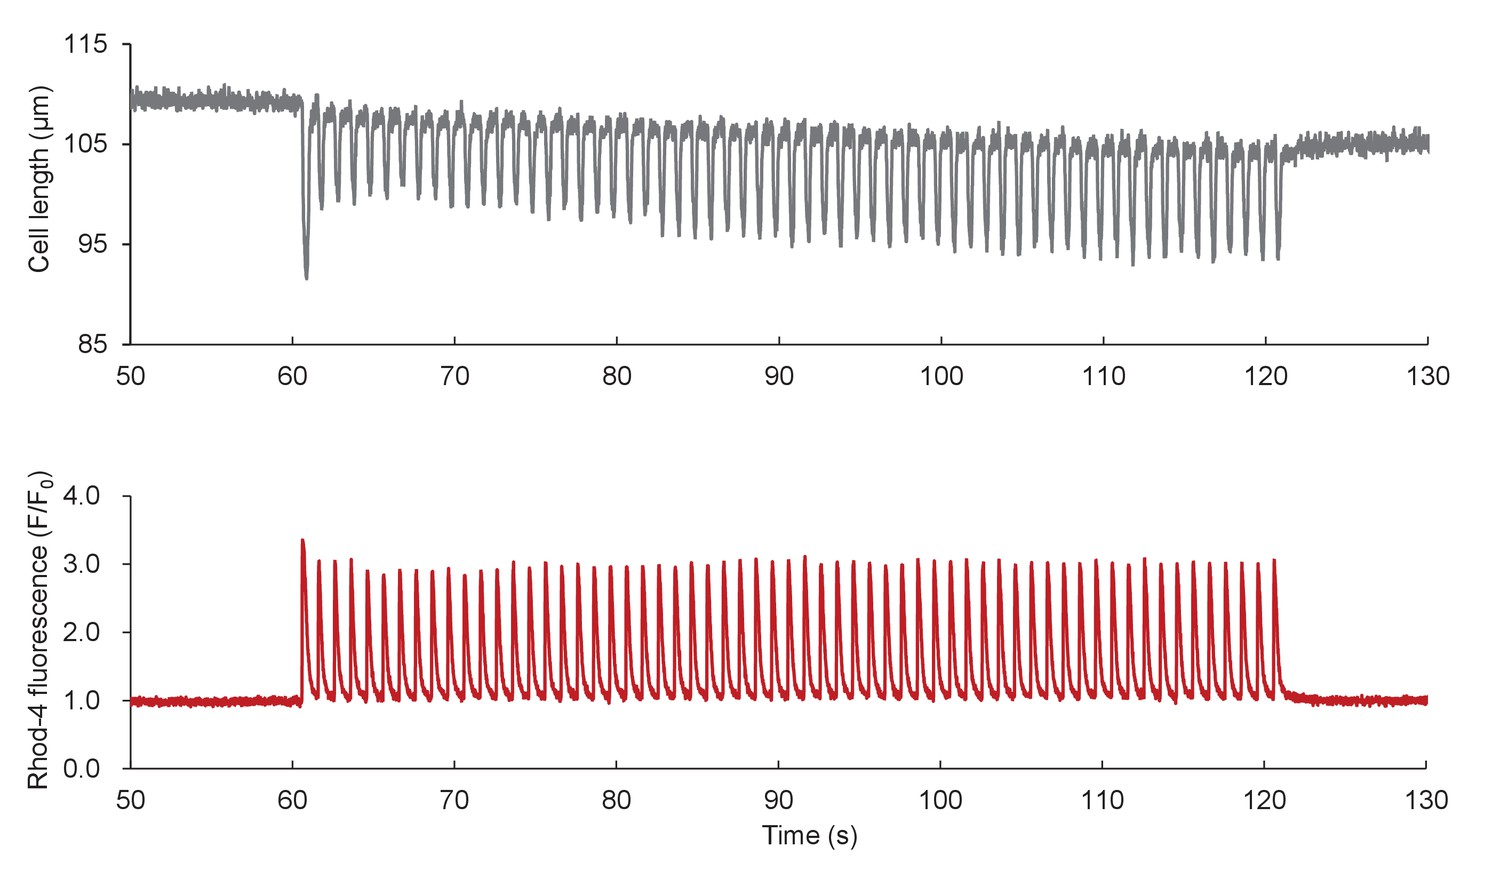
Ca2+ transients and cell shortenings elicited by electrical pacing.
Data from Figure 3A are shown on expanded scales.
Figure 4
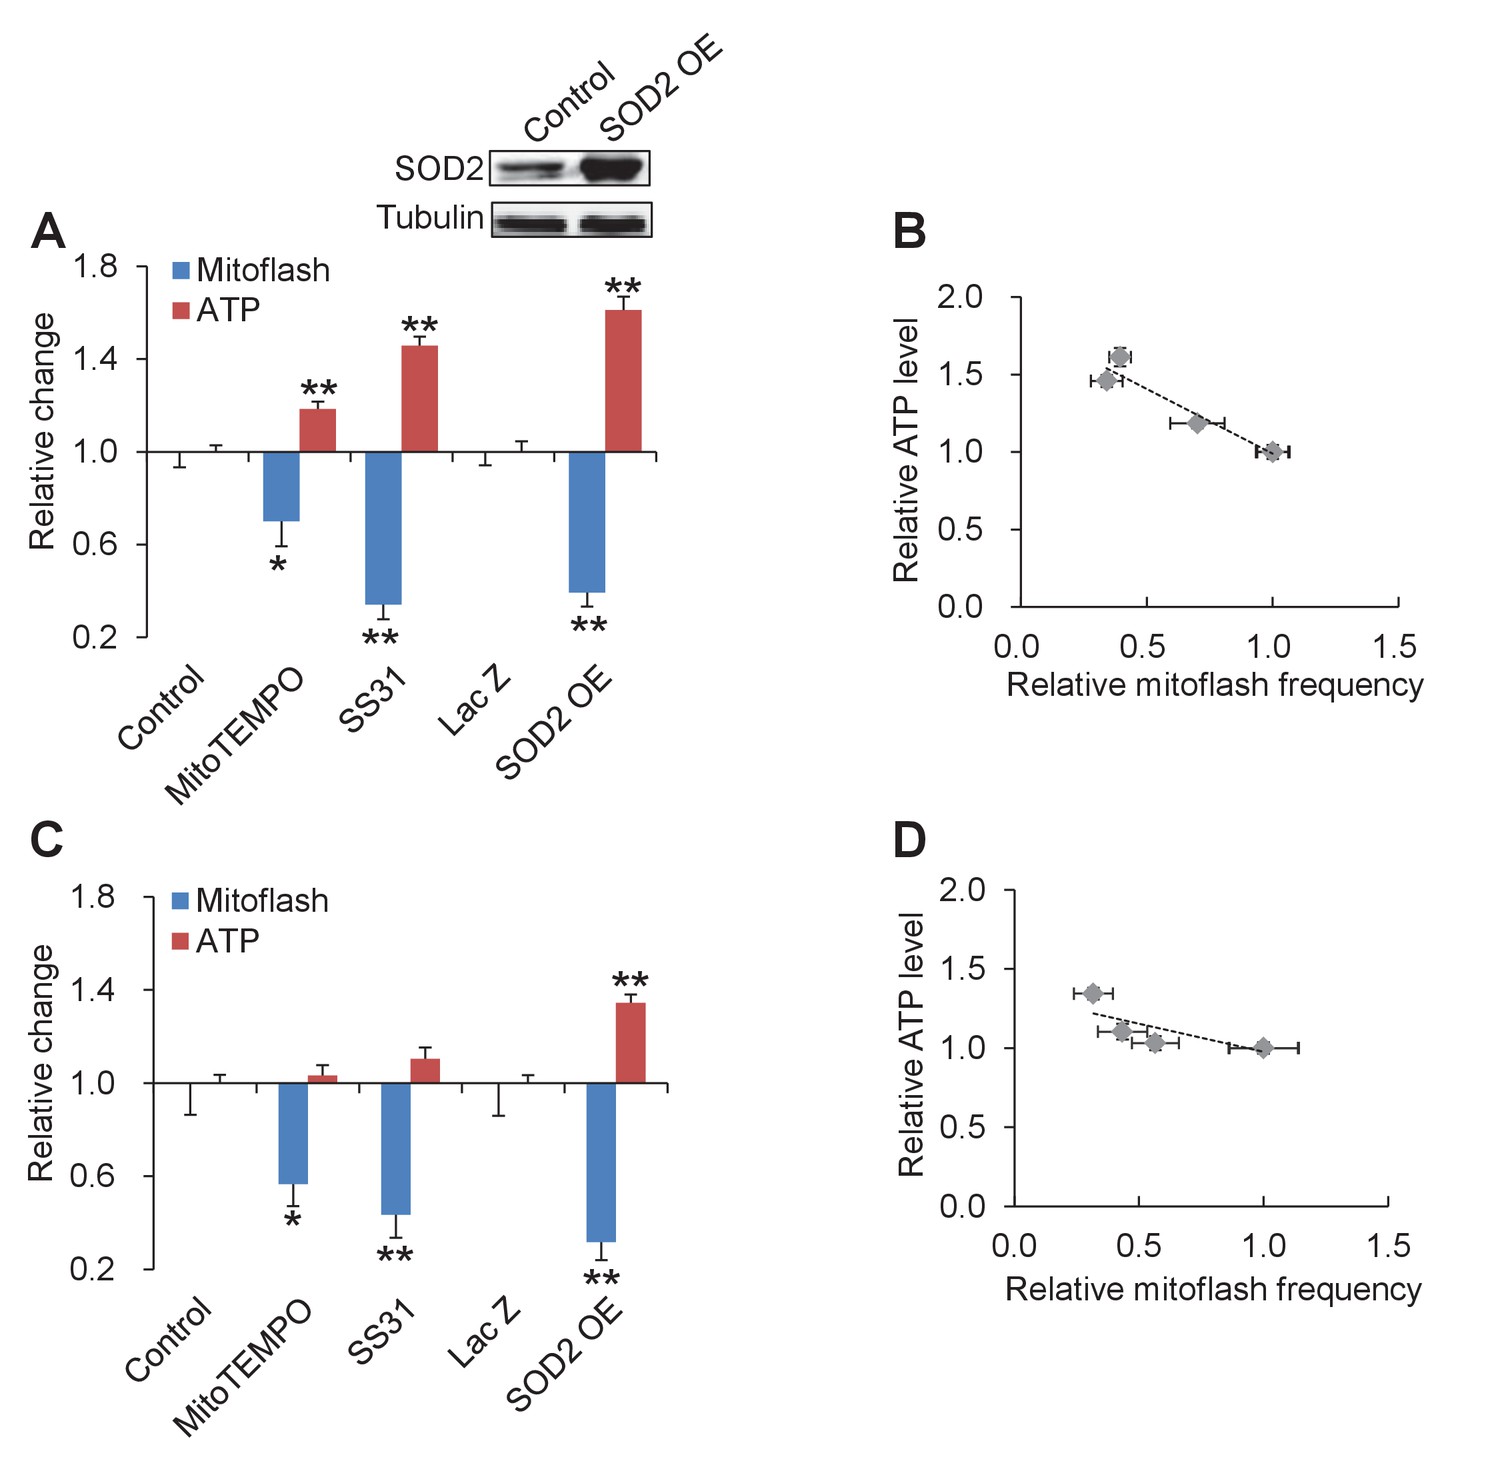
Tuning mitoflash frequency shifts cellular atp set-point.
(A) In the presence of 10 mM pyruvate, mitoflash activity was manipulated by mitoTEMPO (1 μM), SS31 (100 μM), or SOD2 overexpression (SOD2 OE). n = 17–51 cells per group for mitoflash detection. n = 169–488 cells per group for ATP measurement with the luciferin luminescence assay. *p<0.05; **p<0.01 versus control. For SOD2 OE, Lac Z overexpression (Lac Z) was used as the control. Data are expressed as fold-change relative to respective control group. Inset shows a representative western-blot of SOD2. (B) Inverse relation between ATP content and mitoflash frequency. Dashed line shows the linear regression yielding. r = −0.96, p=0.009. (C) As in (A), except that data were obtained in 5.6 mM glucose. n = 15–36 cells per group for mitoflash detection and 98–531 cells per group for ATP measurement. *p<0.05; **p<0.01 versus control or LacZ. (D) Linear regression analysis of (C) (r = −0.79, p=0.11).
-
Figure 4—source data 1
Source data for Figure 4.
This file contains raw source data used to make the graphs presented in Figure 4. Excel software was used to graph all the quantitative data and perform statistical analyses. Student’s t-test was applied to determine the statistical significance. Prism linear regression analysis was used to investigate the correlation between mitoflash activity and ATP content. The coefficient of determination (R2) was used to evaluate the goodness of fit of the linear regression model.
- https://doi.org/10.7554/eLife.23908.012
Figure 5 with 5 supplements
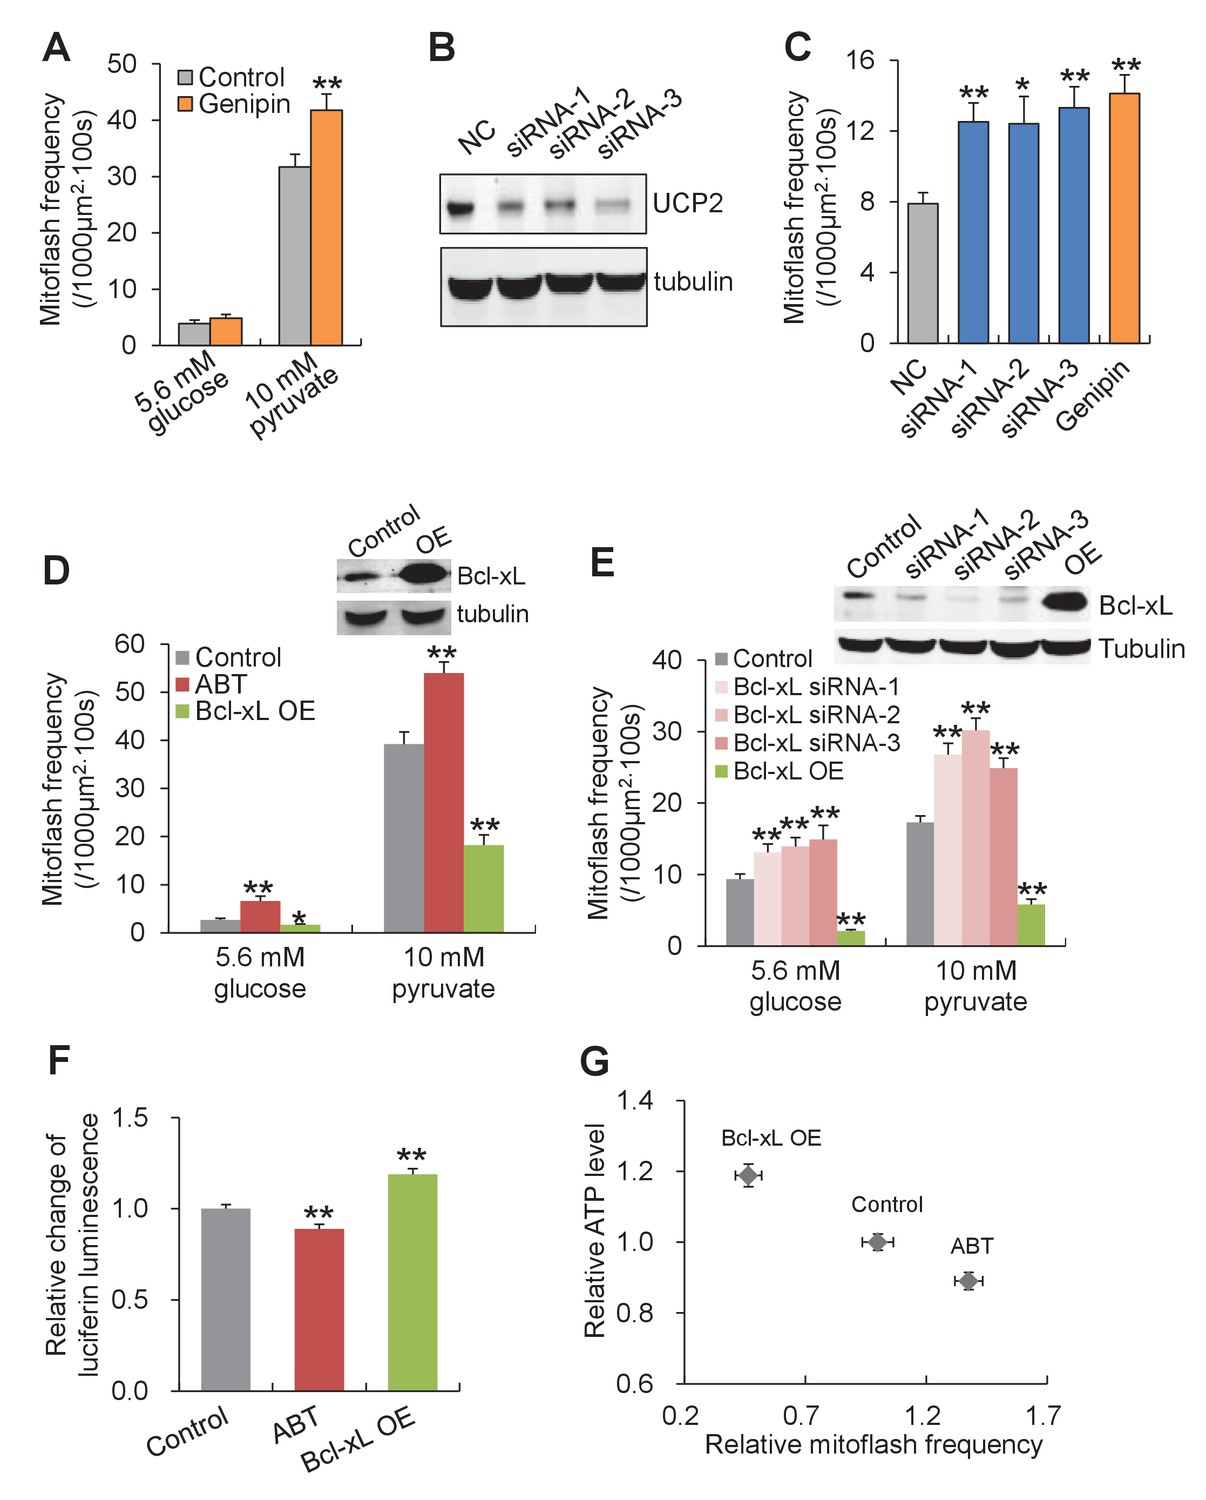
Proton leakage through F1Fo-ATPase, not UCP2, triggers mitoflashes.
(A–C) Effect of UCP2 knockdown and inhibition on mitoflashes. (A) Slight change of mitoflash frequency after UCP2 inhibition with genipin (50 μM). n = 12 adult cardiac myocytes per group. **p<0.01 versus control. (B) Representative western-blot for UCP2 knockdown in neonatal cardiac myocytes. (C) Effects of UCP2 knockdown or genipin treatment (50 μM) on mitoflash activity in neonatal cardiac myocytes. n = 28–42 cells per group. *p<0.05; **p<0.01 versus NC. (D) Mitoflash activity altered by Bcl-xL inhibition or overexpression (OE) in adult cardiac myocytes. Bcl-xL was inhibited by ABT-737 (ABT, 10 μM). Inset shows representative western-blot for Bcl-xL overexpression. n = 33–37 cells per group. *p<0.05; **p<0.01 versus control. (E) Activation of mitoflashes by Bcl-xL knockdown in neonatal cardiac myocytes. Three double-strand small RNAs (siRNA-1, siRNA-2, siRNA-3) targeted to Bcl-xL or a negative control siRNA (control) were transfected. Inset shows representative western-blot analysis for Bcl-xL knockdown. n = 22–60 cells per group. *p<0.05; **p<0.01 versus control. (F) Effects of Bcl-xL inhibition or overexpression on ATP content. Adult cardiac myocytes were in 10 mM pyruvate containing solution. n = 203–363 cells per group. **p<0.01 versus control. (G) Inverse relation between ATP content and mitoflash frequency in the presence of 10 mM pyruvate.
-
Figure 5—source data 1
Source data for Figure 5.
This file contains raw source data used to make the graphs presented in Figure 5A, Figure 5C–5G, Figure 5—figure supplement 1A–D, Figure 5—figure supplement 2A–C, Figure 5—figure supplement 3, Figure 5—figure supplement 4A–C, and Figure 5—figure supplement 5. Excel software was used to graph all the quantitative data and perform statistical analyses. Student’s t-test was applied to determine the statistical significance.
- https://doi.org/10.7554/eLife.23908.014
Figure 5—figure supplement 1
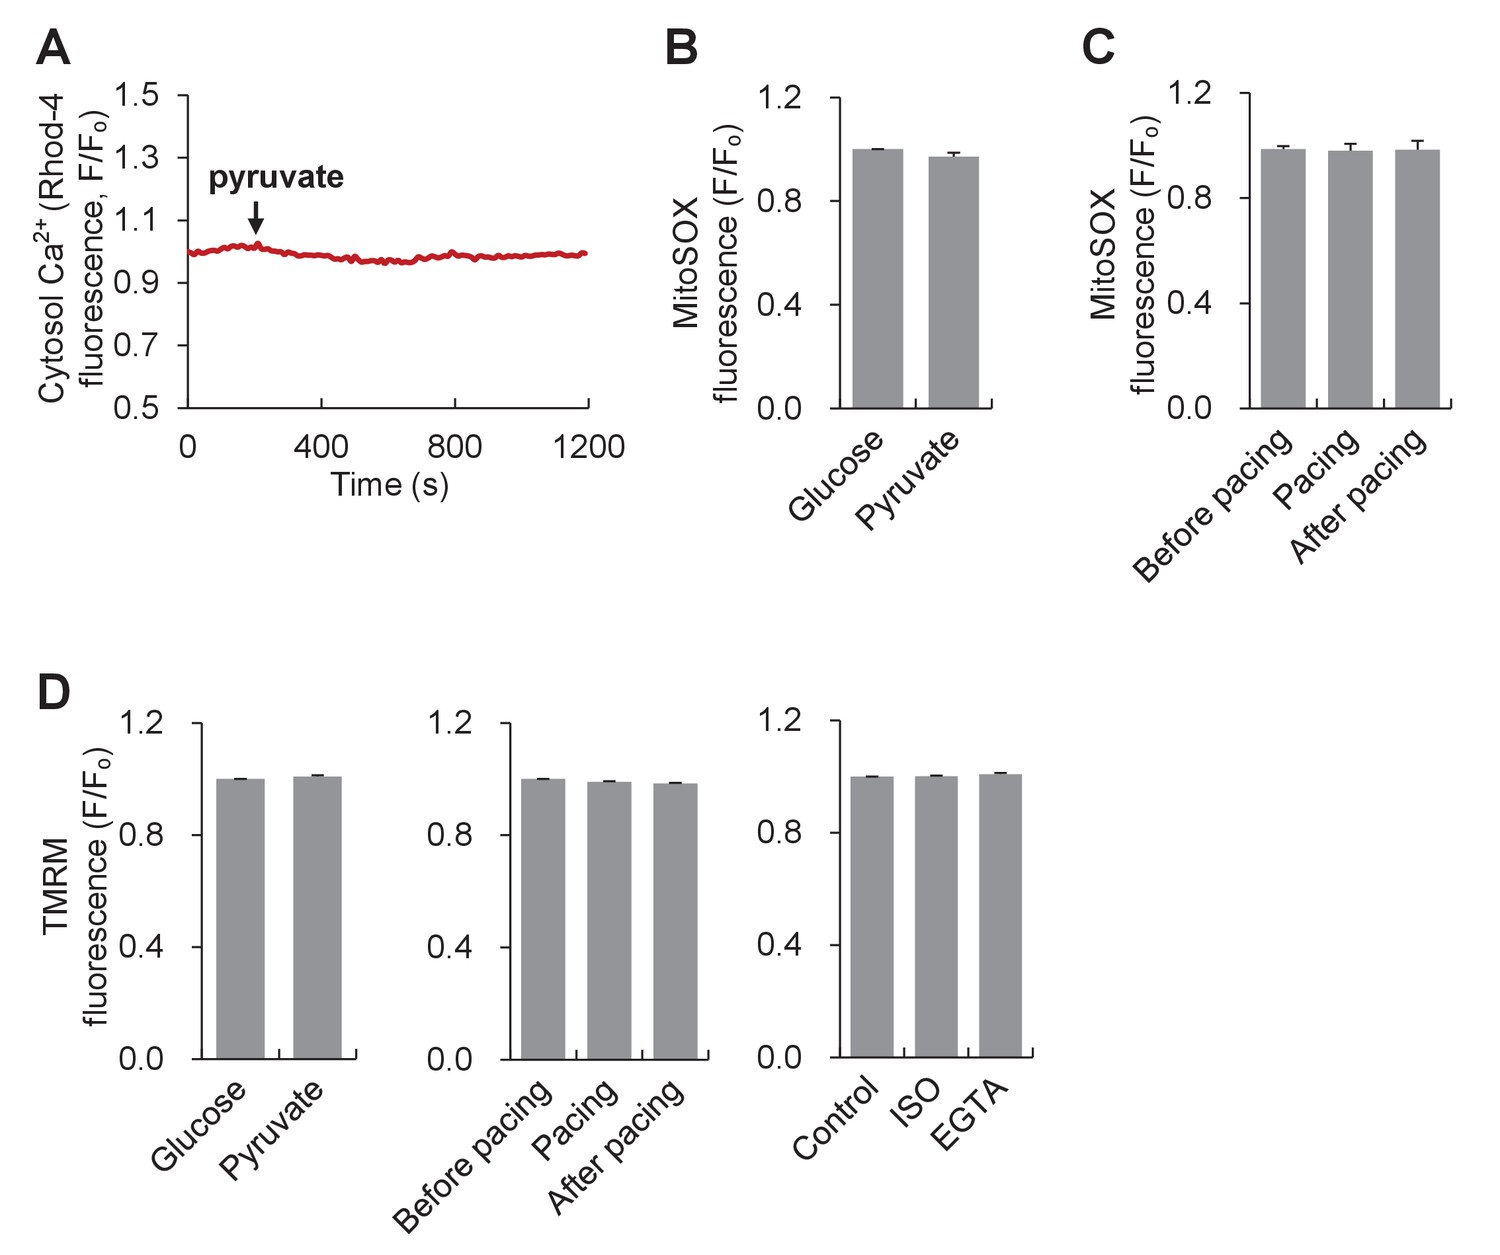
Ca2+, basal ros and mitochondrial membrane potential in adult cardiac myocytes responding to pyruvate stimulation or workload alterations.
(A) Cytosolic Ca2+ response to 10 mM pyruvate stimulation. The cytosolic Ca2+ was measured with Rhod-4. Arrow indicates the time of adding pyruvate. The trace shows the average result from 8 cells. (B) Effect of 10 mM pyruvate stimulation on mitochondrial basal ROS measured with mitoSOX. n = 22 cells per group. (C) Effect of electrical pacing on mitochondrial basal ROS. n = 20 cells. (D) TMRM measurements of ΔΨm in different experimental conditions. n = 66–79 cells per group.
Figure 5—figure supplement 2
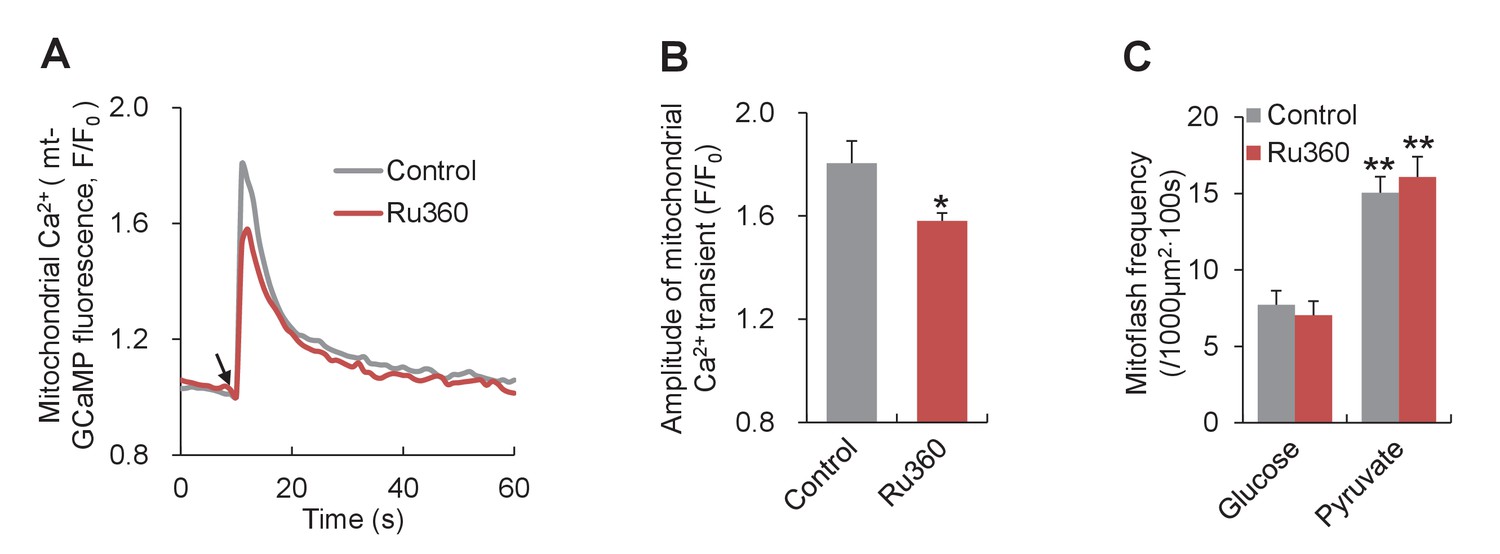
Effect of inhibiting MCU on mitoflashes in neonatal cardiac myocytes.
Ru360 (5 μM) was used to inhibit MCU and mitochondrial Ca2+ uptake was measured with mitochondrial targeted GCaMP5 (mt-GCaMP5). (A) Averaged traces of Ca2+ transients stimulated by 10 mM caffeine. Arrow indicates the time of caffeine application. n = 25 cells for control group and n = 93 cells for Ru360 group. (B) Statistics for the amplitude of Ca2+ transients in (A). *p<0.05 versus control. (C) Lack of effect of Ru360 on mitoflashes. n = 25–31 cells per group. **p<0.01 versus glucose group.
Figure 5—figure supplement 3
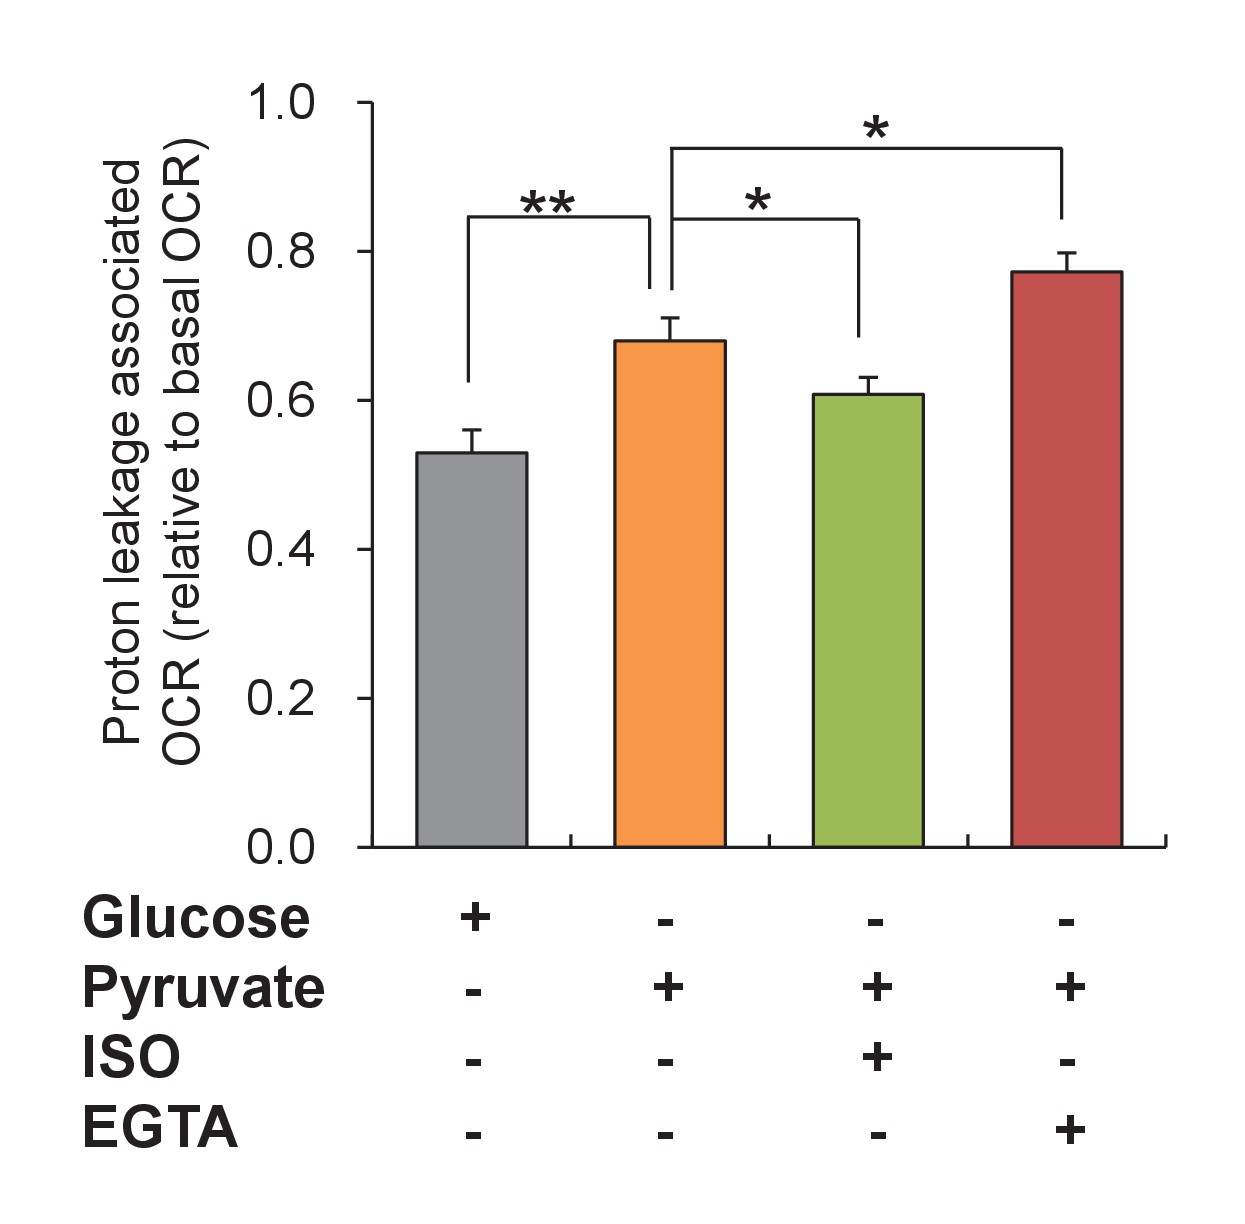
Changes of uncoupled proton leakage by altering ATP supply and demand.
Mitochondrial proton leakage was indexed by the ATP synthesis-uncoupled oxygen consumption rate (OCR) in mouse adult cardiac myocytes. 10 mM pyruvate stimulation was used to increase ATP supply. Isoproterenol (ISO, 1 μM) and 5 mM EGTA in nominal 0 Ca2+ solution (EGTA) were used to increase and decrease ATP expenditure, respectively. n = 15–21 experiments per group. *p<0.05; **p<0.01.
Figure 5—figure supplement 4
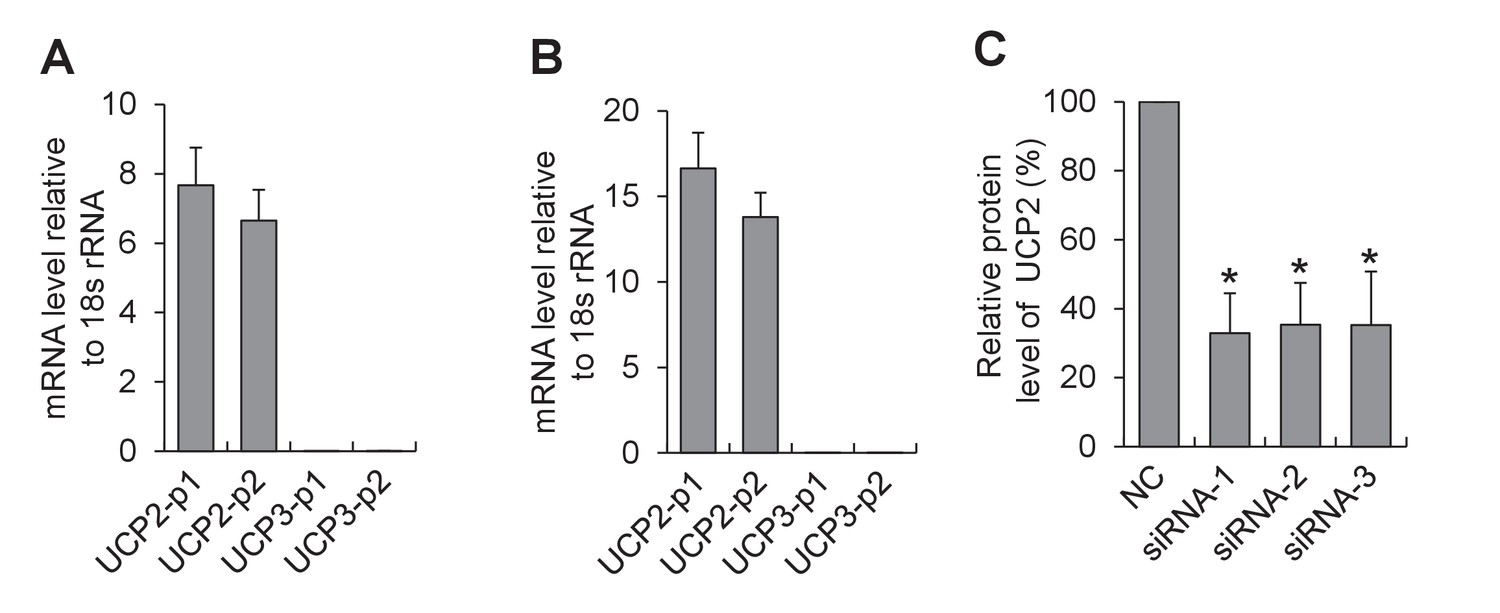
Expression of UCP isoforms in cardiac myocytes.
(A,B) Quantitative real-time PCR analysis for the expression of UCP2 and UCP3 in adult (A) and neonatal cardiac myocytes (B). Two pairs of primers were designed for either UCP2 (UCP2-p1 and UCP2-p2) or UCP3 (UCP3-p1 and UCP3-p2). n = 6 experiments. Note that UCP2 is the dominant isoform expressed in the heart. (C) Western-blot analysis for siRNA knockdown of UCP2. Neonatal cardiac myocytes were transfected with one of the three double-stranded small RNAs (siRNA-1, siRNA-2, or siRNA-3) targeted to UCP2 or a negative control siRNA (NC) and cultured for 72 hr. n = 3 experiments. *p<0.05 versus NC.
Figure 5—figure supplement 5

Western-blot analysis of Bcl-xL Knockdown.
Neonatal cardiac myocytes were transfected with three double-strand small RNAs (siRNA-1, siRNA-2, siRNA-3) targeted to Bcl-xL or a negative control siRNA (NC) and cultured for 72 hr. n = 3 experiments. *p<0.05; **p<0.01 versus NC.
Figure 6
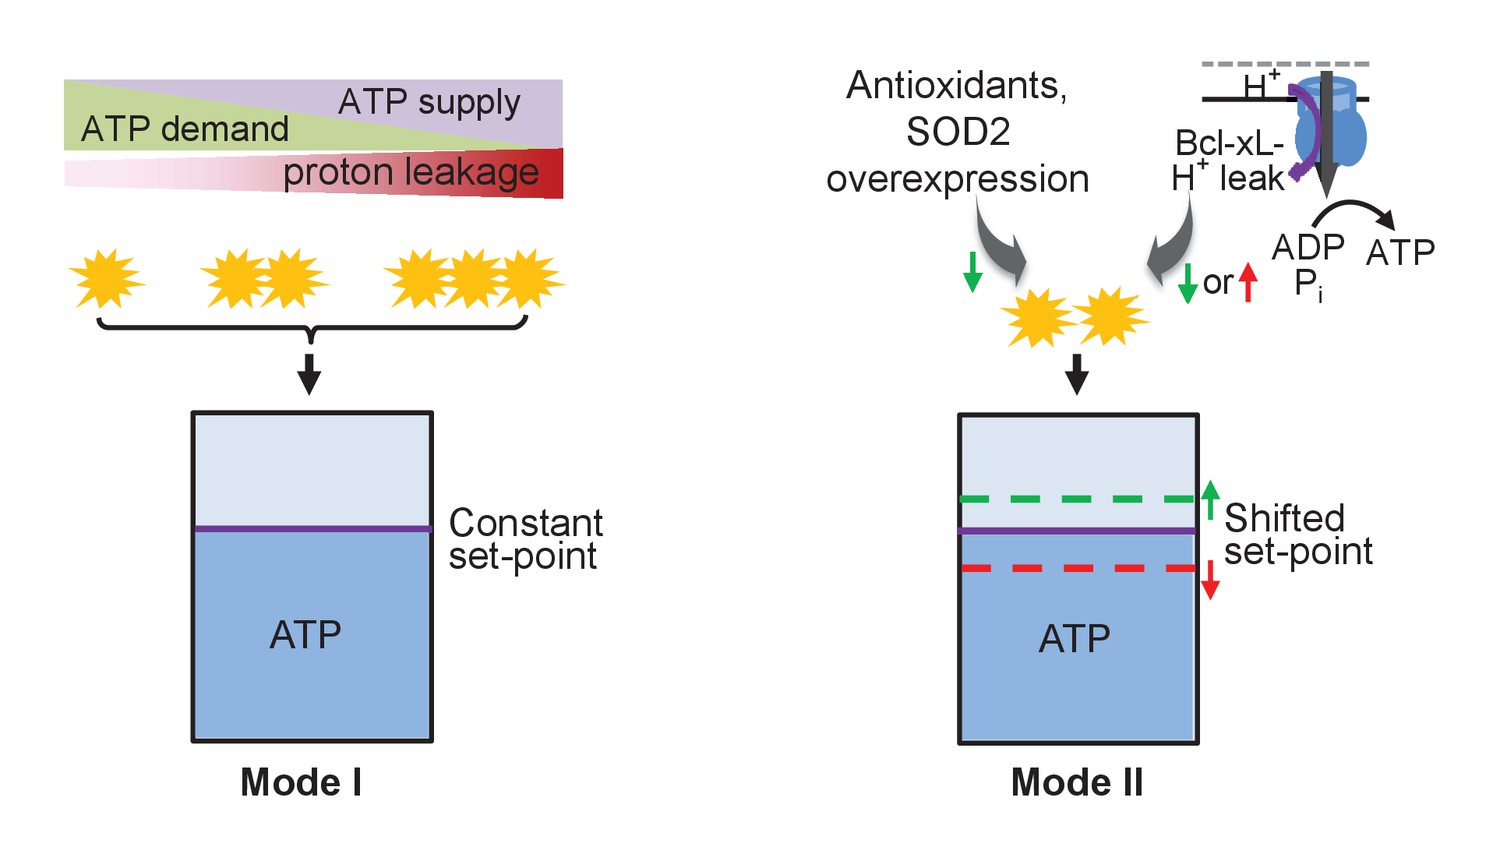
Schematic of mitoflash regulation of ATP set-point.
In mode I, mitoflash activity, which is triggered by ATP synthesis-uncoupled proton leakage, waxes and wanes in accordance with fluctuations in ATP supply or demand, and whereby stabilizes the ATP set-point at a constant level. In mode II, selective tuning of the mitoflash activity (e.g., Bcl-xL-regulated proton leakage through F1Fo-ATP synthase, or antioxidant repression of mitoflash activity) suffices to shift the ATP set-point upward (at decreased mitoflash activity) or downward (at increased mitoflash activity).
Author response image 1
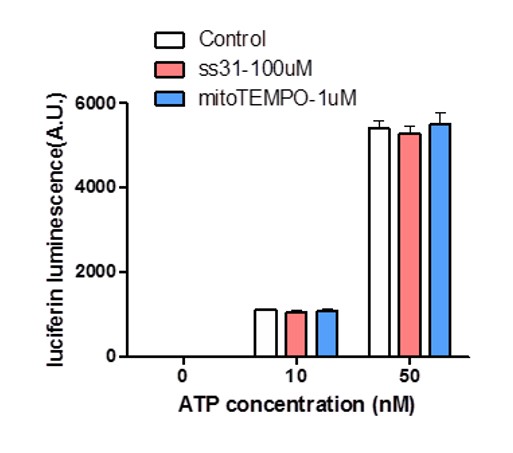
Effect of SS31 or mitoTEMPO on ATP measurement.
10 nM and 50 nM ATP standards were used in the luciferin luminescence assay with or without adding SS31 (100 μM) or mitoTEMPO (1 μM). n = 4 independent experiments.
Author response image 2

Inhibition of mitoflashes by oligomycin.
The adult cardiomyocytes were stimulated by 10 mM pyruvate. 5 μM oligomycin were applied to treat the cells for 30 min before mitoflash detection. n = 12-22 cells for either group. ** p <0.01 versuscontrol.
Download links
A two-part list of links to download the article, or parts of the article, in various formats.
Downloads (link to download the article as PDF)
Open citations (links to open the citations from this article in various online reference manager services)
Cite this article (links to download the citations from this article in formats compatible with various reference manager tools)
Mitochondrial flashes regulate ATP homeostasis in the heart
eLife 6:e23908.
https://doi.org/10.7554/eLife.23908


