Shigella entry unveils a calcium/calpain-dependent mechanism for inhibiting sumoylation
- Institut Pasteur, France
- INSERM, U993, France
- INSERM, U786, France
Figures
Figure 1 with 2 supplements
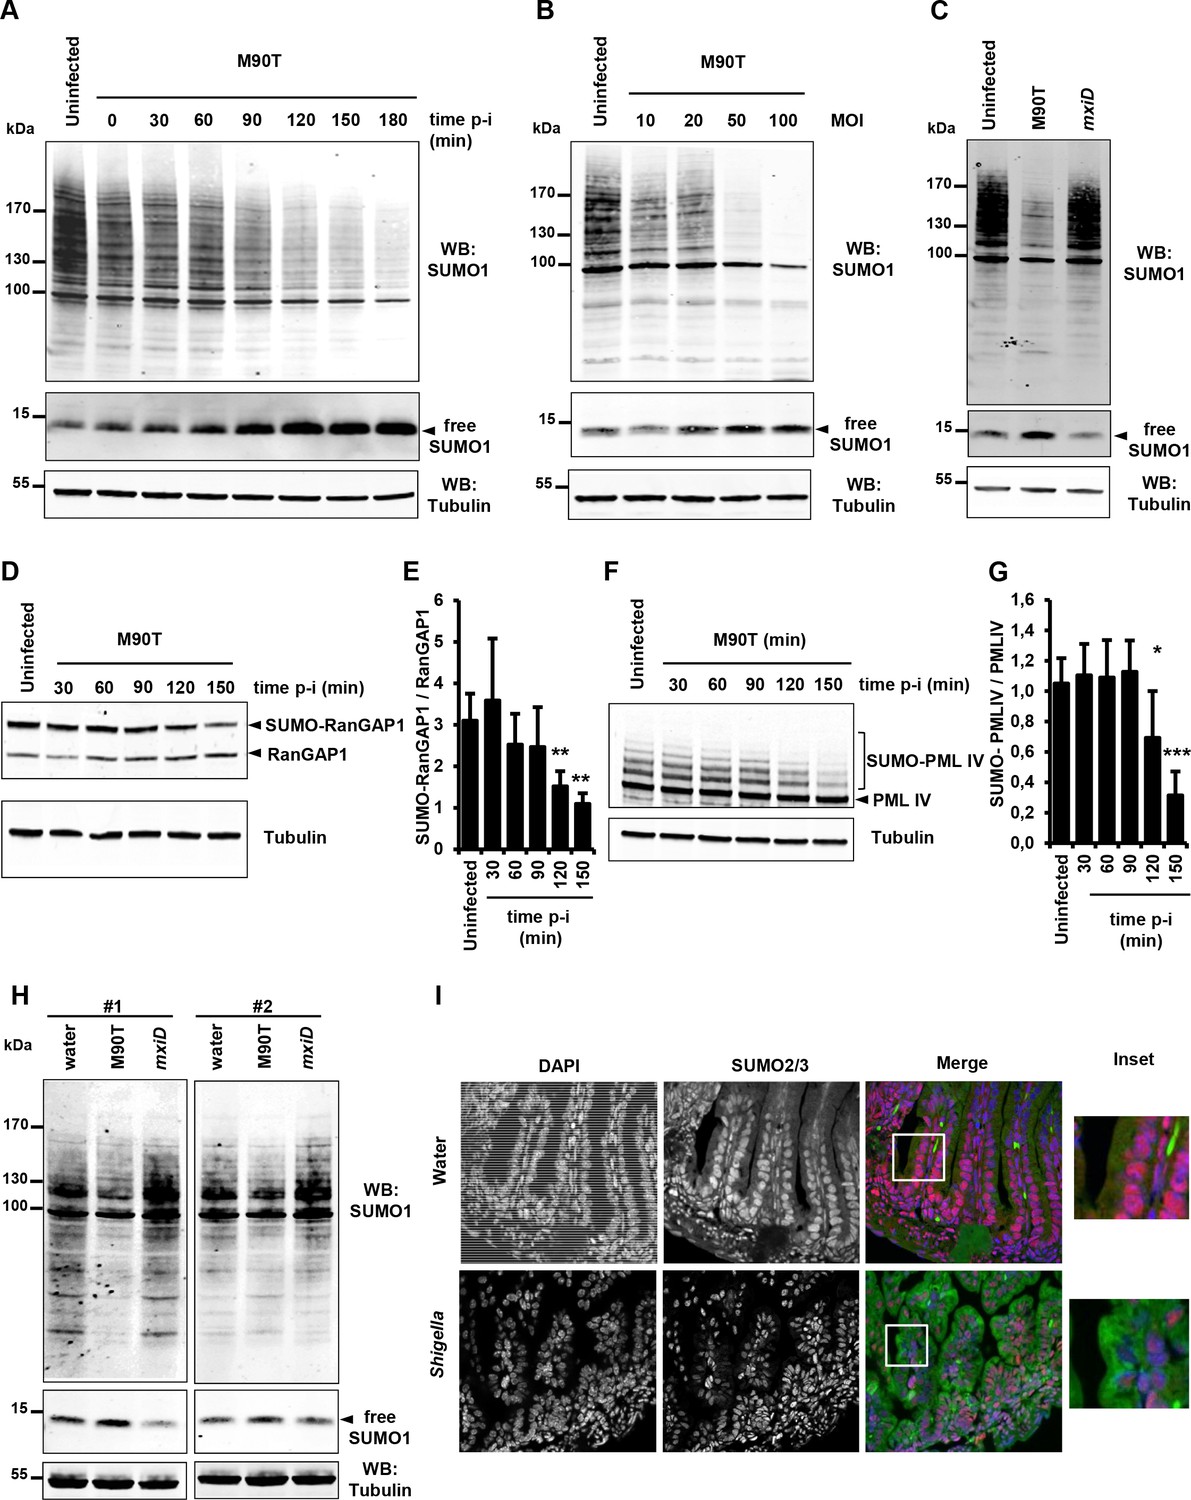
Shigella infection induces a massive loss in SUMO conjugates in vitro and in vivo.
(A) SUMO1-conjugated protein patterns from uninfected HeLa cells or cells infected with the wild-type Shigella strain M90T for the indicated times. Immunoblot analysis was performed on whole-cell lysates using antibodies specific for SUMO1 isoform and tubulin. p-i: post-infection. (B) SUMO1-conjugated protein patterns from uninfected HeLa cells or cells infected with Shigella for 120 min at the indicated multiplicity of infection (MOI). (C) Global SUMO1 patterns of uninfected HeLa cells or cells infected with M90T or the mxiD non-invasive Shigella for 120 min. (D) Immunoblot analysis of RanGAP1 and SUMO-RanGAP1 levels in HeLa cells infected with M90T for the indicated times. (E) Quantification of the immunoblot signals are presented as SUMO-RanGAP1 signal relative to unmodified RanGAP1 signal (mean of four independent experiments ± s.d., *p<0.05, **p<0.01). (F) Immunoblot analysis of PML-IV and SUMO-PML-IV levels in HT1080 cells stably expressing GFP-PML-IV and infected with M90T for the indicated times. (G) Quantification of the immunoblot signals are presented as SUMO-PML-IV signal relative to unmodified GFP-PML-IV signal (mean of three independent experiments ± s.d., *p<0.05, ***p<0.001). (H) Global SUMO1 patterns of the whole intestine of 4-day-old newborn mice (#1 and #2), 180 min after inoculation of the invasive M90T strain or the non-invasive mxiD mutant. Physiological water was used as a control. Tubulin was used as a loading control. (I) Fluorescence microscopy analysis of the intestinal epithelium on paraffin sections after Shigella infection of newborn mice for 180 min. Physiological water was used as a control. SUMO2/3 appears in red, auto-fluorescence of the intestinal tissue in green and nuclei counterstained with DAPI in blue. White square, inset.
-
Figure 1—source data 1
Quantification of the immunoblot signals relative to Figure 1D–G.
- https://doi.org/10.7554/eLife.27444.006
Figure 1—figure supplement 1
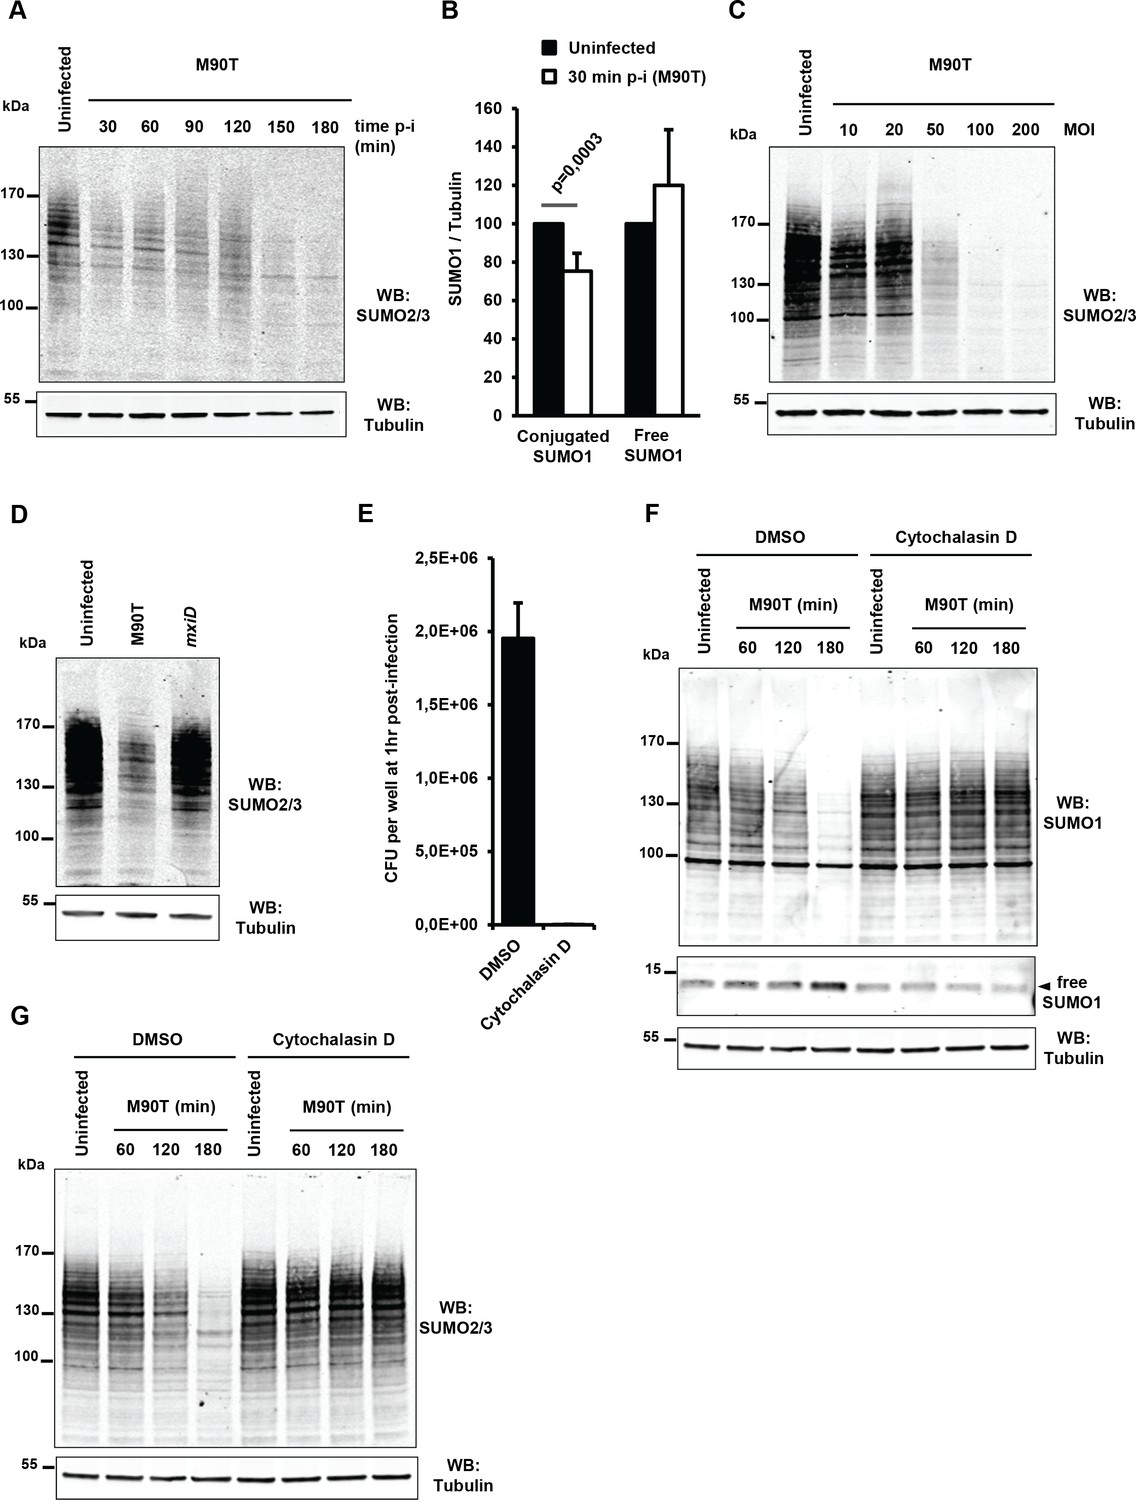
Shigella infection induces a massive loss in SUMO conjugates in vitro and in vivo.
(A) SUMO2/3-conjugated protein patterns from uninfected HeLa cells or cells infected with the wild-type Shigella strain M90T for the indicated times. Immunoblot analysis was performed on whole-cell lysates by using antibodies specific for SUMO2/3 isoforms and tubulin. p-i: post-infection. (B) Quantification of the immunoblot signals in uninfected cells (black bars) or cells infected with the M90T strain for 30 min (white bars) are presented as conjugated SUMO1 (left) or free SUMO1 (right) signals relative to Tubulin signal (mean of four independent experiments ± s.d.) (C) SUMO2/3-conjugated protein patterns from uninfected HeLa cells or cells infected with Shigella for 120 min at the indicated multiplicity of infection (MOI). (D) Global SUMO2/3 patterns of uninfected HeLa cells or cells infected with M90T or the mxiD non-invasive Shigella for 120 min. (E) HeLa cells were treated with vehicle (DMSO) or cytochalasin D, an actin polymerization inhibitor, at 10 μg/mL for 30 min before Shigella infection. Quantification of internalized bacteria at 1 hr p-i was obtained using the gentamicin protection assay and are expressed as the number of colony forming unit (CFU) per well. Data are means ±s.d. of at three independent experiments. (F) HeLa cells were pretreated by vehicle (DMSO) or cytochalasin D (10 μg/mL) for 30 min and then left uninfected or infected with the M90T strain for the indicated times. Immunoblot analysis were performed using anti-SUMO1 and -tubulin antibodies. (G) Immunoblot analysis of the same extracts as panel E performed using anti-SUMO2/3 and -tubulin antibodies.
-
Figure 1—figure supplement 1—source data 1
Source data file relative to Figure 1—figure supplement 1B and E.
- https://doi.org/10.7554/eLife.27444.004
Figure 1—figure supplement 2
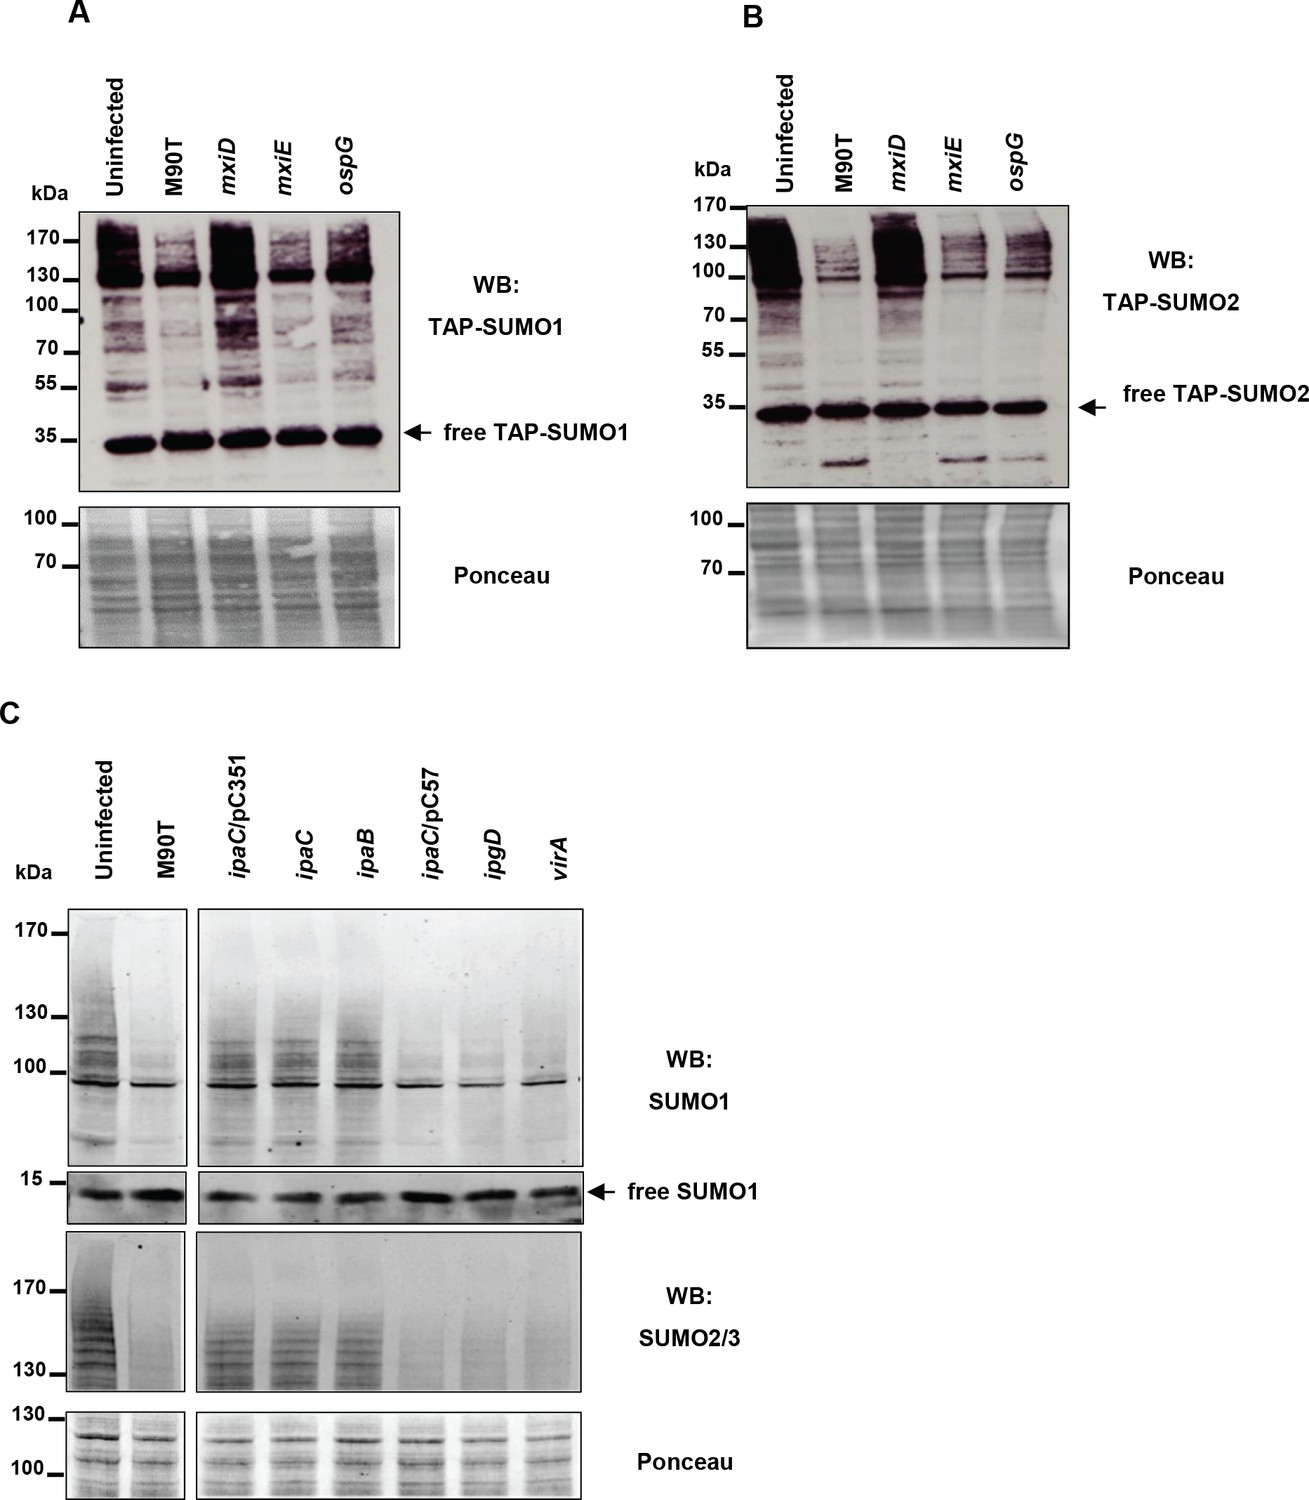
Study of a panel of Shigella mutant strains for their ability to induce a loss in SUMO conjugates.
(A) SUMO1 patterns of HeLa cells stably expressing TAP-SUMO1, uninfected or infected for 120 min with the wild-type Shigella strain M90T or with mxiD, mxiE or ospG mutants. Immunoblot analysis was performed on whole-cell lysates using antibody specific for the TAP tag and ponceau staining was used as a loading control. (B) Same as in A using HeLa cells stably expressing TAP-SUMO2. (C) SUMO1 and SUMO2 patterns of HeLa cells, uninfected or infected for 120 min with the M90T strain or with ipaC/pC351, ipaC, ipaB, ipaC/pC57 or ipgD mutants. Immunoblot analysis was performed on whole-cell lysates using antibodies specific for SUMO1 and SUMO2/3. Ponceau staining was used as a loading control.
Figure 2
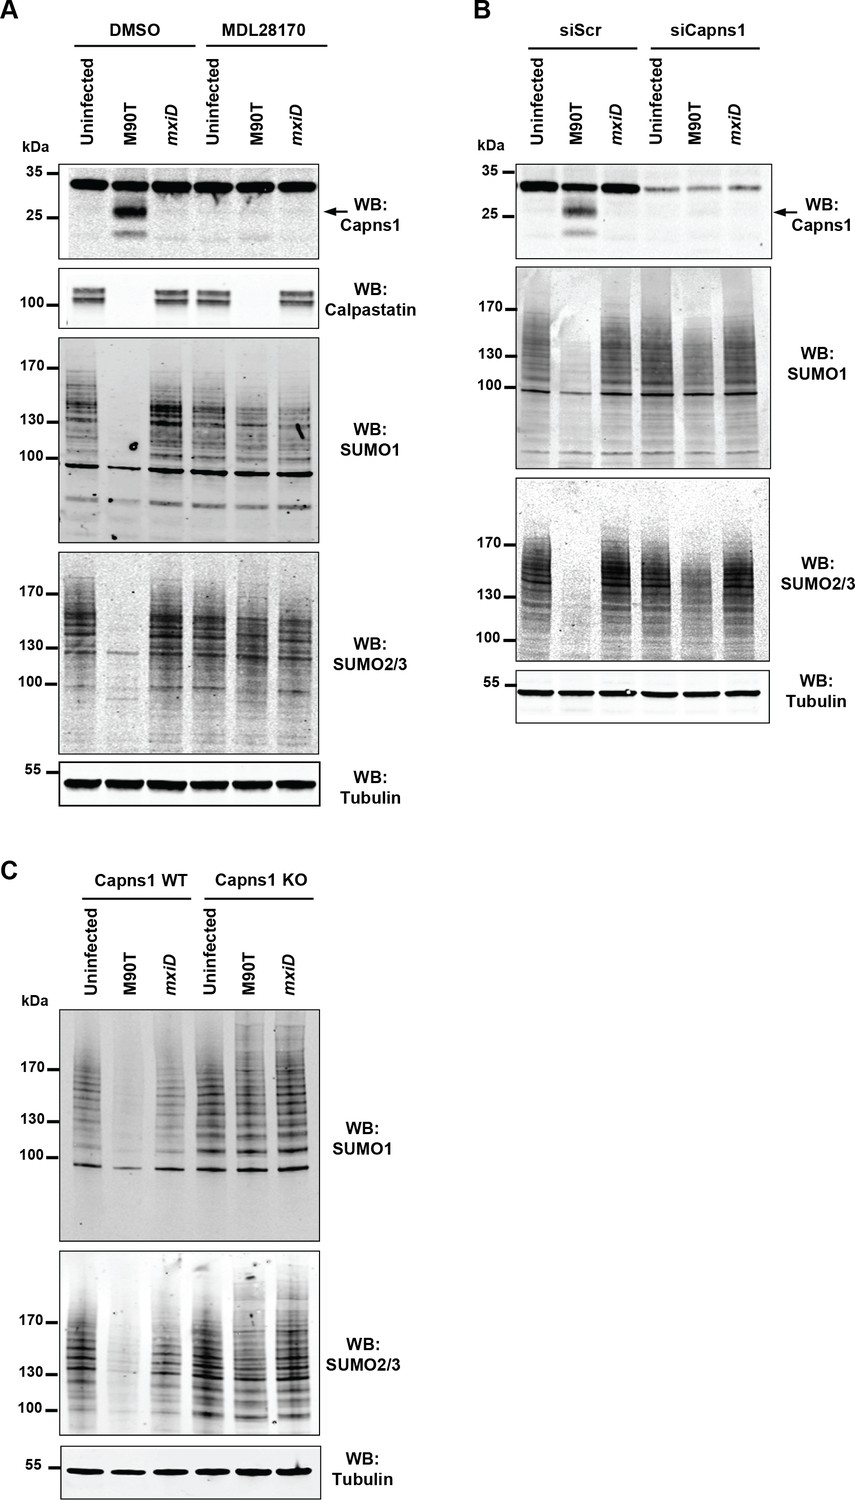
Shigella inhibits sumoylation by a calpain-dependent mechanism.
(A) HeLa cells were pretreated by vehicle (DMSO) or 100 μM MDL28170 for 1 hr and then left uninfected or infected with the M90T strain or the mxiD mutant for 2 hr. Immunoblot analysis were performed using anti-Capns1 (Calpain small subunit 1), -calpastatin, -SUMO1, -SUMO2/3 and -tubulin antibodies. The 18 kDa truncated Capns1 fragment is indicated by an arrow. (B) HeLa cells were treated with control siRNA (siScr) or Capns1 siRNA and then left uninfected or infected with the M90T strain or the mxiD mutant for 2 hr. Immunoblot analysis were performed using anti-Capns1, -SUMO1, -SUMO2/3 and -tubulin antibodies. (C) Capns1+/+ (WT) or Capns1−/− (KO) MEFs were uninfected or infected with the M90T strain or the mxiD mutant for 2 hr. Immunoblot analysis was performed using anti-SUMO1, -SUMO2/3, and -tubulin antibodies.
Figure 3
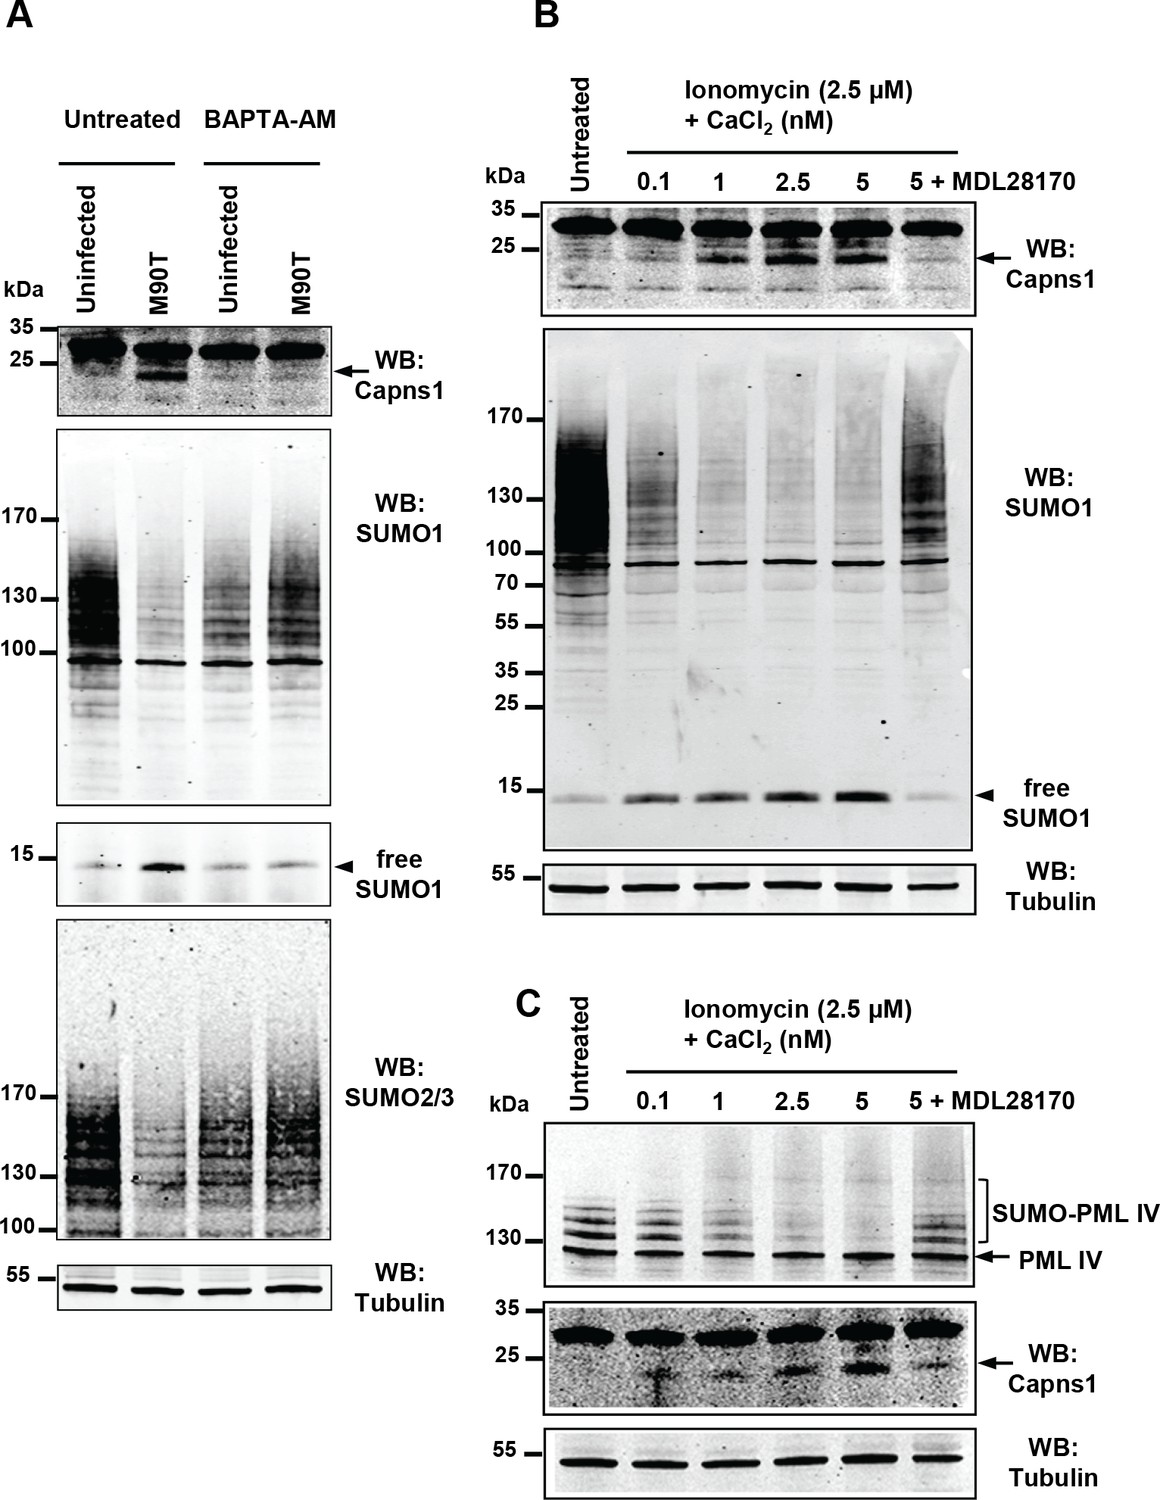
Intracellular calcium levels regulate global sumoylation.
(A) HeLa cells were untreated or pretreated with the calcium-chelating agent BAPTA-AM (10 μM) for 1 hr and then left uninfected or infected with the M90T strain for 2 hr. Immunoblot analysis were performed using anti-Capns1, -SUMO1, -SUMO2/3 and -tubulin antibodies. (B) HeLa cells were untreated or treated with the calcium ionophore ionomycin (2.5 μM) and increasing doses of CaCl2(0.1 to 5 nM) for 30 min, with or without addition of the calpain inhibitor MDL28170 (100 μM). Immunoblot analysis were performed using anti-Capns1, -SUMO1 and -tubulin antibodies. The 18 kDa truncated Capns1 fragment is indicated by an arrow. (C) HT1080 cells, stably expressing GFP-tagged PML-IV, were untreated or treated with ionomycin (2.5 μM) and increasing doses of CaCl2(0.1 to 5 nM) for 30 min, with or without addition of the calpain inhibitor MDL28170 (100 μM). Immunoblot analysis were performed using anti-GFP, -Capns1 and -tubulin antibodies. The 18 kDa truncated Capns1 fragment is indicated by an arrow.
Figure 4 with 1 supplement
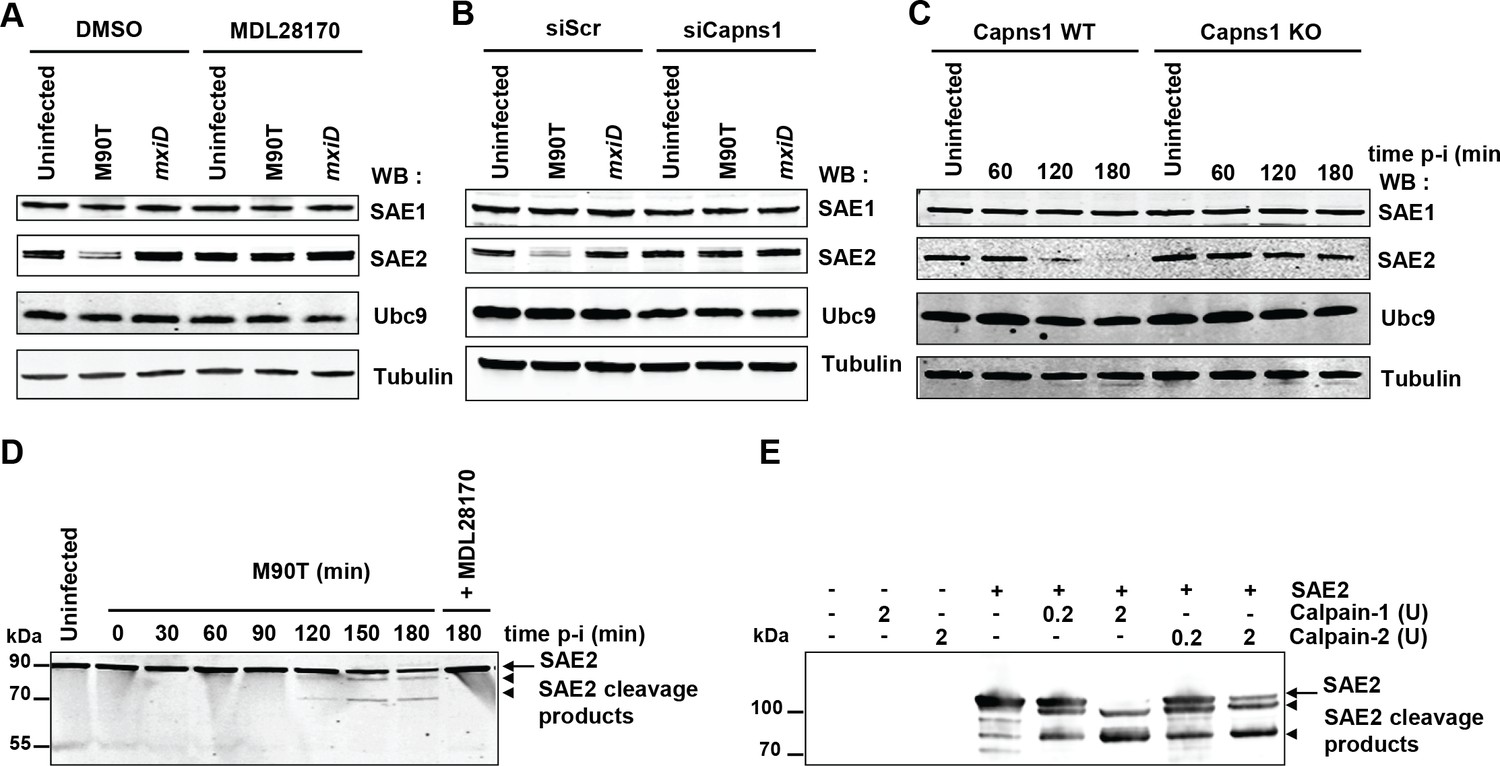
SAE2 is a direct calpain substrate.
(A) HeLa cells were pretreated by vehicle (DMSO) or 100 μM MDL28170 for 1 hr and then left uninfected or infected with the M90T strain or the mxiD mutant for 2 hr. Immunoblot analysis were performed using anti-SAE1, -SAE2 (Ab22104), -UBC9 and -tubulin antibodies. (B) HeLa cells were treated with control siRNA (siScr) or Capns1 siRNA and then left uninfected or infected with the M90T strain or the mxiD mutant for 2 hr. Immunoblot analysis were performed as in C. (C) Capns1+/+ (WT) or Capns1−/− (KO) MEFs were uninfected (UI) or infected with Shigella for the indicated time. Immunoblot analysis were performed as in C. (D) Lanes 1–8: HeLa cells were left uninfected or infected with the M90T strain for the indicated times. Lane 9: HeLa cells were pretreated with 100 μM MDL28170 for 1 hr and then infected with the M90T strain in the presence of 100 μM MDL28170 for 3 hr. Immunoblot analysis was performed using a second anti-SAE2 antibody (D15C11). Arrow indicates full length SAE2 and arrowheads indicate SAE2 cleavage products. (E) In vitro proteolysis of SAE2 by calpain-1 or calpain-2 visualized by immunoblotting using SAE2 antibody (D15C11). Recombinant SAE2 was incubated with two different concentrations (0.2U or 2U) of calpain-1 or −2 at 30°C for 20 min. Arrow indicates full length SAE2 and arrowheads indicate SAE2 cleavage products.
Figure 4—figure supplement 1
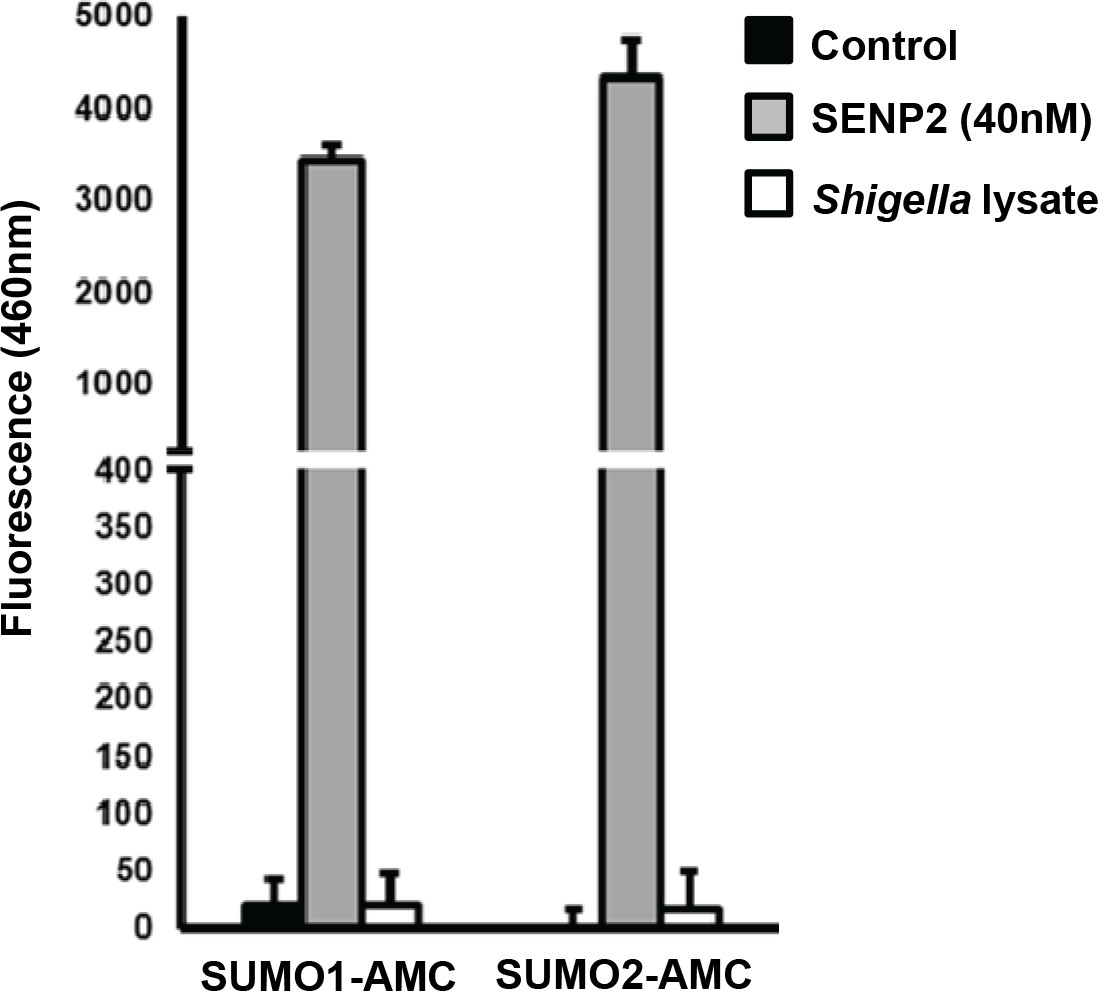
Assessment of desumoylating activities in Shigella lysates.
Reaction buffer alone (control), Shigella M90T non-denatured lysates, or recombinant SENP2 (40 nM) used here as a positive control were incubated with SUMO1-AMC (left) or SUMO2-AMC (right) and their activities were determined by release of fluorescent AMC at 30 min (emission length 460 nm).
-
Figure 4—figure supplement 1—source data 1
Source data file relative to Figure 4—figure supplement 1.
- https://doi.org/10.7554/eLife.27444.011
Figure 5 with 1 supplement
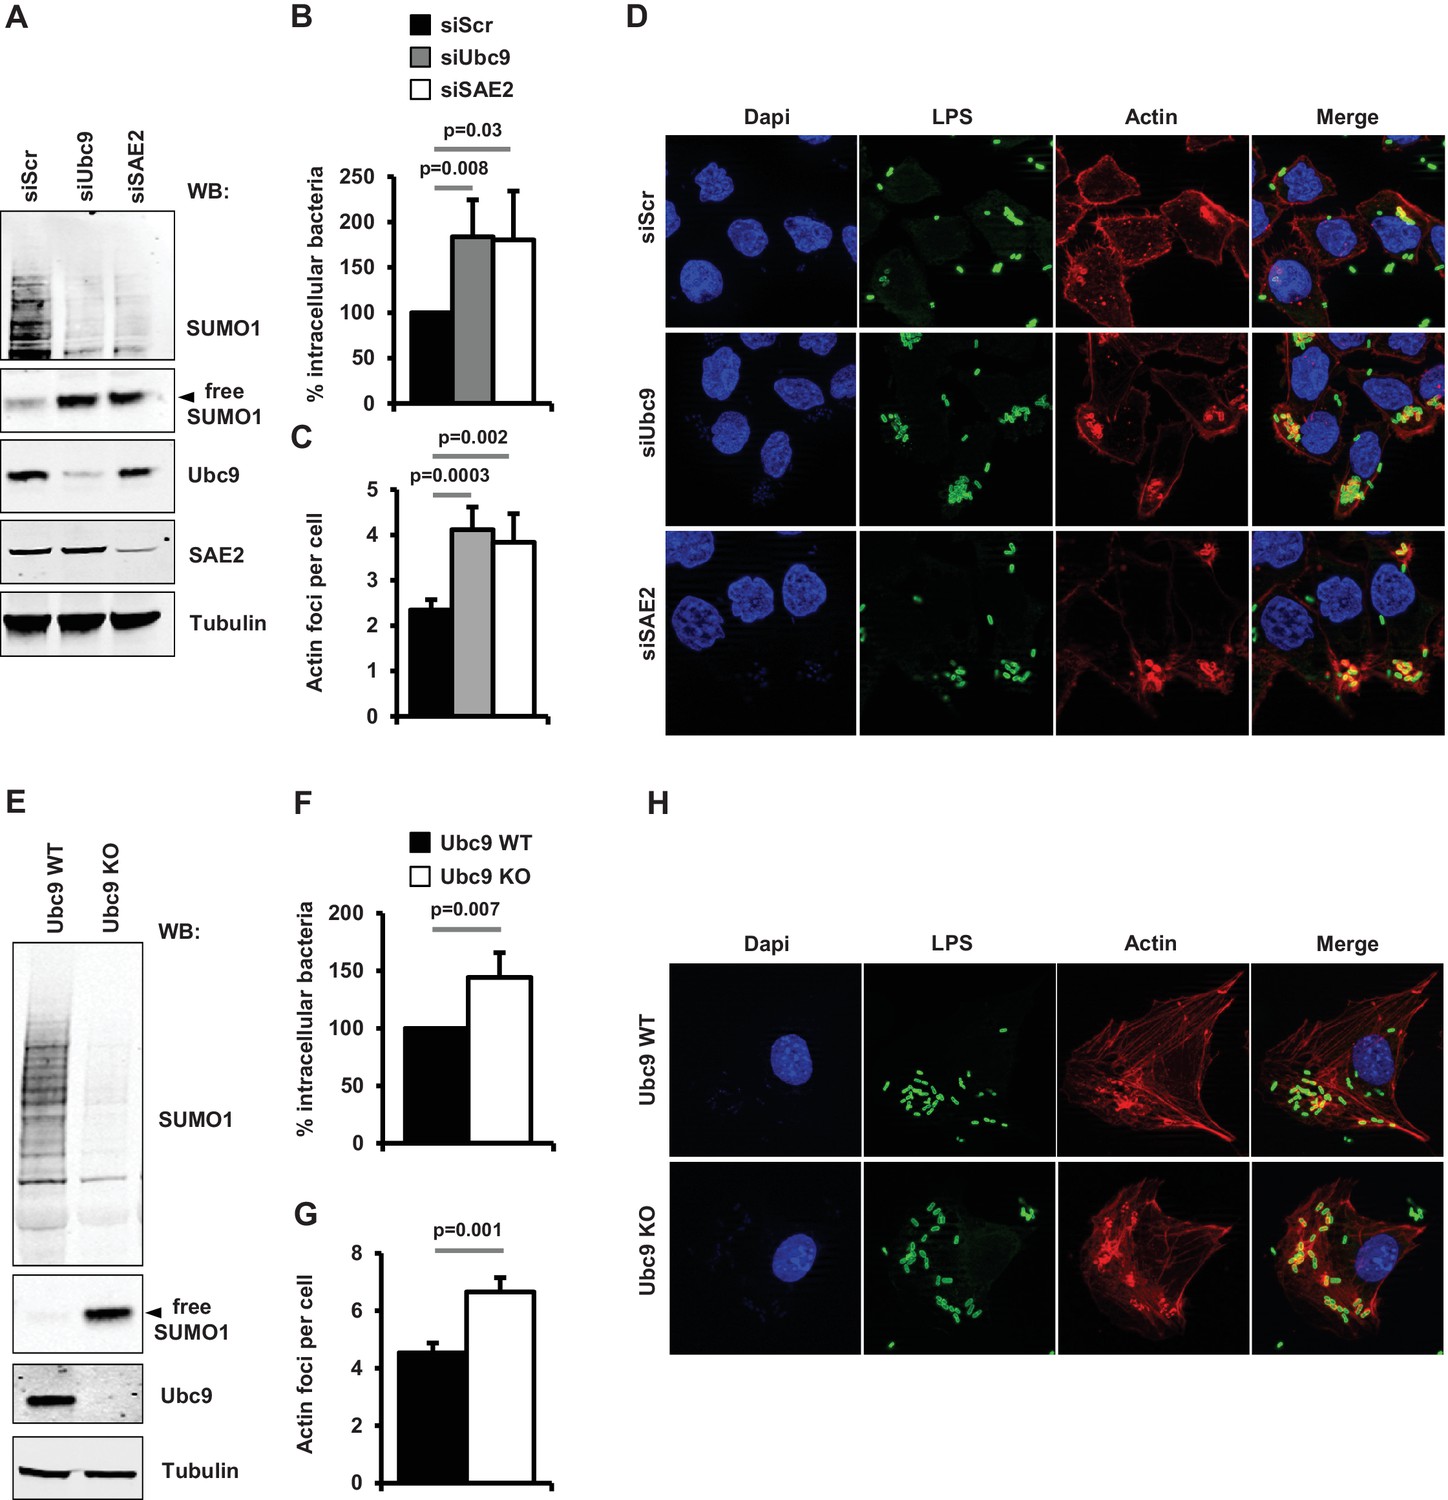
Impact of sumoylation on Shigella infection.
(A) HeLa cells were treated with siRNAs for UBC9 and SAE2 or a control siRNA (siScr). Immunoblot analysis were performed using anti-SUMO1, -UBC9, -SAE2 and -tubulin antibodies. (B) Percentage of Shigella internalization upon siRNA-mediated knockdown of UBC9 and SAE2 in HeLa cells relative to control siRNA. Quantification was performed using the gentamicin protection assay (taken siScr value as 100%) 30 min post-infection. Each value is the mean of six independent experiments ± SEM. (C) Actin foci formation upon siRNA-mediated knockdown of UBC9 and SAE2 in HeLa cells. Samples were fixed and processed for actin staining 10 min post-infection. The average number of actin foci per cell ±s.d. is indicated (n = 4, at least 50 cells counted per condition). (D) Representative images of Shigella-induced actin foci in siRNA-treated HeLa cells after 10 min infection. Samples were processed for bacterial LPS (green), actin (red) and nuclei (blue) staining. (E) Primary MEFs from Ubc9+/+/T2 (WT) and Ubc9fl/-/T2 (KO) mice (Demarque et al., 2011) were treated for 5 days with 4-hydroxy-tamoxifen. Levels of global sumoylation and UBC9 were assessed by immunoblot analysis. Tubulin was used as control. (F) Percentage of Shigella internalization in Ubc9 WT and Ubc9 KO MEFs 30 min post-infection. Quantification is as in B (taken Ubc9 WT value as 100%). Each value is the mean of nine independent experiments ± SEM. (G) Actin foci formation in Ubc9 WT and Ubc9 KO MEFS. Samples were fixed and processed for actin staining 10 min post-infection. The average number of actin foci per cell ±s.d. is indicated (n = 3, at least 50 cells counted per condition). (H) Representative images of Shigella-induced actin foci in Ubc9 WT or Ubc9 KO MEFs 10 min post-infection. Samples were processed for bacterial LPS (green), actin (red) and nuclei (blue) staining.
-
Figure 5—source data 1
Percentage of Shigella internalization and quantification of the average number of actin foci in cells impaired for sumoylation (Figure 5B, (C,F and G).
- https://doi.org/10.7554/eLife.27444.014
Figure 5—figure supplement 1
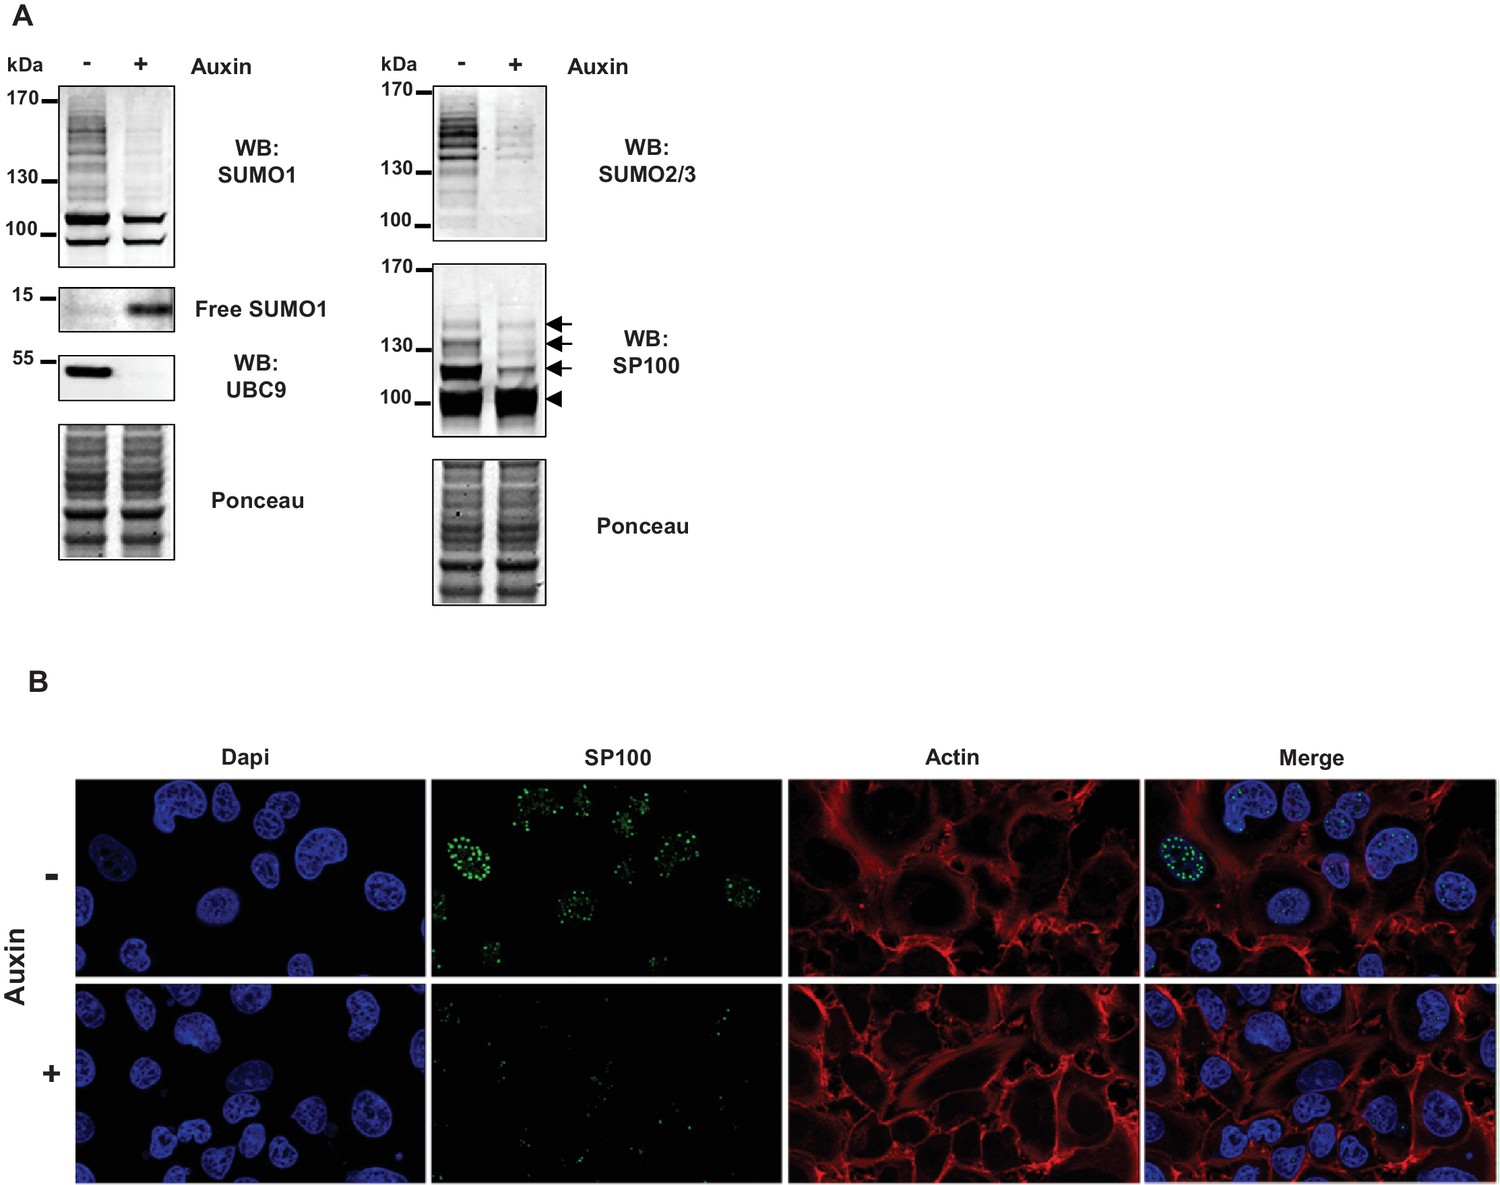
SUMO loss does not lead to marked alteration of the actin cytoskeleton.
(A) HT1080 cells, stably expressing an auxin-inducible degron to destroy UBC9 (manuscript in preparation), were left untreated or treated for 24 hr with 200 µM auxin to inhibit sumoylation. Immunoblot analysis was performed using antibodies specific for SUMO1, UBC9, SUMO2/3 and SP100. Ponceau staining was used as a loading control. Arrowhead indicates unmodified SP100 and arrows indicate SUMO1-modified forms of SP100. (B) Actin cytoskeleton in uninfected HT1080 cells treated or not with auxin for 24 hr. Samples were fixed and processed for SP100 (green), actin (red) and nuclei (blue) staining. The absence of SP100 in nuclear bodies was used as a proxy for loss of cellular sumoylation.
Figure 6 with 1 supplement
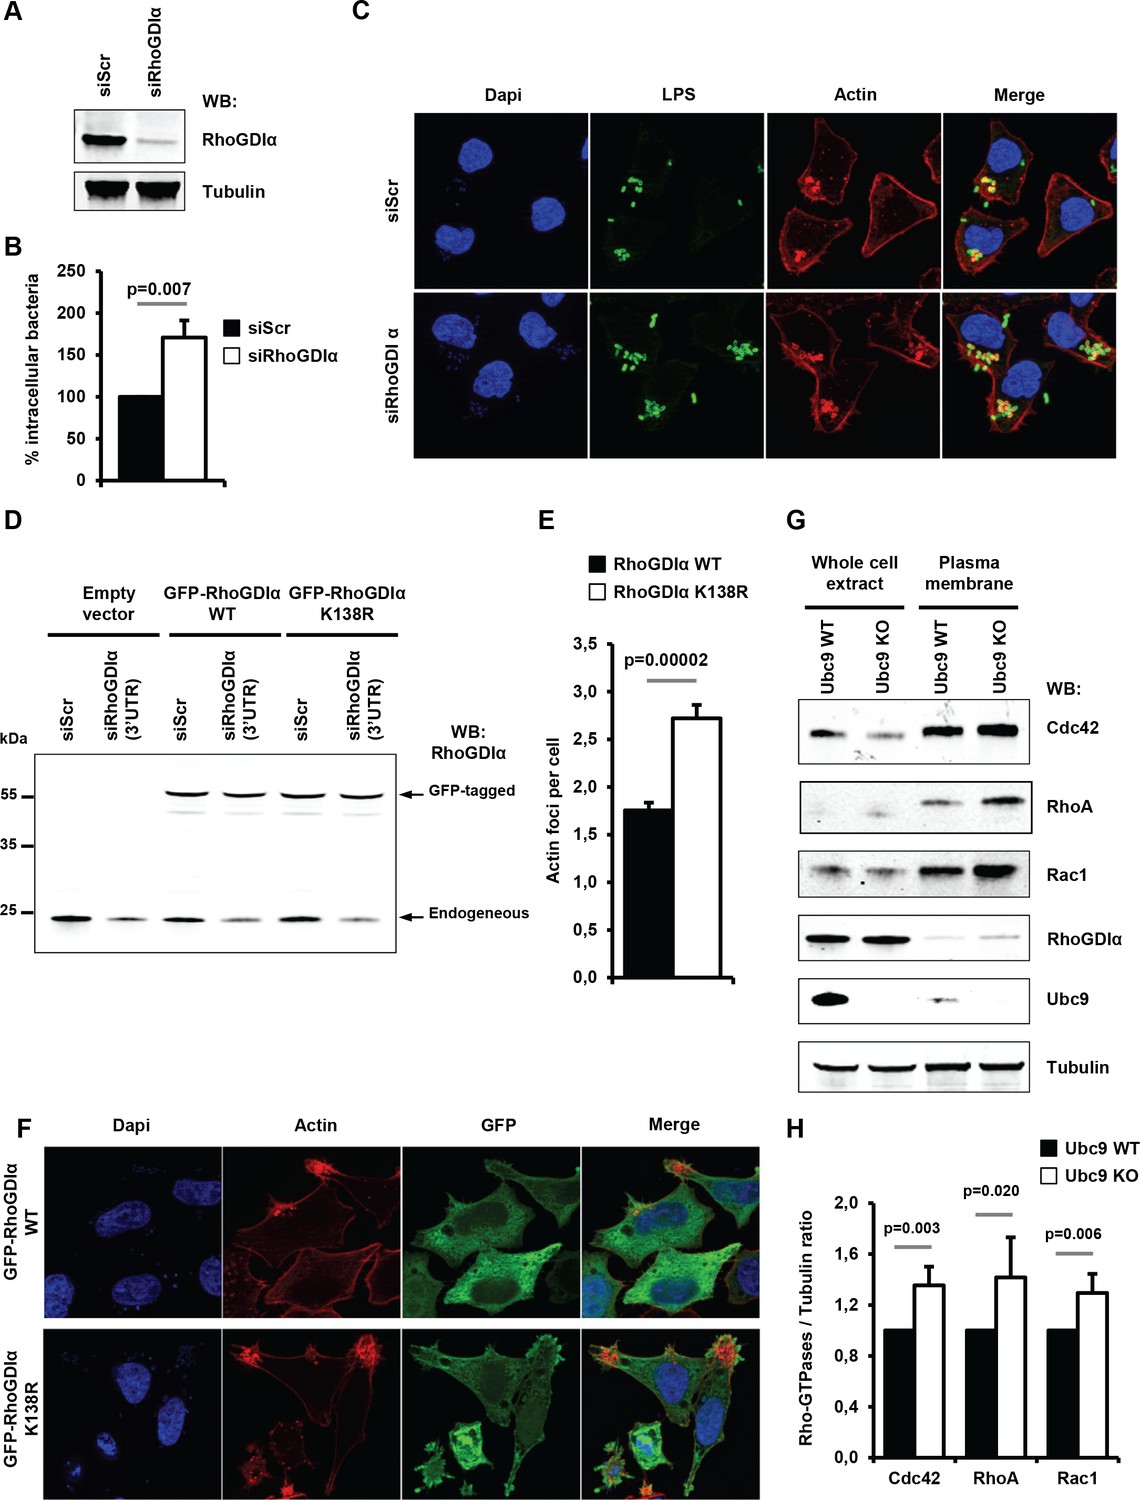
Sumoylation of RhoGDIα regulates Shigella internalization in epithelial cells.
(A) HeLa cells were treated with siRNA for RhoGDIα or a control siRNA (siScr). Immunoblot analysis was performed using anti-RhoGDIα and -tubulin antibodies. (B) Percentage of Shigella internalization upon siRNA-mediated knockdown of RhoGDIα relative to control siRNA. The percentage of internalized bacteria was quantified using the gentamicin protection assay (taken siScr value as 100%) 30 min post-infection. Each value is the mean of eleven independent experiments ± SEM. (C) Representative images of Shigella-induced actin foci in siRNA-treated HeLa cells after 10 min infection. Samples were processed for bacterial LPS (green), actin (red) and nuclei (blue) staining. (D) Hela cells co-transfected with siRhoGDIα (targeting the 3’UTR) together with either GFP-tagged sRhoGDIα WT or GFP-tagged RhoGDIα K138R. Immunoblotting was performed using a RhoGDIα antibody. Arrows indicate GFP-tagged and endogenous RhoGDIα proteins. (E) Hela cells co-transfected as in D and infected with M90T for 10 min. Samples were fixed and processed for actin staining 10 min post-infection. The average number of actin foci per cell ±s.d. is indicated (n = 4, at least 50 cells counted per condition). (F) Representative images of Shigella-induced actin foci in HeLa cells co-transfected as in D with GFP-tagged RhoGDIα constructs (green) after 10 min infection. Samples were processed for actin (red) and nuclei (blue) staining. (G) Immunoblot analysis was performed on whole-cell lysates or plasma membrane fractions (recovered by ultracentrifugation) from Ubc9 WT or Ubc9 KO MEFs using anti-Cdc42, -RhoA, -Rac1, - RhoGDIα, -UBC9 and -tubulin antibodies. (H) Quantification of the immunoblot signals obtained from Ubc9 WT or Ubc9 KO MEF protein extracts are presented as RhoGTPase signal (Cdc42, RhoA or Rac1, as indicated on the x-axis) relative to tubulin signal (mean of five independent experiments ± s.d.).
-
Figure 6—source data 1
Source data file relative to Figure 6B, E and H.
- https://doi.org/10.7554/eLife.27444.017
Figure 6—figure supplement 1
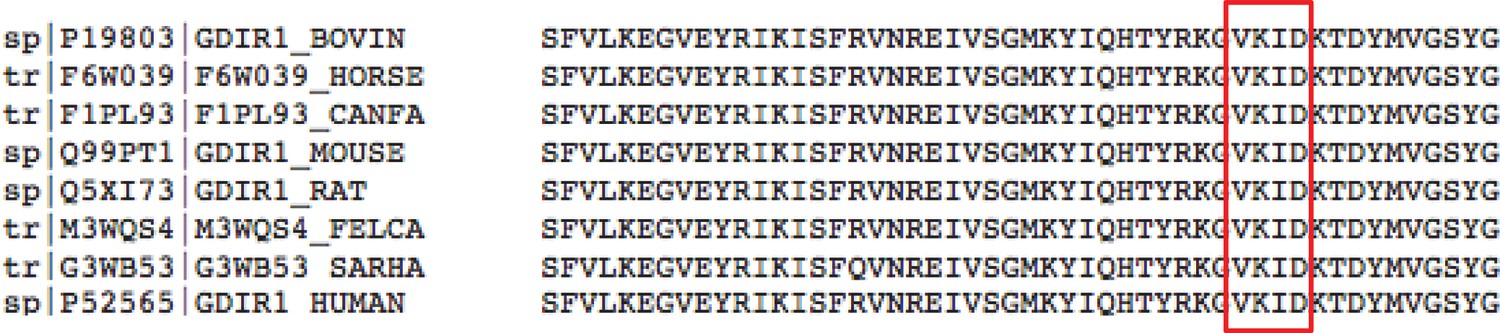
Conservation of the sumoylation site within RhoGDIα amino acid sequence in various species.
Alignment has been done using the CLUSTALW2 online software (http://www.ebi.ac.uk/Tools/msa/clustalw2/). Sequences used are from the following organisms: Bos taurus (GDIR1_BOVIN, P19803), Equus caballus (F6W039_HORSE, F6W039), Canis familiaris (F1PL93_CANFA, F1PL93), Mus musculus (GDIR1_MOUSE, Q99PT1), Rattus norvegicus (GDIR1_RAT, QXI73), Felis catus (M3WQS4_FELCA, M3WQS4), Sarcophilus harrisii (G3WB53_SARHA, G3WB53) and Homo sapiens (GDIR1_HUMAN, P52565).
Figure 7 with 1 supplement
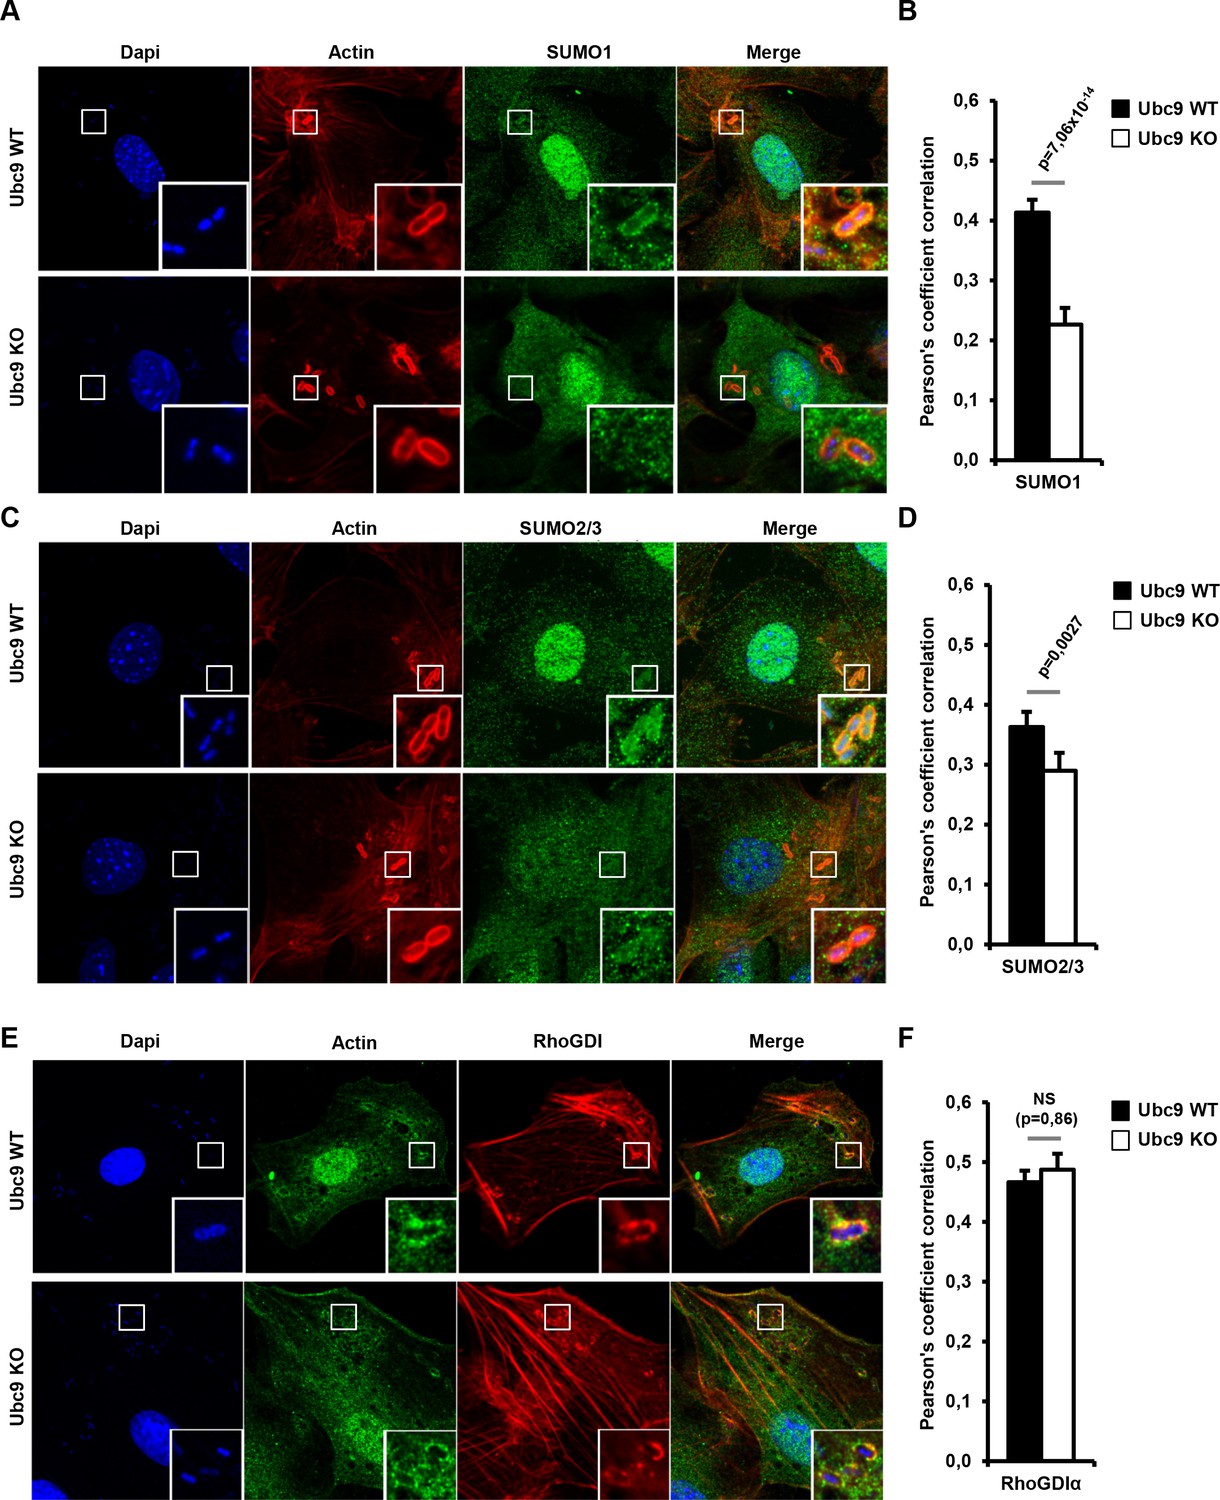
Endogenous RhoGDIα and SUMO are localized at Shigella-induced actin foci.
(A) SUMO1 accumulates at Shigella (M90T) entry sites. Representative ApoTome-generated micrographs of Shigella-infected Ubc9 WT or Ubc9 KO MEFs after 10 min infection. Samples were fixed and processed for immunostaining using anti-SUMO1 antibody (green) and staining of actin (red) and nuclei (blue) (white square, inset). (B) The Pearson’s coefficient (Rr) was used to measure the signal intensity correlation between SUMO1 and Shigella-induced actin foci stainings. Data are means ±SEM (at least 40 foci analyzed per condition). p value calculated as described in Materials and Methods. (C) SUMO2/3 accumulates at Shigella (M90T) entry sites. Same as in A using a SUMO2/3 antibody. (D) Same as in B with SUMO2/3 signal. (E) Recruitment of RhoGDIα is at Shigella (M90T) entry sites. Same as in A using a RhoGDIα antibody. (F) Same as in B with RhoGDIα signal. NS: non significant.
-
Figure 7—source data 1
Source data files relative to Figure 7B, D and F.
- https://doi.org/10.7554/eLife.27444.020
Figure 7—figure supplement 1
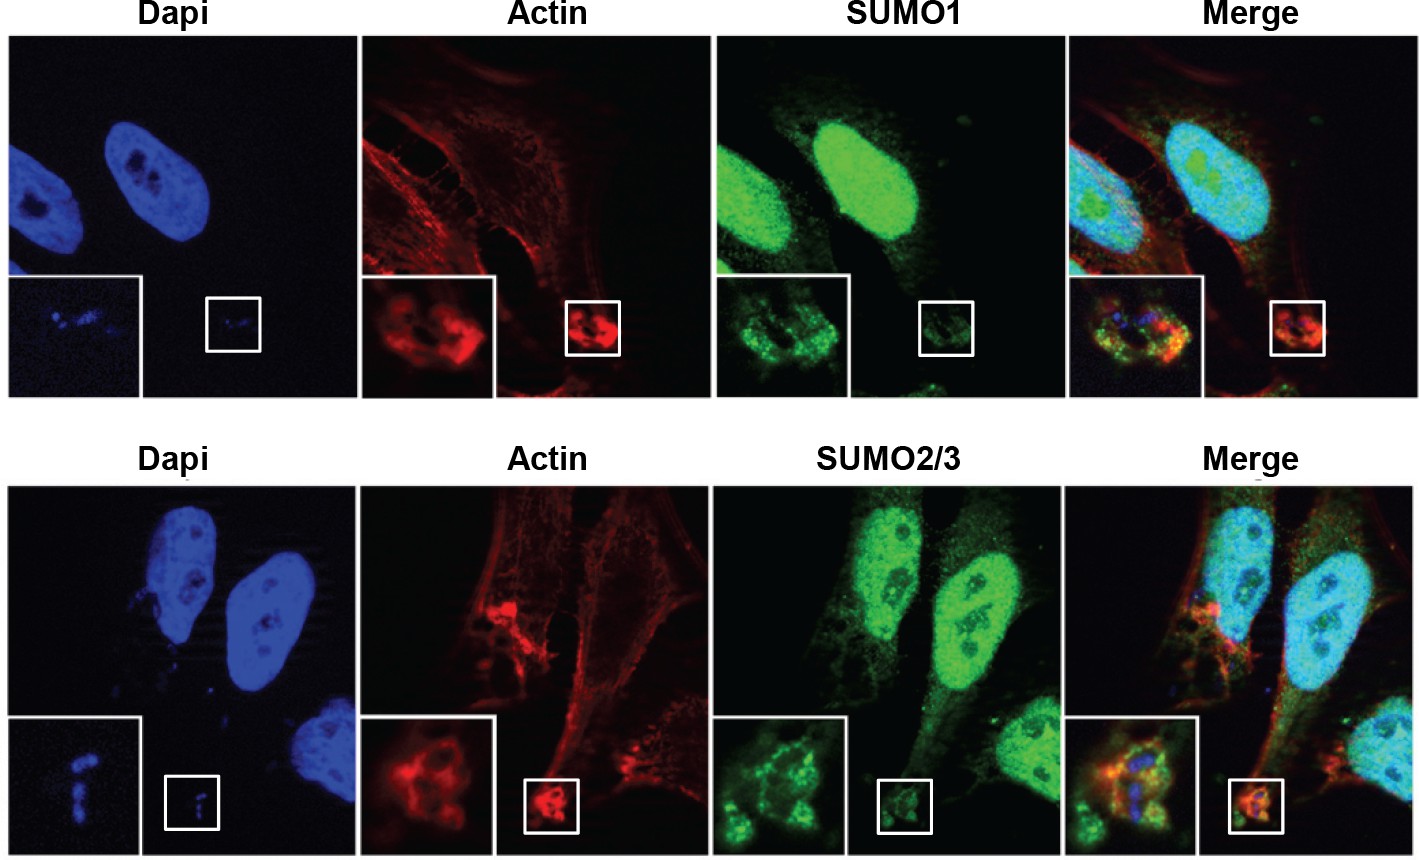
SUMO1 and SUMO2/3 accumulate at Shigella (M90T) entry site in Hela cells.
Cells were infected with Shigella strain M90T for 10 min at 37°C. Samples were fixed and processed for immunostaining using anti-SUMO1 (green, upper panel) or anti-SUMO2/3 antibody (green, lower panel) and staining of actin (red) and nuclei (blue) (white square, inset). Representative ApoTome-generated micrographs are presented (white square, inset).
Figure 8
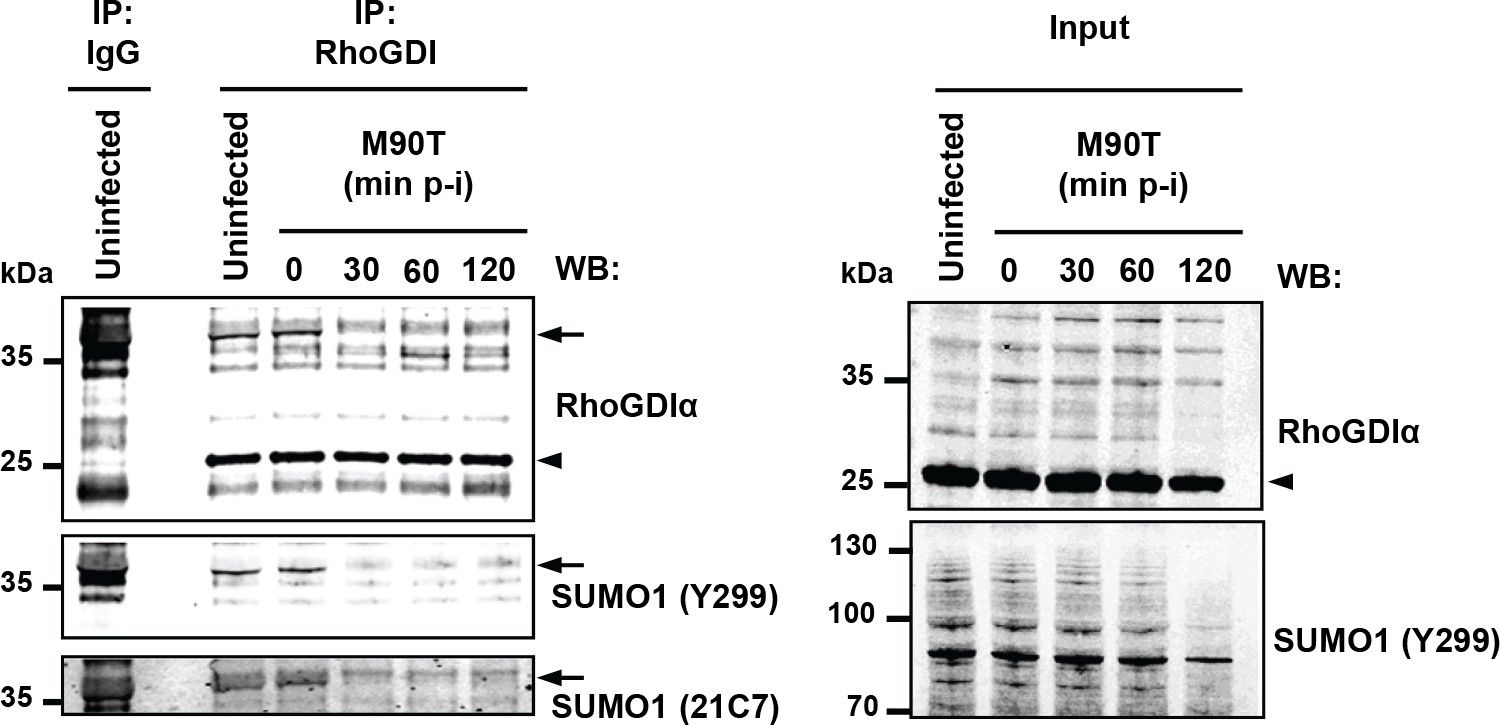
Shigella infection leads to loss in SUMO- RhoGDIα.
Endogenous RhoGDIα is modified by SUMO1 and rapidly desumoylated upon Shigella infection. Whole-cell extracts harvested from uninfected or Shigella (M90T)-infected Hela cells (from 0 to 120 min post-infection) were subjected to immunoprecipitation (IP) using anti-RhoGDIα or control IgG. Immunoprecipitates (left panel) and input lysates (right panel) were analysed by immunoblot analysis using anti-RhoGDIα, and -SUMO1 (clones Y299 and 21C7) antibodies. Arrowhead indicates unmodified RhoGDIα and arrow indicates SUMO1- RhoGDIα.
Author response image 1
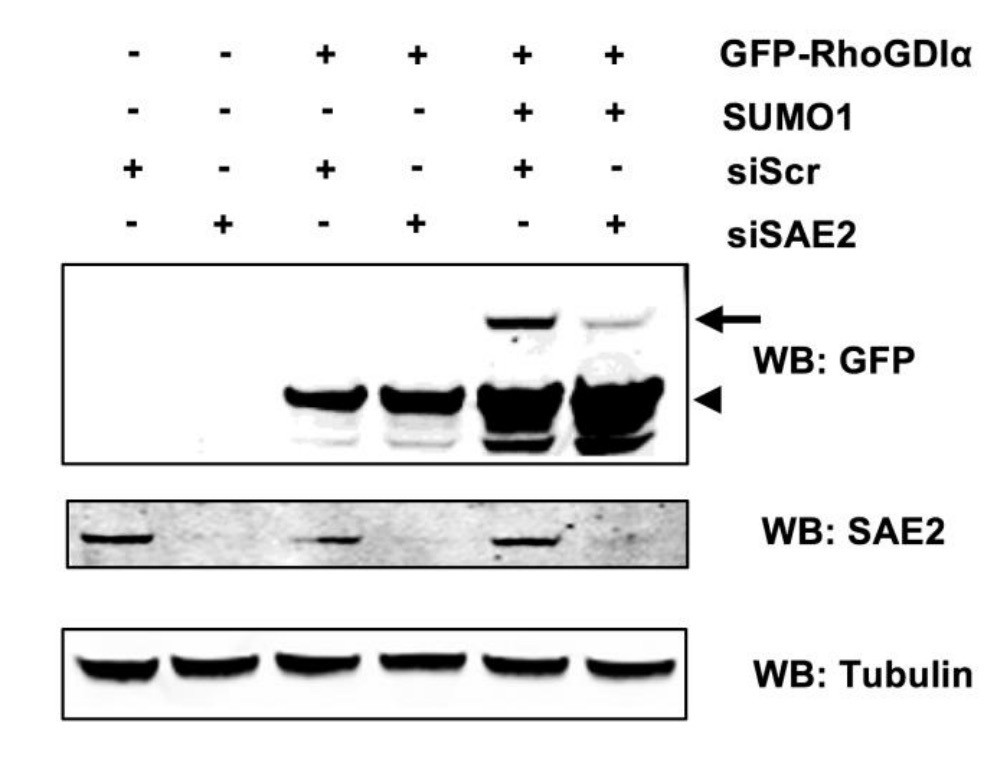
Sumoylation of RhoGDIα is affected by SAE2 impairment.
HeLa cells were treated with control siRNA (siScr) or siSAE2, and then co-transferred with expression vectors for GFP-RhoGDIα and SUMO1. Immunoblot analysis was performed on whole cell extracts using anti-GFP, -SAE2 and -Tubulin antibodies. Arrowhead indicates unmodified RhoGDlα and arrow indicates SUMO1- RhoGDIα./Author response image 1 title/legend>
Author response image 2

The virA defective mutant induces calpain activation and loss of SUMO conjugates and SAE2.
SUMO1 and SUMO2 patterns in HeLa cells, uninfected or infected for 120min with the wild-type Shigella strain M90T or mutants mxiD or virA. Immunoblot analysis was performed on whole-cell lysates using antibodies specific for SUMO1, SUMO2/3, Capns1, SAE2 and Tubulin. Arrows indicate autolytic fragments of Capns1. Tubulin was used as a loading control.
Tables
Key resources table
| Reagent type (species) or resource | Designation | Source or reference | Identifiers |
|---|---|---|---|
| strain, strain background (Shigella flexneri serotype 5a) | M90T strain | PMID: 6279518 | Taxonomy ID: 1086030 |
| strain, strain background (Shigella flexneri serotype 5a | mxiD | PMID: 8437520 | N/A |
| strain, strain background (Shigella flexneri serotype 5a) | mxiE | PMID: 12142411 | N/A |
| strain, strain background (Shigella flexneri serotype 5a) | ospG | PMID: 16162672 | N/A |
| strain, strain background (Shigella flexneri serotype 5a) | ipaB | PMID: 1582426 | N/A |
| strain, strain background (Shigella flexneri serotype 5a) | ipaC | PMID: 19165331 | N/A |
| strain, strain background (Shigella flexneri serotype 5a) | ipaC/pC57 | PMID: 19165331 | N/A |
| strain, strain background (Shigella flexneri serotype 5a) | ipaC/pC351 | PMID: 19165331 | N/A |
| strain, strain background (Shigella flexneri serotype 5a) | virA | PMID: 22423964 | N/A |
| strain, strain background (Shigella flexneri serotype 5a) | ipgD | PMID: 8478058 | N/A |
| cell line (Hela) | CCL-2 | ATCC | ATCC CCL2/CVCL_0030 |
| cell line (HT1080) | CCL-121 | ATCC | ATCC CCL-121/CVCL_0317 |
| cell line (HT1080) | GFP-PML-IV | PMID: 23530056 | N/A |
| cell line (Hela) | TAP-SUMO1 | PMID: 25097252 | N/A |
| cell line (Hela) | TAP-SUMO2 | PMID: 25097252 | N/A |
| cell line (HT1080) | UBC9-auxin degron | this paper | N/A |
| genetic reagent (siRNA) | control | Dharmacon | #D-001810–10 |
| genetic reagent (siRNA) | Capns1 | Dharmacon | #L-009979–00 |
| genetic reagent (siRNA) | Ubc9 | Dharmacon | #L-004910–00 |
| genetic reagent (siRNA) | SAE2 | Dharmacon | #L-005248–01 |
| genetic reagent (siRNA) | RhoGDIα | Dharmacon | #L-016253–00 |
| transfected construct (Plasmid) | pEGFP-RhoGDIα WT | PMID: 22393046 | N/A |
| transfected construct (Plasmid) | pEGFP-RhoGDIα K138R | PMID: 22393046 | N/A |
| antibody | anti-SAE1 | Abcam | #ab97523/AB_10681015 |
| antibody | anti-SAE2 | Abcam | #ab22104/AB_446785 |
| antibody | anti-SUMO1 | Abcam | Y299/AB_778173 |
| antibody | anti-SUMO2/3 | Abcam | 8A2/AB_1658424 |
| antibody | anti-UBC9 | Abcam | EP2938Y/AB_1267373 |
| antibody | anti-SUMO1 | DSHB Iowa | 21C7/AB_2198257 |
| antibody | anti-Calpastatin | Cell Signaling Technology | #4146/AB_2244162 |
| antibody | anti-SAE2 | Cell Signaling Technology | D15C11/AB_10889561 |
| antibody | anti-Cdc42 | Cell Signaling Technology | 11A11/AB_10695738 |
| antibody | anti-RhoA | Cell Signaling Technology | 67B9/AB_10693922 |
| antibody | anti-Tubulin | Cell Signaling Technology | DM1A/AB_1904178 |
| antibody | anti-RanGAP1 | Santa Cruz | C-5/AB_2176987 |
| antibody | anti-GFP | Santa Cruz | C-2 |
| antibody | anti-RhoGDIα | Merck Millipore | #06–730/AB_310229 |
| antibody | anti-Capns1 | Merck Millipore | MAB3083/AB_2070014 |
| antibody | anti-Rac1 | Merck Millipore | 23A8/AB_309712 |
| antibody | anti-LPS | PMID: 25097252 | N/A |
| antibody | anti-SP100 | PMID: 7559785 | N/A |
| chemical compound, drug | Phalloidin–Tetramethylrhodamine B isothiocyanate | Sigma | P1951 / AB_2315148 |
| chemical compound, drug | Dapi | Sigma | D9542 |
| chemical compound, drug | Cytochalasin D | Sigma | C8273 |
| chemical compound, drug | MDL 28170 | Sigma | M6690 |
| chemical compound, drug | Ionomycin | Sigma | I3909 |
| chemical compound, drug | BAPTA-AM | Enzo life sciences | BML-CA411-0025 |
| chemical compound, drug | Indole-3-acetic acid | Sigma | I5148 |
| chemical compound, drug | N-Ethylmaleimide | Sigma | E3876 |
| peptide, recombinant protein | Recombinant SAE2 | Novus biologicals | NBP2-50574-20ug |
| peptide, recombinant protein | Recombinant Calpain-1 | Merck Millipore | 208712 |
| peptide, recombinant protein | GST-SENP2cat | this paper | NP_06760.2 |
| peptide, recombinant protein | SUMO1-AMC | Boston Biochem | UL-551 |
| peptide, recombinant protein | SUMO2-AMC | Boston Biochem | UL-758 |
| software, algorithm | Icy software | Institut Pasteur | PMID: 22743774 |
Additional files
-
Transparent reporting form
- https://doi.org/10.7554/eLife.27444.022
Download links
A two-part list of links to download the article, or parts of the article, in various formats.
Downloads (link to download the article as PDF)
Open citations (links to open the citations from this article in various online reference manager services)
Cite this article (links to download the citations from this article in formats compatible with various reference manager tools)
Shigella entry unveils a calcium/calpain-dependent mechanism for inhibiting sumoylation
eLife 6:e27444.
https://doi.org/10.7554/eLife.27444


