Virus Evolution: A new twist in measuring mutation rates
The influenza virus mutates faster than we previously thought.
- The University of Texas at Austin, United States
Every year the World Health Organization Influenza Surveillance Network reviews staggering amounts of data to help predict which strains of influenza virus will be suitable candidates for a flu vaccine for the coming influenza season (Barr et al., 2010). This review is necessary because of the appearance in most years of new mutant strains that can bypass the immunity provided by the previous year's vaccine. The rapid turnover of the different strains of the virus circulating in human populations is largely due to the virus being able to rapidly accumulate new mutations (Duffy et al., 2008).
The frequency with which new mutations occur (known as the mutation rate) influences the ability of a virus to adapt and evade the host’s immune system, and researchers have long been interested in accurately measuring these mutation rates (Parvin et al., 1986; Nobusawa and Sato, 2006). However, existing approaches to measuring mutation rates may have potential biases and shortcomings that have not been fully explored or corrected for. Now, in eLife, Matthew Pauly, Megan Procario and Adam Lauring of the University of Michigan report that using a new twist on an old method can overcome the major flaws of a current approach (Pauly et al., 2017).
When an influenza virus infects a host cell it tricks the cell into copying its genome (which is encoded in RNA rather than DNA) and assembling new virus particles, known as progeny virions. A viral enzyme known as RNA polymerase works with molecular machinery in the host cell to copy the viral RNA. However, this enzyme frequently makes mistakes, leading to a high rate of mutations in the new RNA molecules. Alongside this process, the cell uses sections of the viral RNA (called transcripts) as templates to make the proteins that are the building blocks of the progeny virions.
A widely used method of measuring mutation rates involves sequencing the genome of a virus, then allowing the virus to infect cells, sequencing the genomes of the progeny virions and, lastly, comparing the original genome sequence and the progeny sequences in order to identify the mutations that have arisen during the infection cycle (Sanjuán et al., 2010). This sequencing approach has the advantage that it provides both a total count of mutations and the frequencies of the different types of mutations (such as A to U, C to G, and so on). However, there are two potential problems with this method. First, it can be difficult to distinguish genuine mutations from errors introduced during sequencing. Second, the sequencing approach may be missing important mutations. For example, mutations that crop up early in the infection cycle may reduce the virus’s ability to replicate, thus biasing the resulting progeny virions away from those mutations.
Pauly et al. were able to sidestep the first problem by also sequencing transcripts from an artificial DNA construct known as a plasmid that is based on the RNA encoding some of the virus genome. Both the plasmid sequences and the viral genome sequences are expected to experience similar amounts of sequencing errors, so any difference in the observed mutation frequencies must be caused by mistakes made by the viral polymerase as it copied the viral genome. This technique revealed that sequencing errors account for at least half of the mutations found in the influenza virus using the standard sequencing approach.
To assess the severity of the second problem, Pauly et al. looked at the number of mutations that result in the production of incomplete proteins, which are generally lethal to the virus. They found that the viral genomes experienced many fewer mutations of this type than the plasmid sequences (which were not under any selective pressure). Thus, it appears that lethal or very harmful mutations can be missed in the sequencing-based approach to measuring mutation rates.
As an alternative to sequencing viral genomes, it is also possible to measure mutation rates using a fluctuation test. This approach – which was first developed by Max Delbrück and Salvador Luria in the early 1940s (Luria and Delbrück, 1943) – relies on counting rare mutations to an easily observable phenotype, such as resistance to a drug. The main limitation of the traditional fluctuation test is that it cannot directly measure the rates at which individual nucleotides within RNA or DNA are changed by mutations. However, this limitation could be overcome if it were possible to pin-point exactly which mutations cause the measured phenotype.
This is exactly what Pauly et al. did: they developed a fluctuation test for influenza virus based on the fluorescence emitted by green fluorescent protein (GFP). This involved producing recombinant influenza viruses that expressed a version of GFP with a single-nucleotide change that removed the fluorescent properties of the protein. Mutations that reverse this change restore fluorescence, making it possible to count how often such a reversion mutation occurs (Figure 1). Importantly, Pauly et al. were able to construct 12 different recombinant viruses that required 12 different single-nucleotide reversion mutations to restore fluorescence, one for each possible mutation class. These mutant GFPs do not alter the ability of the viruses to infect cells and replicate, so these fluctuation tests are expected to be free from the problem of lethal mutations seen in the sequencing-based approach.
Figure 1
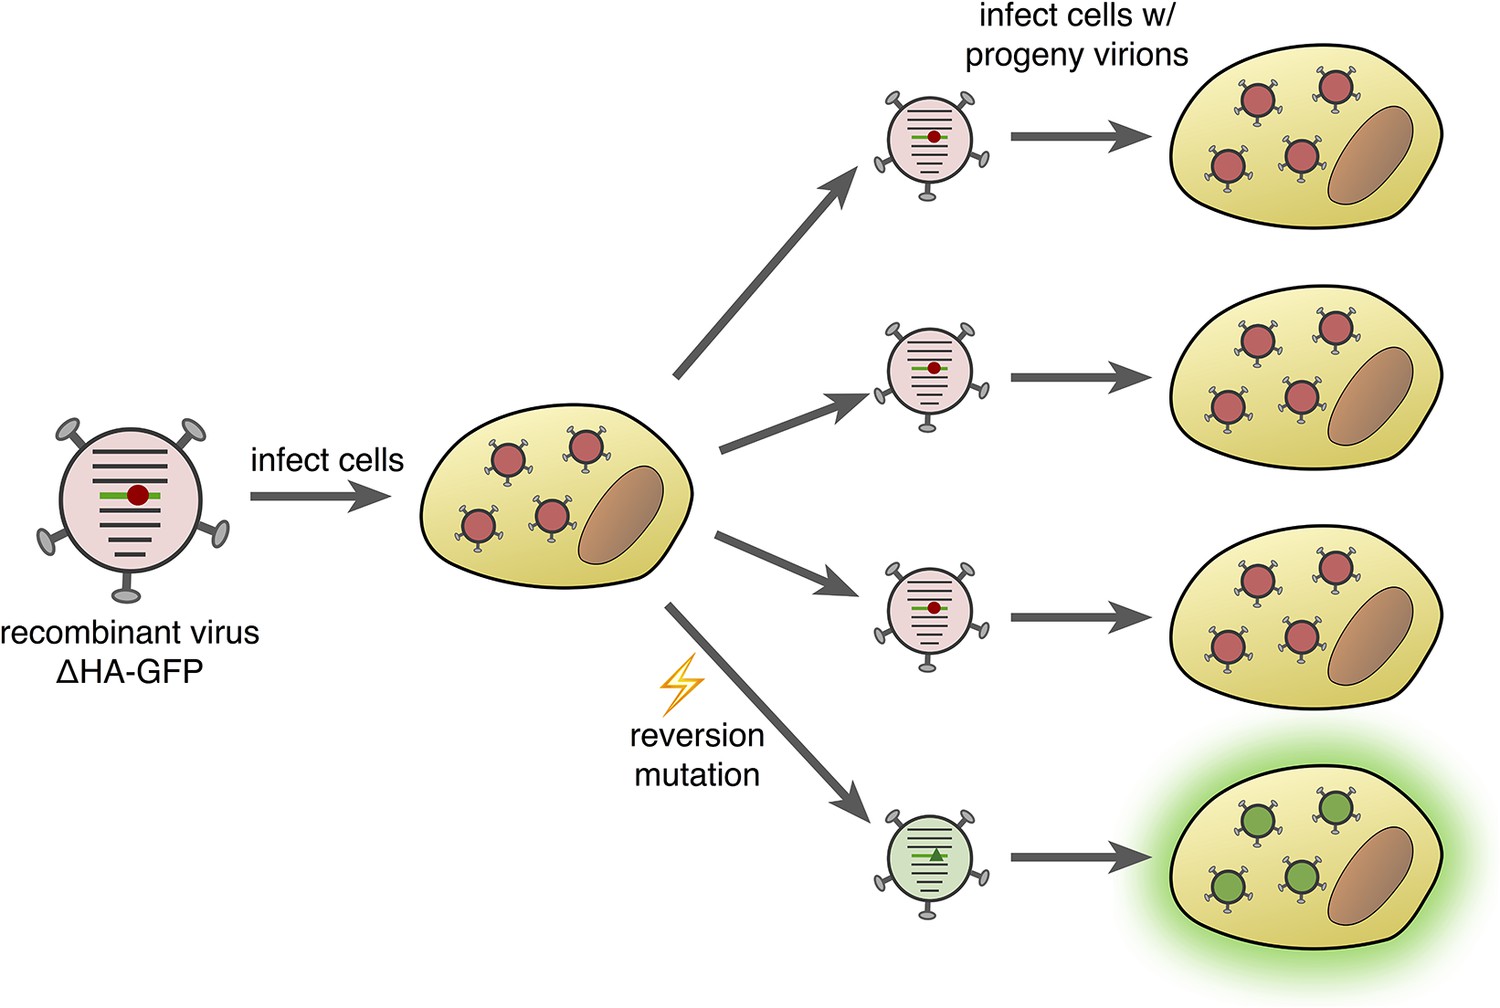
Fluorescence-reversion fluctuation test for the influenza virus.
Pauly et al. started with a recombinant influenza strain known as ΔHA-GFP in which the gene encoding the hemagglutinin surface protein (HA) had been replaced by a gene encoding a version of green fluorescent protein (GFP). This GFP gene contained a single point mutation (shown as a red circle) that prevented the protein from producing green fluorescence. The ΔHA-GFP viruses were allowed to infect mammalian cells and replicate. If, during the first round of replication, a reversion mutation occurs at the site of the original mutation (green triangle), then green fluorescence is restored to GFP. If this particular virus particle then infects a mammalian cell, its progeny virions also produce green fluorescence (bottom right). The ratio of fluorescing to non-fluorescing infected cells in the second round of infection provides an estimate of the mutation rate for this specific reversion mutation.
Using their new test, Pauly et al. found that the rate at which the influenza virus mutates may be more than double the rates that had been previously reported. This information will undoubtedly help in developing better models of influenza evolution, potentially allowing for better predictions of the changes in circulating strains that allow the viruses to bypass existing vaccines. More importantly, the method has applications beyond just the influenza virus, as it should work with any virus that can tolerate the gene encoding GFP being inserted into its genome. Accurate measurements of mutation rates for other viruses with RNA genomes could be valuable in numerous ways, from assisting in the development of new vaccines (Ojosnegros and Beerenwinkel, 2010) to informing the development of treatments that disable viruses by inducing harmful mutations (Bull et al., 2007).
References
-
Epidemiological, antigenic and genetic characteristics of seasonal influenza A(H1N1), A(H3N2) and B influenza viruses: basis for the WHO recommendation on the composition of influenza vaccines for use in the 2009-2010 northern hemisphere seasonVaccine 28:1156–1167.https://doi.org/10.1016/j.vaccine.2009.11.043
-
Theory of lethal mutagenesis for virusesJournal of Virology 81:2930–2939.https://doi.org/10.1128/JVI.01624-06
-
Rates of evolutionary change in viruses: patterns and determinantsNature Reviews Genetics 9:267–276.https://doi.org/10.1038/nrg2323
-
Mutations of bacteria from virus sensitivity to virus resistanceGenetics 28:491–511.
-
Comparison of the mutation rates of human influenza A and B virusesJournal of Virology 80:3675–3678.https://doi.org/10.1128/JVI.80.7.3675-3678.2006
-
Models of RNA virus evolution and their roles in vaccine designImmunome Research 6 Suppl 2:S5.https://doi.org/10.1186/1745-7580-6-S2-S5
-
Measurement of the mutation rates of animal viruses: influenza A virus and poliovirus type 1Journal of Virology 59:377–383.
Article and author information
Author details
Publication history
Copyright
© 2017, Smith et al.
This article is distributed under the terms of the Creative Commons Attribution License, which permits unrestricted use and redistribution provided that the original author and source are credited.
Metrics
-
- 7,786
- views
-
- 305
- downloads
-
- 4
- citations
Views, downloads and citations are aggregated across all versions of this paper published by eLife.
Download links
A two-part list of links to download the article, or parts of the article, in various formats.
Downloads (link to download the article as PDF)
Open citations (links to open the citations from this article in various online reference manager services)
Cite this article (links to download the citations from this article in formats compatible with various reference manager tools)
Virus Evolution: A new twist in measuring mutation rates
eLife 6:e29586.
https://doi.org/10.7554/eLife.29586
Further reading
-
- Developmental Biology
- Genetics and Genomics
Smads and their transcription factor partners mediate the transcriptional responses of target cells to secreted ligands of the transforming growth factor-β (TGF-β) family, including those of the conserved bone morphogenetic protein (BMP) family, yet only a small number of direct target genes have been well characterized. In C. elegans, the BMP2/4 ortholog DBL-1 regulates multiple biological functions, including body size, via a canonical receptor-Smad signaling cascade. Here, we identify functional binding sites for SMA-3/Smad and its transcriptional partner SMA-9/Schnurri based on ChIP-seq peaks (identified by modEncode) and expression differences of nearby genes identified from RNA-seq analysis of corresponding mutants. We found that SMA-3 and SMA-9 have both overlapping and unique target genes. At a genome-wide scale, SMA-3/Smad acts as a transcriptional activator, whereas SMA-9/Schnurri direct targets include both activated and repressed genes. Mutations in sma-9 partially suppress the small body size phenotype of sma-3, suggesting some level of antagonism between these factors and challenging the prevailing model for Schnurri function. Functional analysis of target genes revealed a novel role in body size for genes involved in one-carbon metabolism and in the endoplasmic reticulum (ER) secretory pathway, including the disulfide reductase dpy-11. Our findings indicate that Smads and SMA-9/Schnurri have previously unappreciated complex genetic and genomic regulatory interactions that in turn regulate the secretion of extracellular components like collagen into the cuticle to mediate body size regulation.
-
- Computational and Systems Biology
- Genetics and Genomics
Apart from ancestry, personal or environmental covariates may contribute to differences in polygenic score (PGS) performance. We analyzed the effects of covariate stratification and interaction on body mass index (BMI) PGS (PGSBMI) across four cohorts of European (N = 491,111) and African (N = 21,612) ancestry. Stratifying on binary covariates and quintiles for continuous covariates, 18/62 covariates had significant and replicable R2 differences among strata. Covariates with the largest differences included age, sex, blood lipids, physical activity, and alcohol consumption, with R2 being nearly double between best- and worst-performing quintiles for certain covariates. Twenty-eight covariates had significant PGSBMI–covariate interaction effects, modifying PGSBMI effects by nearly 20% per standard deviation change. We observed overlap between covariates that had significant R2 differences among strata and interaction effects – across all covariates, their main effects on BMI were correlated with their maximum R2 differences and interaction effects (0.56 and 0.58, respectively), suggesting high-PGSBMI individuals have highest R2 and increase in PGS effect. Using quantile regression, we show the effect of PGSBMI increases as BMI itself increases, and that these differences in effects are directly related to differences in R2 when stratifying by different covariates. Given significant and replicable evidence for context-specific PGSBMI performance and effects, we investigated ways to increase model performance taking into account nonlinear effects. Machine learning models (neural networks) increased relative model R2 (mean 23%) across datasets. Finally, creating PGSBMI directly from GxAge genome-wide association studies effects increased relative R2 by 7.8%. These results demonstrate that certain covariates, especially those most associated with BMI, significantly affect both PGSBMI performance and effects across diverse cohorts and ancestries, and we provide avenues to improve model performance that consider these effects.


