Natural variation in stochastic photoreceptor specification and color preference in Drosophila
- Caitlin Anderson

- India Reiss
- Cyrus Zhou
- Annie Cho
- Haziq Siddiqi
- Benjamin Mormann
- Cameron M Avelis
- Peter Deford
- Alan Bergland
- Elijah Roberts
- James Taylor
- Daniel Vasiliauskas
- Robert J Johnston
- Johns Hopkins University, United States
- New York University, United States
- University of Virginia, United States
- Université Paris Sud, Centre National de la Recherche Scientifque, Université Paris-Saclay, France
Figures
Figure 1 with 4 supplements
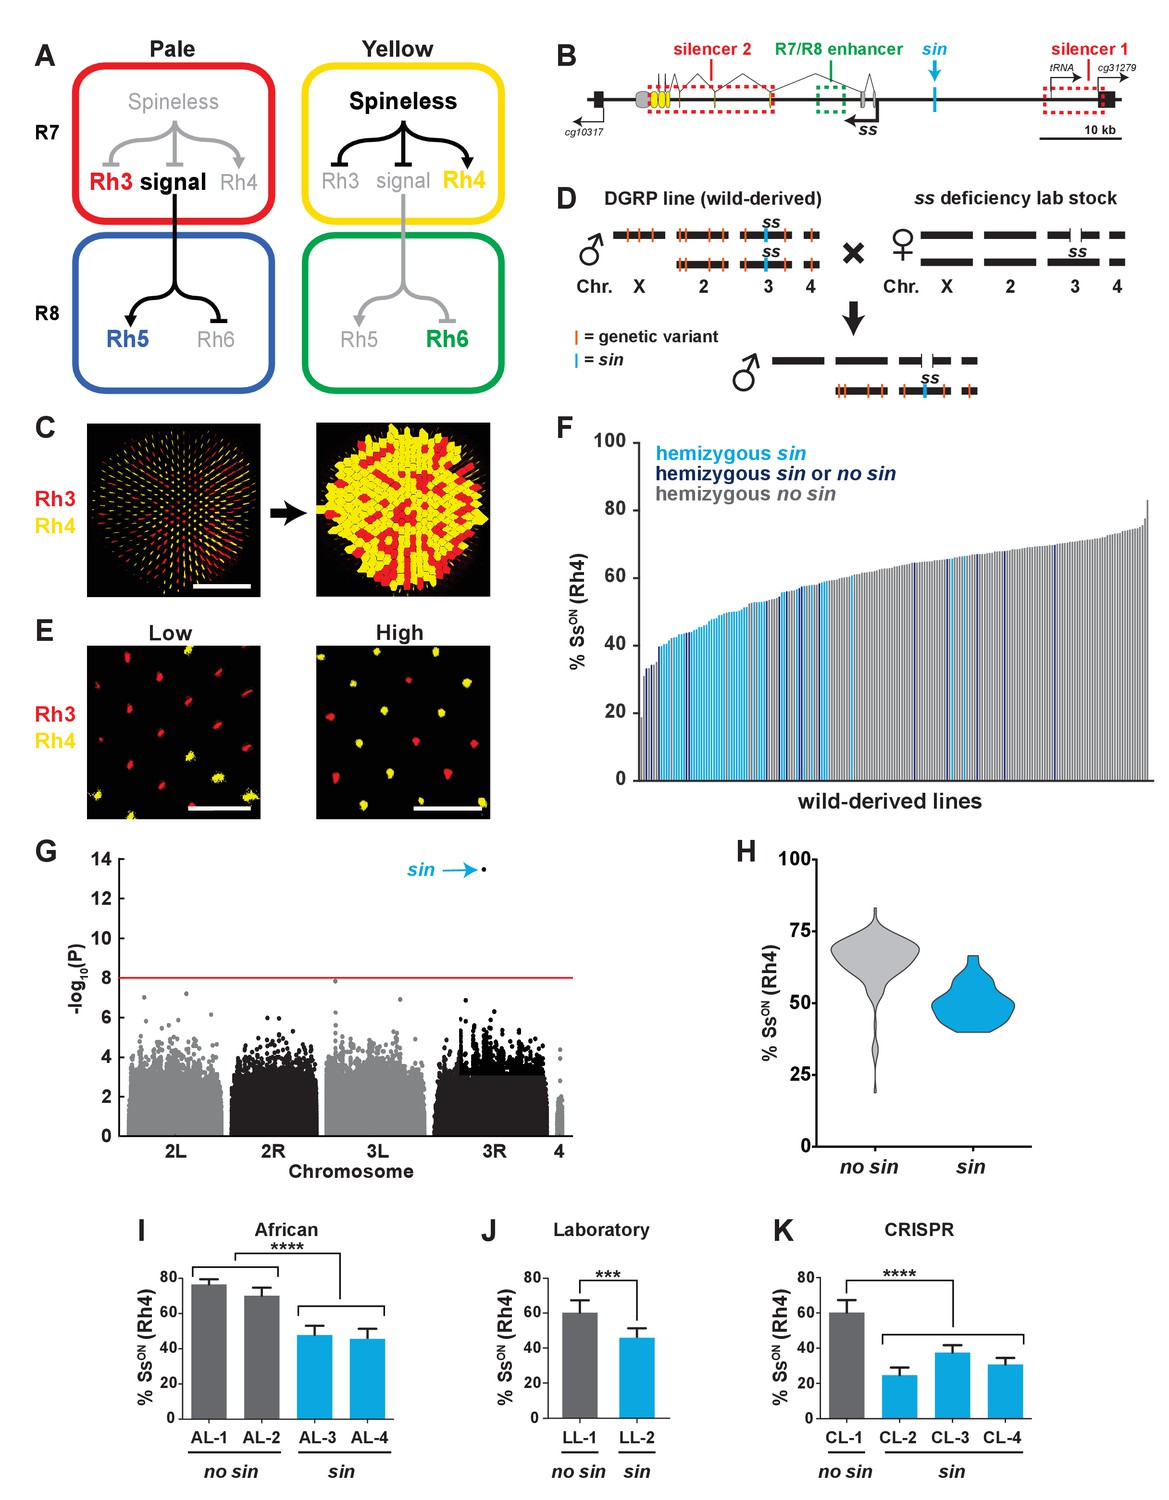
A naturally-occurring single base insertion (sin) in the ss locus lowered the ratio of SsON to SsOFF R7s.
(A) R7 and R8 subtypes are determined by the on/off expression of Spineless (Ss). (Left) The absence of Ss allows Rh3 expression in pale R7s and Rh5 expression in pale R8s. (Right) Expression of Ss induces Rh4 expression in yellow R7s and Rh6 expression in yellow R8s. The signal by which Spineless mediates Rh5 vs. Rh6 expression in R8s is currently unknown. (B) Schematic of the ss locus. Green dashed rectangle indicates R7/R8 enhancer; red dashed rectangles indicate silencer 1 and silencer 2; blue line indicates Klu binding site; blue arrow indicates ss insertion/sin; gray ovals represent untranslated exons; yellow ovals represent translated exons; black boxes indicate neighboring genes; arrows indicate transcriptional starts. See also Figure 1—figure supplement 1. (C) Image of a whole mount fly retina. (Left) Stochastic distribution of R7s expressing Rh3 (SsOFF) or Rh4 (SsON). Scale bar indicates 100 µm. (Right) An automated counting system identified and counted Rh3- and Rh4-expressing R7s. (D) Crossing scheme: Wild-derived DGRP flies were crossed with ss deficiency flies, yielding progeny that were hemizygous at the ss locus. Orange lines indicate hypothetical genetic variants; blue line indicates sin in ss. (E) Representative images from progeny in (D) with low (left; DGRP-397) and high (right; DGRP-229) proportions of SsON (Rh4) R7s. Scale bar indicates 20 µm. (F) SsON proportion varied across DGRP fly lines. sin was enriched in lines with a low proportion of SsON R7s. Each bar represents progeny from a single DGRP line, and bars are arranged in rank order. Light blue bars indicate hemizygous sin. Dark blue bars indicate hemizygous sin or hemizygous no sin (original DGRP line was heterozygous sin/no sin). Gray bars indicate hemizygous no sin. See also Figure 1—source data 1. (G) GWAS identified sin as a genetic variant associated with Ss expression. Manhattan plot of the genetic variant p-values. Genetic variants above the red line (Bonferroni correction) are considered significant. Arrow indicates sin. (H) sin was enriched in lines with a low proportion of SsON R7s. Violin plot of DGRP lines with and without sin. (I–K) Flies with sin displayed a lower proportion of SsON R7s compared to flies without sin. AL indicates African lines; LL indicates laboratory lines; CL indicates lines in which sin was inserted with CRISPR. **** indicates p<0.0001; *** indicates p<0.001. Error bars indicate standard deviation (SD). See also Figure 1—figure supplements 2–4.
-
Figure 1—source data 1
DGRP % SsON phenotypes.
- https://doi.org/10.7554/eLife.29593.007
Figure 1—figure supplement 1
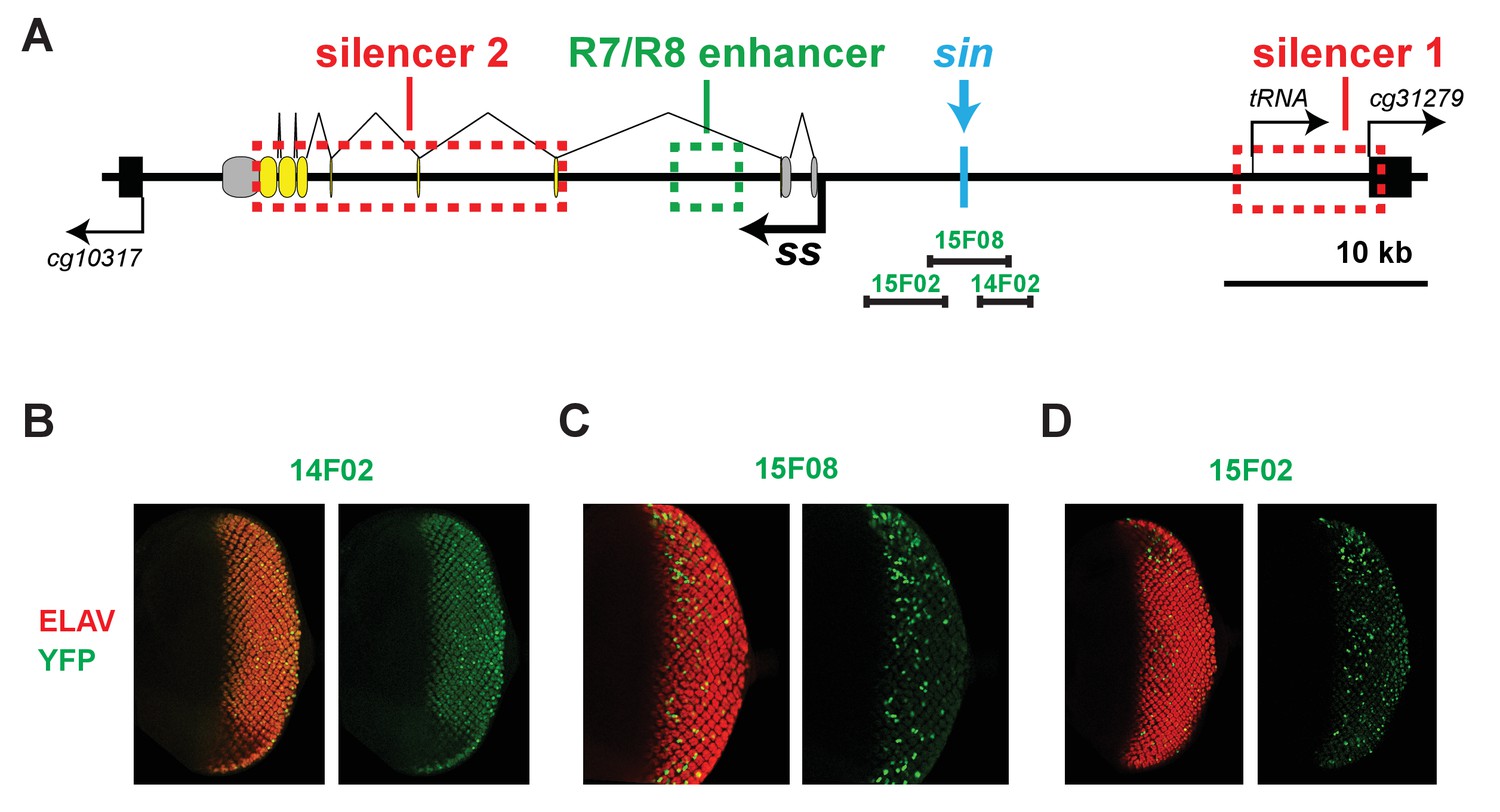
The regions encompassing and neighboring the Klu binding site have transcriptional activity in the eye.
(A) Schematic of the ss locus illustrating DNA elements tested for transcriptional activity. (B, D) The regions neighboring the Klu binding site drive expression in the larval retina. (C) The region encompassing the Klu binding site drives expression in the larval retina.
Figure 1—figure supplement 2
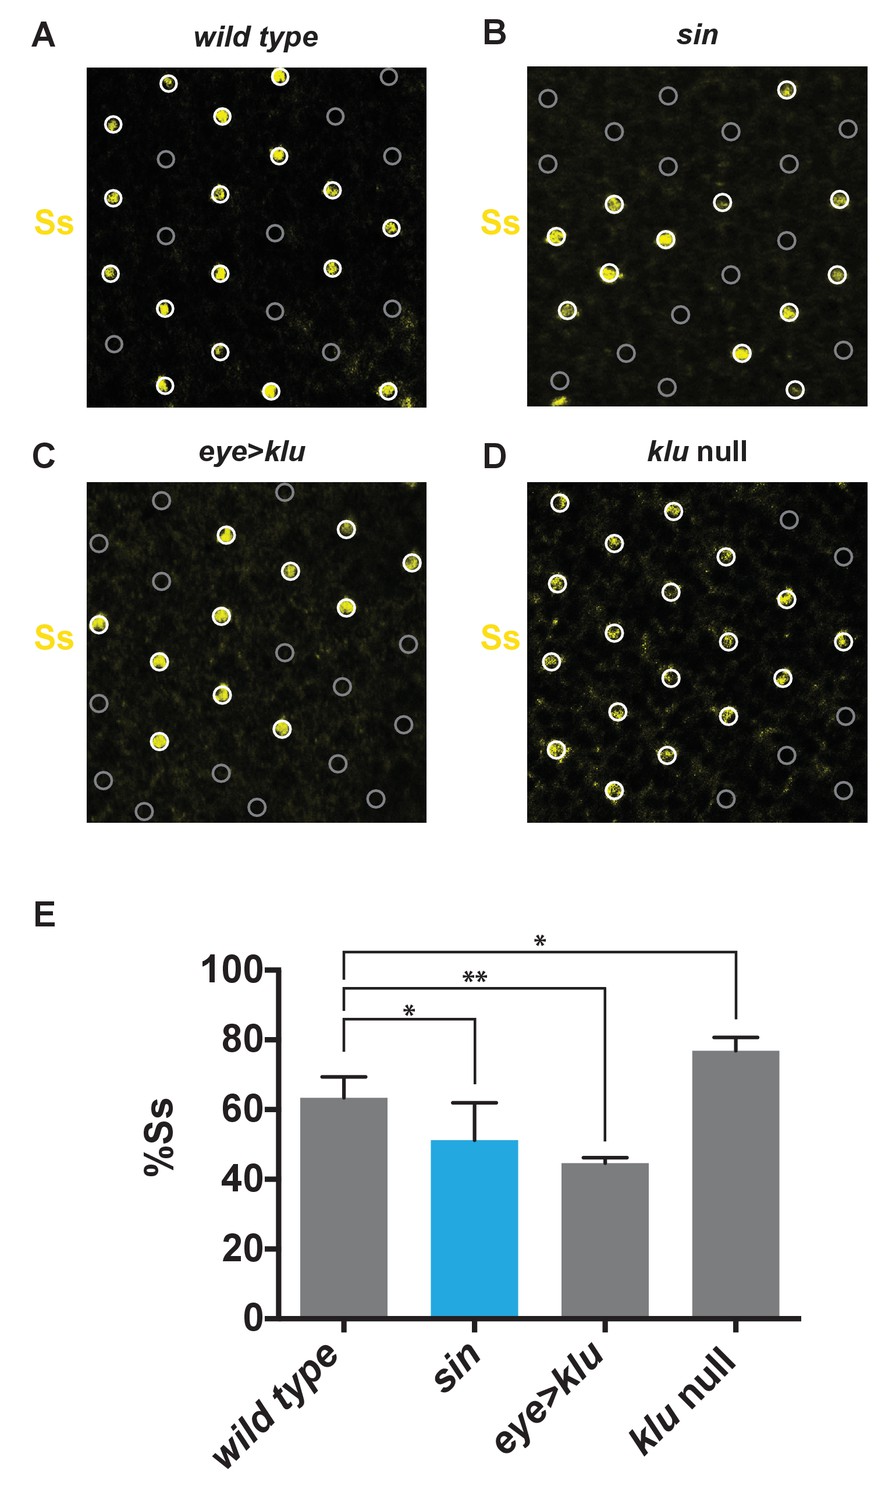
sin and klu genetic perturbations alter the proportion of SsON R7s.
(A–E) The ratio of SsON/SsOFF cells was assessed using a Ss antibody in mid-pupal retinas. (A–D) White circles indicate SsON R7s. Gray circles indicate SsOFF R7s. (A) Wild type. (B) sin. (C) Ectopic expression of Klu (eye > klu). (D) klu null mutant. (E) Quantification of A-D. The proportion of SsON R7s decreased in flies with sin or ectopic expression of Klu and increased in klu null mutants. ** indicates p<0.01; * indicates p<0.05. Error bars indicate standard deviation (SD).
Figure 1—figure supplement 3
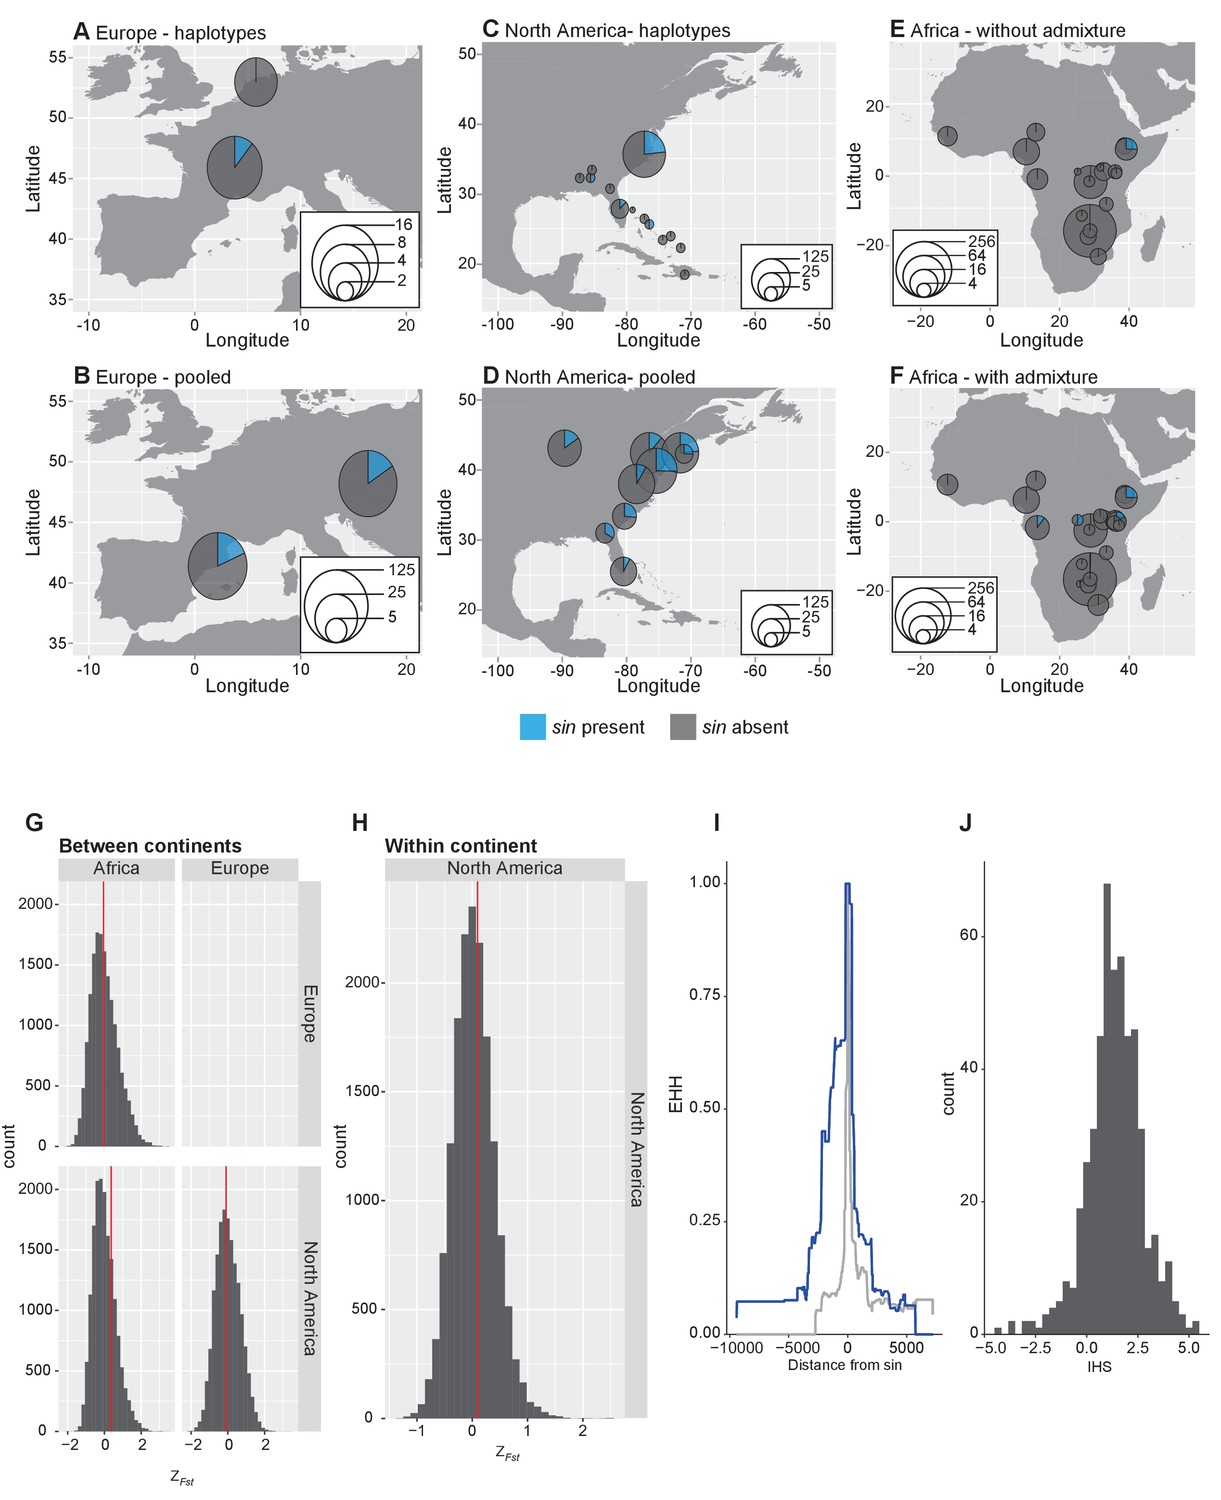
Analysis of sin allele frequency.
(A–F) Allele frequency of sin worldwide. Allele frequency of sin in European samples based on haplotype data (A) and pooled estimates (B). Allele frequency of sin in North American samples based on haplotype data (C) and pooled estimates (D). Allele frequency of sin in Africa using samples that have been filtered for admixture with non-African, cosmopolitan populations (F) and without admixture filtering (E). (G–H) Distribution of normalized FST at sin and comparable indels. (G) FST calculated between continents using average FST between populations within each continent. (H) FST calculated among populations within North America. The red line indicates the value of FST at sin. (I–J) Haplotypic patterns at sin and comparable loci. (I) Extended haplotype homozygosity at haplotypes bearing sin (blue line) versus haplotypes where sin is absent (grey line). (J) Distribution of IHS values surrounding sin and at comparable loci.
Figure 1—figure supplement 4
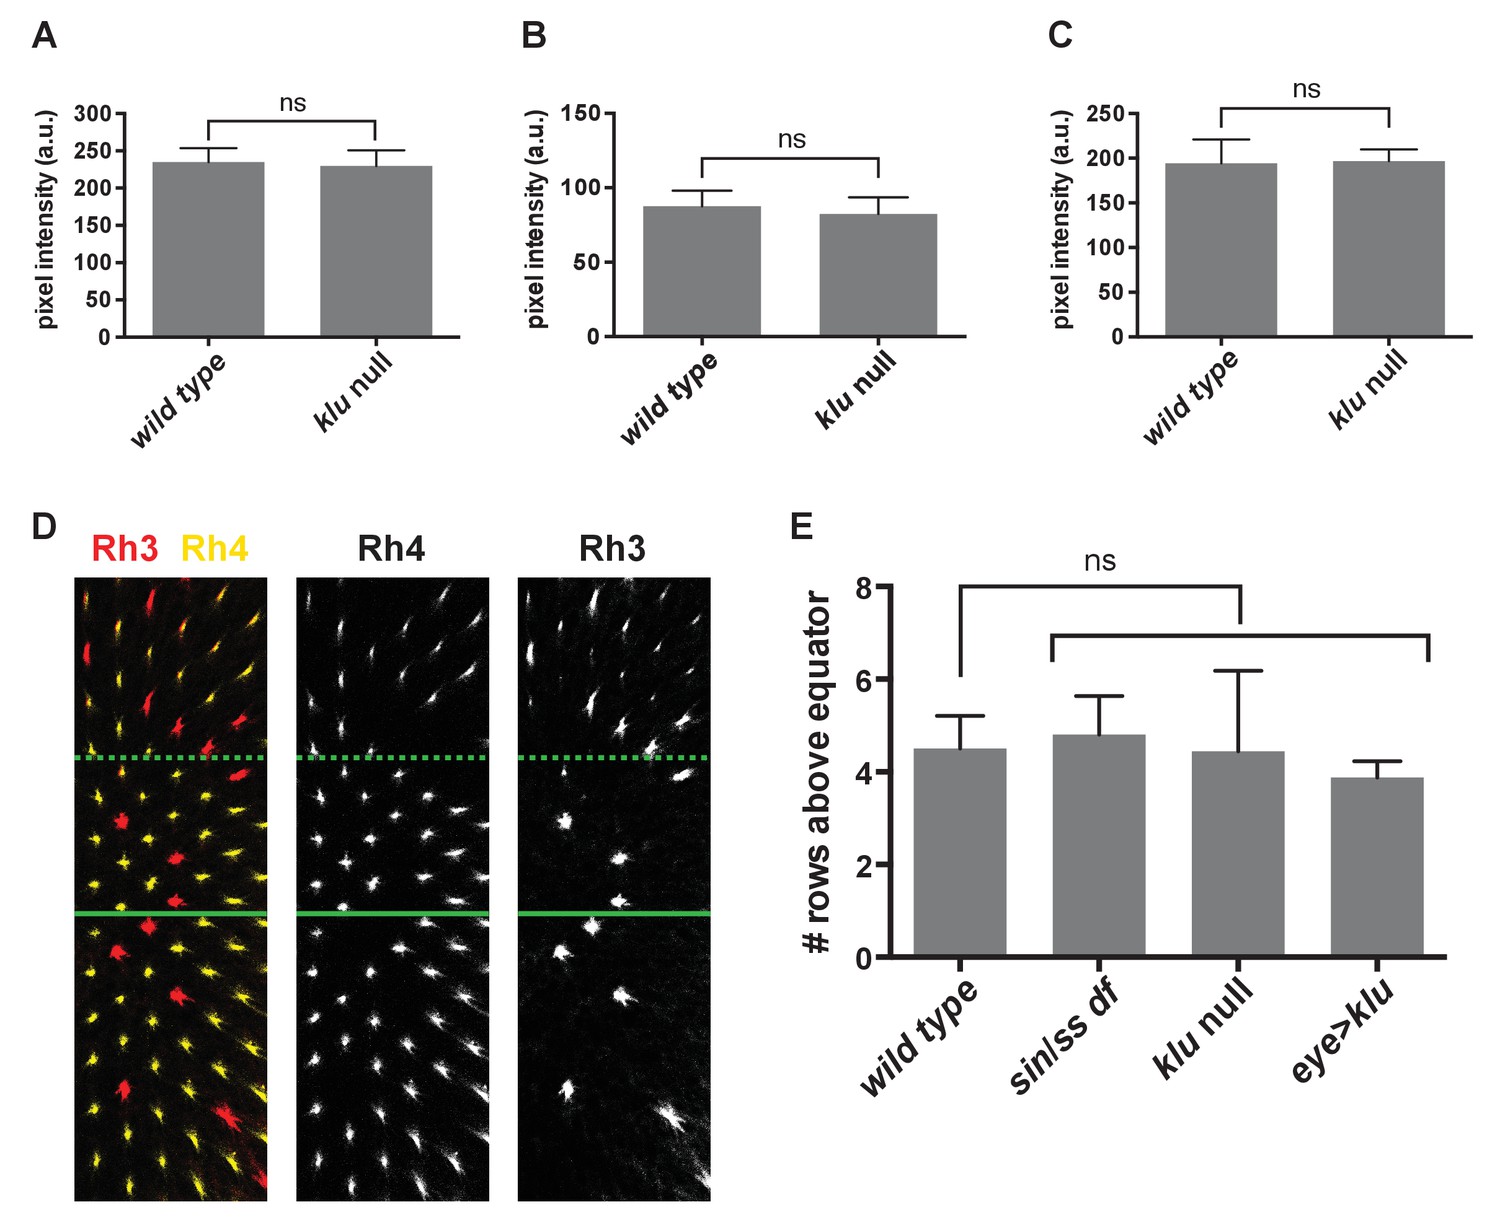
klu and sin genetic perturbations do not affect levels of Ss expression in SsON R7s.
(A–C) Levels of Ss expression were not significantly different between wild type and klu mutant SsON R7s. A-C are from three representative retinas. ns indicates not significant, p>0.05. Error bars indicate standard deviation (SD). (D–E) Ss levels are not significantly changed in flies with sin, klu null mutants, or flies with increased levels of Klu (eye >klu). We previously showed that changes in Ss levels or activity alter the exclusivity or co-expression of Rhodopsin expression (Thanawala et al., 2013). The main region of the retina is a random mosaic of R7s cells with exclusive expression of Rh3 (SsOFF) or Rh4 (SsON). This exclusivity breaks down in the dorsal third region of the retina where some R7s exclusively express Rh3 (SsOFF), but others co-express Rh4 and Rh3 (SsON). This dorsal third region starts approximately four rows above the dorsal/ventral equator of the retina. Increasing levels of Ss generates retinas with exclusive expression of Rh3 or Rh4 throughout the retina. Decreasing levels of Ss leads to an expansion of the dorsal third region of co-expression. Thus, we used the demarcation of the region of co-expression of Rh4 and Rh3 in SsON R7s as a proxy for Ss levels. (D) Representative image of lab stock Rh3 and Rh4 expression indicating position of the equator (solid green line) and dorsal third region (dashed green line). (E) Quantification of the position of the dorsal third in number of rows above the equator. ns indicates not significant, p>0.05. Error bars indicate standard deviation (SD).
Figure 2
Wild-derived flies with sin display a shift in innate color preference from green to blue.
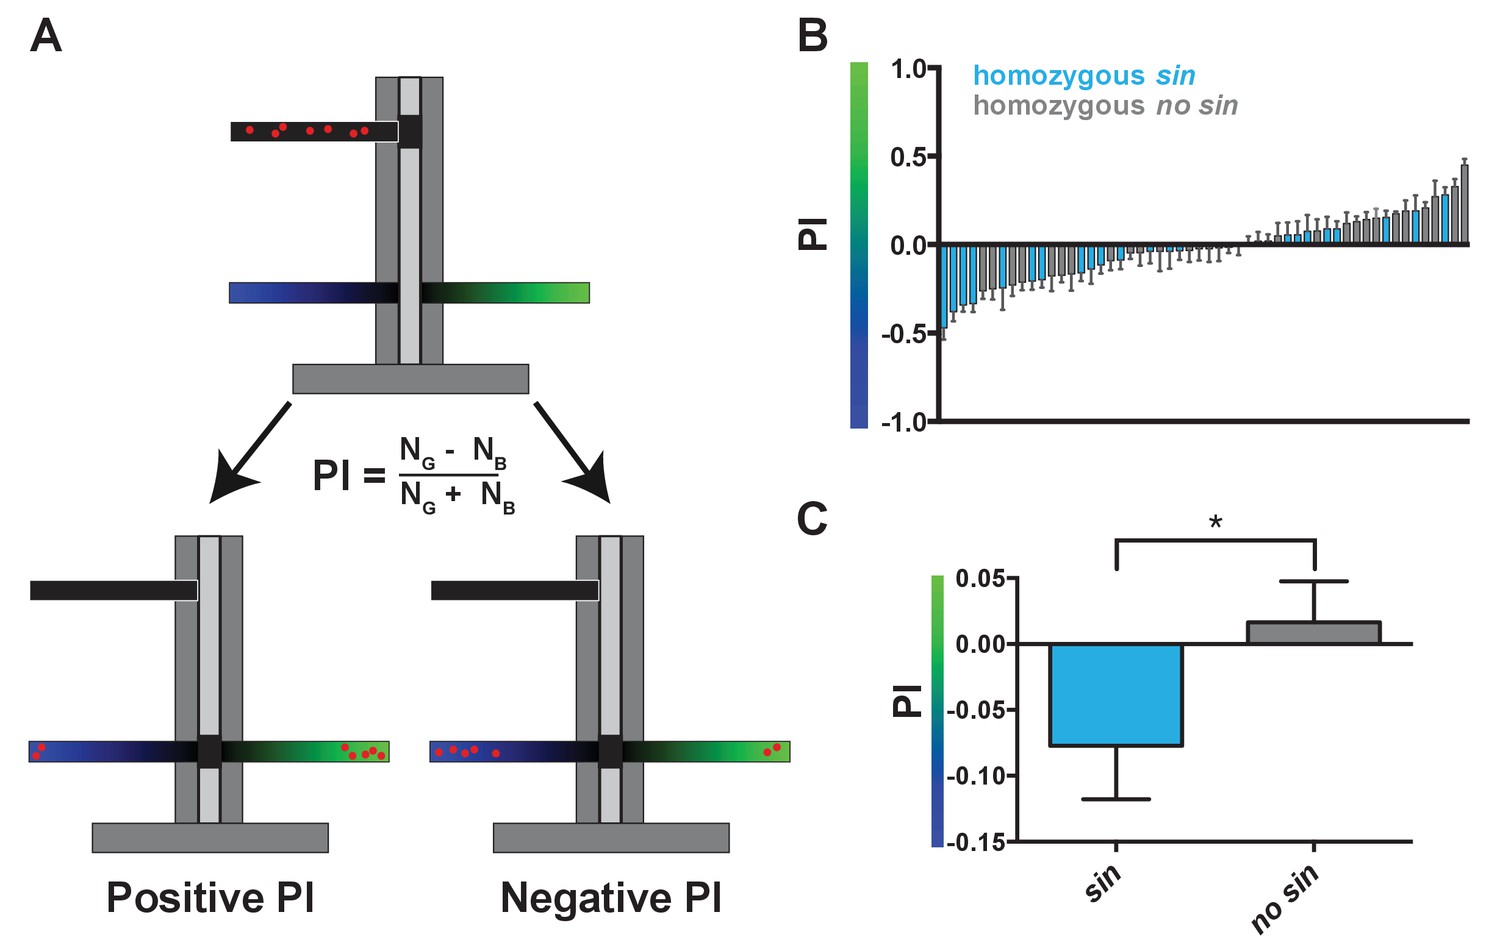
(A) Schematic of T-maze apparatus. Red dots represent flies. PI = Preference Index. Positive PI indicates preference for green light; negative PI indicates preference for blue light. NG: number of flies on green side; NB: number of flies on blue side. (B–C) Flies with sin preferred blue light, while flies without sin preferred green light. Color of bar indicates genotype of DGRP line. Light blue bars indicate homozygous sin. Gray bars indicate homozygous no sin. Error bars indicate standard error of the mean (SEM). See also Figure 2—source data 1. (B) PIs for individual DGRP lines with and without sin. (C) Averages of PIs for DGRP lines with (n = 23) and without sin (n = 31). * indicates p<0.05.
-
Figure 2—source data 1
DGRP behavior phenotypes.
- https://doi.org/10.7554/eLife.29593.009
Figure 3 with 1 supplement
sin increases the binding affinity for the transcription factor Klumpfuss.
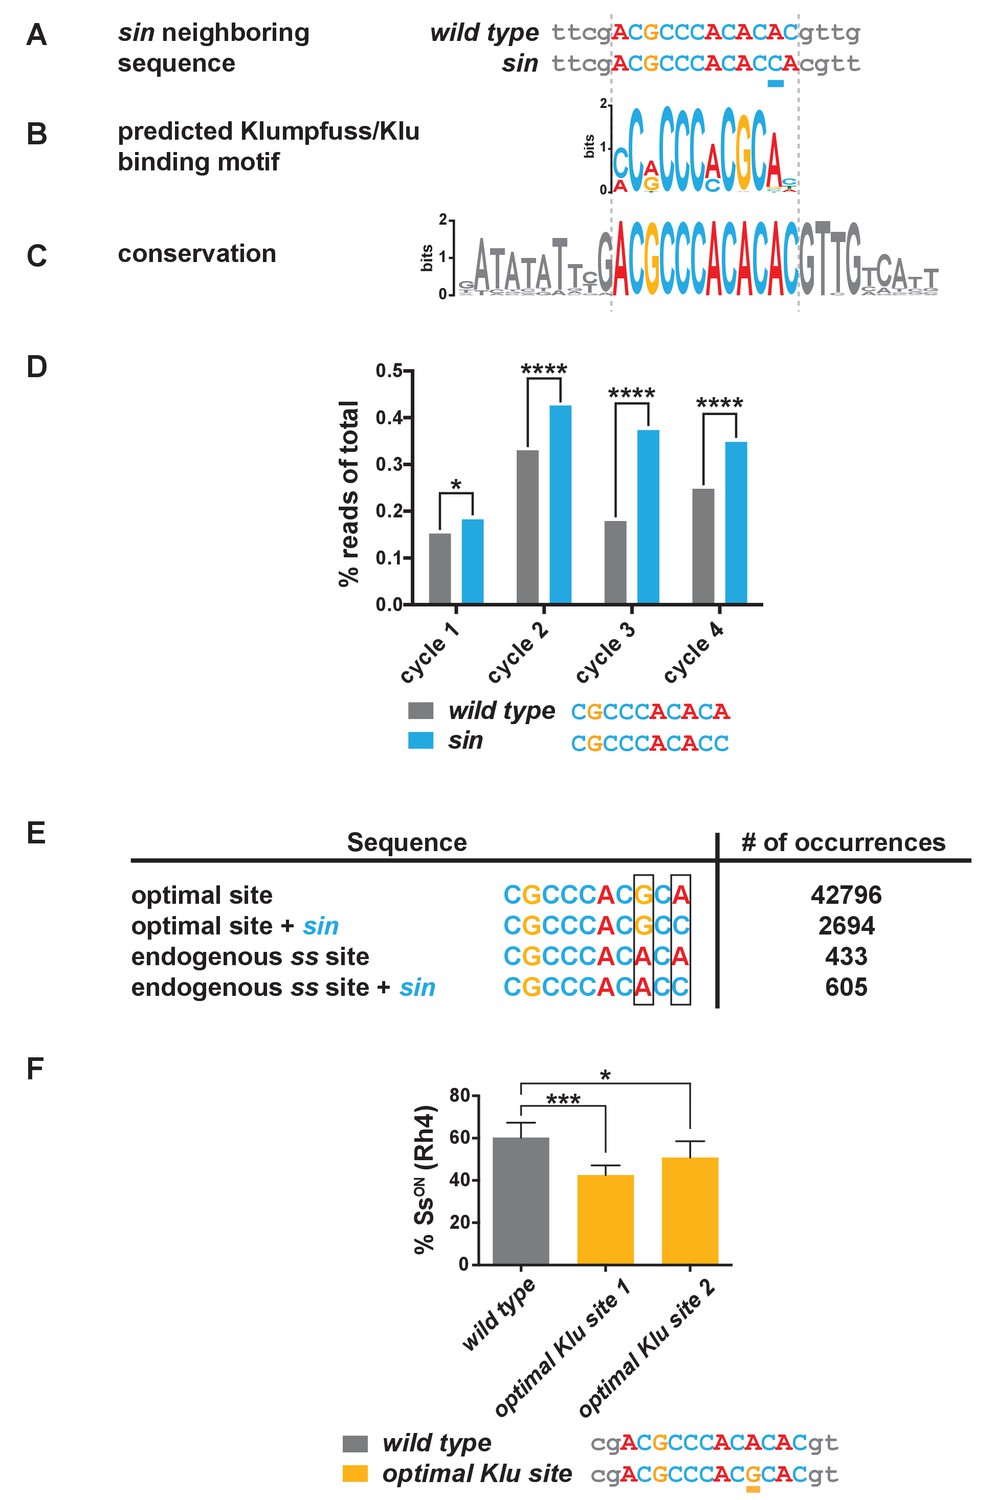
(A–C) Colored bases indicate the predicted Klu binding site. (A) sin is a single base pair insertion of a C at Chr. 3R: 16,410,775 (release 6). Underline indicates sin. (B) Position weight matrix (PWM) for Klu binding predicted from SELEX-seq. See also Figure 3—figure supplement 1A. (C) The Klu site is perfectly conserved across 21 species of Drosophila covering 50 million years of evolution. Conservation logo of the Klu site and neighboring sequence in the ss locus. Height of bases indicates degree of conservation. See also Figure 3—figure supplement 1B. (D) sin increased Klu binding affinity in vitro. Quantification of the number of reads for the Klu site with and without sin in four cycles of SELEX-seq. * indicates p<0.05; **** indicates p<0.0001. (E) Comparing the number of read-occurrences in the SELEX-seq dataset, sin increases binding of Klu to the endogenous ss site but decreases binding of Klu to the optimal site, suggesting a binding site affinity dependence between bases. Boxes highlight positions 8 and 10 in the 10-mer core sequences. (F) Flies hemizygous for an optimal Klu site displayed a lower proportion of SsON R7s compared to wild type flies. optimal Klu site 1 and optimal Klu site 2 are independent lines derived from CRISPR-mediated mutagenesis. * indicates p<0.05; *** indicates p<0.001. Error bars indicate standard deviation (SD).
Figure 3—figure supplement 1
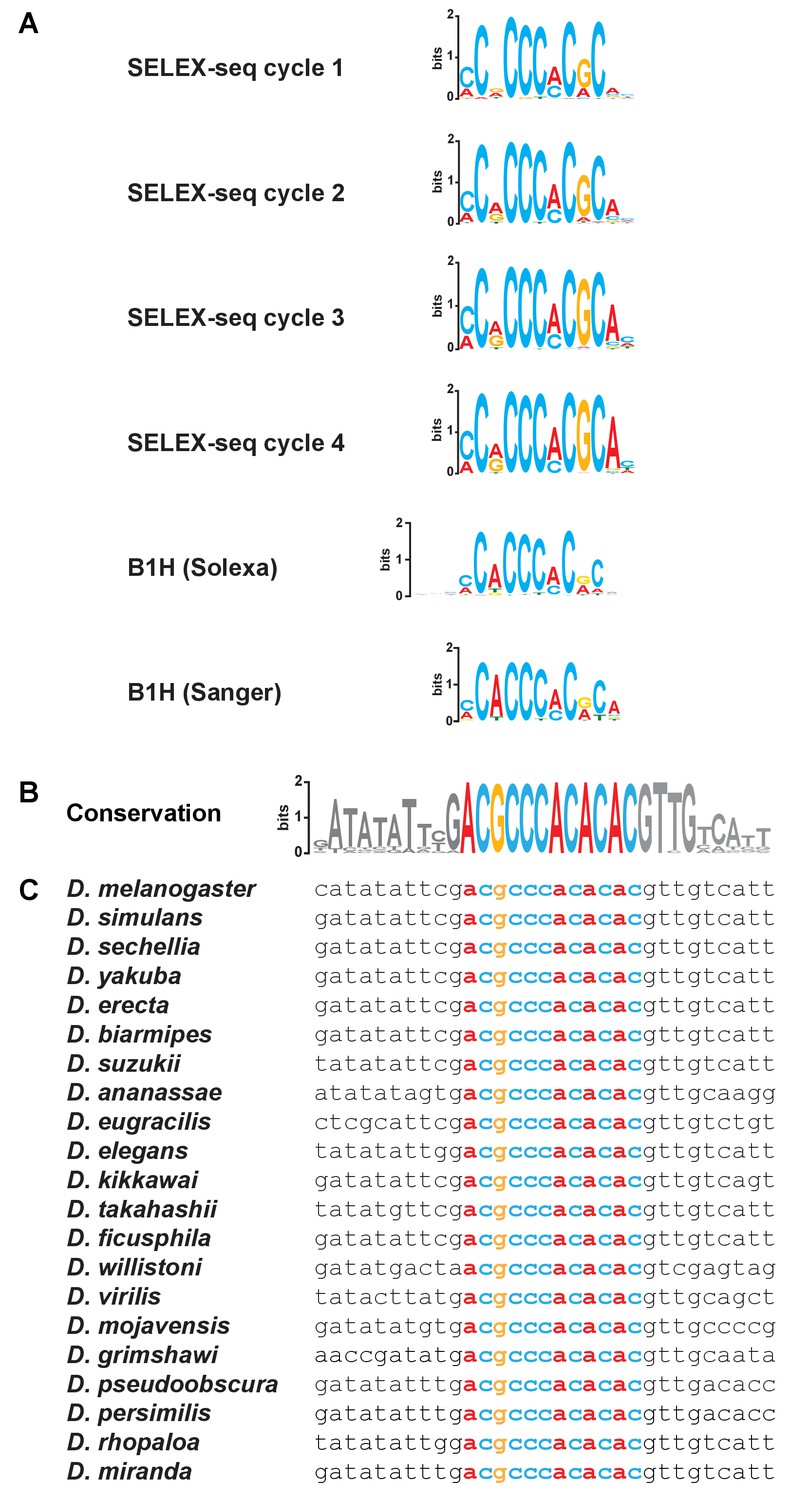
Consensus Klu binding sites and conservation of the Klu site in the ss locus.
(A) Consensus Klu binding motifs derived from B1H and SELEX-seq (four cycles) datasets. (B–C) The Klu site is perfectly conserved across 21 species of Drosophila covering 50 million years of evolution. The conservation logo, as in Figure 3C, is included to compare to sequence alignments. Height of bases indicates degree of conservation. Colored bases indicate the Klu site.
Figure 4 with 1 supplement
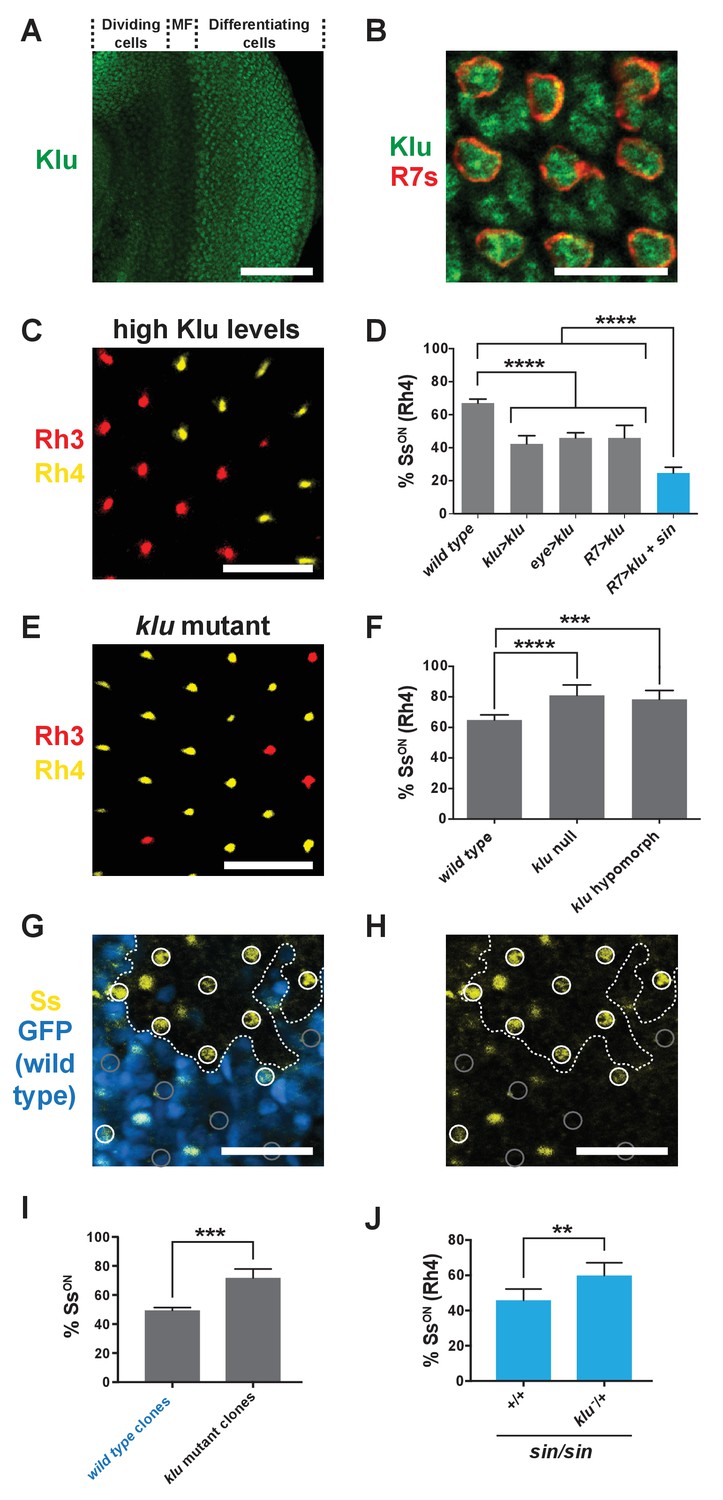
Levels of Klu determine the ratio of SsON/SsOFF R7s.
(A) Klu was expressed in the developing larval eye disc. MF indicates morphogenetic furrow. Scale bar indicates 100 µm. (B) Klu was expressed in all R7s in the developing larval eye disc. Red indicates R7s marked by pm181 >Gal4, UAS > mCD8 GFP. Scale bar indicates 10 µm. See also Figure 4—figure supplement 1. (C–D) Increasing Klu levels decreased the proportion of SsON R7s. Increasing Klu levels in flies with sin caused an additional reduction in the proportion of SsON R7s. In C, representative image of a retina from an eye > klu fly. R7s express either Rh3 (SsOFF) or Rh4 (SsON). Scale bar indicates 20 µm. In D, **** indicates p<0.0001. Error bars indicate standard deviation (SD). (E–F) klu loss-of-function mutants displayed increases in the proportion of SsON R7s. In E, representative image of a retina from a klu hypomorph. R7s express either Rh3 (SsOFF) or Rh4 (SsON). Scale bar indicates 20 µm. In F, **** indicates p<0.0001; *** indicates p<0.001. Error bars indicate standard deviation (SD). (G–H) The proportion of SsON R7s was higher in klu null mutant clones compared to wild type clones in mid-pupal retinas. GFP+ indicates wild type clone; GFP- indicates klu mutant clone. The dotted line marks the clone boundary. White circles indicate SsON R7s; gray circles indicate SsOFF R7s. In addition to expression in circled R7s, Ss was expressed in bristle cells (unmarked). Scale bar indicates 20 µm. (I) Quantification of % SsON R7s in klu null mutant and wild type clones. *** indicates p<0.001. Error bars indicate standard deviation (SD). (J) Decreasing klu gene dosage in klu null mutant heterozygotes suppressed the sin phenotype. ** indicates p<0.01. Error bars indicate standard deviation (SD).
Figure 4—figure supplement 1
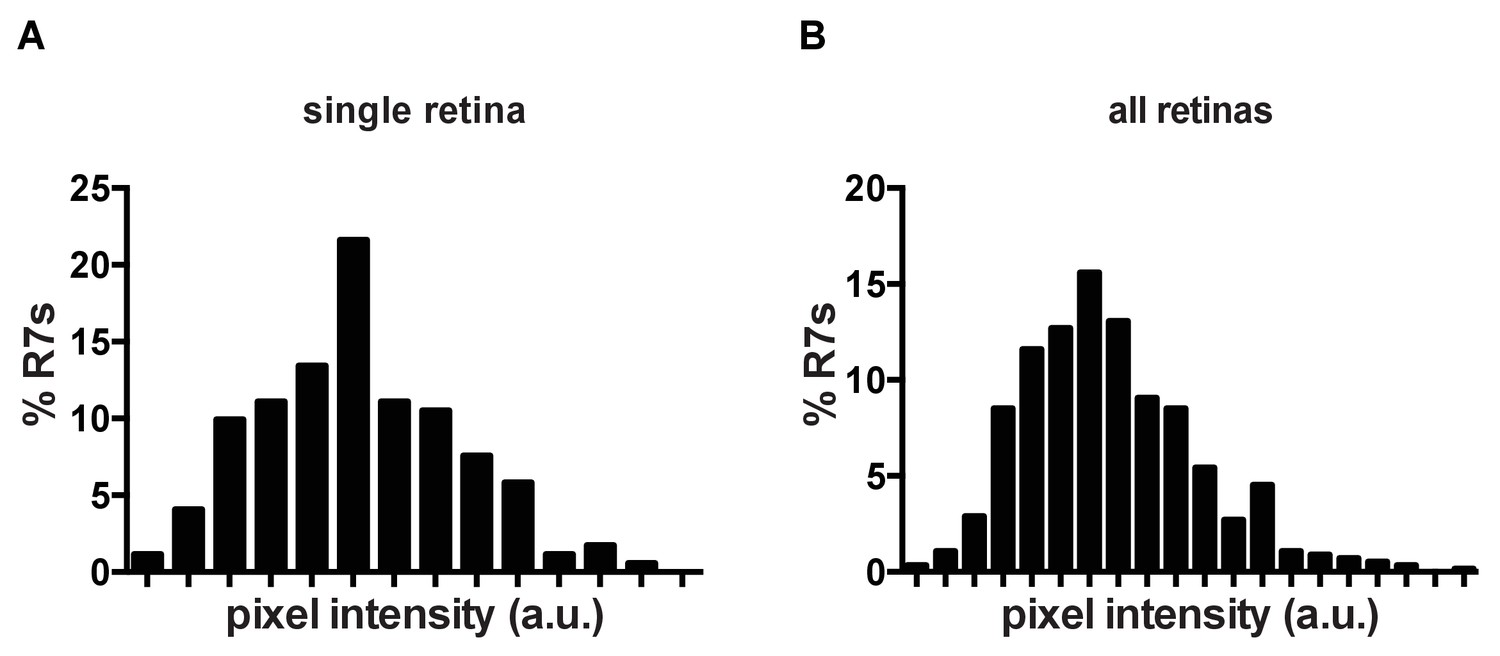
Klu is expressed in R7s in a Gaussian distribution.
(A) Quantification of Klu levels in a single retina. (B) Quantification of Klu levels across several retinas (n = 5).
Additional files
-
Transparent reporting form
- https://doi.org/10.7554/eLife.29593.014
Download links
A two-part list of links to download the article, or parts of the article, in various formats.
Downloads (link to download the article as PDF)
Open citations (links to open the citations from this article in various online reference manager services)
Cite this article (links to download the citations from this article in formats compatible with various reference manager tools)
Natural variation in stochastic photoreceptor specification and color preference in Drosophila
eLife 6:e29593.
https://doi.org/10.7554/eLife.29593


