High-quality ultrastructural preservation using cryofixation for 3D electron microscopy of genetically labeled tissues
- University of California, San Diego, United States
Figures
Figure 1

Flowchart of the CryoChem method.
After cryofixation by high-pressure freezing and freeze-substitution, cryofixed samples are rehydrated gradually. Rehydrated samples can then be imaged for fluorescence, subjected to DAB labeling reaction or en bloc stained with a substantial amount of heavy metals. The protocol is modular; the first three processes are the core steps of CCM and the starred steps are optional depending on the experimental design. The samples are then dehydrated for resin infiltration and embedding, followed by imaging with any EM technique of choice. Blue and grey denote hydrated and dehydrated states of the sample, respectively.
Figure 2 with 2 supplements
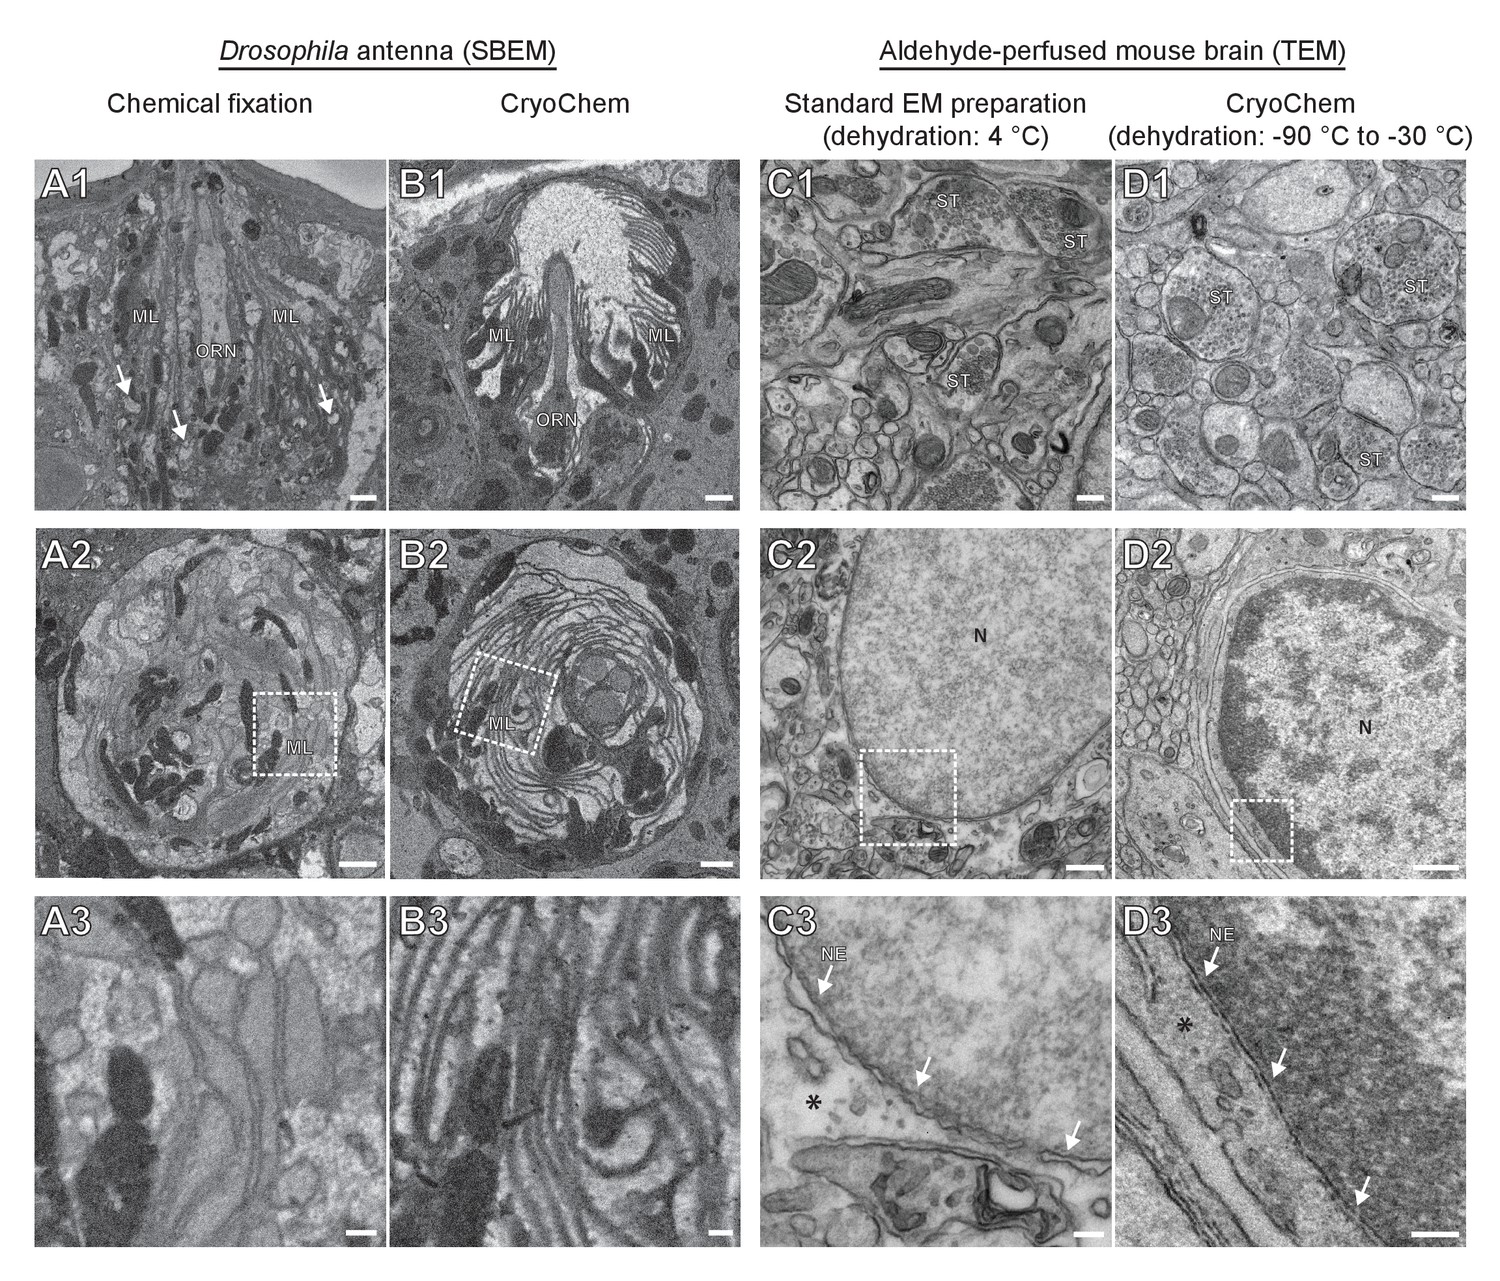
CryoChem method offers high-quality ultrastructural preservation and sufficient en bloc staining for SBEM.
EM images were acquired to assess the morphology of CCM-processed tissues. (A-B) The quality of preservation was markedly improved in the CCM-processed Drosophila antenna compared to the chemically fixed counterpart. Pixel resolution of SBEM images (x,y): 6.5 nm. (A1 and B1) Unlike the CCM-processed antenna, the chemically fixed antenna showed signs of extraction (arrow) and disorganized membranes. ORN: olfactory receptor neuron; ML: microlamella. Scale bars: 1 µm. (A2 and B2) The microlamellae were well-preserved in the CCM-processed antenna, compared to the chemically fixed samples. Scale bars: 1 µm. (A3 and B3) In the enlarged views of the boxed regions, the microlamellae in the CCM-processed antenna appeared uniform in size and shape, unlike the chemically fixed ones which were distorted. Scale bars: 200 nm. (C-D) CCM enhanced the morphological preservation of aldehyde-perfused mouse brain. The initial dehydration in standard EM preparation took place on ice for 1 hr, but it occurred during freeze-substitution at −90 °C to −30 °C for over 5 days in CCM processing. (C1 and D1) The smoothness of membranes was improved by CCM processing. ST: synaptic terminal. Scale bars: 200 nm. Pixel resolution of TEM images (x,y): 1.92 nm. (C2 and D2) The preservation of nuclear envelope was improved by CCM processing. N: nucleus. Scale bars: 500 nm. Pixel resolution (x,y): 2.88 nm. (C3 and D3) In the enlarged views of the boxed regions, the nuclear envelope (NE; arrows) appeared smoother and the cytoplasmic density (asterisk) was increased with CCM processing. We note that the chromatin was more heavily stained in the CCM-processed specimen, likely due to the additional exposure to uranyl acetate during freeze-substitution. Scale bars: 100 nm. Pixel resolution (x,y): 1.14 nm.
Figure 2—figure supplement 1
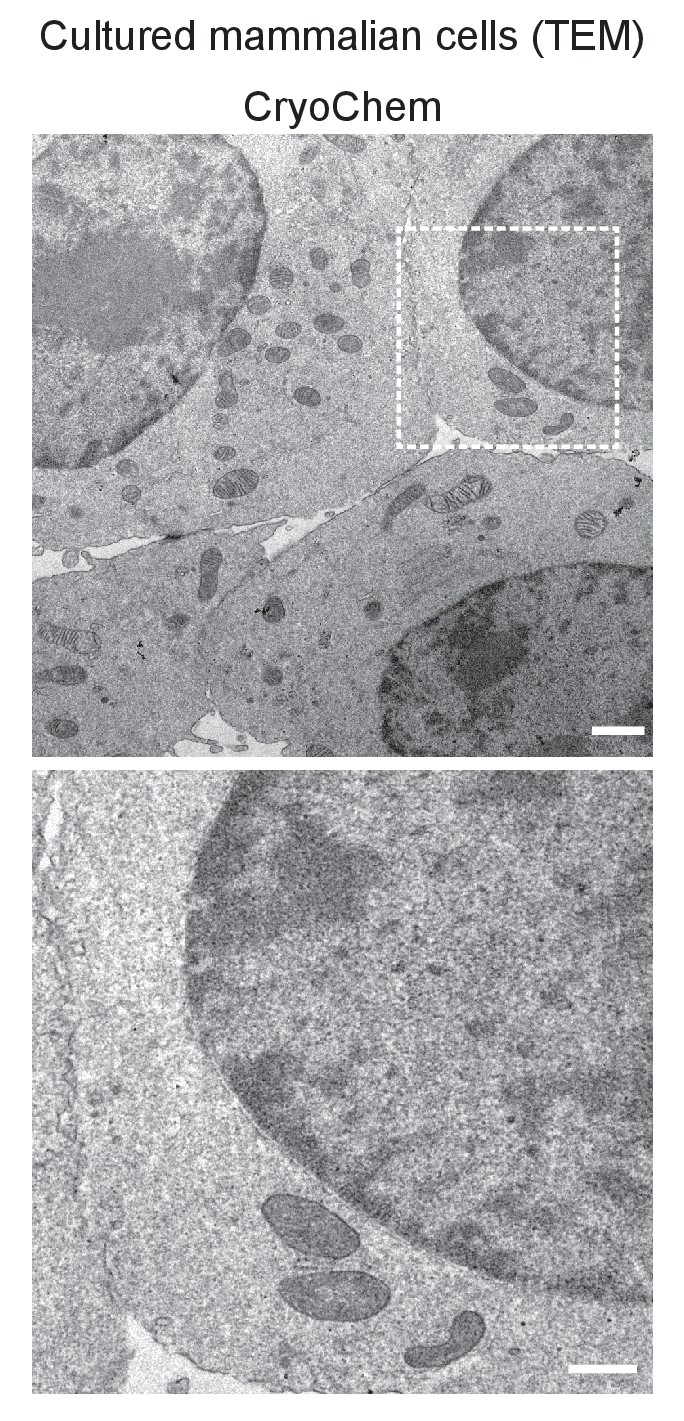
TEM images showed well-preserved ultrastructures in the CCM-processed HEK 293T cells.
In the enlarged view of the boxed region (bottom panel), smooth nuclear membranes were observed. Scale bars: 1 µm for the top panel, 500 nm for the bottom panel. Pixel resolution (x,y): 6.01 nm.
Figure 2—video 1
A SBEM volume from a CryoChem-processed Drosophila antenna.
Scale bar: 500 nm. SBEM imaging parameters (only a small region of the SBEM volume acquired is shown in the video): Z step: 50 nm; Z dimension: 1200 sections; raster size: 12k × 9k; pixel size: 3.8 nm.
Figure 3 with 1 supplement
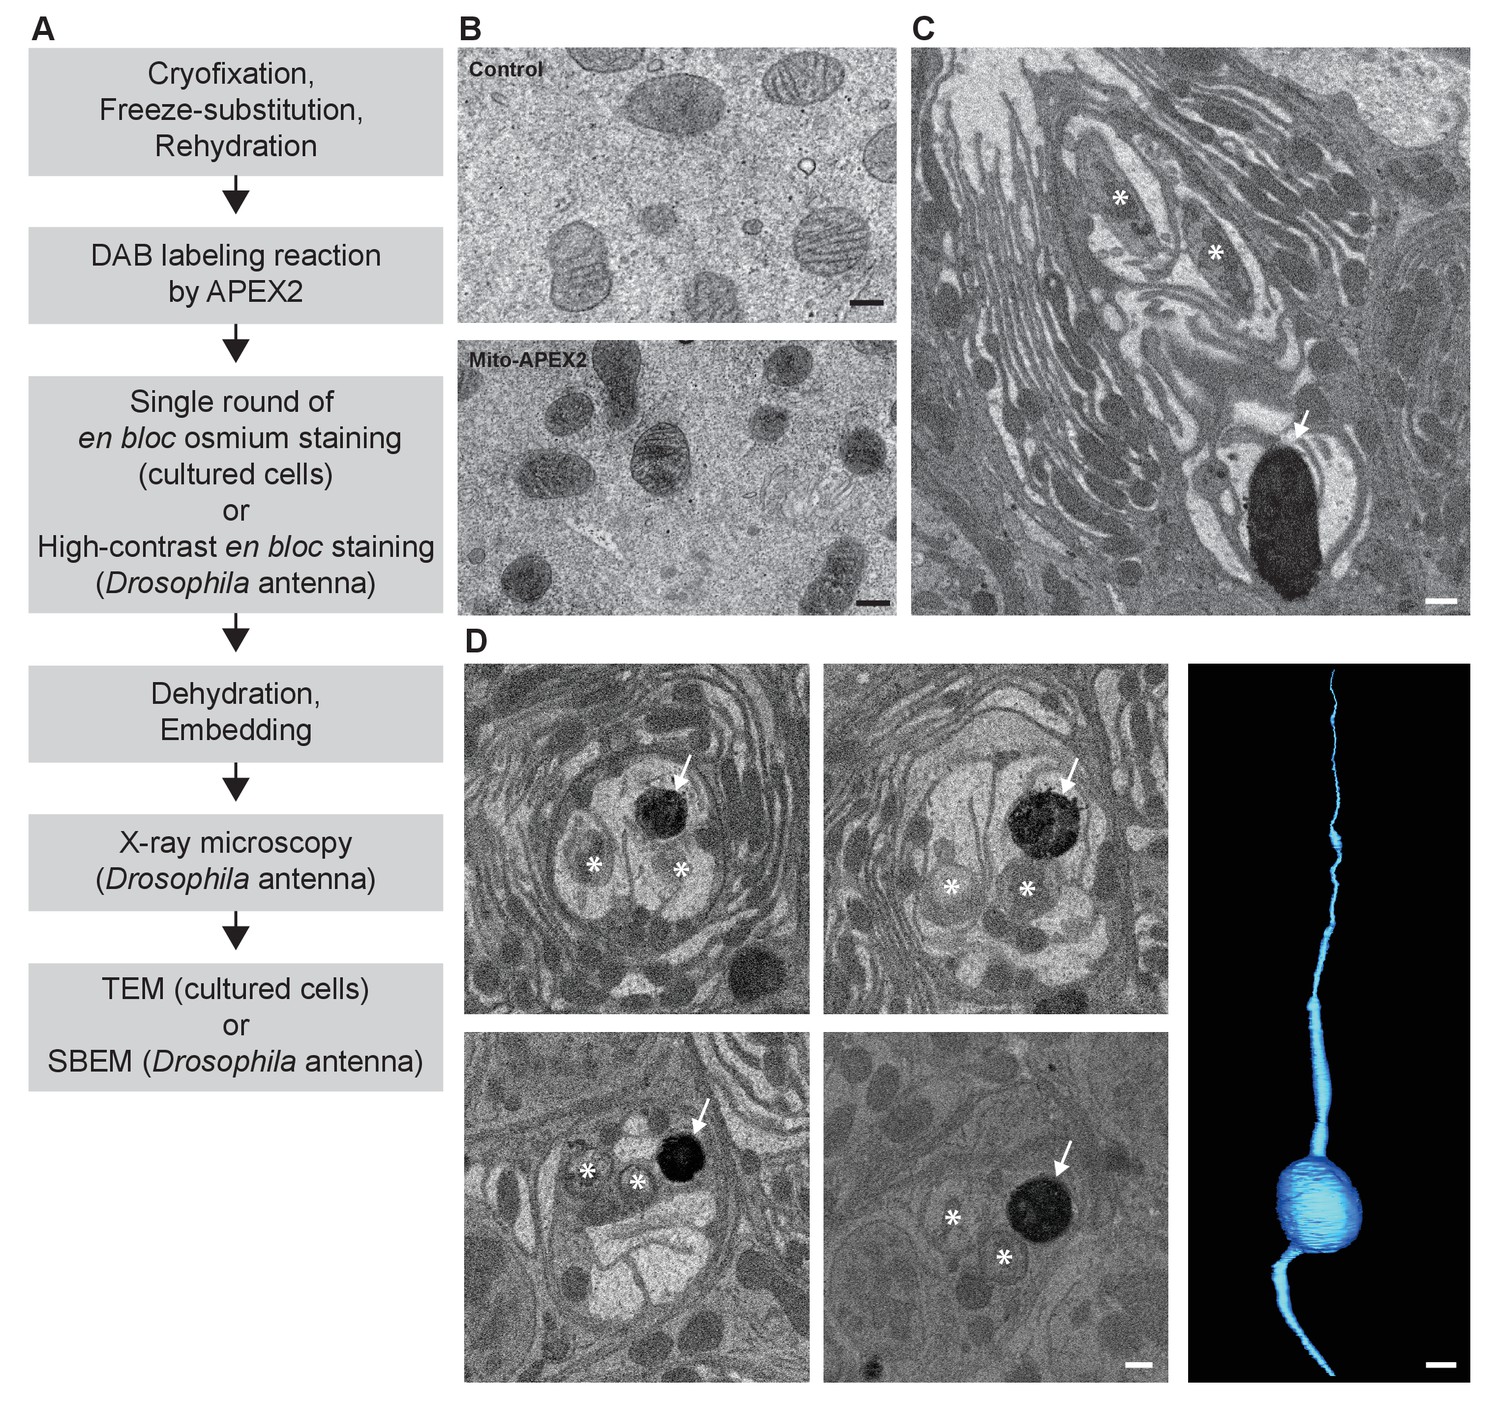
CryoChem method enables DAB labeling by APEX2 in cryofixed tissues.
In the CCM-processed cultured cells and Drosophila antennae, DAB labeling was observed in cells expressing APEX2. (A) Flowchart for DAB labeling of target structures expressing APEX2 in CCM-processed samples. In our experiments, the cultured cells were imaged with TEM and the Drosophila antennae were imaged with X-ray microscopy, followed by SBEM. (B) Mitochondria in the HEK 293T cell transfected with Mito-APEX2 were labeled with DAB (bottom panel), in contrast to the untransfected control cell (top panel). Scale bars: 200 nm. Pixel resolution (x,y): 3.97 nm (top panel); 2.88 nm (bottom panel). (C) An APEX2-expressing olfactory receptor neuron (ORN) was labeled with DAB (arrow) in the Drosophila antenna (10XUAS-myc-APEX2-Orco; Or47b-GAL4). Asterisks denote ORNs without APEX2 expression. Scale bar: 500 nm. Pixel resolution of SBEM images (x,y): 6.5 nm. (D) A series of SBEM images showing the same DAB labeled Drosophila ORN (arrow) in different planes of section. Asterisks denote ORNs without APEX2 expression. The images were acquired using standard imaging methods without charge compensation by nitrogen gas injection (Deerinck et al., 2018). These images, together with the rest of the EM volume acquired using SBEM, enabled semi-automatic segmentation and 3D reconstruction of the labeled ORN (right panel). Scale bars: 500 nm for SBEM images, 2 µm for the 3D model of ORN. SBEM imaging parameters: Z step: 50 nm; Z dimension: 1200 sections; raster size: 12k × 9k; pixel size: 3.8 nm.
Figure 3—video 1
An X-ray micro-computed tomography volume from a CCM-processed Drosophila antenna showing DAB labeling in subsets of ORNs expressing APEX2 (10XUAS-mCD8GFP-APEX2; Or22a-GAL4).
The damaged region on the opposite side of the labeled cells indicates the hole poked in the antenna to facilitate solution exchange. Scale bar: 30 μm.
Figure 4 with 1 supplement
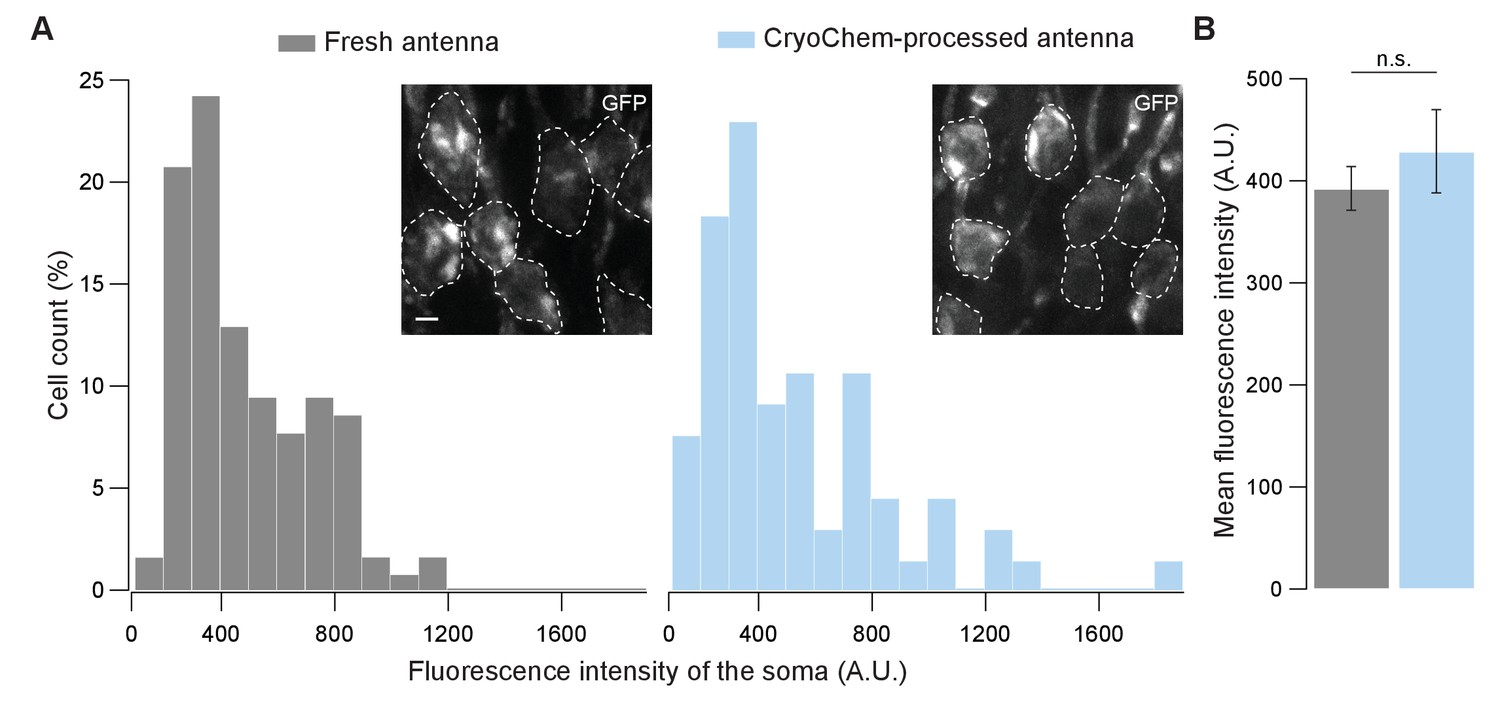
GFP fluorescence is well-preserved in CryoChem-processed samples.
Confocal images were taken to quantify the level of GFP fluorescence in Drosophila ORNs. Antennae were collected from transgenic flies expressing GFP in a subset of ORNs. (A) GFP fluorescence intensity distributions of the ORN soma in the freshly-dissected, unfixed antennae (left panel) and the CCM-processed antennae (right panel) are not significantly different. p=0.810, Kolmogorov-Smirnov test. Insets show representative images, with ORN soma outlined. Scale bar: 2 µm. (B) Comparison of the average fluorescence intensities. GFP intensities are virtually identical between neurons in the unfixed antennae and the frozen-rehydrated antennae. n = 3 antennae, Error bars denote SEM, p=0.950, Mann-Whitney U Test.
-
Figure 4—source data 1
GPF fluorescence intensities in unfixed and CryoChem-processed Drosophila ORN soma.
- https://doi.org/10.7554/eLife.35524.010
Figure 4—figure supplement 1
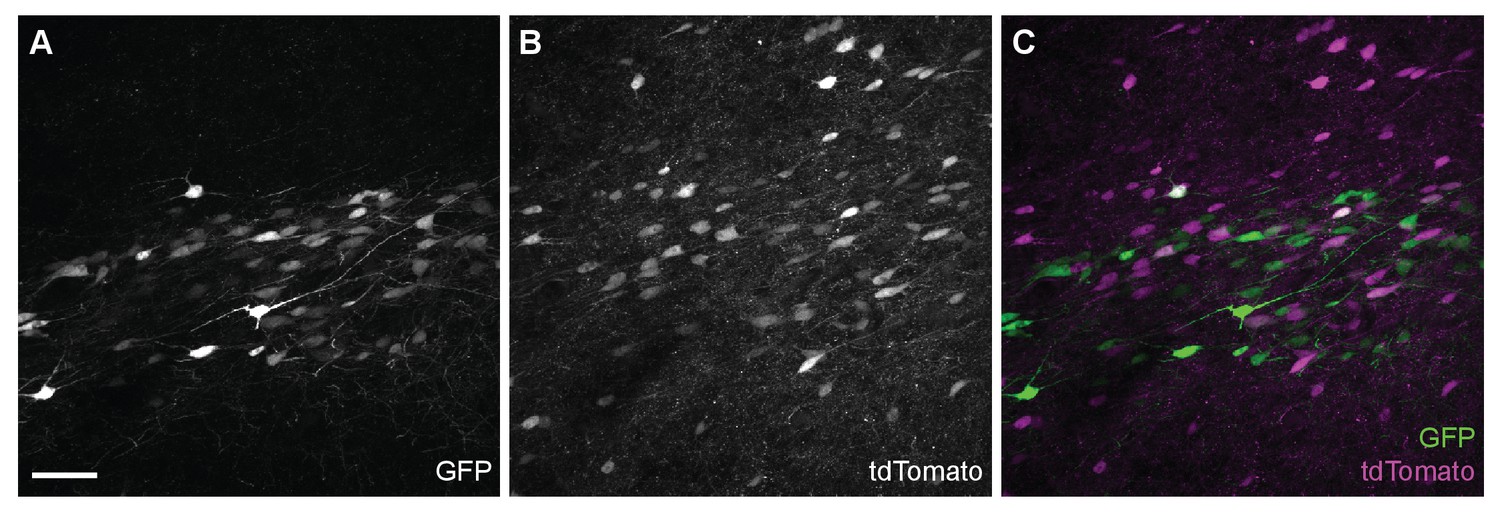
GFP and tdTomato fluorescence in a cryofixed-rehydrated mouse brain.
(A) GFP- and (B) tdTomato-positive neurons (C) Co-expression of GFP and tdTomato fluorescence was detected in the cryofixed-rehydrated mouse brain. Scale bar: 50 µm.
Figure 5 with 2 supplements
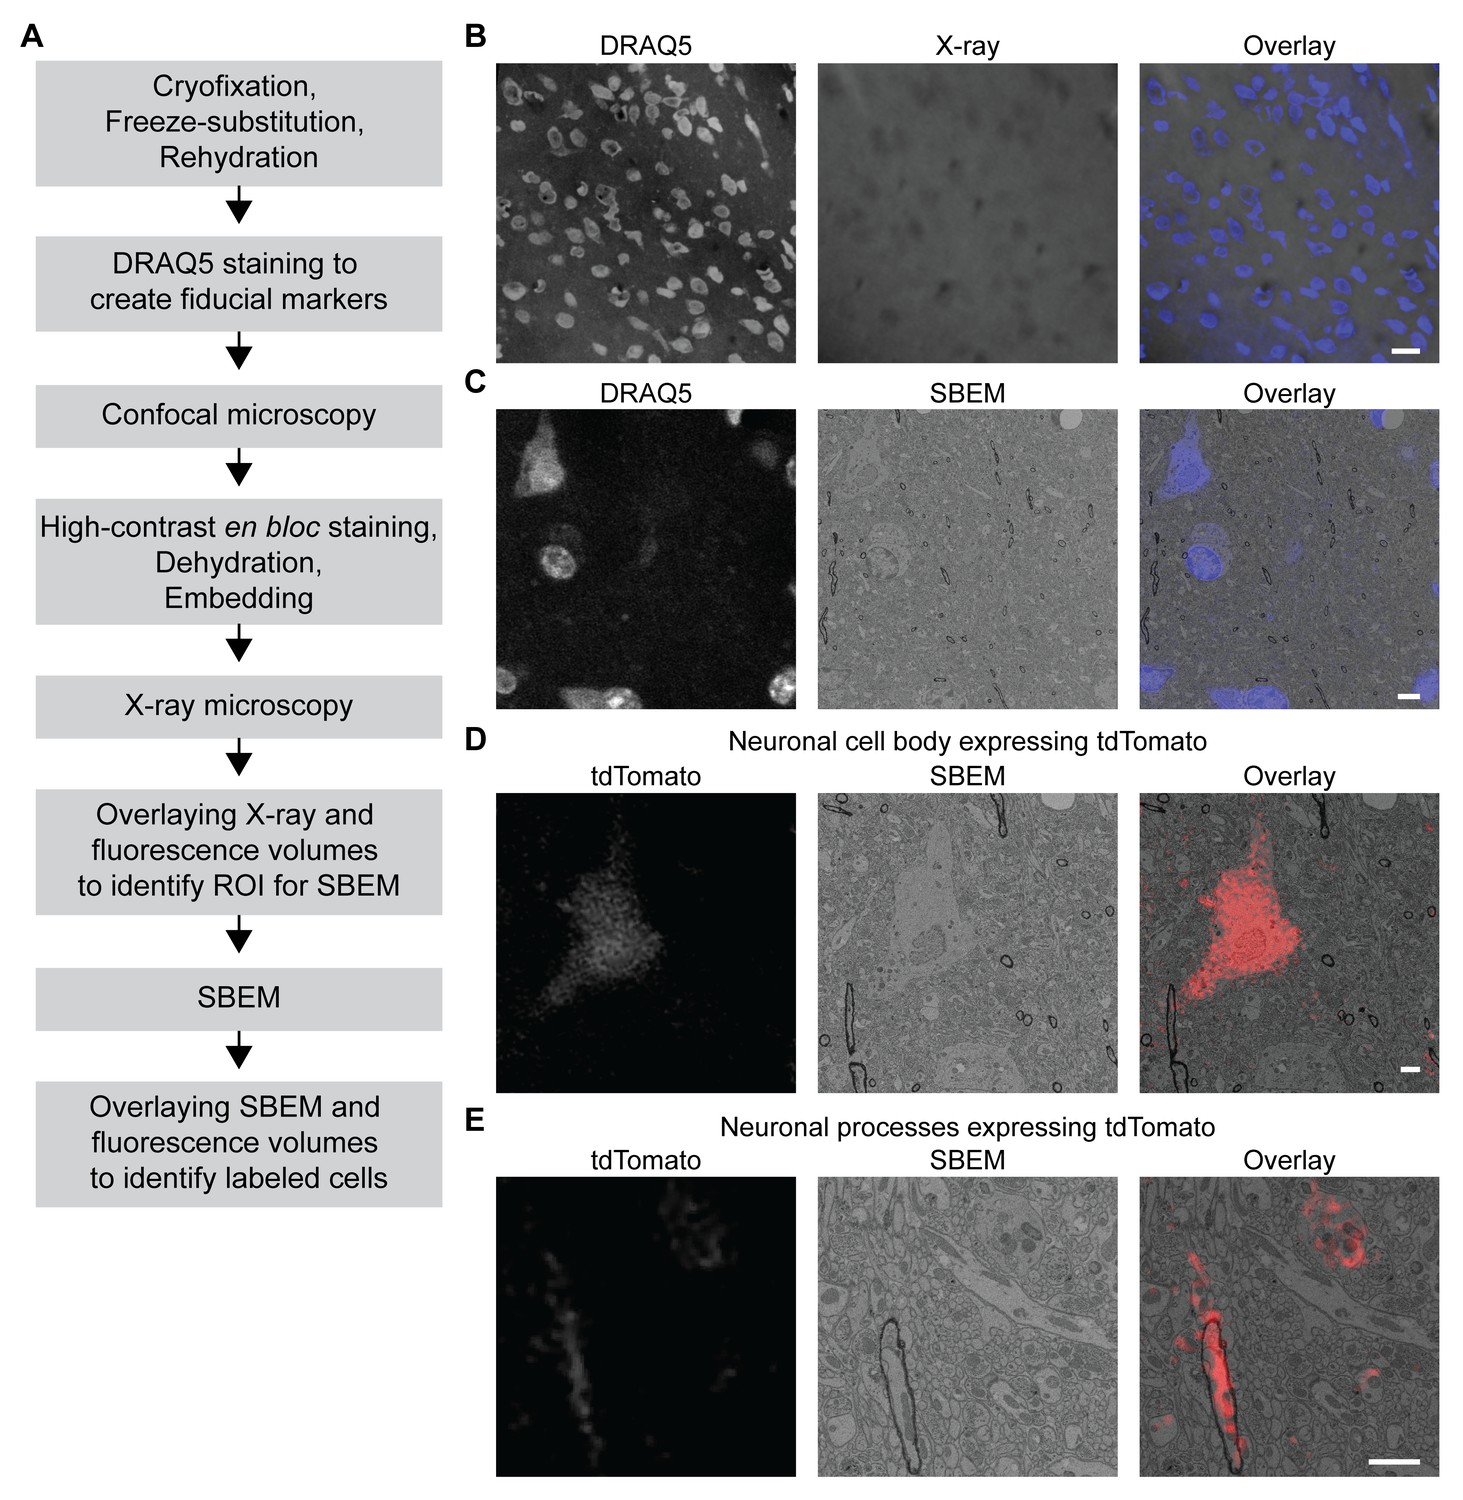
3D correlated light and electron microscopy (CLEM) in CCM-processed mouse brain.
Mouse brain slices with fluorescently labeled neurons were processed with CCM, imaged with confocal microscopy, X-ray microscopy and SBEM for 3D CLEM. (A) Flowchart for performing 3D CLEM with CCM-processed samples. Similar to a typical CCM protocol, cryofixed samples are first freeze-substituted and rehydrated. The frozen-rehydrated sample is then stained with DRAQ5 to label DNA in the nuclei. Next, the region of interest (ROI) is identified using confocal microscopy based on fluorescent signals, while the DRAQ5 signals are also acquired to serve as fiducial markers. Subsequently, the sample is stained, dehydrated and embedded for X-ray microscopy and SBEM. Using the DRAQ5 signals as fiducial markers, the confocal volumes can be registered to the X-ray volume such that the ROI for SBEM can be identified. Once the SBEM volume is acquired, it can be registered to the confocal volumes based on the positions of the nuclei for 3D CLEM. (B) An example of the DRAQ5 fluorescence signals (left), the corresponding ROI in X-ray volume (middle) and the overlay (right). This image registration process facilitates ROI identification in SBEM. Scale bar: 20 µm. (C) DRAQ5 fluorescence labeling served as fiducial points for registering the confocal volume to the SBEM volume. Scale bar: 5 µm. (D) The cell body of a tdTomato-expressing neuron (left) was identified in the SBEM volume (middle) through CLEM (right). (E) Neuronal processes expressing tdTomato (left) were also identified in the SBEM volume (middle) through CLEM (right). Scale bars: 2 µm, for both (D) and (E). SBEM imaging parameters: Z step: 70 nm; Z dimension: 695 sections; raster size: 10k × 15k; pixel size: 6.8 nm.
Figure 5—figure supplement 1

A correlation of subcellular structure can be achieved using 3D CLEM performed on the CCM-processed mouse brain.
A heterochromatin structure (arrow) labeled by DRAQ5 in fluorescence microscopy was identified in the SBEM volume through CLEM. This heterochromatin structure was not used as a fiducial marker for image registration. Scale bar: 1 µm.
Figure 5—video 1
A volume showing 3D CLEM in the CCM-processed mouse brain.
tdTomato-expressing neurons were clearly identified in the SBEM volume. Scale bar: 10 µm.
Tables
Table 1
Comparison of the advantages and limitations of different sample preparation methods for electron microscopy.
The CryoChem Method (CCM) combines the advantages of chemical fixation and cryofixation. With CCM, samples are fixed with high-pressure freezing and freeze-substitution to achieve quality ultrastructural preservation. This approach allows preservation of tissues with cuticle or cell wall and captures biological events with high temporal resolution. A rehydration step is introduced to enable fluorescence imaging, DAB labeling by genetically encoded EM tags and high-contrast en bloc heavy metal staining of cryofixed samples. The high-contrast en bloc heavy metal staining permitted by CCM reduces the need for post-staining on sections, and makes CCM compatible with serial block-face scanning electron microscopy (SBEM). Common limitations of chemical fixation and cryofixation are denoted in red.
| Chemical fixation | Cryofixation | CryoChem | |
|---|---|---|---|
| Fixation | Aldehyde fixatives (4 °C) | (1) High-pressure freezing (−196 °C,~2100 bar) (2) Freeze-substitution in organic solvents | (1) High-pressure freezing (−196 °C,~2100 bar) (2) Freeze-substitution in organic solvents |
| Ultrastructural preservation | Excellent | Excellent | |
| Tissues with cuticle or cell wall | Compatible | Compatible | |
| Temporal resolution of events captured | High | High | |
| Hydration state of the sample | Hydrated | Hydrated after rehydration | |
| Fluorescence imaging after fixation | Compatible | Compatible | |
| DAB labeling by genetic EM tags | Compatible | Compatible due to rehydration | |
| High-contrast en bloc heavy metal staining | Compatible | Compatible due to rehydration | |
| Post-staining on sections | Optional | Optional | |
| SBEM compatibility | Compatible | Compatible |
Key resources table
| Reagent type (species) or resource | Designation | Source or reference | Identifiers | Additional information |
|---|---|---|---|---|
| genetic reagent (Drosophila melanogaster) | Or47b-GAL4 | (Fishilevich and Vosshall, 2005) | RRID:BDSC_9984 | |
| genetic reagent (D. melanogaster) | Or22a-GAL4 | (Dobritsa et al., 2003) | RRID:BDSC_9951 | |
| genetic reagent (D. melanogaster) | 10XUAS-myc-APEX2-Orco | this study | see Materials and methods | |
| genetic reagent (D. melanogaster) | 10XUAS-mCD8GFP-APEX2 | this study | see Materials and methods | |
| genetic reagent (Mus musculus) | B6.Cg-Crhtm1(cre)Zjh/J | Jackson Laboratory | 031559 RRID:IMSR_JAX:031559 | |
| genetic reagent (M. musculus) | B6.Cg-Gt.ROSA.26 Sortm14(CAG-tdTomato)Hze/J | Jackson Laboratory | 007914 RRID:IMSR_JAX:007914 | |
| genetic reagent (M. musculus) | TH-GFP | (Kessler et al., 2003) | ||
| cell line | HEK 293T | ATCC | CRL-3216 RRID:CVCL_0063 | |
| antibody | DRAQ5 | Cell Signaling Technology | 4084 | 1:1000 |
| recombinant DNA reagent (plasmids) | pcDNA3-Mito-V5-APEX2 | (Lam et al., 2015) | Addgene_72480 | |
| recombinant DNA reagent (plasmids) | APEX2 DNA | (Lam et al., 2015) | Addgene_49386 | |
| recombinant DNA reagent (plasmids) | APEX2-Orco | this study | see Materials and methods | |
| recombinant DNA reagent (plasmids) | mCD8GFP-APEX2 | this study | see Materials and methods | |
| chemical compound, drug | paraformaldehyde | Fisher Scientific | 04042–500 | |
| chemical compound, drug | glutaraldehyde | Ted Pella | 18426 | |
| chemical compound, drug | sodium cacodylate | Ted Pella | 18851 | |
| chemical compound, drug | CaCl2 | Sigma-Aldrich | 223506 | |
| chemical compound, drug | glycine | Bio-Rad Laboratories | 161–0718 | |
| chemical compound, drug | BSA | Sigma-Aldrich | 9048-46-8 | |
| chemical compound, drug | 1-hexadecene | Sigma-Aldrich | H2131 | |
| chemical compound, drug | uranyl acetate | Electron Microscopy Sciences | 22400 | |
| chemical compound, drug | methanol | Fisher Scientific | A412-4 | |
| chemical compound, drug | acetone | ACROS Organics | AC326800010 | |
| chemical compound, drug | HEPES | Gibco | 15-630-080 | |
| chemical compound, drug | diaminobenzidine; DAB | Sigma-Aldrich | D5637 | |
| chemical compound, drug | H2O2 | Fisher Scientific | H325-100 | |
| chemical compound, drug | osmium tetroxide; OsO4 | Electron Microscopy Sciences | 19190 | |
| chemical compound, drug | potassium ferrocyanide | Mallinckrodt | 6932 | |
| chemical compound, drug | thiocarbohydrazide | Electron Microscopy Sciences | 21900 | |
| chemical compound, drug | Durcupan ACM resin component A | Sigma-Aldrich | 44611 | |
| chemical compound, drug | Durcupan ACM resin component B | Sigma-Aldrich | 44612 | |
| chemical compound, drug | Durcupan ACM resin component C | Sigma-Aldrich | 44613 | |
| chemical compound, drug | Durcupan ACM resin component D | Sigma-Aldrich | 44614 | |
| chemical compound, drug | conductive silver epoxy | Ted Pella | 16043 | |
| software, algorithm | IMOD | (Kremer et al., 1996) | RRID:SCR_003297 | http://bio3d.colorado.edu/imod/ |
| software, algorithm | ImageJ | NIH | RRID:SCR_003070 | https://imagej.nih.gov/ij/ |
| software, algorithm | Amira 6.3 | ThermoFisher | RRID:SCR_014305 | |
| other | Aclar | Electron Microscopy Sciences | 50426 | |
| other | FocusClear | Cedarlane Labs | FC-101 |
Additional files
-
Transparent reporting form
- https://doi.org/10.7554/eLife.35524.015
Download links
A two-part list of links to download the article, or parts of the article, in various formats.
Downloads (link to download the article as PDF)
Open citations (links to open the citations from this article in various online reference manager services)
Cite this article (links to download the citations from this article in formats compatible with various reference manager tools)
High-quality ultrastructural preservation using cryofixation for 3D electron microscopy of genetically labeled tissues
eLife 7:e35524.
https://doi.org/10.7554/eLife.35524


