Loss of Fam60a, a Sin3a subunit, results in embryonic lethality and is associated with aberrant methylation at a subset of gene promoters
- Osaka University, Japan
- RIKEN Center for Developmental Biology, Japan
- RIKEN Center for Life Science Technologies, Japan
- RIKEN Center for Biosystems Dynamics Research, Japan
Figures
Figure 1 with 3 supplements
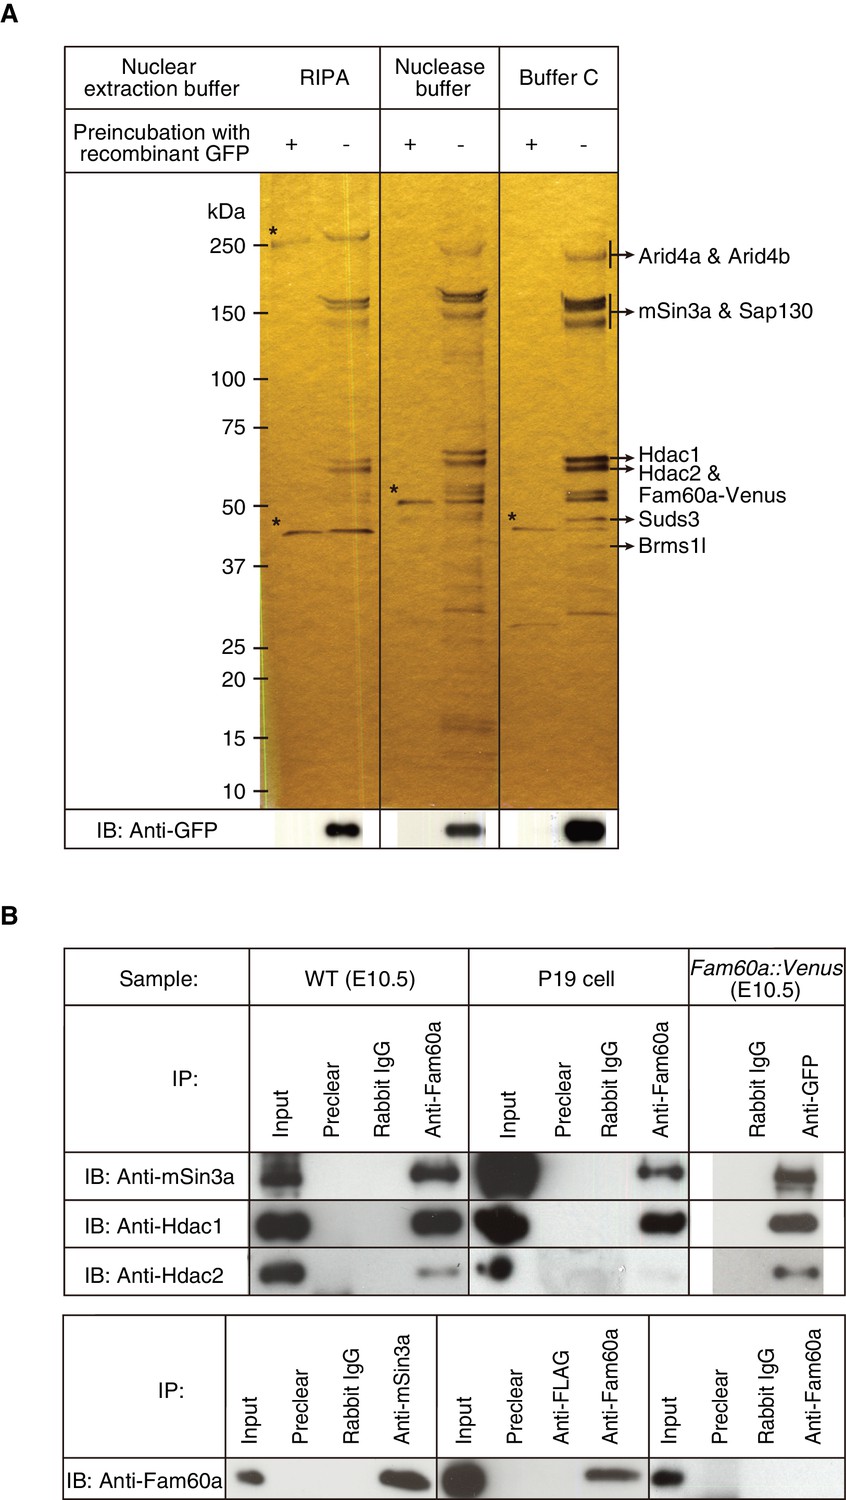
Identification of Fam60a-interacting proteins in mouse embryos.
(A) Nuclear lysates prepared under three different conditions from E10.5 embryos harboring the Fam60a::Venus transgene were subjected to immunoprecipitation with bead-coupled antibodies to GFP that either had (control) or had not been previously exposed to recombinant GFP. Proteins that bound to the beads were then fractionated by SDS-polyacrylamide gel electrophoresis and revealed by silver staining. Proteins that bound nonspecifically to the beads are indicated by asterisks, and the identity of those that bound specifically was determined by mass spectrometry. The bead-bound proteins were also subjected to immunoblot (IB) analysis with antibodies to GFP for detection of Fam60a-Venus. (B) Nuclear extracts of E10.5 WT embryos, undifferentiated P19 cells, or E10.5 embryos harboring the Fam60a::Venus transgene were subjected to immunoprecipitation (IP) with bead-coupled anti-Fam60a, anti-GFP, or control rabbit immunoglobulin G (IgG), as indicated, and the resulting precipitates were subjected to immunoblot analysis with antibodies to Sin3a, to Hdac1, and to Hdac2 (upper panel). The nuclear extracts (Input) as well as the material that bound nonspecifically to beads before exposure to the antibodies used for immunoprecipitation (Preclear) were also subjected to immunoblot analysis. Alternatively, nuclear extracts of E10.5 WT embryos were subjected to immunoprecipitation with antibodies to Sin3a, to Hdac1, to Hdac2, or to the FLAG epitope (control), and the resulting precipitates were subjected to immunoblot analysis with antibodies to Fam60a (lower panel). See also Figure 3—figure supplement 1 to 3.
Figure 1—figure supplement 1
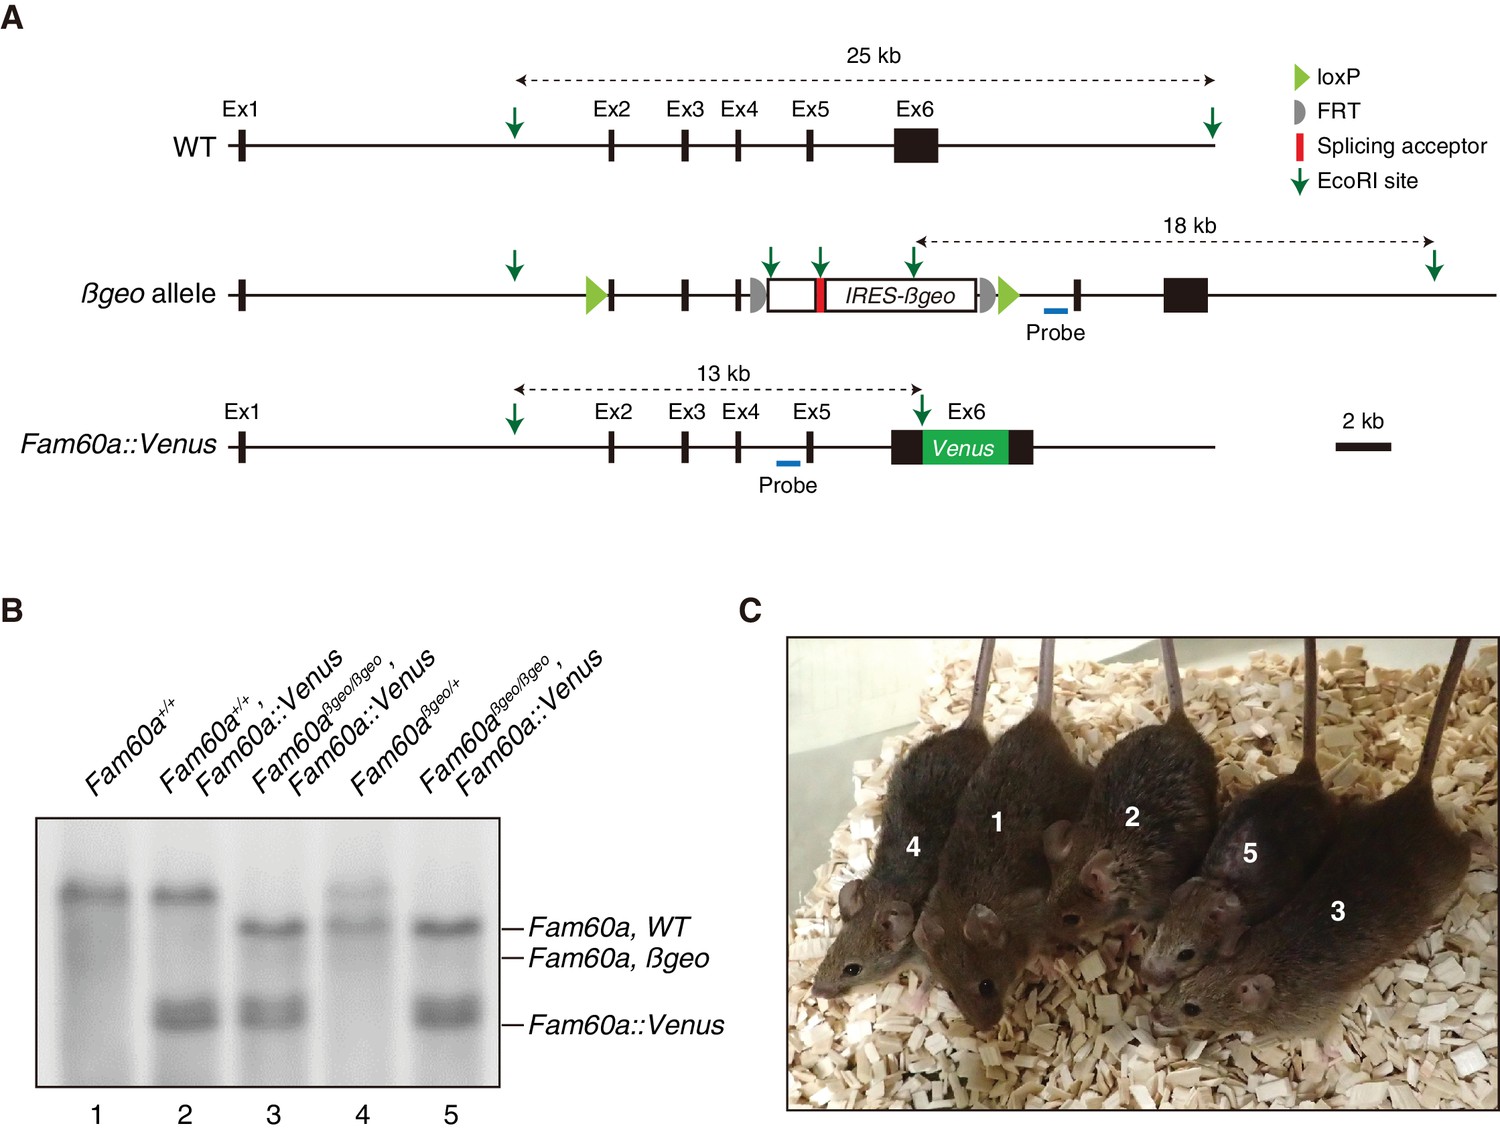
The Fam60a::Venus transgene encodes a functional Fam60a protein.
(A) Representation of the Fam60a::Venus BAC transgene. The position of a probe for Southern hybridization is indicated. (B) Genotyping of adult mice for WT and βgeo alleles of Fam60a as well as for the Fam60a::Venus transgene by Southern blot analysis of EcoRI-digested tail genomic DNA with the probe indicated in (A). (C) Adult mice genotyped in (B). Mice 3 and 5, which had a genotype of Fam60aβgeo/βgeo and harbored the Fam60a::Venus BAC transgene, did not show developmental defects.
Figure 1—figure supplement 2
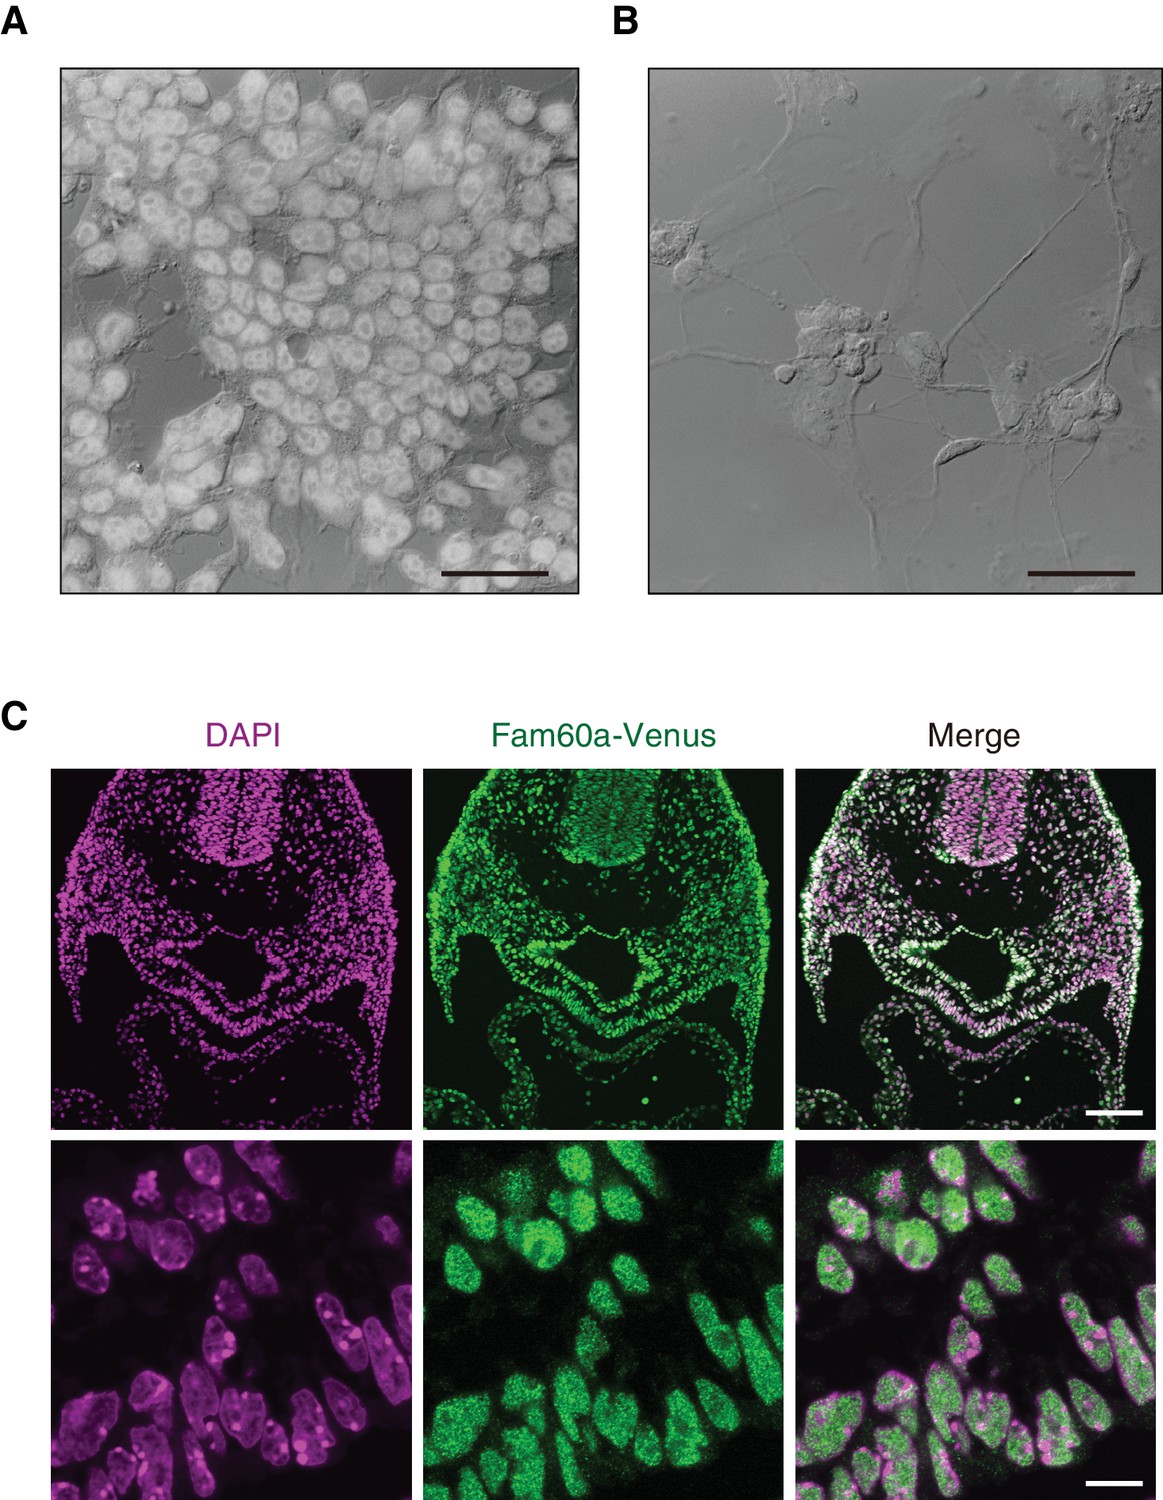
Immunofluorescence localization of Fam60a and Fam60a-Venus in P19 cells and mouse embryos.
(A and B) Immunofluorescence staining of Fam60a in undifferentiated P19 cells (A) as well as in P19 cells induced to differentiate by exposure to retinoic acid (1.0 µM) for 8 days (B). The fluorescence images are superimposed on Nomarski optics images. Scale bar, 50 μm. (C) Immunofluorescence staining of Fam60a-Venus with antibodies to GFP in E9.5 embryos harboring the Fam60a::Venus transgene. Nuclei were also stained with 4',6-diamidino-2-phenylindole (DAPI). Transverse cryosections at the level of the SHF are shown in the upper panels, with the lower panels presenting the SHF at higher magnification. The Fam60a-Venus protein was localized in nuclei but not in nucleoli. Scale bars, 100 µm (upper panels) and 10 µm (lower panels).
Figure 1—figure supplement 3
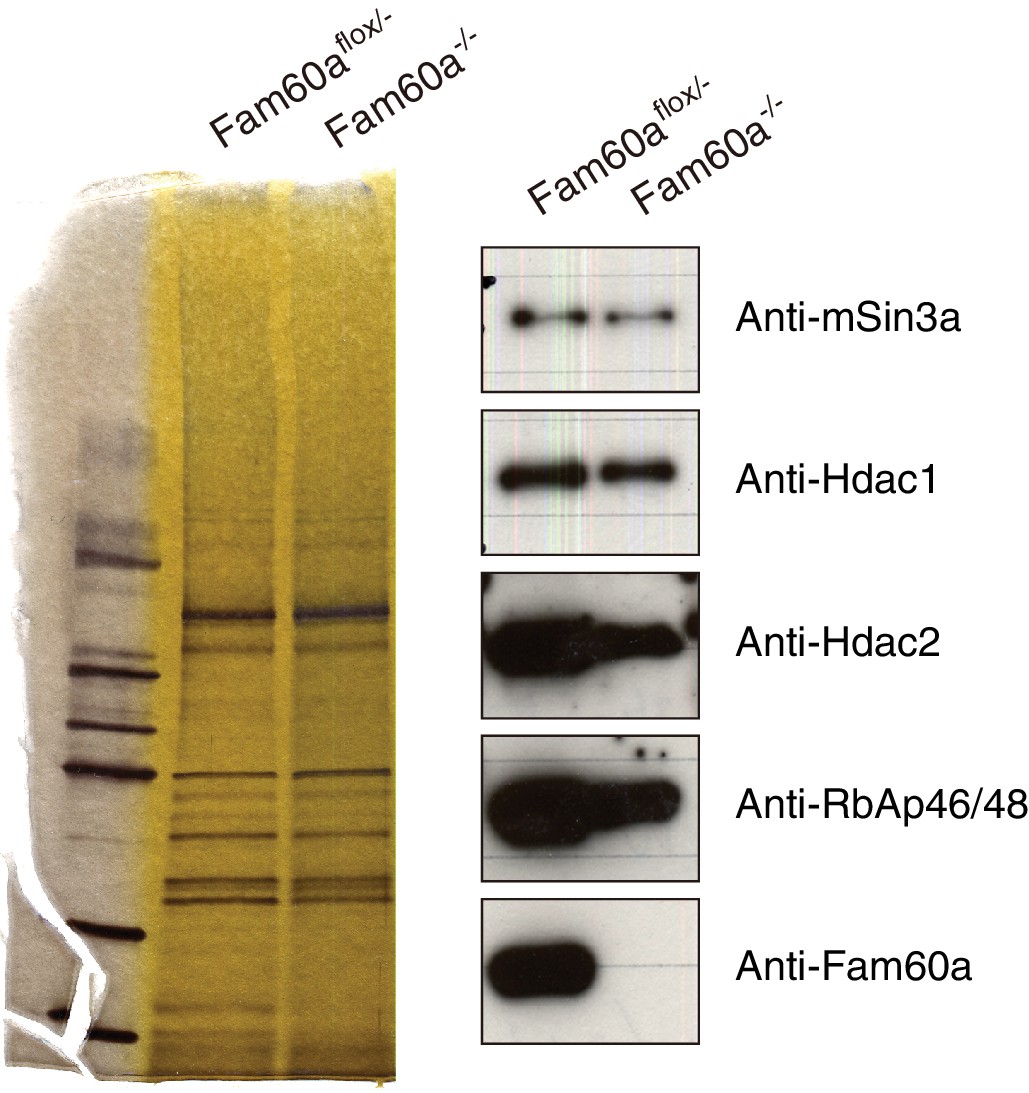
Formation of the Sin3a-Hdac complex in the absence of Fam60a.
Nuclear extracts prepared from Fam60aflox/– and Fam60a–/– ES cells were subjected to immunoprecipitation with antibodies to Sin3a, and the resulting precipitates were fractionated by SDS-polyacrylamide gel electrophoresis and stained with silver (left panel). The gel was also subjected to immunoblot analysis with antibodies to the indicated proteins (right panel).
Figure 2 with 1 supplement
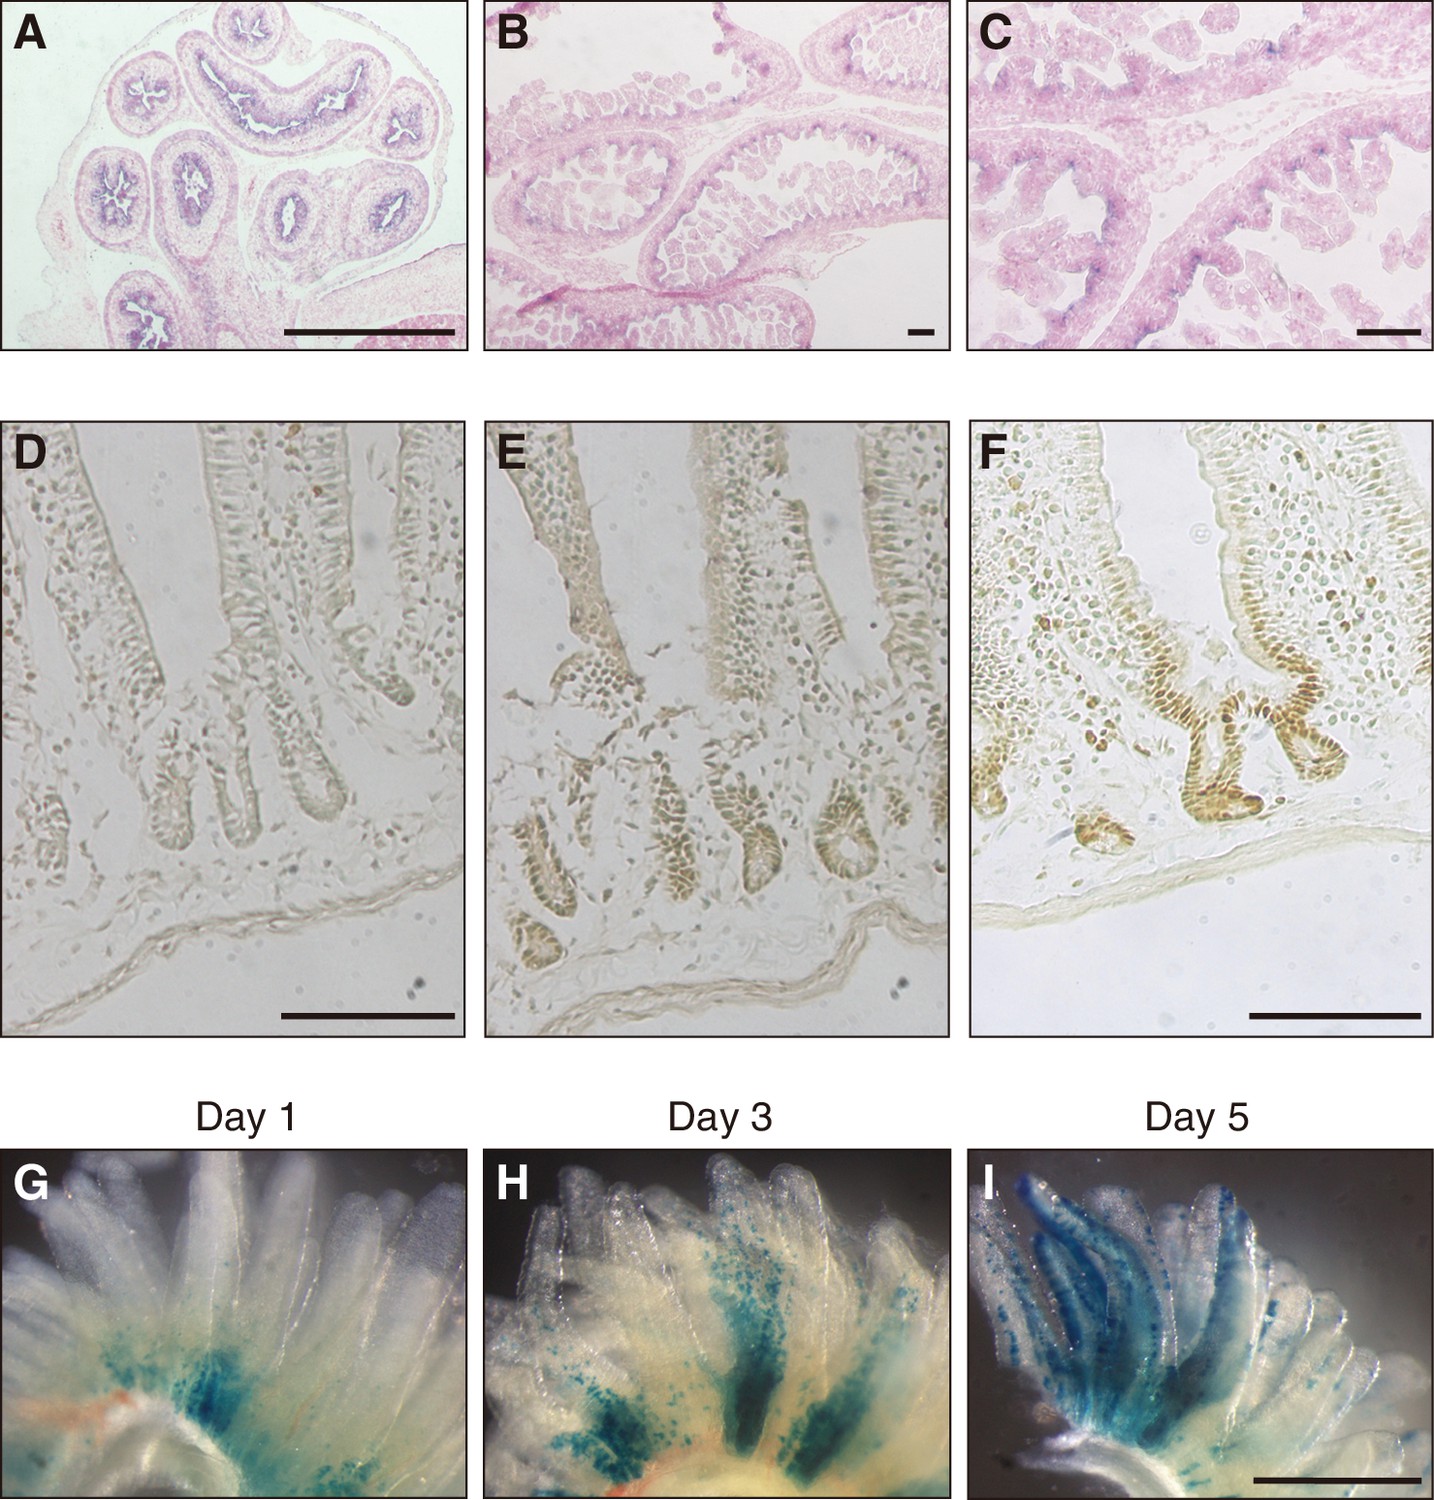
Expression of Fam60a in embryonic and adult mouse intestine.
(A–C) In situ hybridization analysis of Fam60a expression in sections of mouse embryonic intestine at E15.5 (A) and E17.5 (B and C). Fam60a is expressed in epithelial cells of the gastrointestinal tract at E15.5 and in intervilli of the intestine at E17.5. A higher magnification view of the image in (B) is shown in (C). Scale bars, 100 µm. (D–F) Immunohistochemical analysis of Fam60a expression in the adult duodenum. Staining for a wild-type mouse was performed without primary antibodies as a control (D) or with antibodies to Fam60a (E), and that for a mouse harboring a Fam60a::Venus transgene was performed with antibodies to GFP (F). Scale bars, 100 µm. (G–I) Lineage trace analysis of LacZ+ cells (stained with the LacZ substrate X-gal) in intestinal villi of the duodenum at 1, 3, or 5 days, respectively, after injection of tamoxifen (6 mg) in adult mice harboring a Fam60a-CreERT2 transgene and lacZ reporter gene. Scale bar, 500 µm. See also Figure 1—figure supplement 1.
Figure 2—figure supplement 1
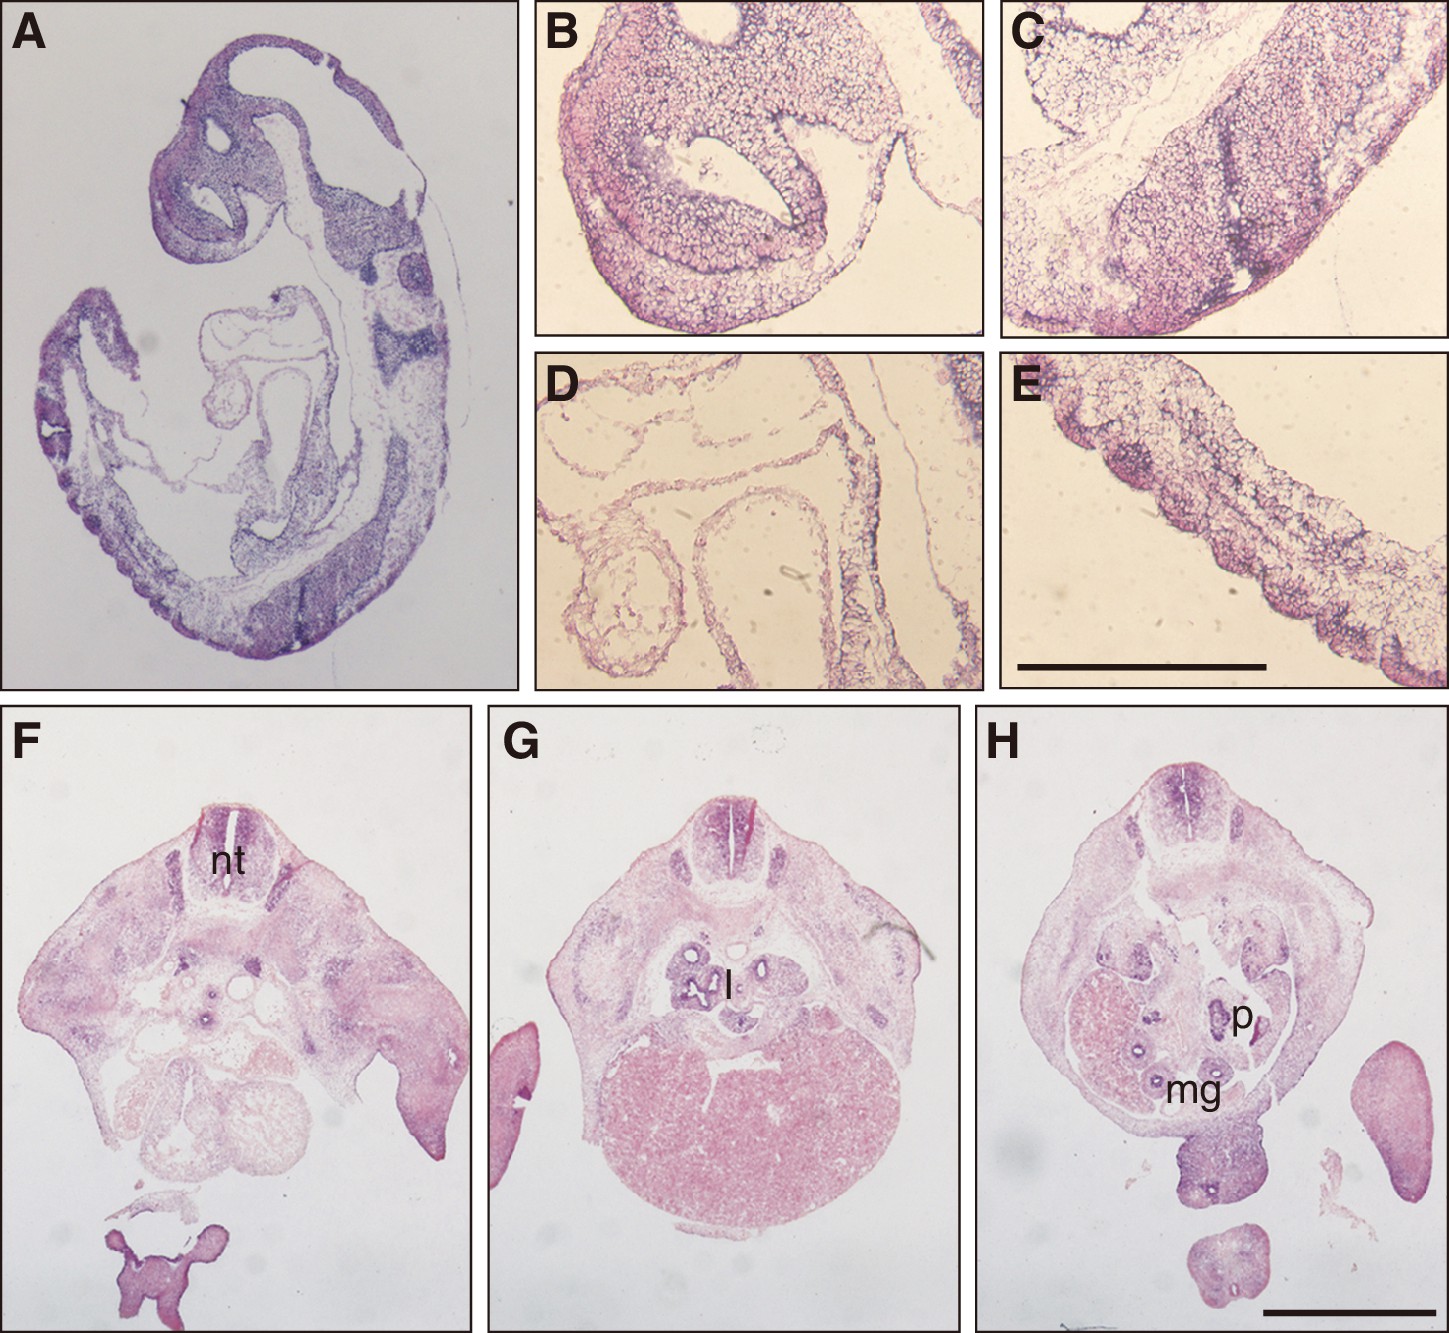
Expression of Fam60a in postimplantation mouse embryos.
(A) Sectional in situ hybridization analysis of Fam60a expression in an E9.5 embryo. (B–E) Higher magnification views of the telencephalon (B), neural tube (C), heart tube (D), and somites (E) of the embryo in (A). Scale bar, 200 µm. (F–H) In situ hybridization analysis of Fam60a expression in sections of a mouse embryo at E12.5. Fam60a is highly expressed in the neural tube (nt), lung (l), pancreas (p), and epithelial cells of the midgut (mg). Scale bar, 1 mm.
Figure 3 with 4 supplements
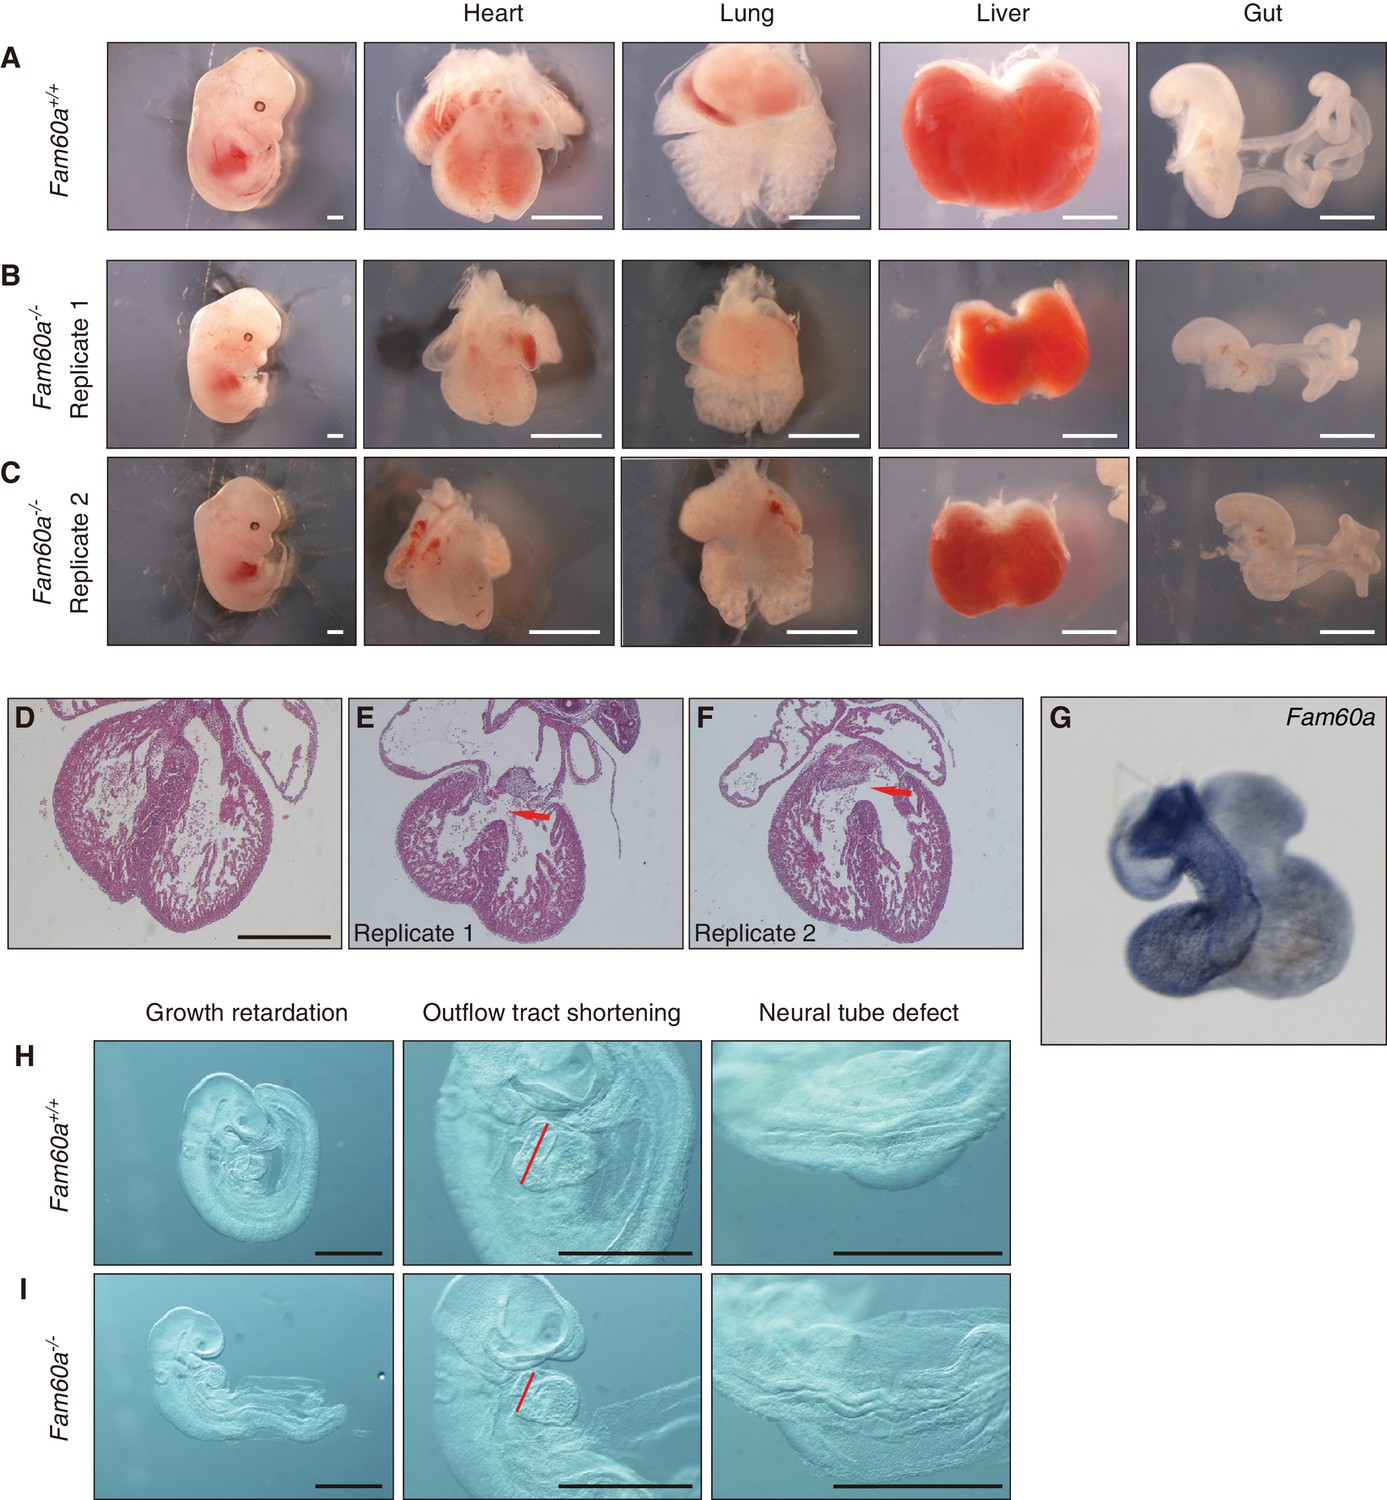
Growth retardation of visceral organs in Fam60a–/– mice.
(A–C) Whole embryos and the indicated organs of WT (Fam60a+/+, (A) and Fam60a–/– (B and C) mice at E13.5. Scale bars, 1 mm. (D–F) Sections of the heart of WT (D) or Fam60a–/– (E and F) embryos at E13.5 stained with hematoxylin-eosin. The mutant embryos manifest ventricular septum defects (red arrows). Scale bar, 500 µm. (G) Expression of Fam60a in E13.5 heart was examined by whole-mount in situ hybridization. (H and I) Fam60a–/– and WT embryos, respectively, at E9.5. The mutant embryos show overall growth retardation as well as shortening of the outflow tract (red bars) and a severe neural tube defect. Scale bars, 1 mm. See also Figure 3—figure supplement 1 to 4 and Supplementary file 1.
-
Figure 3—source data 1
Numerical data of Figure 3—figure supplement 1C.
- https://doi.org/10.7554/eLife.36435.014
-
Figure 3—source data 2
Numerical data of Figure 3—figure supplement 4I.
- https://doi.org/10.7554/eLife.36435.015
Figure 3—figure supplement 1
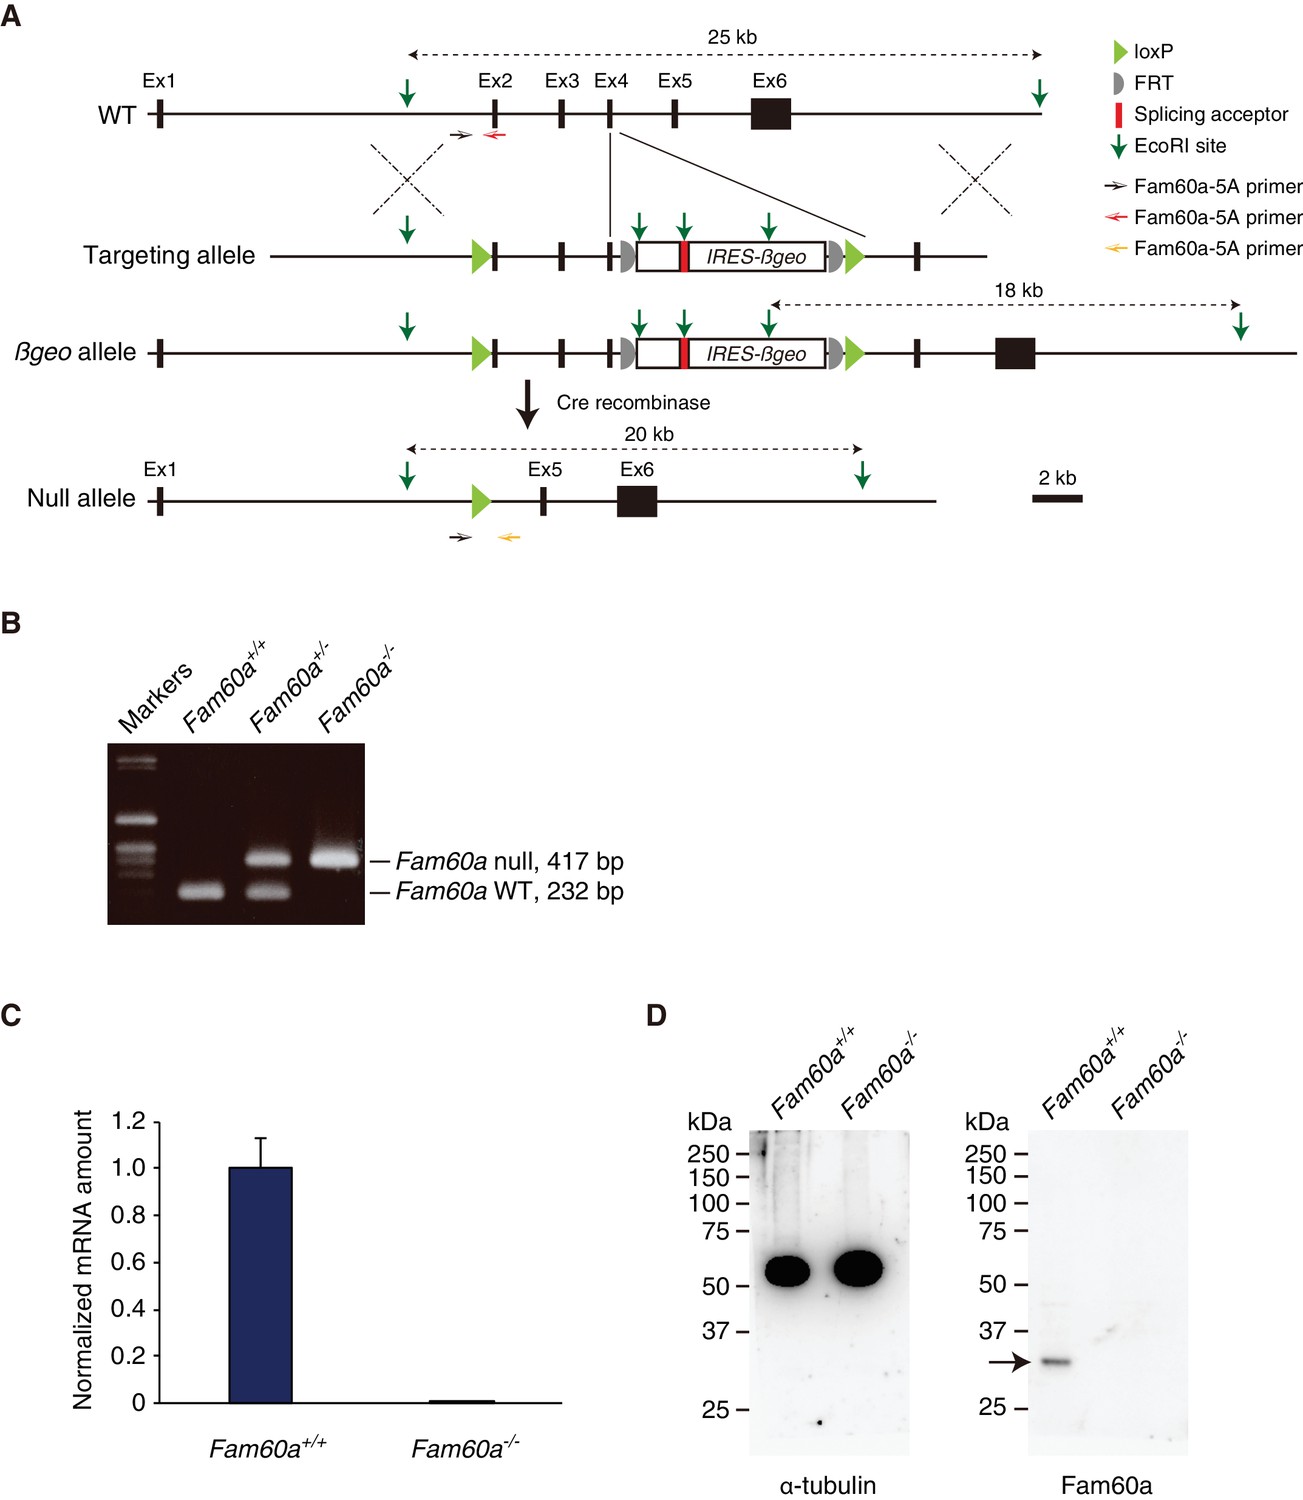
Generation of Fam60a mutant mice.
(A) Strategy for generation of Fam60a mutant alleles. Numbered boxes denote Fam60a exons. The positions of three PCR primers used for genotyping of Fam60a alleles (Fam60a-5A, Fam60a-3A, Fam60a-3C) are indicated. (B) PCR-based genotyping of Fam60a alleles in embryos of the indicated Fam60a genotypes. Null (–) and WT (+) alleles yield products of 417 and 232 bp, respectively. (C) RT-qPCR analysis of Fam60a mRNA in WT (+/+) and Fam60a–/– (–/–) embryos. Data are means ± s.d. for four embryos of each genotype. (D) Immunoblot analysis of Fam60a (arrow) and α-tubulin (loading control) in WT and Fam60a–/– embryos.
Figure 3—figure supplement 2
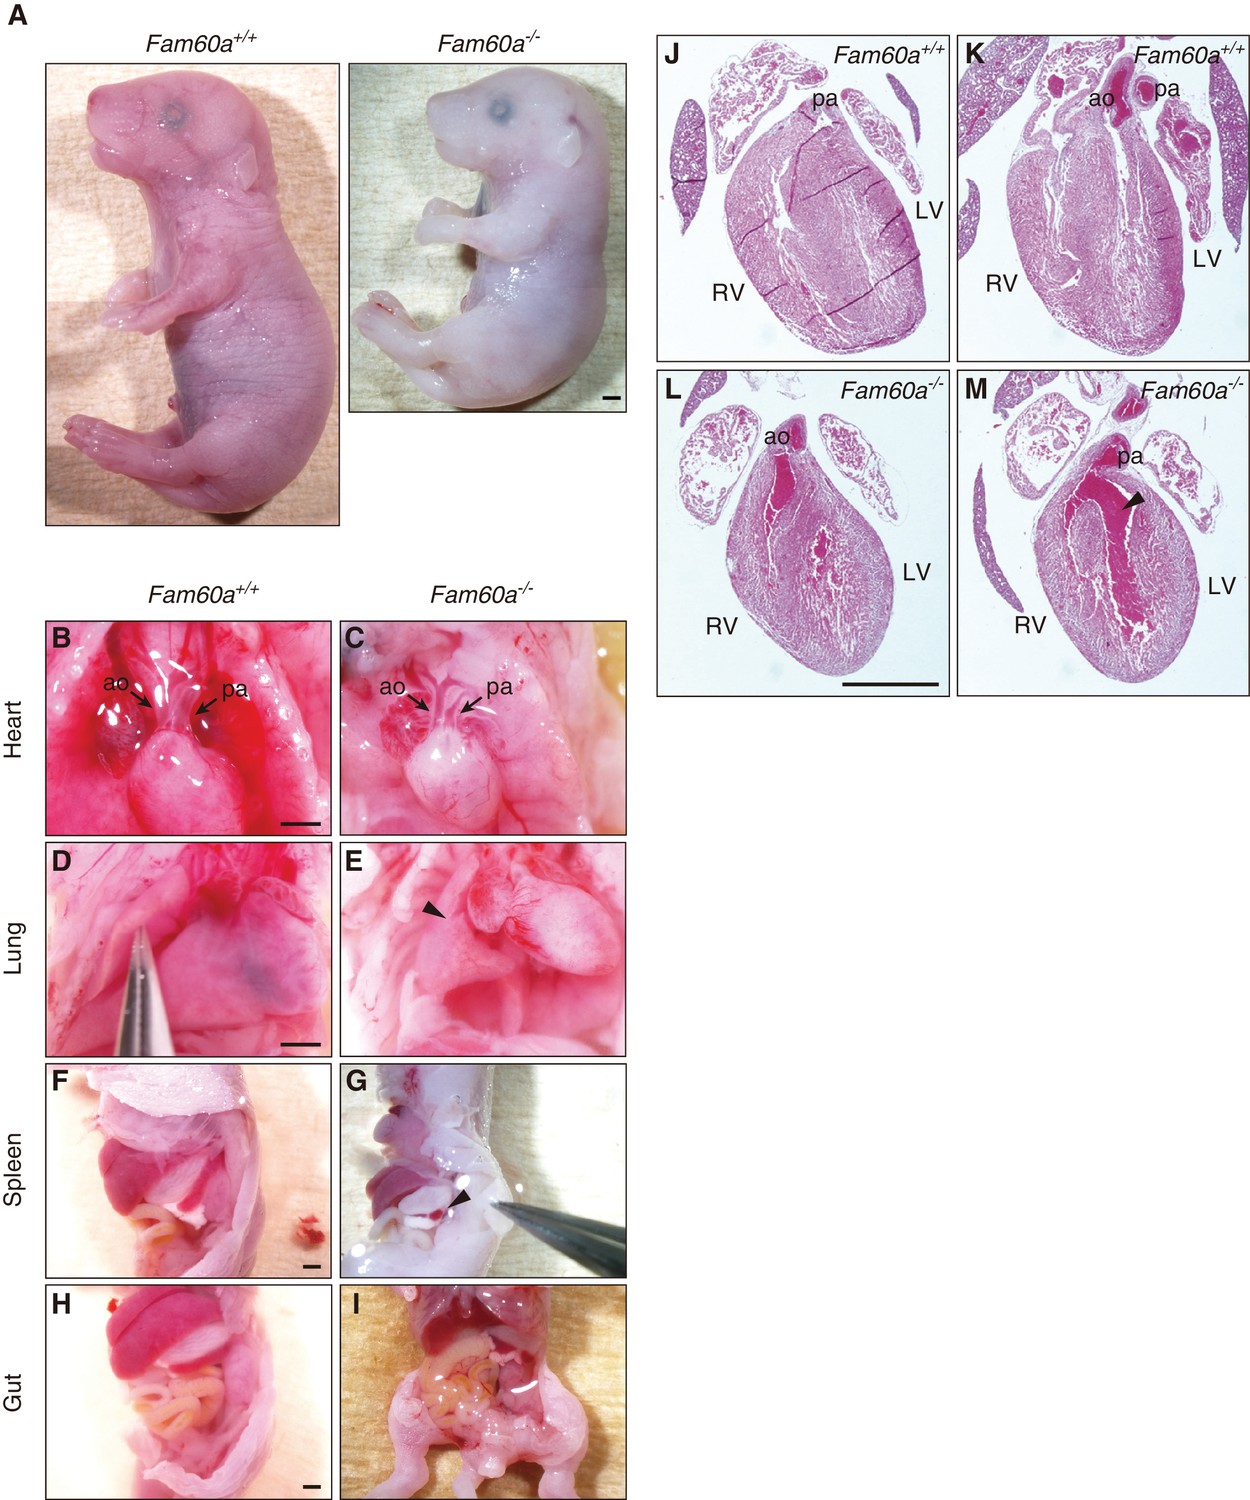
Impaired organogenesis in Fam60a-/- embryos at E18.5.
(A) WT (Fam60a+/+) and Fam60a–/– embryos at E18.5. The mutant embryo is smaller than the WT one. Scale bar, 1 mm. (B–I) Morphology of visceral organs in WT (B, D, F, H) and Fam60a–/– (C, E, G, I) embryos at E18.5. Frontal views of the heart show that the aorta (ao) and pulmonary artery (pa) are positioned in parallel in the mutant embryo (B and C). Right side views of the lungs show that lung lobulation is incomplete in the mutant (arrowhead) (D and E). Left side views of the spleen show severe aplasia in the mutant embryo (arrowhead) (F and G). Left side (H) and frontal (I) views of the gut show that duodenal-colon crossing is abnormal in the mutant. Scale bars, 1 mm. (J–M) Hematoxylin-eosin–stained sections of the heart of WT (J and K) and Fam60a–/– (L and M) embryos at E18.5. In WT embryos, the aorta (ao) connects to the left ventricle (LV) whereas the pulmonary artery (pa) connects to the right ventricle (RV). In the mutant, however, the aorta and pulmonary artery connect to the right ventricle, giving rise to double-outlet right ventricle. In addition, a ventricular septum defect (arrowhead) is apparent in the mutant heart. Scale bar, 1 mm.
Figure 3—figure supplement 3

Gut looping defect in Fam60a–/– mice.
Macroscopic views of the gut of WT and Fam60aβgeo/βgeo embryos at E18.5 are shown on the left, with arrowheads indicating the ascending and descending colon. Corresponding diagrams of the gut are shown on the right. The ascending colon (blue in the diagrams) is located on the ventral side of the intestine (green in the diagrams) in the WT embryo, whereas it is located on the dorsal side in the mutant embryos. Scale bar, 1 mm.
Figure 3—figure supplement 4

BrdU immunohistochemistry for determination of the proliferation index in Fam60a–/– and WT embryos.
(A–H) The secondary heart field (SHF) (A and B), proepicardium (PE) (C and D), ventricle (V) (E and F), and septum transversum (ST) (G and H) of WT (A, C, E, G) and Fam60a–/– (B, D, F, H) embryos labeled with BrdU in utero at E9.0 to E9.5 were sectioned and stained with antibodies to BrdU. Images in (A) through (D), (G), and (H) are shown at higher magnification in (A') through (D'), (G'), and (H'), respectively. Scale bars, 100 µm. (I) Proliferation index determined by BrdU labeling for the indicated tissues of WT (open bars) or Fam60a–/– (closed bars) embryos at E9.0 to E9.5 as in (A) through (H). NT, neural tube. Data are means ± s.d. for five embryos. *p<0.05, **p<0.01 (Student’s unpaired t test).
Figure 4 with 2 supplements
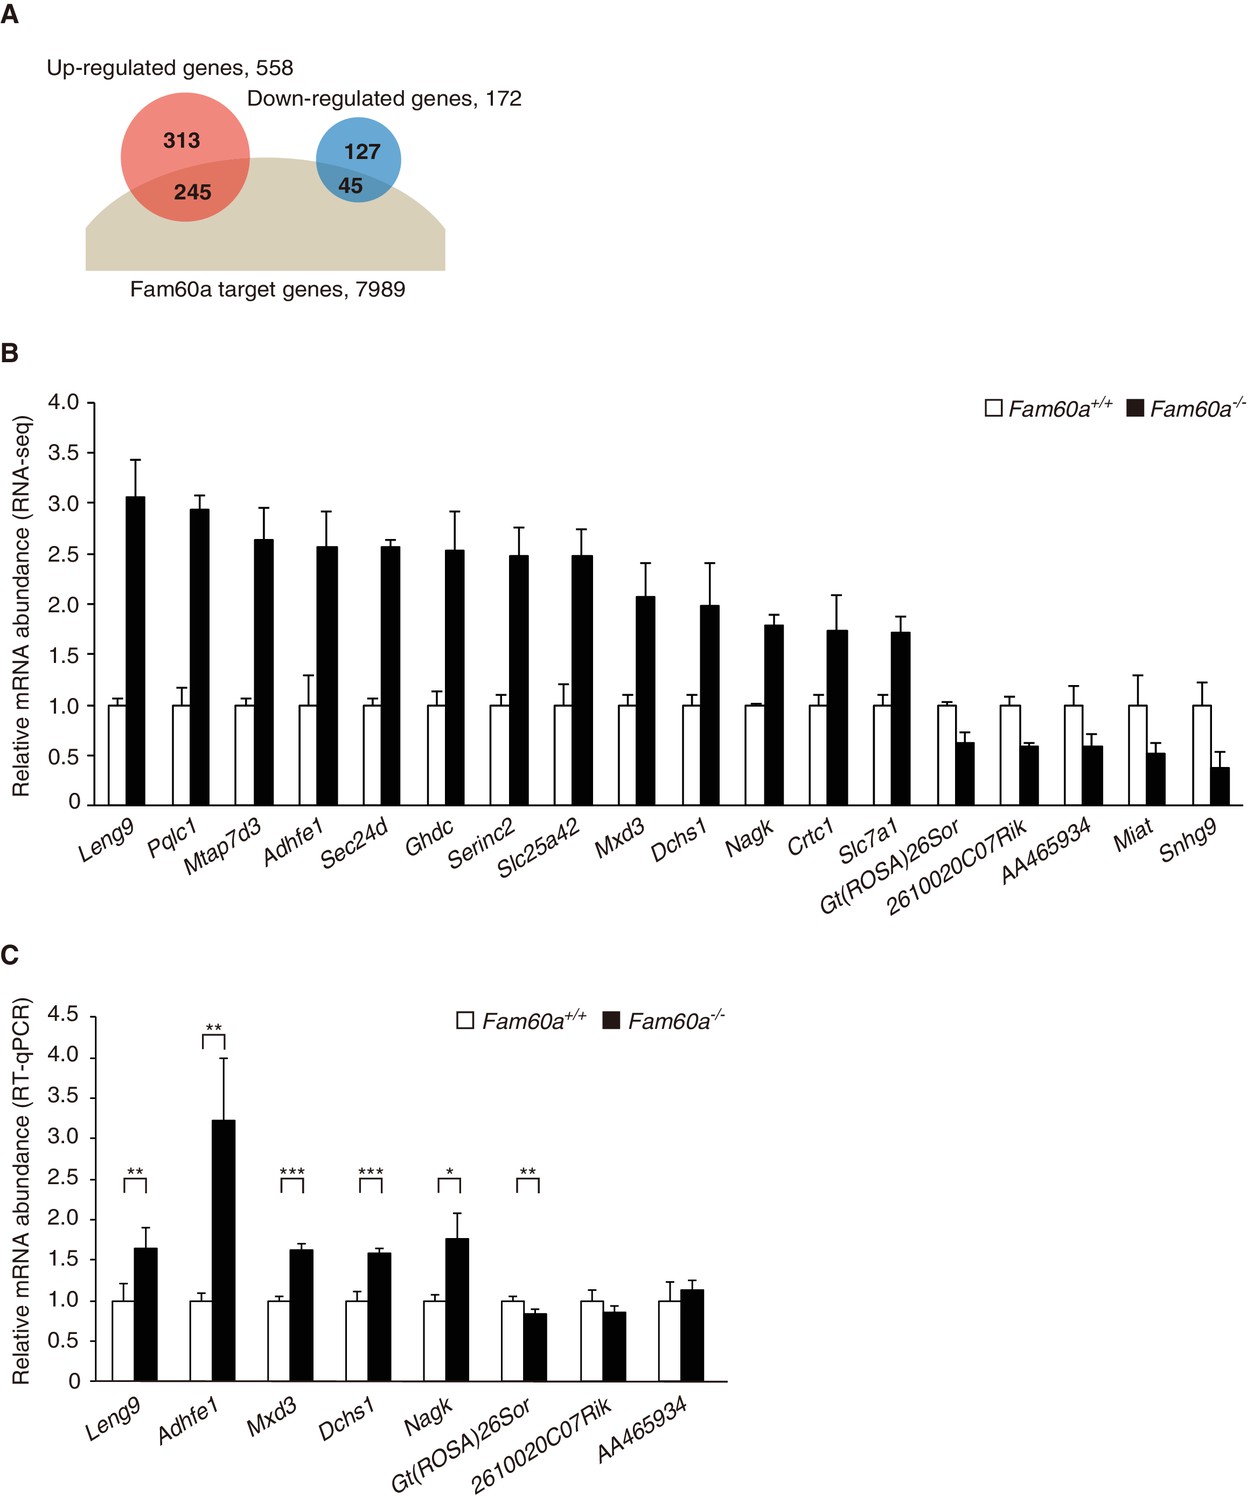
Altered gene expression profile in Fam60a–/– embryos.
(A) Venn diagram showing the overlap between Fam60a target genes identified by ChIP-seq analysis and genes whose expression was up- or down-regulated in Fam60a–/– embryos at E9.5 as revealed by RNA-seq analysis. (B) Fold change in RNA-seq values for genes that were differentially expressed in E9.5 Fam60a–/– relative to WT embryos and which were also found to bind Fam60a-Venus in the TSS region by the ChIP-seq analysis. Data are means ± s.d. for three embryos. (C) Validation of RNA-seq data by RT-qPCR analysis for E9.5 WT and Fam60a–/– embryos. Data are means ± s.d. for five independent experiments. *p<0.05, **p<0.01, ***p<0.001 (Student’s unpaired t test). See also Figure 4—figure supplements 1 and 2.
-
Figure 4—source data 1
List of target genes of Fam60a.
- https://doi.org/10.7554/eLife.36435.019
-
Figure 4—source data 2
Numerical data of Figure 4B.
- https://doi.org/10.7554/eLife.36435.020
-
Figure 4—source data 3
Numerical data of Figure 4C.
- https://doi.org/10.7554/eLife.36435.021
-
Figure 4—source data 4
Numerical data of Figure 4—figure supplement 2B.
- https://doi.org/10.7554/eLife.36435.022
-
Figure 4—source data 5
Numerical data of Figure 4—figure supplement 2C.
- https://doi.org/10.7554/eLife.36435.023
-
Figure 4—source data 6
Numerical data of Figure 4—figure supplement 2D.
- https://doi.org/10.7554/eLife.36435.024
Figure 4—figure supplement 1
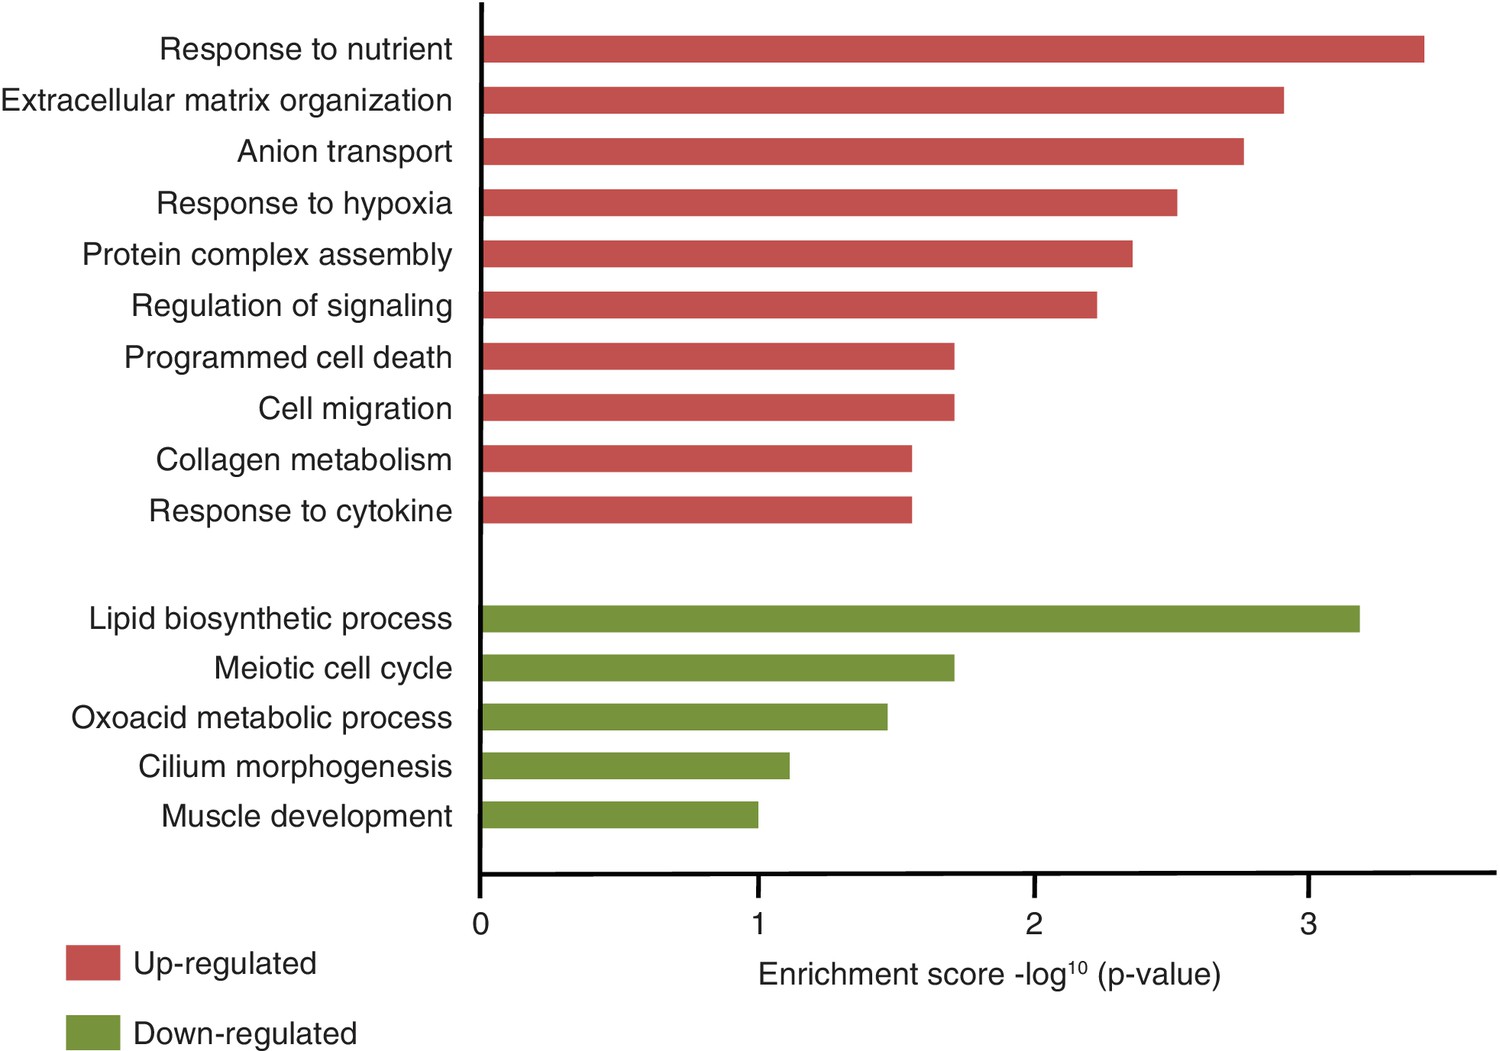
Gene ontology analysis of differentially expressed genes in Fam60a–/– embryos at E9.5.
Kyoto Encyclopedia of Genes and Genomes (KEGG) pathways with the top 10 and top five enrichment scores (–log10(ρ-value)) are shown for up-regulated genes (red bars) and down-regulated genes (green bars), respectively. The length of each bar represents the significance of the enrichment.
Figure 4—figure supplement 2
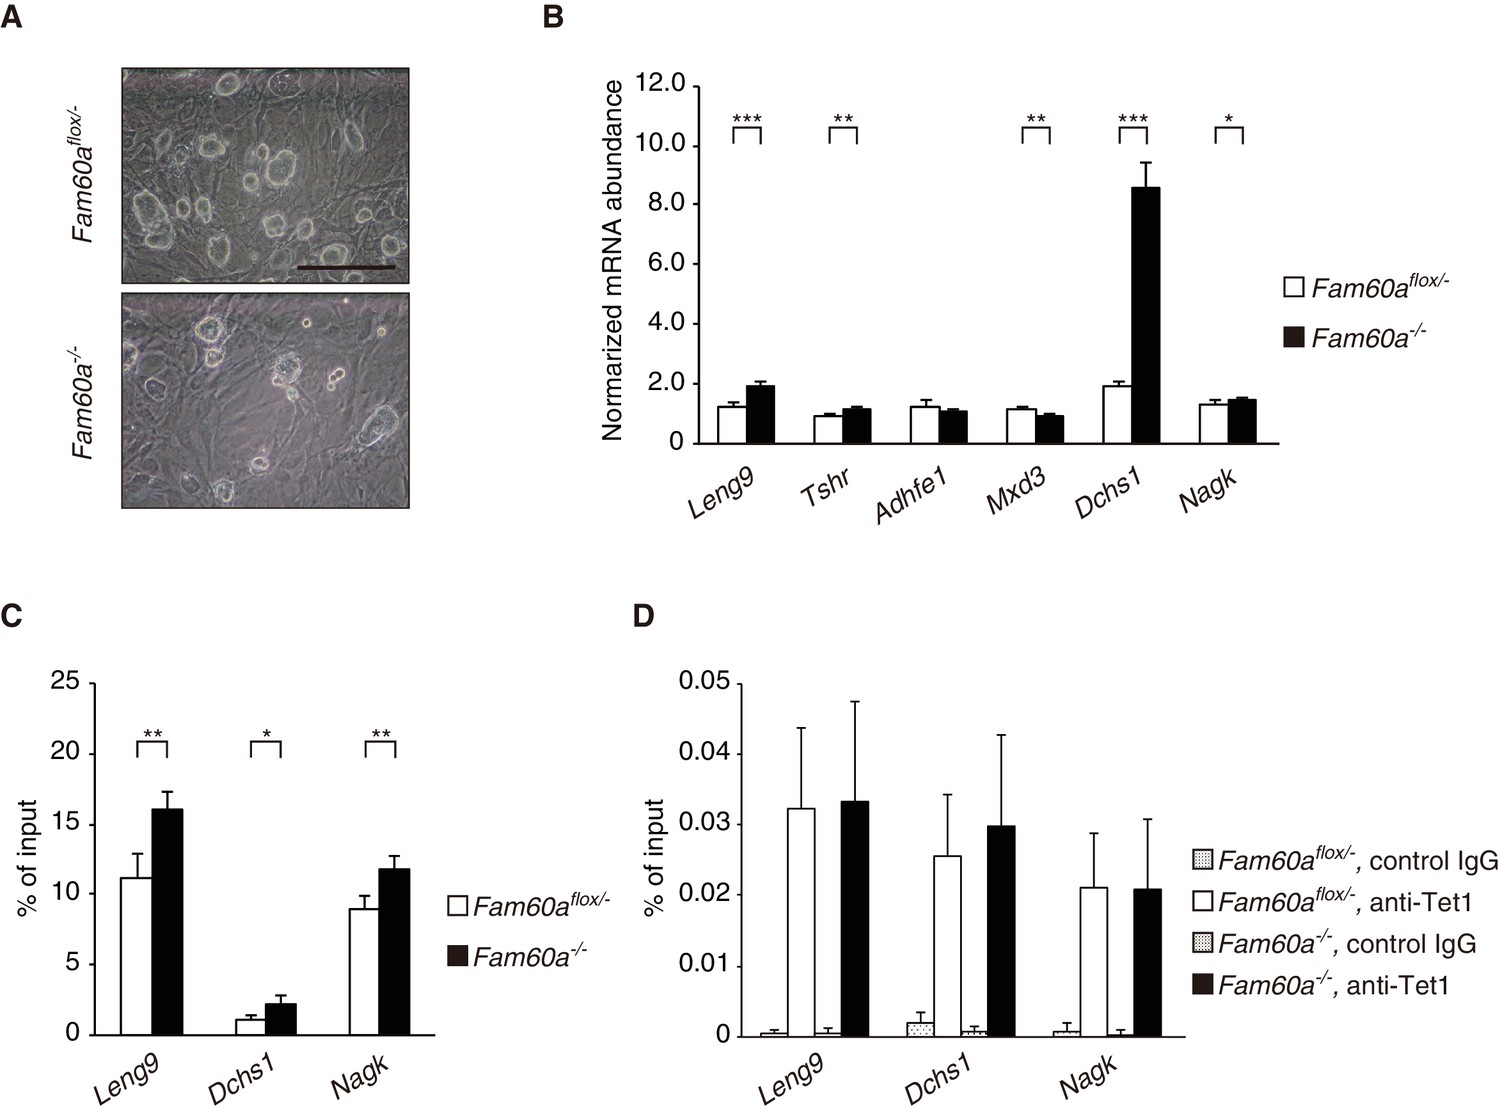
Expression profile as well as AcH3K9 deposition and Tet1 recruitment at promoter regions of Fam60a target genes in mouse ES cells.
(A) Phase-contrast microscopy showing the morphology of Fam60aflox/– and Fam60a–/– ES cells. Scale bar, 100 µm. (B) RT-qPCR analysis of mRNAs for the indicated Fam60a target genes in Fam60aflox/– and Fam60a–/– ES cells. Data are means ± s.d. for five independent experiments. *p<0.05, **p<0.01, ***p<0.001 (Student’s unpaired t test). (C) ChIP-qPCR analysis of AcH3K9 at the promoter region of the indicated Fam60a target genes in Fam60aflox/– and Fam60a–/– ES cells. Data are expressed as percentage of input and are means ± s.d. for four independent experiments. *p<0.05, **p<0.01 (Student’s unpaired t test). (D) ChIP-qPCR analysis of Tet1 recruitment to the promoter region of the indicated Fam60a target genes in Fam60aflox/– and Fam60a–/– ES cells. Immunoprecipitation was performed with antibodies to Tet1 or with control IgG. Data are means ± s.d. for three independent experiments.
Figure 5 with 2 supplements
Genome-wide localization of Fam60a to gene promoters.
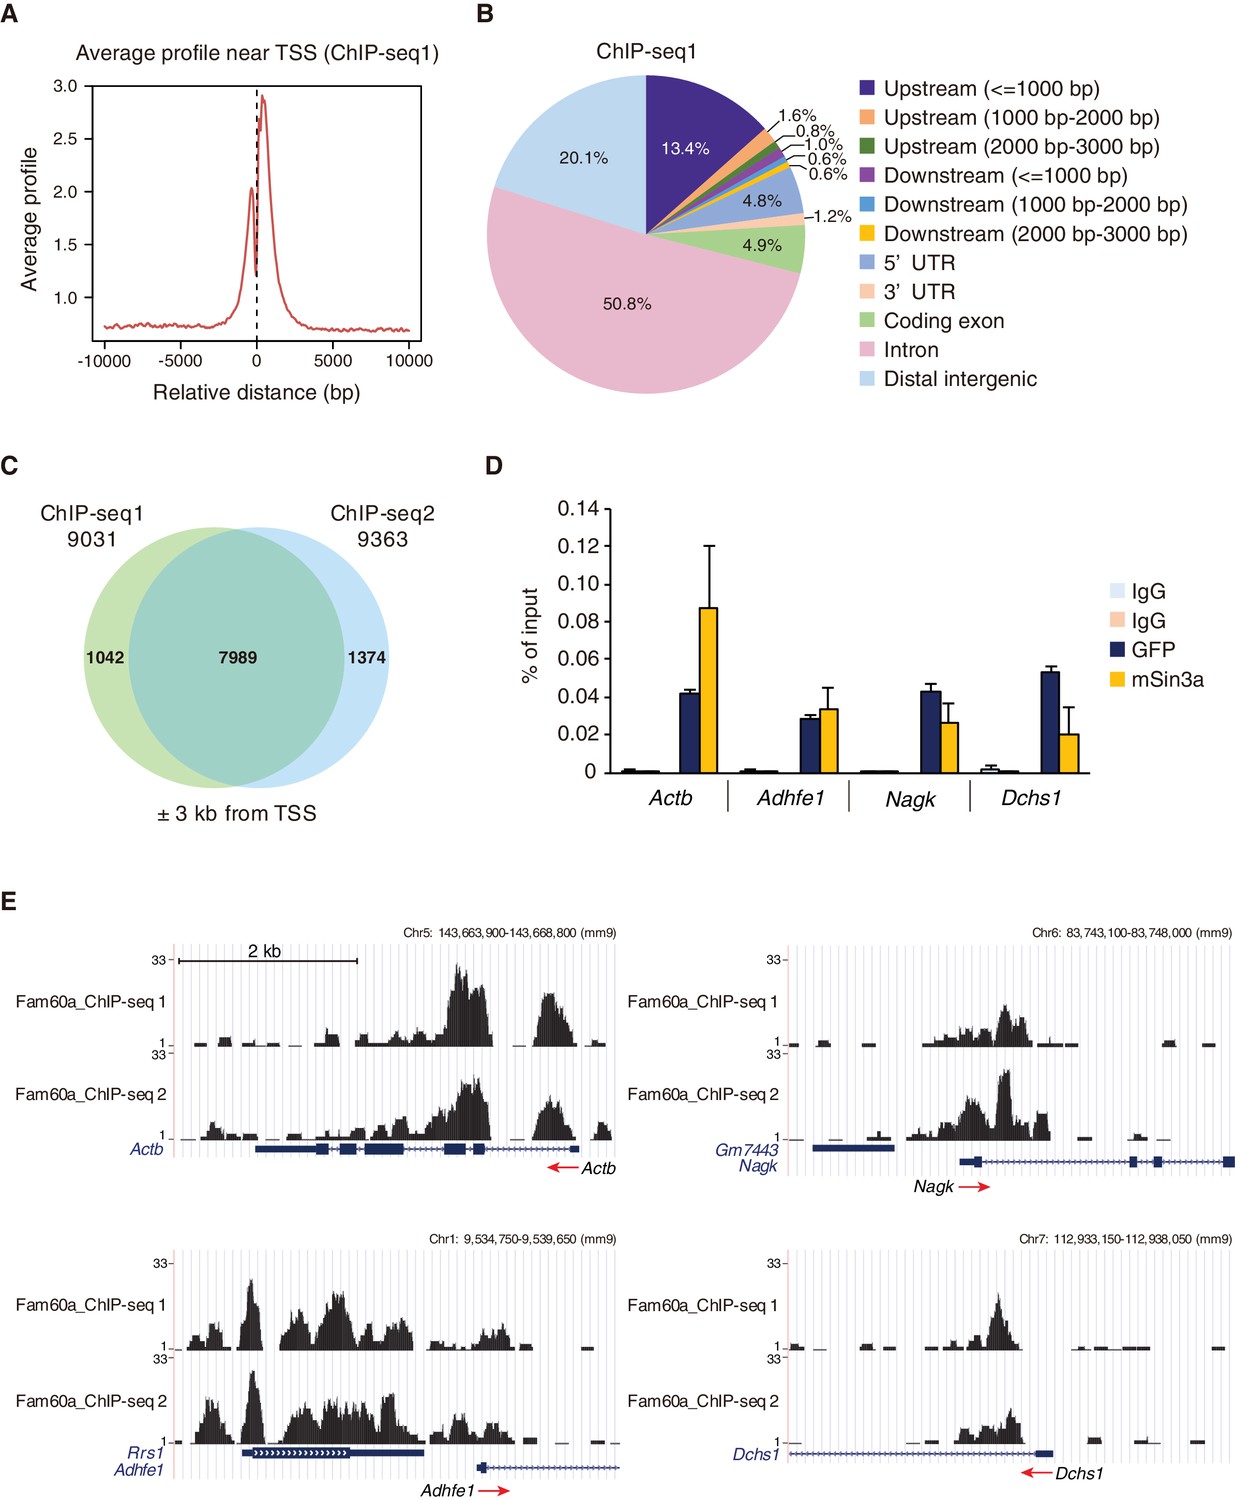
(A) Average binding profile for Fam60a-Venus at the TSS region of all genes with binding peaks identified by ChIP-seq analysis of E9.5 transgenic embryos with antibodies to GFP. Distance is expressed relative to the TSS. (B) Peak distribution for ChIP-seq analysis as in (A). About 80% of peaks were localized to gene loci. UTR, untranslated region. (C) Venn diagram showing the overlap in Fam60a target genes (those with binding peaks within ±3 kb of the TSS) for two independent ChIP-seq analyses (ChIP-seq1 and ChIP-seq2). (D) ChIP-qPCR analysis of the binding of Fam60a-Venus and Sin3a to the TSS regions of the indicated genes in E9.5 transgenic and WT embryos, respectively. The pale blue and orange bars represent IgG controls for antibodies to GFP and to Sin3a, respectively. Data are expressed as percentage of input and are means ± s.d. for three independent experiments. Actb was examined as a positive control. (E) Examples of Fam60a-Venus ChIP-seq results for E9.5 Fam60a-Venus embryos. ChIP-seq1 and ChIP-seq2 were both performed with antibodies to GFP. Peaks around the TSS are shown for four Fam60a target genes, with red arrows indicating the direction of transcription. See also Figure 5—figure supplements 1 and 2.
-
Figure 5—source data 1
List of target genomic regions identified by ChIP-seq analysis.
- https://doi.org/10.7554/eLife.36435.028
-
Figure 5—source data 2
Numerical data of Figure 5D.
- https://doi.org/10.7554/eLife.36435.029
-
Figure 5—source data 3
Numerical data of Figure 5—figure supplement 2.
- https://doi.org/10.7554/eLife.36435.030
Figure 5—figure supplement 1
Genome-wide localization of Fam60a to gene promoters.
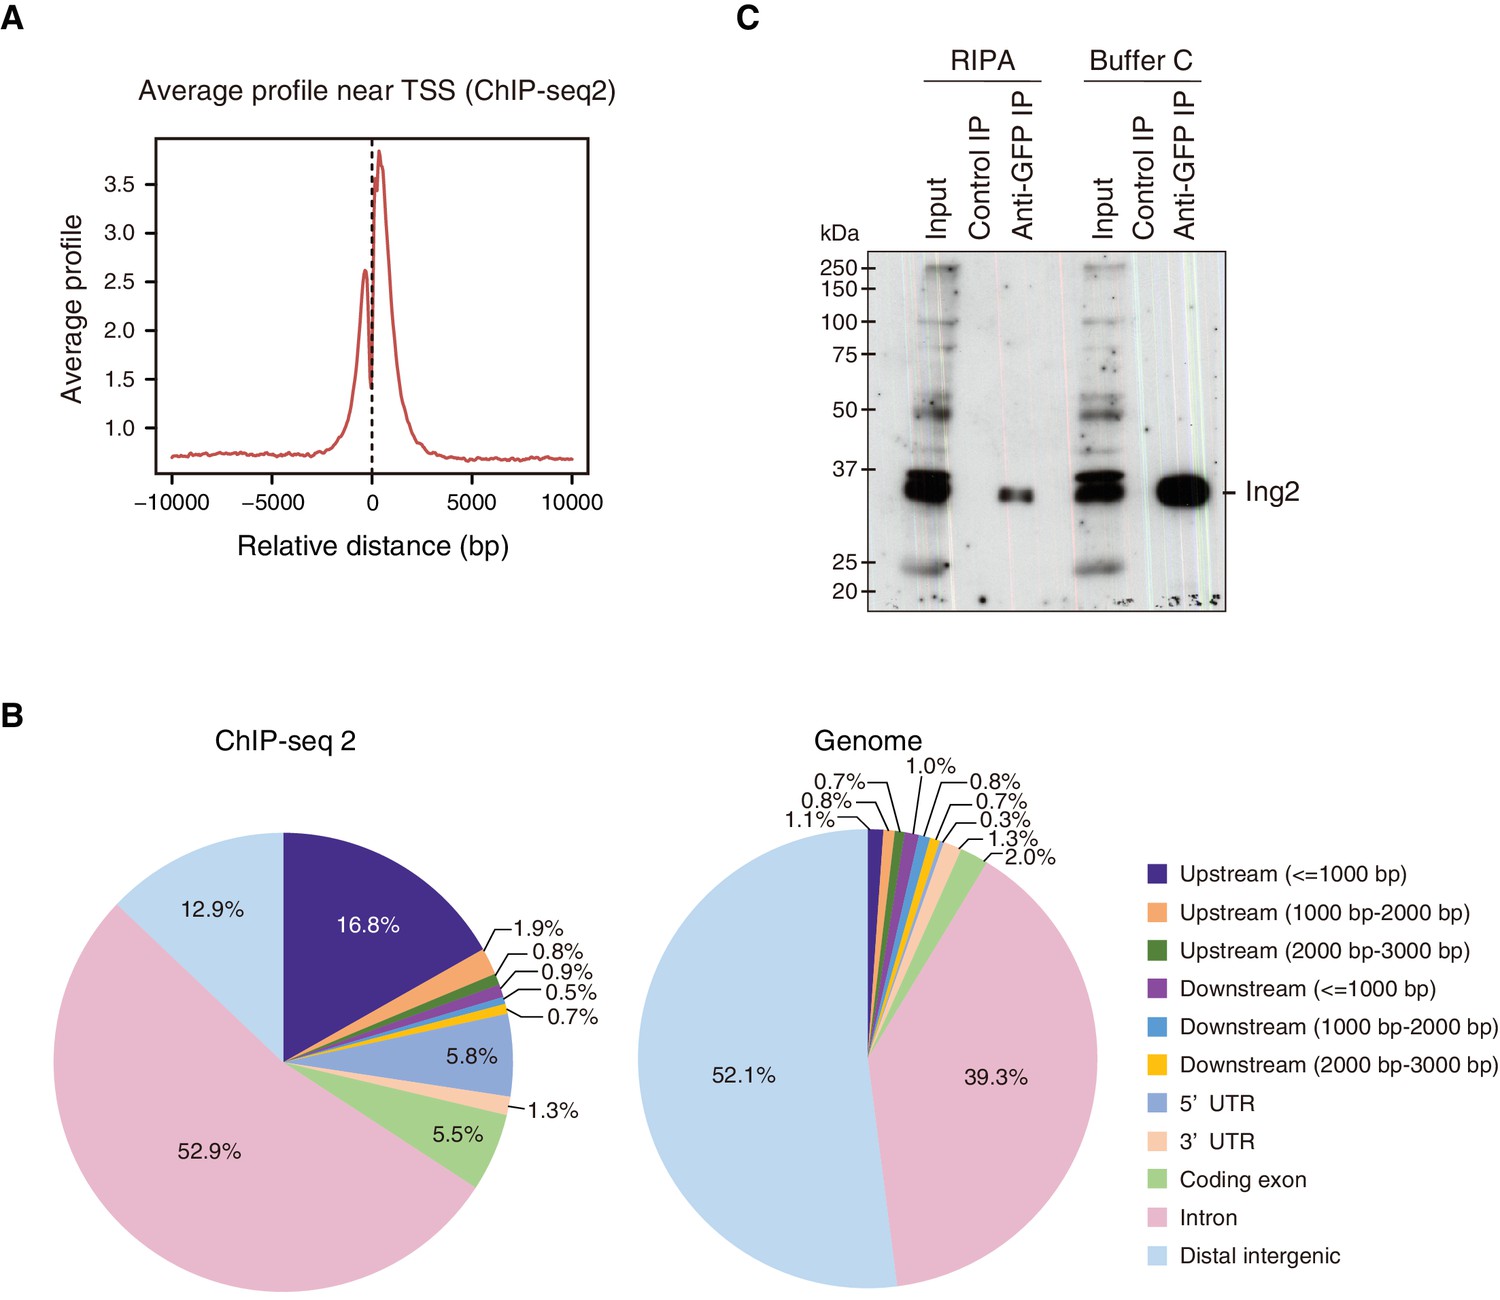
(A) Average binding profile for Fam60a-Venus at the TSS region of all genes with binding peaks identified by ChIP-seq2. Distance is expressed relative to the TSS. (B) Peak distribution for ChIP-seq2 analysis (left panel) compared with overall composition of the mouse genome (right panel). (C) Nuclear extracts prepared from E10.5 Fam60a-Venus transgenic embryos with RIPA buffer or buffer C were subjected to immunoprecipitation with antibodies to GFP or control IgG, and the resulting precipitates were subjected to immunoblot analysis with antibodies to Ing2.
Figure 5—figure supplement 2
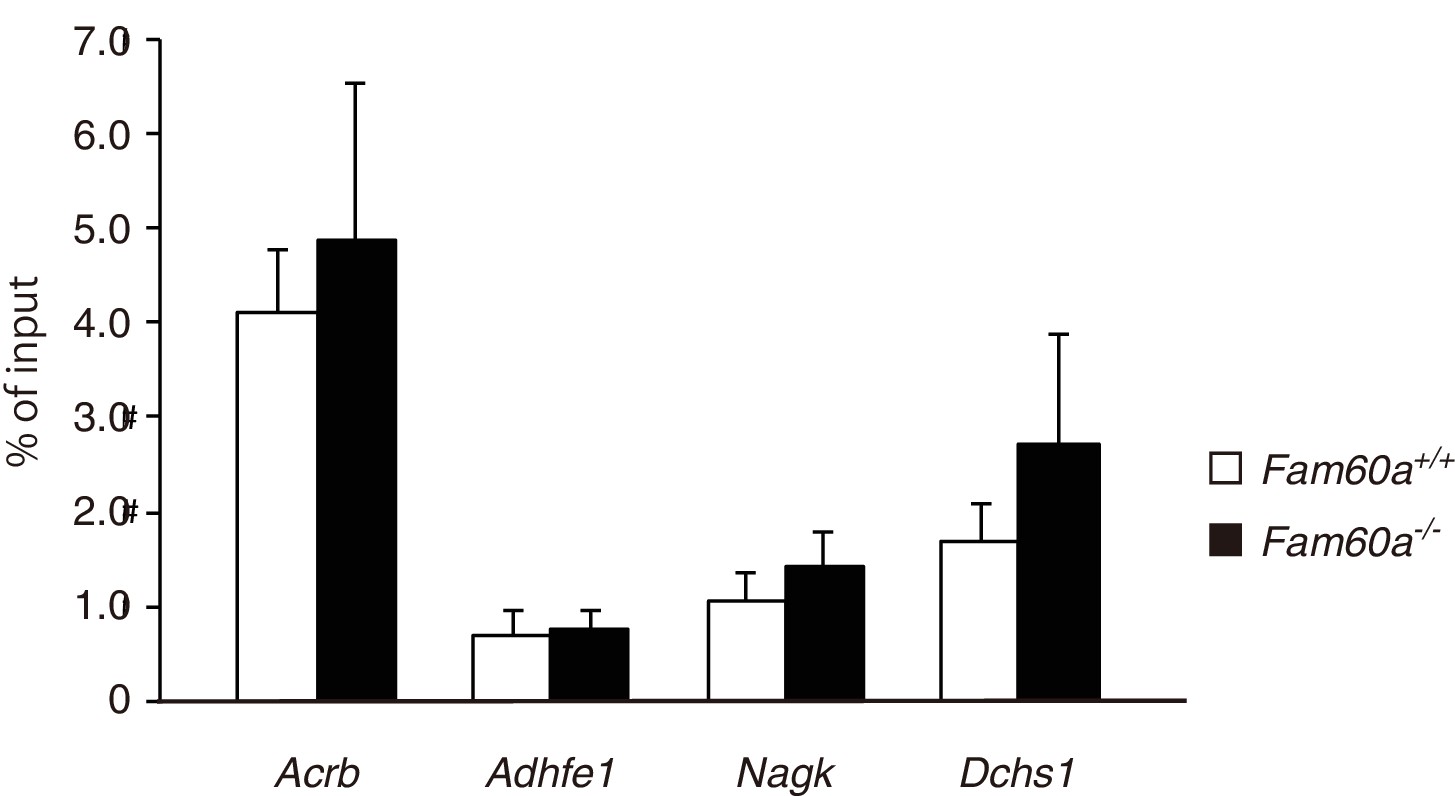
ChIP-qPCR analysis of AcH3K9 at Fam60a target gene promoters.
E9.5 WT and Fam60a–/– embryos were subjected to ChIP-qPCR analysis with antibodies to AcH3K9. Data are expressed as percentage of input and are means ± s.d. for four independent experiments. Values for control IgG were essentially 0% and are therefore not shown.
Figure 6 with 2 supplements
Phylogenetic and functional relation between Fam60a and Tet1.
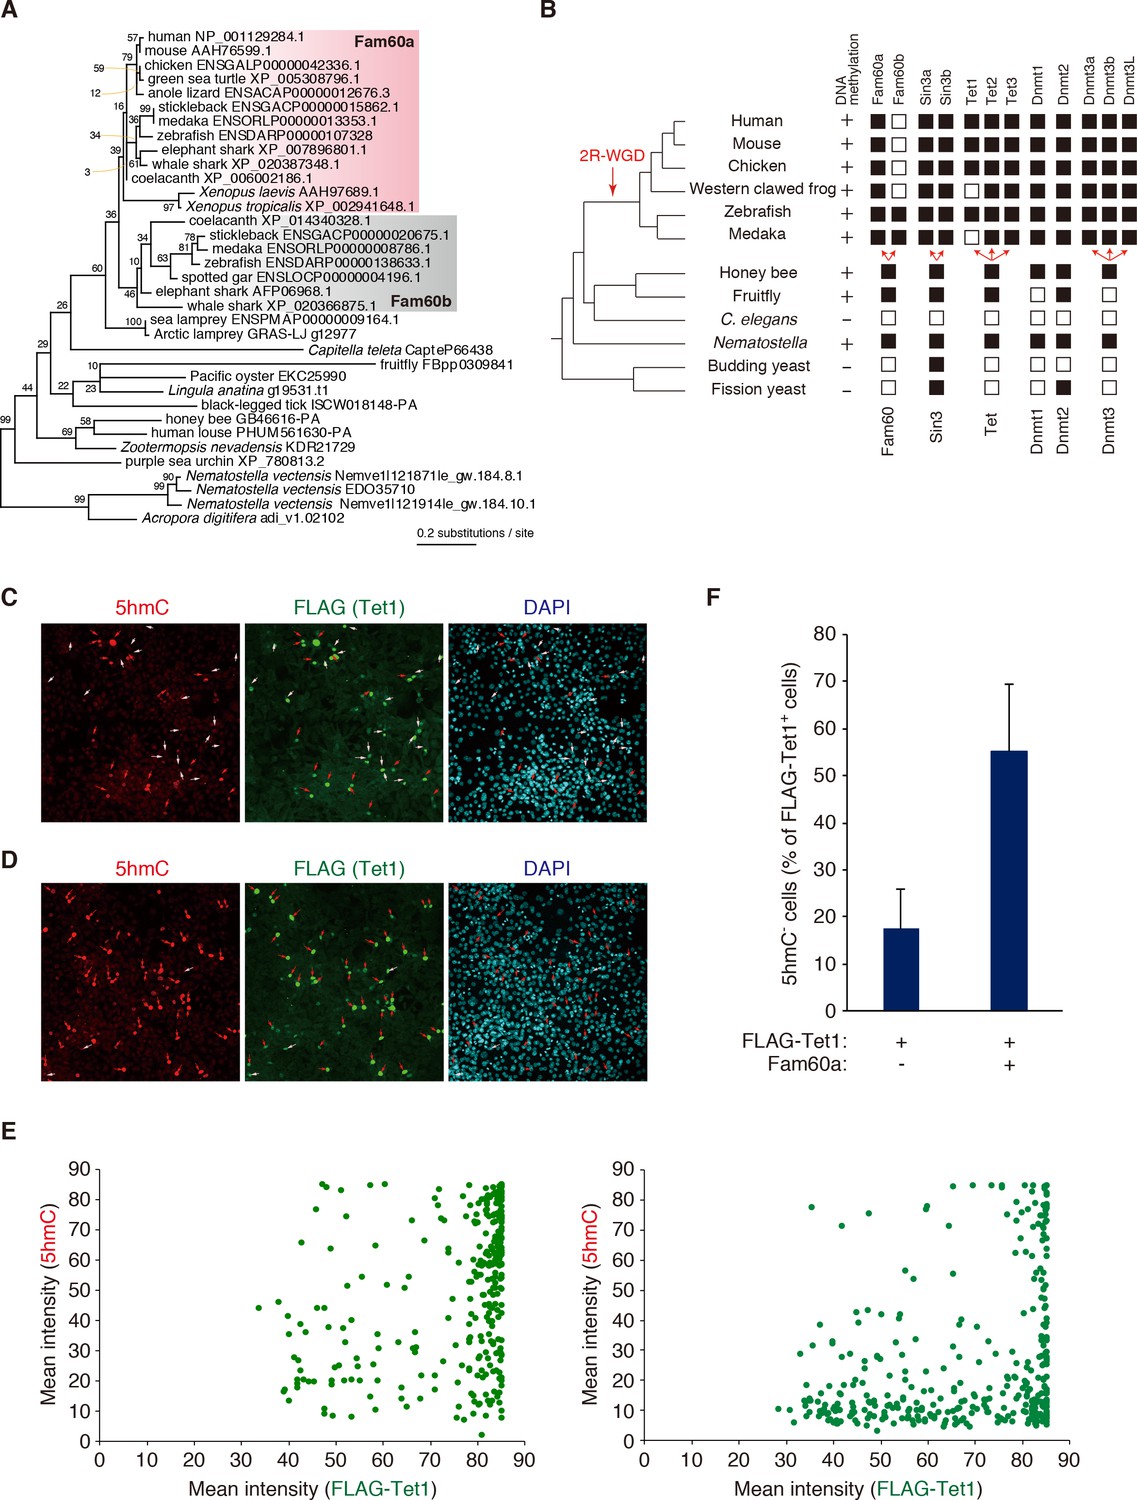
(A) Molecular phylogeny of Fam60a and related proteins. The tree was inferred with the maximum-likelihood method and 99 amino acid residues. Bootstrap values are indicated at individual nodes. (B) Gene repertories for Fam60, Sin3, Tet, and Dnmt families. Black boxes indicate the presence of at least one phylogenetically validated ortholog, whereas white boxes indicate the absence of orthologs. 2R-WGD, two rounds of whole-genome duplication. The presence or absence of DNA methylation in individual species based on current knowledge (Suzuki and Bird, 2008; Zemach and Zilberman, 2010) is also shown. (C and D) Fam60a inhibits Tet1 activity in NIH3T3 cells. Immunofluorescence staining of 5hmC and FLAG-Tet1 was performed for NIH3T3 cells expressing FLAG-Tet1 either together with Fam60a (C) or alone (D). The cells were analyzed 24 hr after the induction of FLAG-Tet1 expression by doxycycline administration. Nuclei were stained with 4',6-diamidino-2-phenylindole (DAPI). Red arrows indicate cells positive for both 5hmC and FLAG immunoreactivity. White arrows indicate cells positive for FLAG but negative for 5hmC. (E) Plots of mean fluorescence intensity for 5hmC versus FLAG-Tet1 in cells expressing FLAG-Tet1 without (left) or with (right) Fam60a as in (C) and (D). (F) Proportion of FLAG-Tet1+ cells that were negative for 5hmC in experiments similar to that in (C) and (D). Data are means ± s.d. for three independent experiments. *p<0.05 (Student’s unpaired t test). See also Figure 6—figure supplements 1 and 2.
-
Figure 6—source data 1
Numerical data of Figure 6E.
- https://doi.org/10.7554/eLife.36435.034
-
Figure 6—source data 2
Numerical data of Figure 6F.
- https://doi.org/10.7554/eLife.36435.035
Figure 6—figure supplement 1
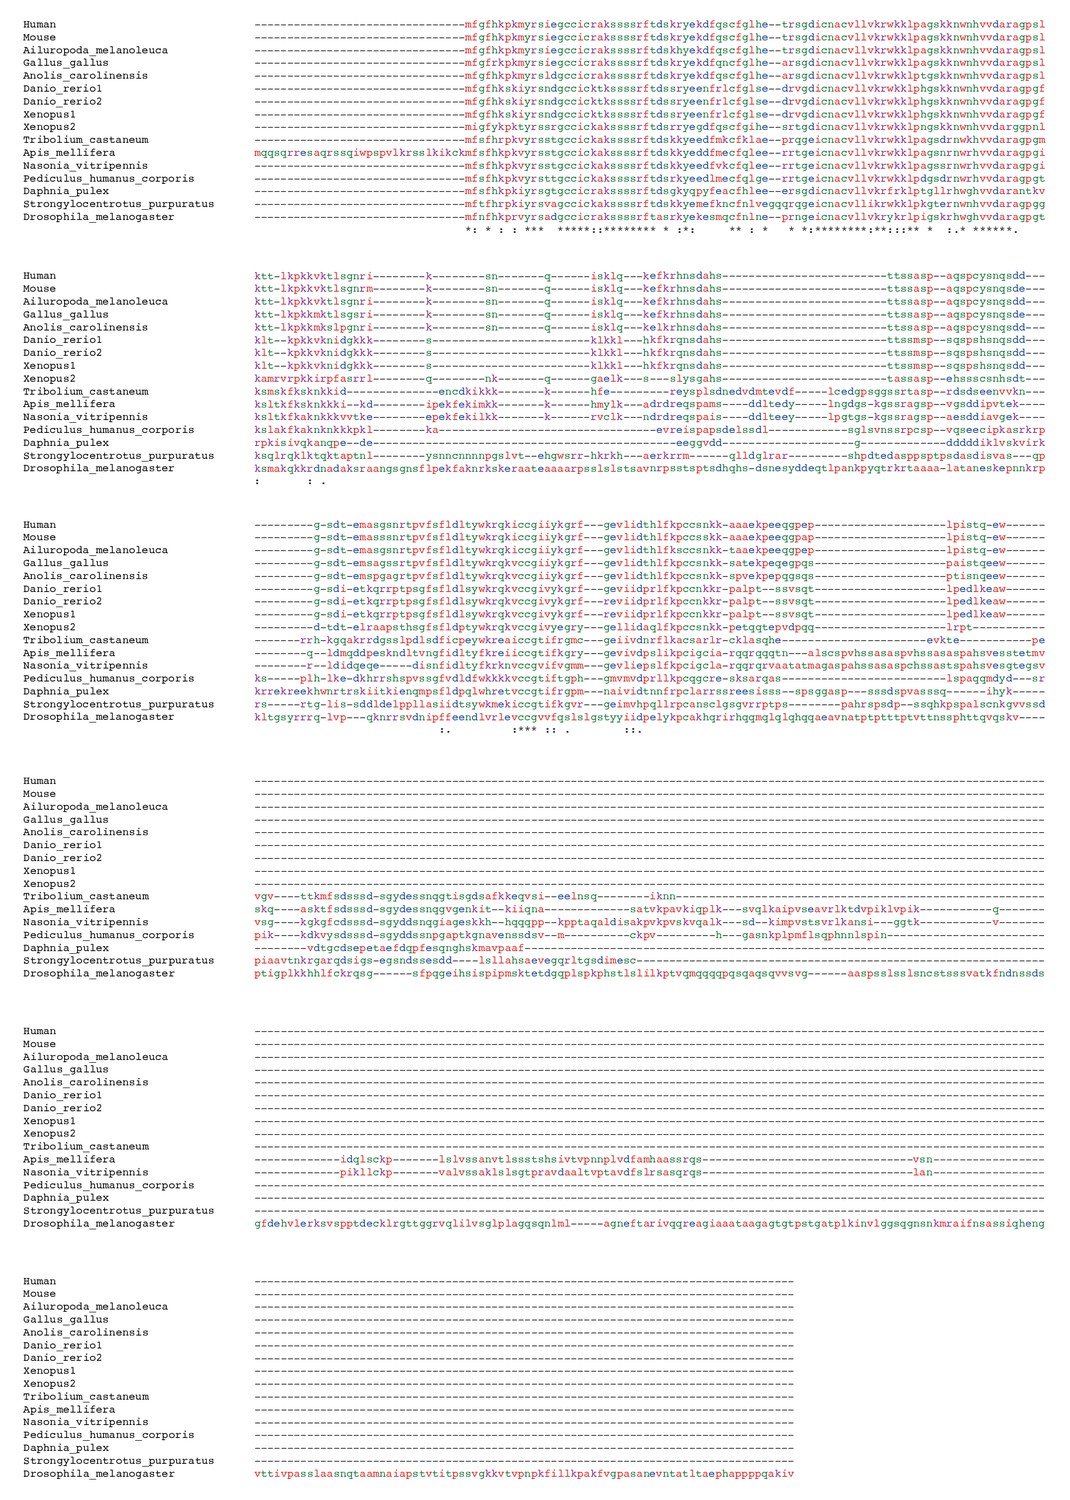
Alignment of the predicted amino acid sequences of Fam60a proteins by Clustal OMEGA.
Asterisks, colons, and periods indicate positions with a fully conserved residue, conservation of highly similar properties, and conservation of weakly similar properties, respectively. Conserved hydrophobic residues (A, V, F, P, M, I, L, W) are shown in red, acidic residues (D, E) in blue, basic residues (R, K) in magenta, and hydroxyl-, sulfhydryl-, or amine-containing residues (S, T, Y, H, C, N, G, Q) in green.
Figure 6—figure supplement 2
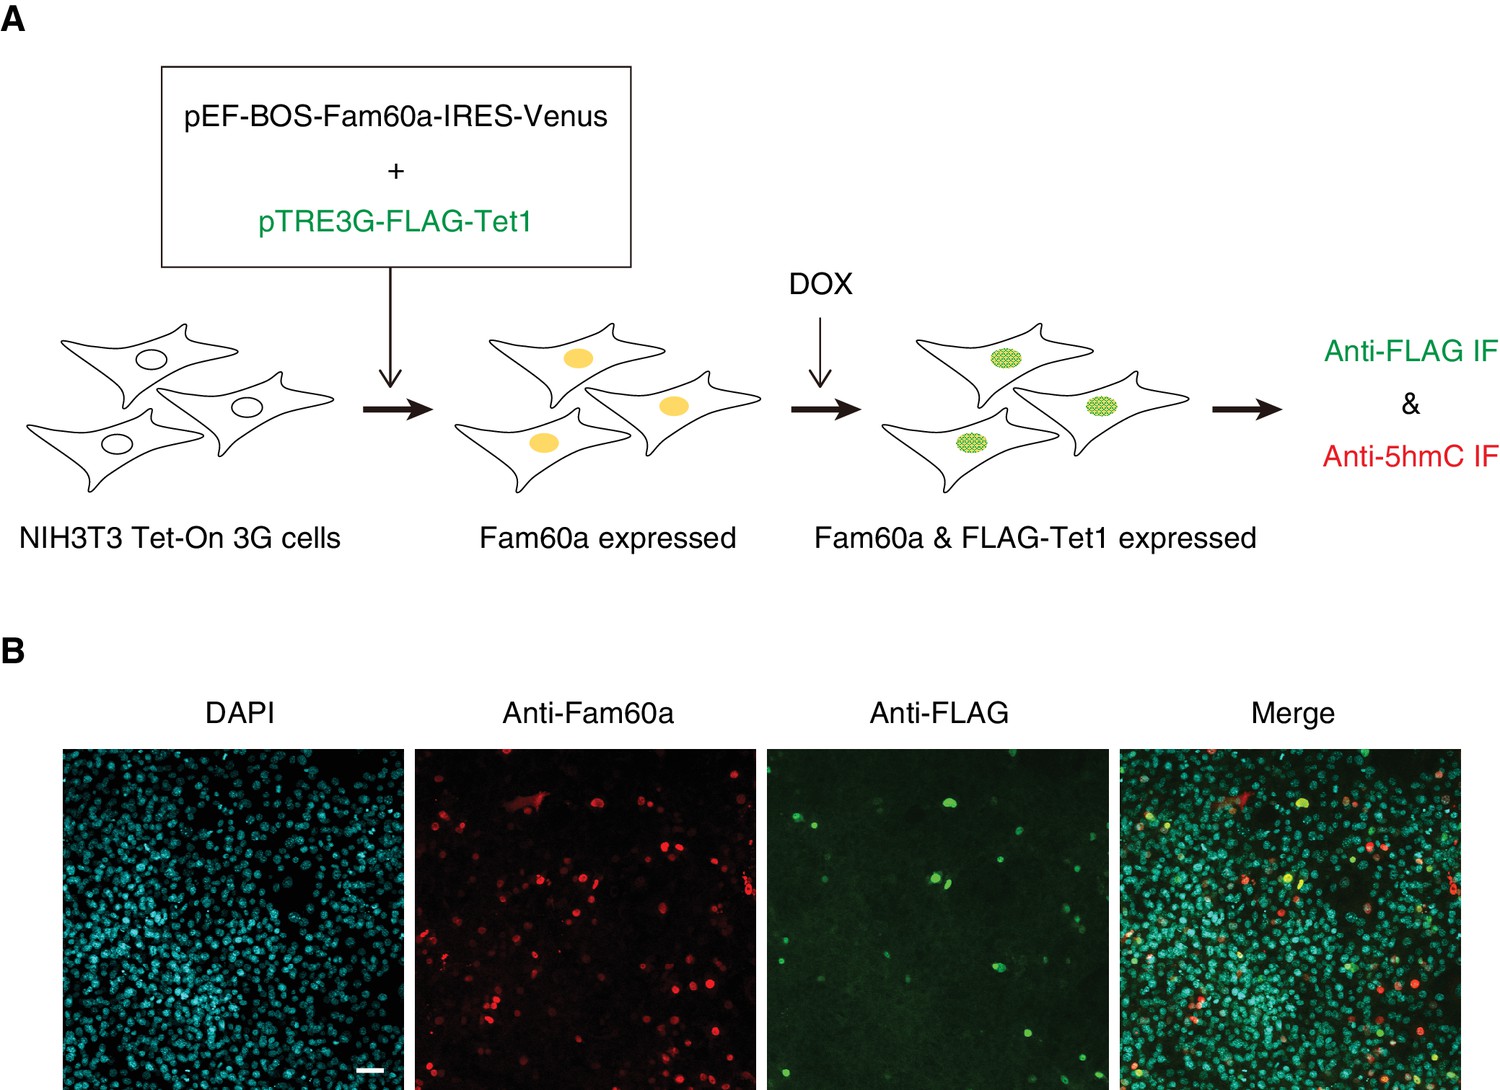
Experimental strategy for expression of Fam60a and Venus and inducible expression of FLAG-Tet1 in NIH3T3 cells.
(A) Schematic representation of cell transfection and induction of FLAG-Tet1 expression by doxycycline (DOX) for the experiments shown in Figure 6C–F. (B) Immunofluorescence (IF) staining of cells transfected and induced to express FLAG-Tet1 as in A). Staining was performed with antibodies to Fam60a and to FLAG at 24 hr after doxycycline administration. Nuclei were stained with DAPI. Scale bar, 50 µm.
Figure 7 with 3 supplements

Methylation status of the Adhfe1 promoter during development of WT and Fam60a–/– mouse embryos.
(A) Methylation pattern at the Adhfe1 promoter in representative WT and Fam60a–/– embryos at the indicated developmental stages as revealed by bisulfite sequencing. Closed and open circles indicate methylated and nonmethylated CpG sites, respectively. Arrows indicate the TSS of Adhfe1. (B) Methylation frequency at the Adhfe1 promoter determined as in (A) for three or four individual embryos of each genotype at each developmental stage. The p value was determined with Student’s unpaired t test. See also Figure 7—figure supplement 1 to 3.
-
Figure 7—source data 1
Numerical data of Figure 7B.
- https://doi.org/10.7554/eLife.36435.040
-
Figure 7—source data 2
Numerical data of Figure 7—figure supplement 2.
- https://doi.org/10.7554/eLife.36435.041
Figure 7—figure supplement 1
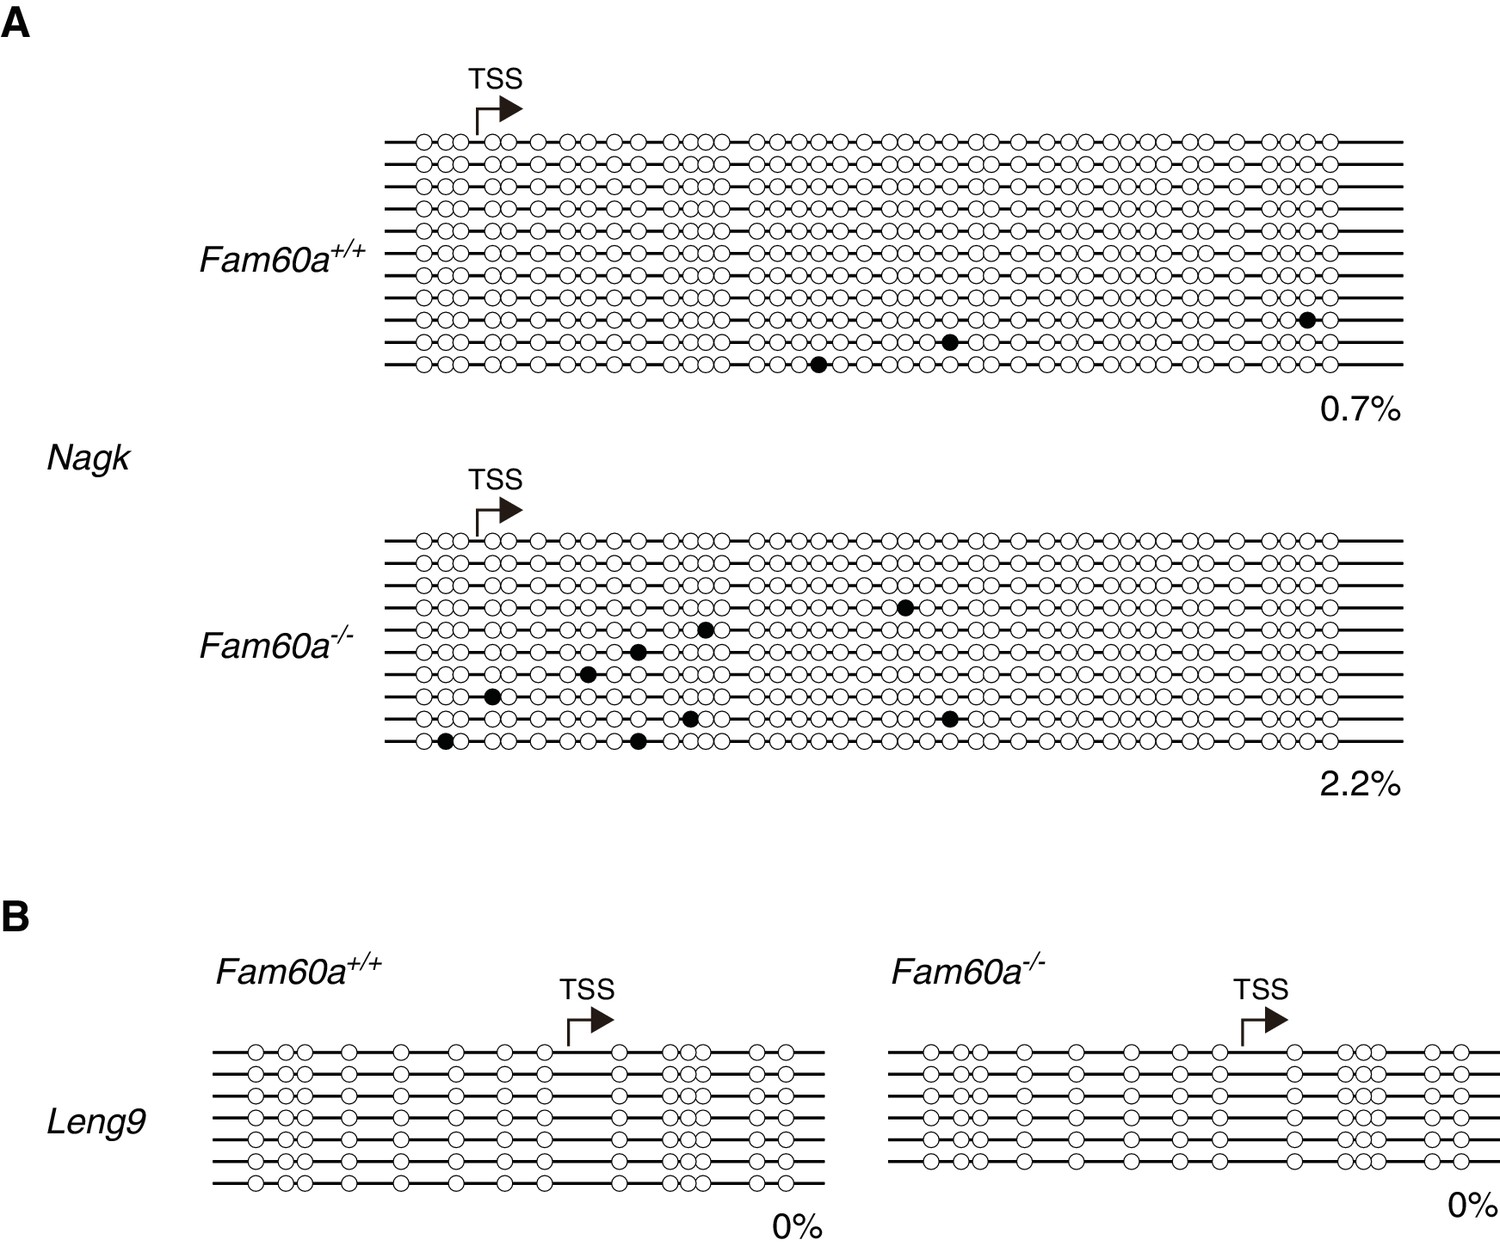
Bisulfite sequencing of Fam60a target gene promoters.
The methylation status of Nagk (A) and Leng9 (B) promoters was determined in individual WT and Fam60a–/– embryos at E9.5.
Figure 7—figure supplement 2
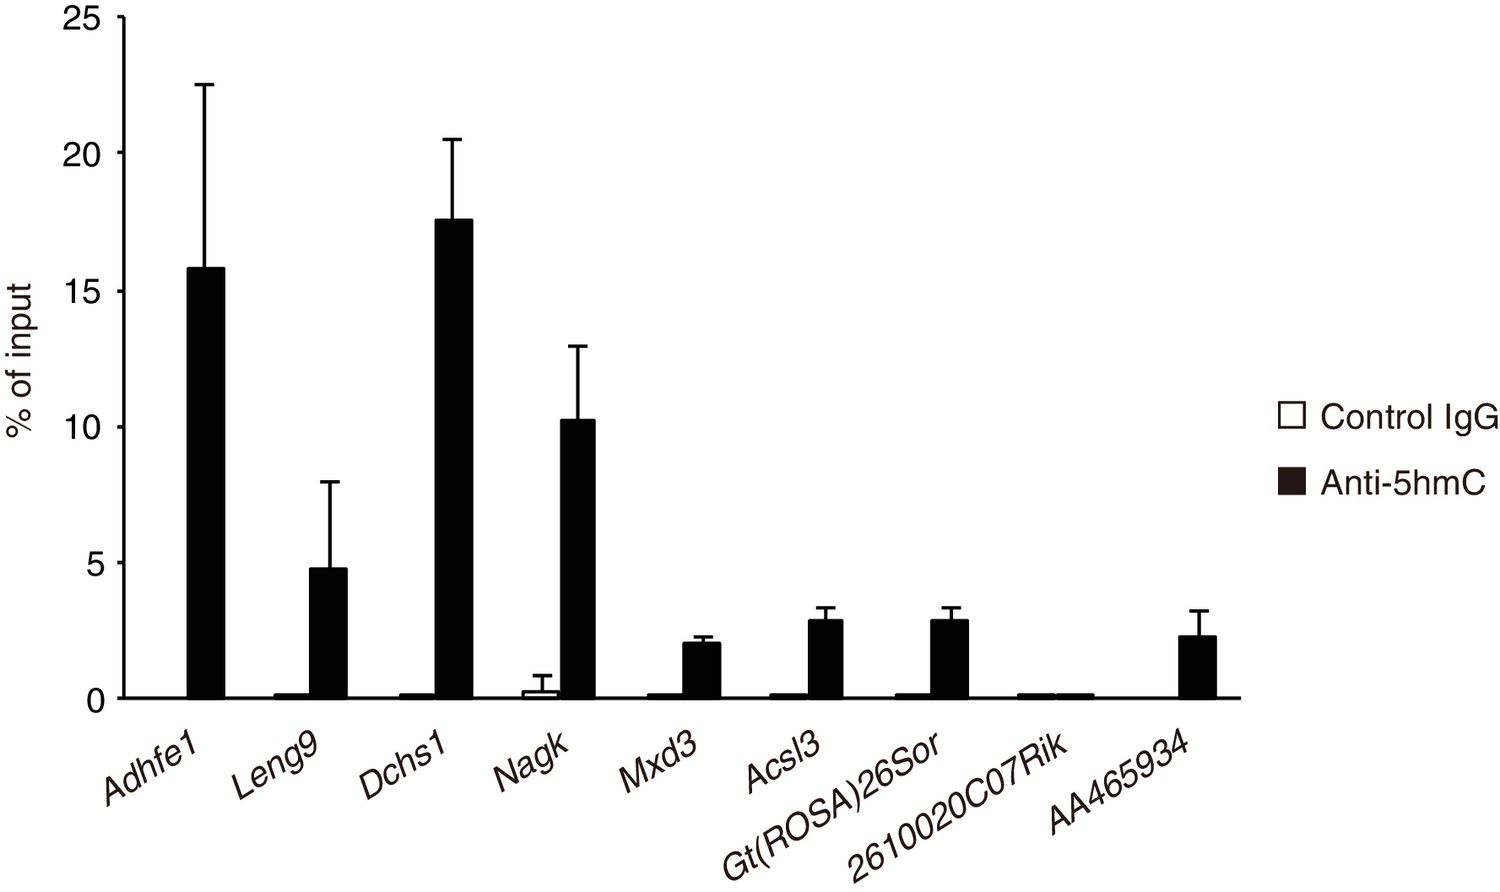
Deposition of 5hmC at Fam60a target gene promoters as revealed by hMeDIP analysis in WT embryos at E9.5.
Data are expressed as percentage of input and are means ± s.d. for four independent experiments.
Figure 7—figure supplement 3
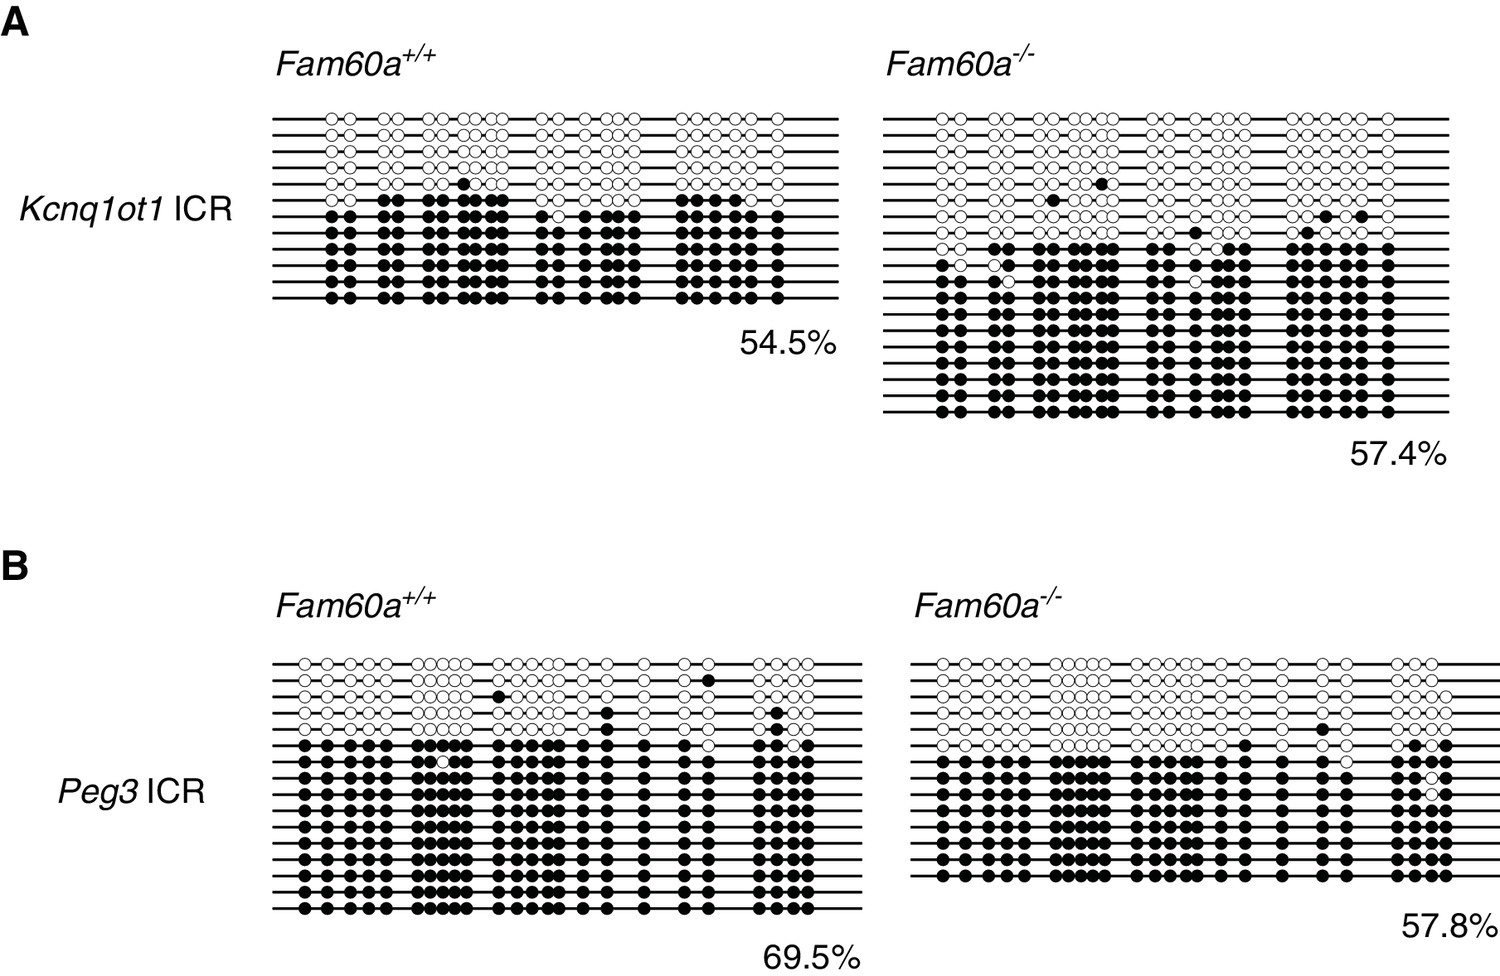
Methylation status of imprinting control regions as determined by bisulfite sequencing.
The methylation status of the imprinting control regions (ICRs) of Kcnq1ot1 (A) and Peg3 (B) was determined in individual WT and Fam60a–/– embryos at E9.5.
Figure 8 with 3 supplements
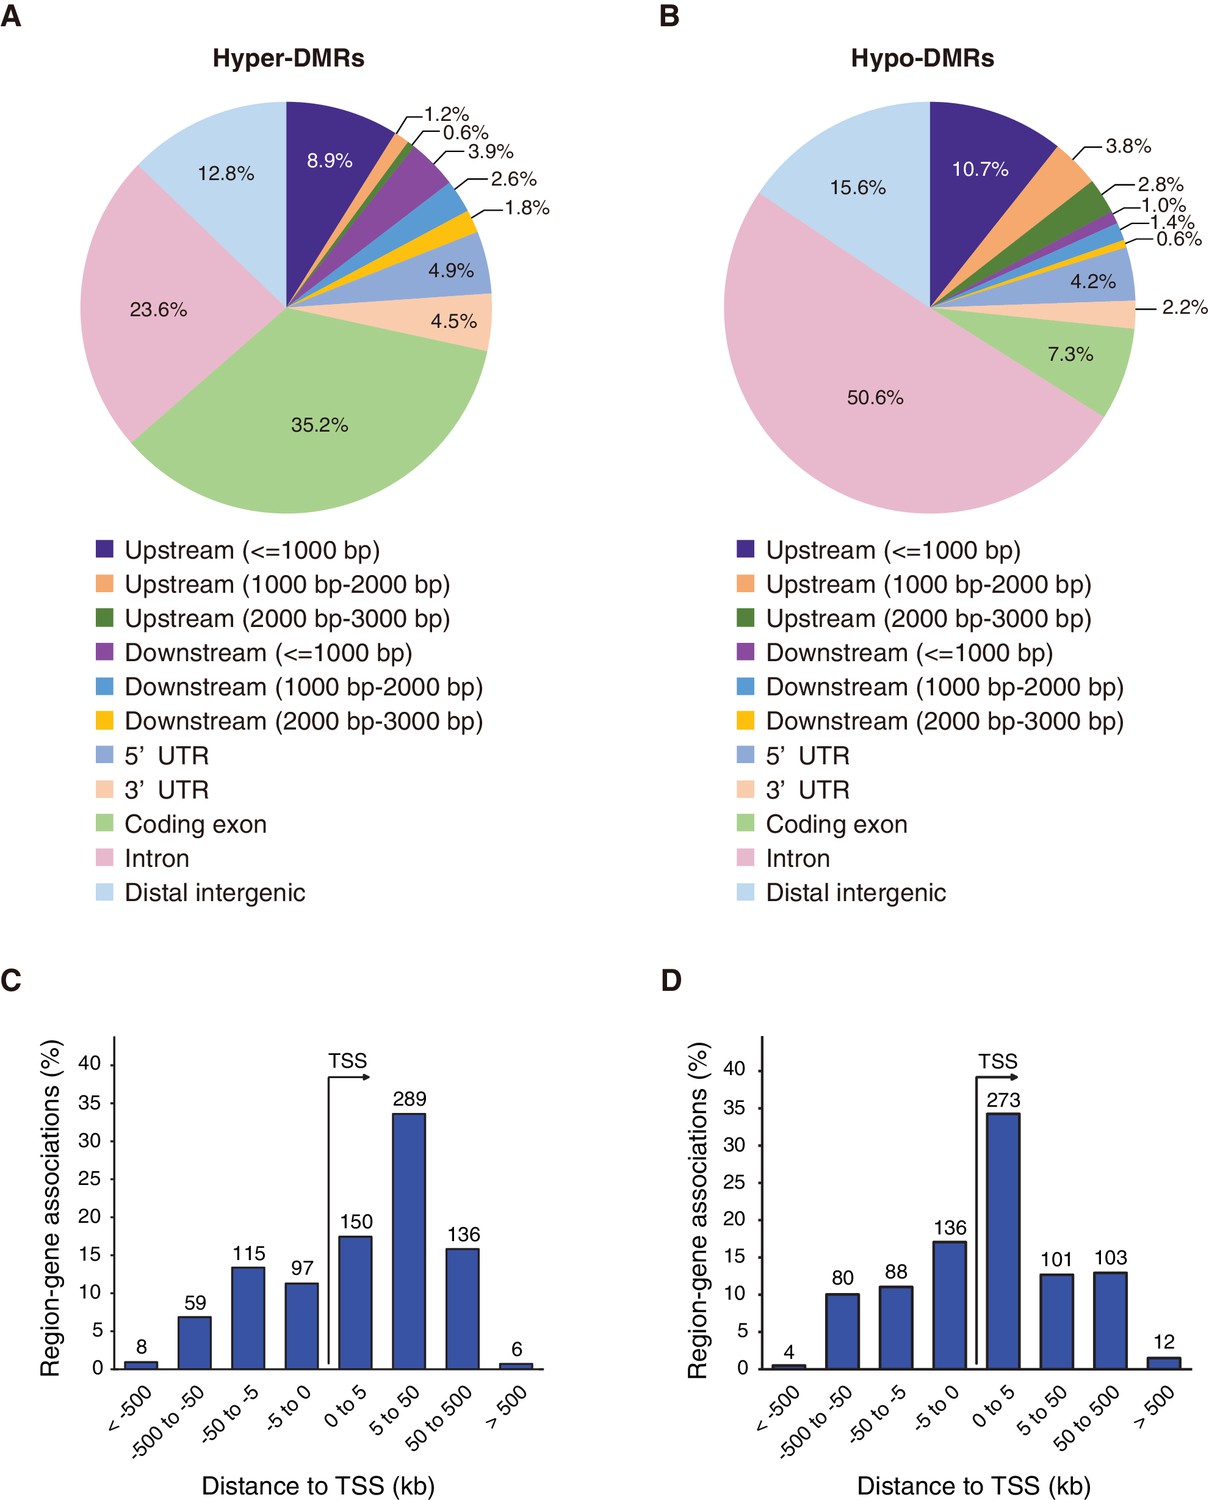
Differentially methylated regions (DMRs) in Fam60a–/– embryos.
(A and B) Distribution of the top 500 hyper- and hypomethylated DMRs, respectively, among various genomic features. (C and D) Genomic position profile for the top 500 hyper- and hypomethylated DMRs, respectively, relative to the nearest TSSs. Note that the total number exceeds 500 because TSSs on both strands, in the vicinity of a DMR, are counted. See also Figure 8—figure supplements 1 and 2 and Supplementary file 2.
-
Figure 8—source data 1
List of hypo- and hypermethylated DMRs.
The DMRs are ordered by the column areaStat, which is the sum of the t-statistics of CpGs. Note that Adhfe1 is included in the top 500 hypomethylated DMRs.
- https://doi.org/10.7554/eLife.36435.047
Figure 8—figure supplement 1
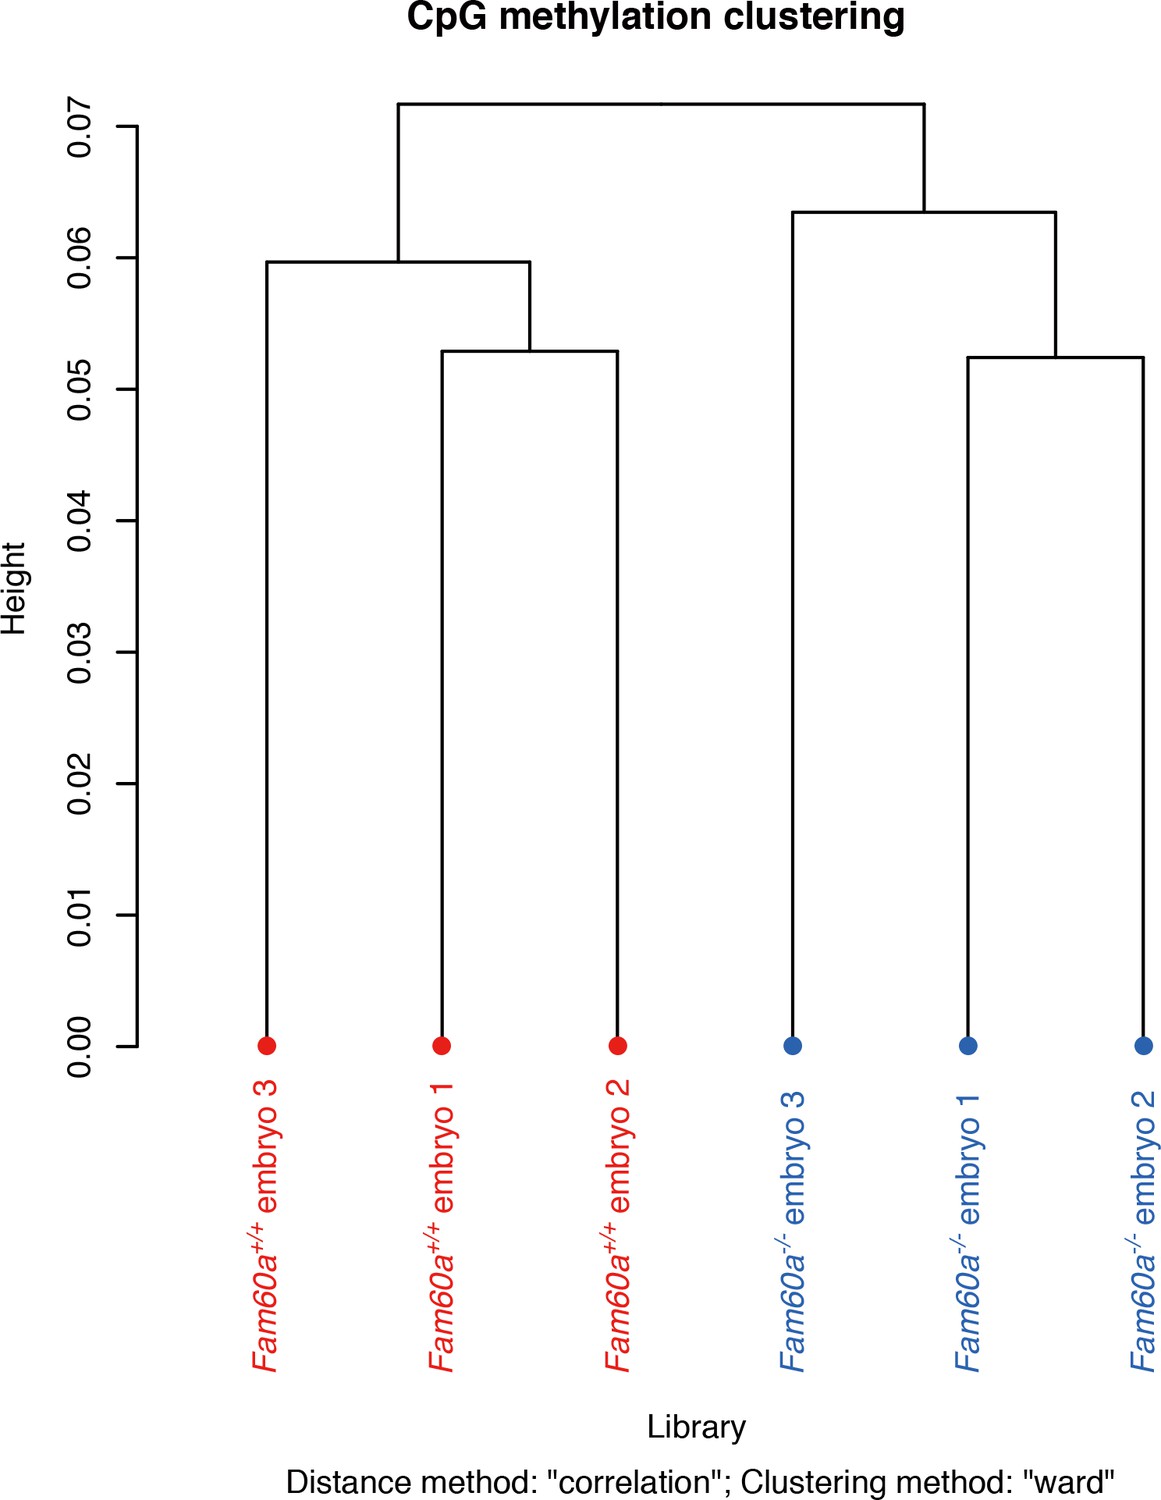
Genome-wide DNA methylation profiles of Fam60a–/– and WT embryos at E9.5.
Dendrogram of hierarchical clustering analysis for samples based on the similarity of their methylation profiles.
Figure 8—figure supplement 2
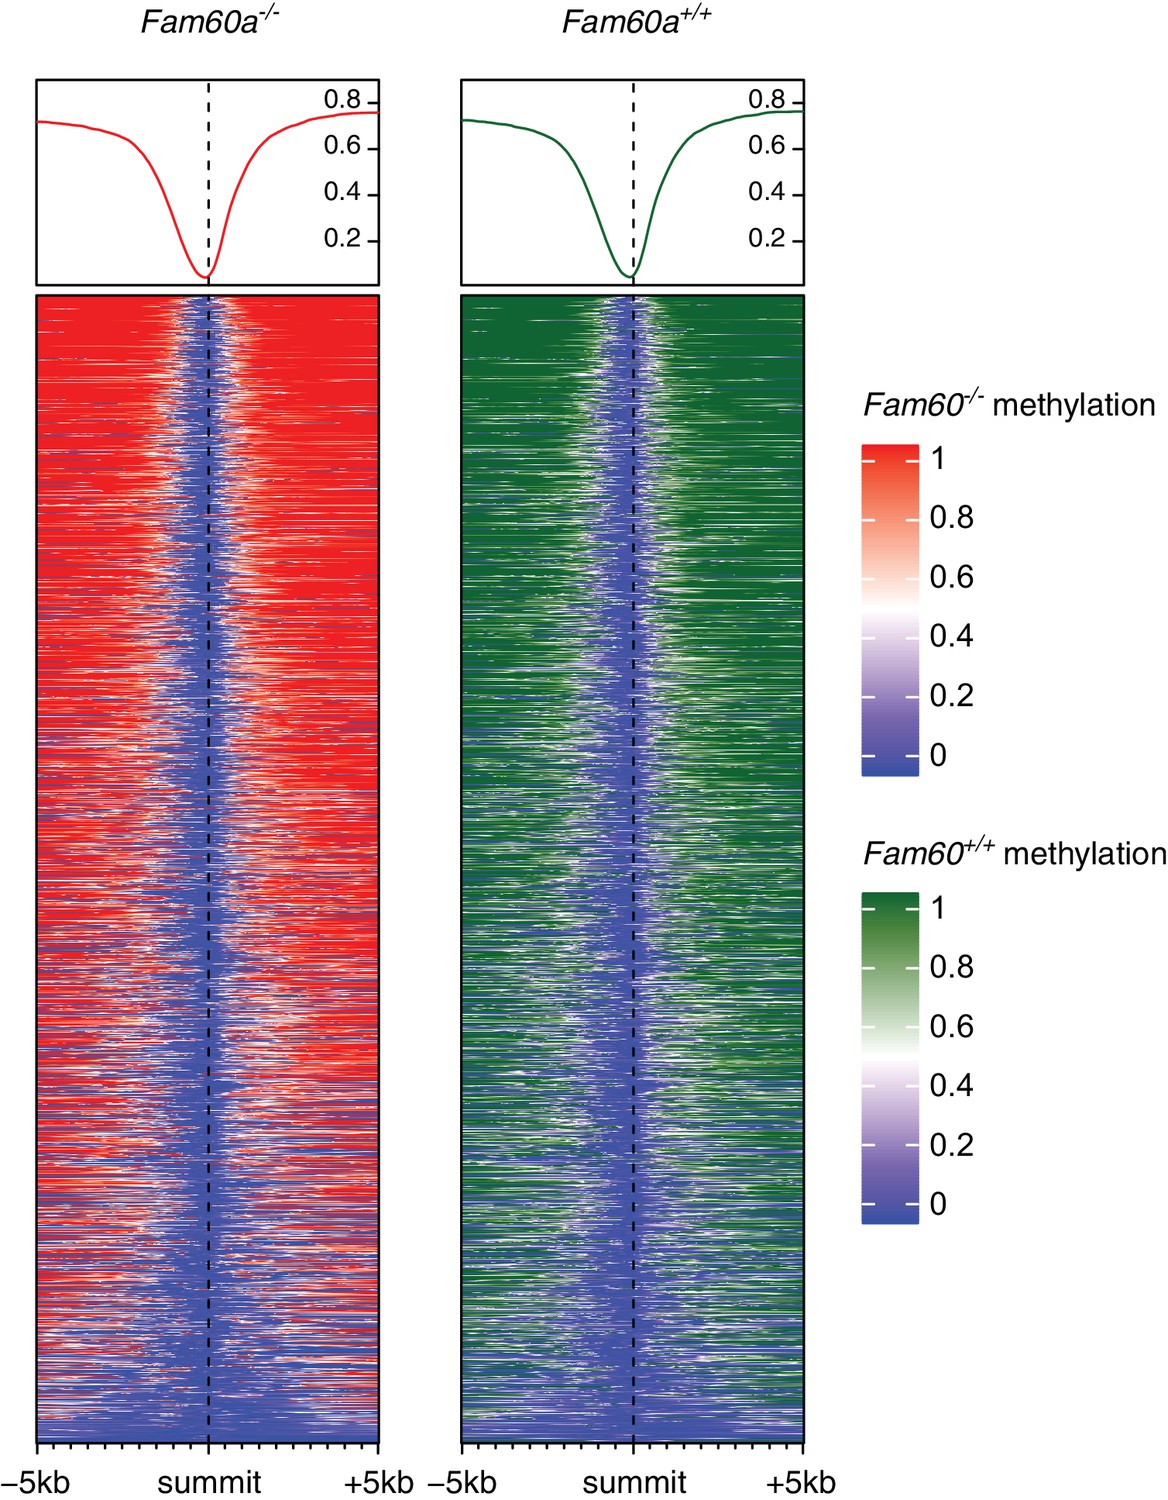
Heatmaps with DNA methylation levels over Fam60a-bound promoters.
A methylation profile of Fam60a-bound promoter regions is shown for wild-type and Fam60a-/- embryos. A Fam60a-bound promoter region was defined as a 10 kb region between 5 kb upstream and 5 kb downstream of a Fam60a ChIP-seq peak summit. For the methylation value of each CpG, the mean of triplicates was used. The heatmap was plotted by EnrichedHeatmap (Gu et al., 2018) of Bioconductor package with following parameters: bin size = 50 bp, mean mode = absolute, and smoothing = on. The center of the heatmap indicates the peak summits of Fam60a-bound regions obtained from the ChIP-seq experiments. Regions containing hypomethylated CpGs are shown in blue. The line plots above the heatmap summarizes the enrichment of DNA methylation. Note that most of Fam60a-bound promoter regions are hypomethylated, and there is no obvious difference in the heatmap between wild-type and Fam60a-/- embryos.
Figure 8—figure supplement 3

Average changes in DNA methylation in hyper- and hypomethylated DMRs.
Methylation changes in hyper- and hypomethylated DMRs identified in Fam60a-/- embryos are shown by box plots. Average changes in DNA methylation were 11.87 and 10.99% for hyper- and hypomethylated DMRs, respectively.
Tables
Table 1
The number of hyper- and hypomethylated DMRs overlapping with ChIP-seq peaks.
Relation between DMRs and Fam60a binding site for E9.5 embryos. Methyl-seq data were obtained for three Fam60a–/– and three WT embryos, and ChIP-seq data were obtained for ChIP-seq1 and ChIP-seq2 experiments. The number of ChIP-seq peaks that overlap with all or the top 500 hyper- and hypomethylated DMRs are shown.
| Data set | Total DMRs | Direction | DMRs | Overlap with ChIP-seq peaks | |
|---|---|---|---|---|---|
| vs. all DMRs (%) | vs. top 500 (%) | ||||
| 3 embryos (triplicates) (mean Diff >= 0.05) | 7245 | Hyper | 3049 | 388 (12.7) | 83 (16.6) |
| Hypo | 4196 | 1257 (30.0) | 254 (50.8) | ||
Key resources table
| Reagent type (species) or resource | Designation | Source or reference | Identifiers | Additional information |
|---|---|---|---|---|
| Gene (mus musculus) | fam60a | NA | NCBI Gene: 56306 | also known as SINHCAF |
| Gene (mus musculus) | Tet1 | NA | NCBI Gene: 52463 | |
| Strain, strain background (mus musculus) | ICR | charles river | ||
| Strain, strain background (mus musculus) | C57BL/6J | charles river | ||
| Strain, strain background (mus musculus) | 129 | charles river | ||
| Strain, strain background (mus musculus) | B6C3F1/Crl | charles river | ||
| Genetic reagent (EMCV) | internal ribosomal entry site (IRES)-βgeo | NA | ||
| Genetic reagent (P1 phage) | loxP | NA | ||
| Genetic reagent (P1 phage) | FRT | NA | ||
| Genetic reagent (Saccharomyces cerevisiae) | CAG-Flpe | PMID: 16651697 | ||
| Genetic reagent (P1 phage) | CAG-Cre | PMID: 9268708 | ||
| Genetic reagent (Aequorea victoria) | Fam60a-Venus | this paper | ||
| Genetic reagent (P1 phage) | Fam60a-CreERT2 | this paper | ||
| Cell line (mus musculus) | P19 | PMID:7056443 | ||
| Cell line (mus musculus) | NIH3T3 Tet-On 3G | Clontech | 631197 | |
| Antibody | Antibody to Fam60a (α-E15W) (rabbit polyclonal) | this paper | 1/1000 dilution for IHC or WB | |
| Antibody | anti-GFP (rabbit polyclonal) | MBL | Code No.598 RRID: AB_591819 | 10 µl for IP, 1/2000 dilution for IF |
| Antibody | control Rabbit IgG | Kamiya Biomedical | PC-124 | used for IP control |
| Antibody | control Rabbit IgG | Thermo Fisher Scientific | used for IP control | |
| Antibody | anti-HDAC1 (mouse monoclonal) | abcam | ab31263 RRID: AB_732774 | this product is discontinued by abcam |
| Antibody | anti-FLAG (mouse monoclonal) | Sigma-Aldrich | F3165 RRID: AB_259529 | 1/2000 for IF |
| Antibody | anti-HDAC2 (rabbit polyclonal) | abcam | ab7029 RRID: AB_305706 | 1/1000 dilution for WB |
| Antibody | anti-Sin3a (rabbit polyclonal) | Santa Cruz Biotechnology | sc-994 RRID: AB_2187760 | 1/1000 dilution for WB |
| Antibody | anti-Ing2 (rabbit polyclonal) | abcam | ab109504 RRID: AB_10861294 | 1/2000 dilution for WB |
| Antibody | anti-BrdU (mouse monoclonal) | BD bioscience | 347580 RRID: AB_10015219 | 1/200 dilution for IHC |
| Antibody | anti-5hmC (rabbit polyclonal) | active motif | 39769 RRID: AB_10013602 | 1/2000 dilution for IF |
| Antibody | anti-Histone H3K9ac (rabbit polyclonal) | active motif | 39917 RRID: AB_2616593 | used for ChIP assay |
| Antibody | anti-RbAp46/48 (rabbit polyclonal) | active motif | 39199 RRID: AB_2615007 | 1/2000 dilution for WB |
| Recombinant DNA reagent | pTRE3G-FLAG-Tet1 | this paper | ||
| Recombinant DNA reagent | pEF-BOS-Fam60a-IRES-Venus | this paper | ||
| Recombinant DNA reagent | pEF-BOS | PMID: 1698283 | ||
| Peptide, recombinant protein | E15W | this paper | for the rise of Anti-Fam60a antibody | |
| Peptide, recombinant protein | recombinant GFP protein | abcam | ab85191 | |
| Commercial assay or kit | EpiTect Bisulfite Kit | Qiagen | ID: 59104 | |
| Commercial assay or kit | PrimeScript RT Reagent Kit with gDNA Eraser | Takara | RR047A | |
| Commercial assay or kit | SOLiD Total RNA-Seq Kit | Life Technologies | 4445374 | |
| Commercial assay or kit | SureSelect Methyl-Seq Target Enrichment System | Agilent Technologies | 931052 | |
| Commercial assay or kit | EZ Methylation-Gold Kit | Zymo Research | ||
| Chemical compound, drug | BS3 | Thermo Fisher Scientific | Prod#21580 | for antibody conjugation to dynabeads |
| Chemical compound, drug | Doxycycline hyclate | Sigma-Aldrich | D9891 | |
| Chemical compound, drug | tamoxifen | Sigma-Aldrich | T5648-1G | dissolved in corn oil |
| Software, algorithm | LifeScope software | Applied Biosystem | ||
| Software, algorithm | MACS | PMID: 18798982 | ||
| Software, algorithm | CEAS | PMID: 19689956 | ||
| Software, algorithm | QUMA | PMID: 18487274 | ||
| Software, algorithm | bowtie2 | PMID: 22388286 | ||
| Software, algorithm | Bismark | PMID: 21493656 | ||
| Software, algorithm | Samtools | PMID: 19505943 | ||
| Software, algorithm | Picard toolkit | Broad Institute | ||
| Software, algorithm | methylKit program | PMID: 23034086 | ||
| Software, algorithm | BSseq program | PMID: 23034175 | ||
| Software, algorithm | bedtools | PMID: 20110278 | ||
| Software, algorithm | GREAT | PMID: 20436461 | ||
| Software, algorithm | aLeaves | PMID: 23677614 | ||
| Software, algorithm | MAFFT | PMID: 23329690 | ||
| Software, algorithm | trimAl | PMID: 19505945 | ||
| Software, algorithm | RAxML | PMID: 24451623 |
Additional files
-
Supplementary file 1
Distribution of Fam60a genotypes for mouse embryos obtained by heterozygote intercrosses at various stages of development.
- https://doi.org/10.7554/eLife.36435.048
-
Supplementary file 2
Methylation level of CpG sites in the captured DNA in three embryos of each genotype.
- https://doi.org/10.7554/eLife.36435.049
-
Transparent reporting form
- https://doi.org/10.7554/eLife.36435.050
Download links
A two-part list of links to download the article, or parts of the article, in various formats.
Downloads (link to download the article as PDF)
Open citations (links to open the citations from this article in various online reference manager services)
Cite this article (links to download the citations from this article in formats compatible with various reference manager tools)
Loss of Fam60a, a Sin3a subunit, results in embryonic lethality and is associated with aberrant methylation at a subset of gene promoters
eLife 7:e36435.
https://doi.org/10.7554/eLife.36435


