Evolutionary pathways of repeat protein topology in bacterial outer membrane proteins
- University of Kansas, United States
- Tel Aviv University, Israel
- University of Haifa, Israel
Figures
Figure 1 with 1 supplement
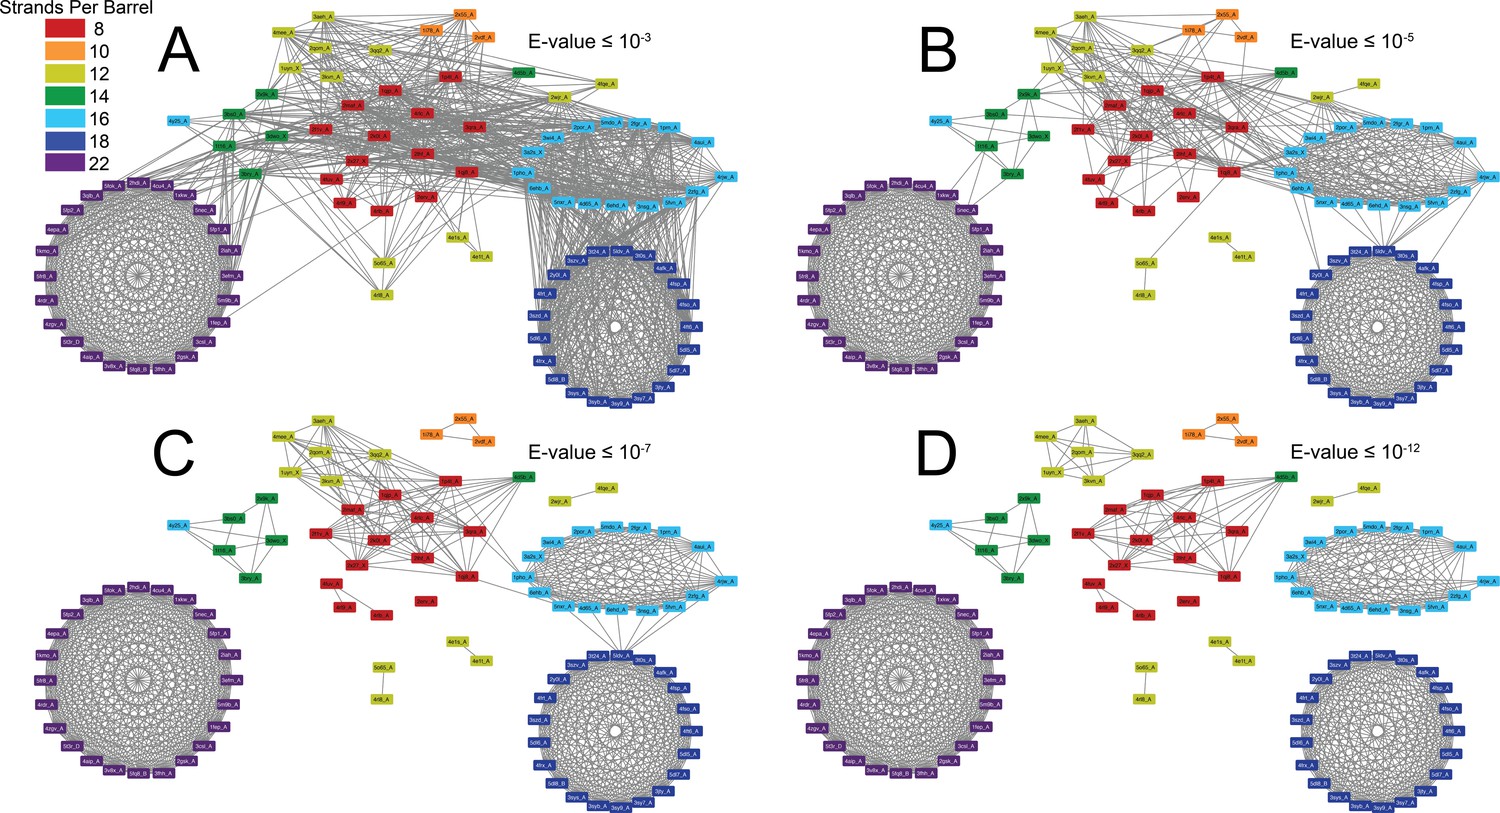
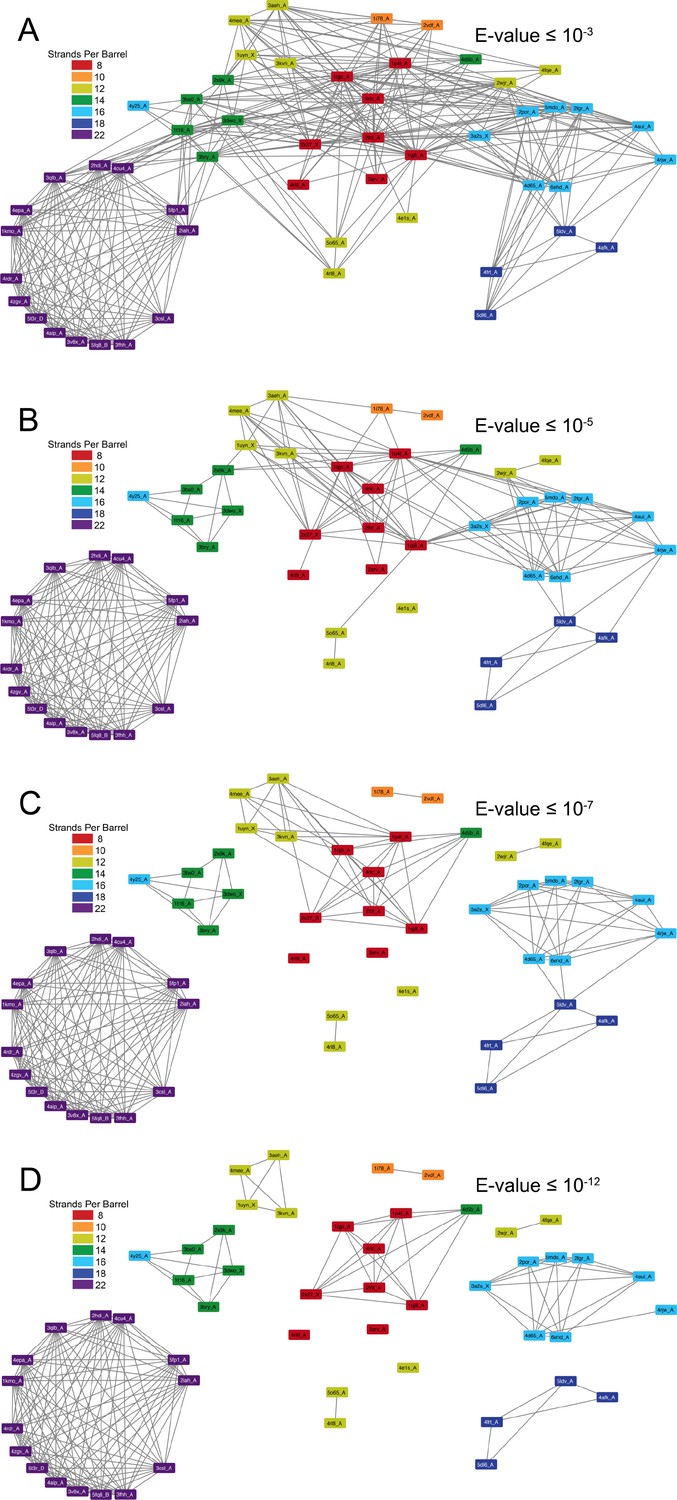
The prototypical barrels at E-values ≤ 10−3 to 10−12 colored by number of strands.
Each edge represents sequence similarity between two nodes (barrels) with an E-value less than or equal to the subcaption. Multiple edges between the same pair of nodes have been removed for clarity; the edge with the lowest E-value was kept for visualization. (A) E-values ≤ 10−3, (B) E-values ≤ 10−5, (C) E-values ≤ 10−7, (D) E-values ≤ 10−12. A gif toggling through the E-values is shown in Video 1. The equivalent of Figure 1 at 25% sequence similarity is shown in Figure 1—figure supplement 1. Supplementary file 1 lists the list the PDBs of the full OMBB dataset. Figure 1—source data 1 show all the alignments.
-
Figure 1—source data 1
All alignment data.
Alignment data for all edges are shown in Figure 1, space-delimited. The header information is in the first row.
- https://doi.org/10.7554/eLife.40308.004
Figure 1—figure supplement 1
Prototypical barrels at 25% sequence similarity at an E-value ≤10–3 to 10–12 colored by number of strands.
Each edge represents an interaction between two nodes (barrels) with an E-value less than or equal to the subcaption. Multiple edges between the same pair of nodes have been removed for clarity; the edge with the lowest E-value was kept for visualization.
Figure 2 with 1 supplement
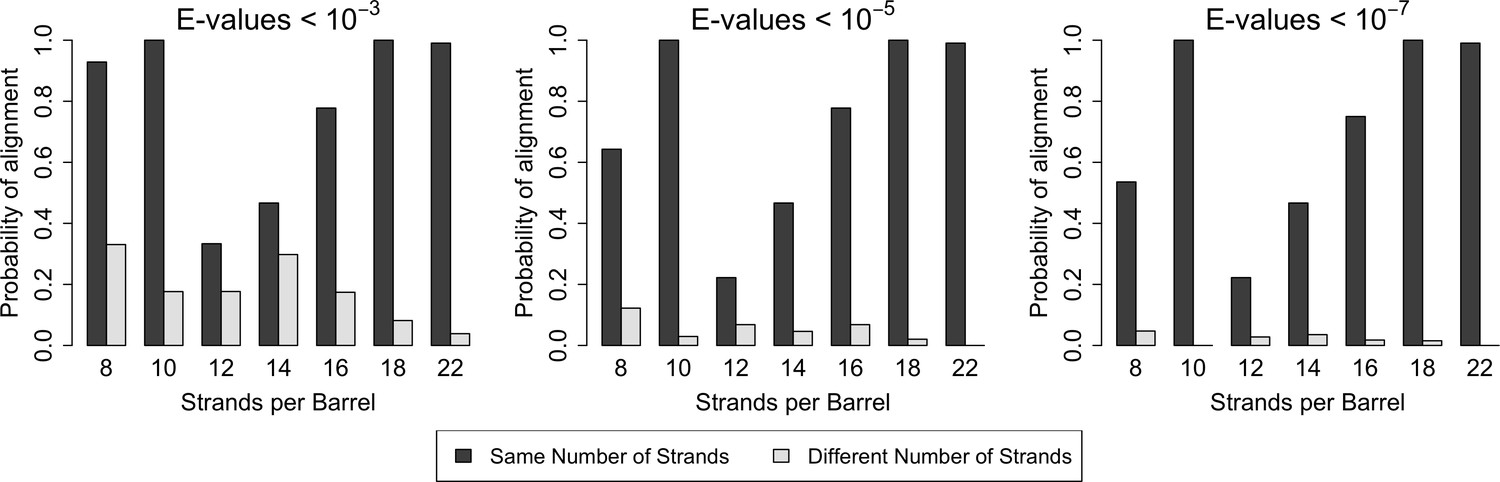
Similarity is higher among prototypical barrels with the same number of strands.
Probability of barrels aligning with other prototypical barrels of the same number of strands compared to the probability of barrels aligning with prototypical barrels with different numbers of strands. Only prototypical OMBBs with <25% sequence similarity were considered. Alignments of OMBBs shown at E-values < 10−3 (left), E-values < 10−5 (center), E-values < 10−7 (right). If multiple alignments between two proteins existed, we used only the alignment with the smallest E-value. Probability was calculated as the number of alignments in each group divided by the possible combinations of barrel alignments for each group. Moreover, we find that E-values are always lower among barrels of the same strand number than between barrels of a different strand number (Figure 2—source data 1). Although barrel residues increase in size as they increase in strand number (Figure 2—figure supplement 1) such differences do not mute the relationships between barrels of different sizes.
-
Figure 2—source data 1
Alignments between barrels of the same strand number have lower E-values.
Average E-values calculated in log space of the prototypical barrels, within and between barrels of different sizes. Only interactions with E-values <10–3 were included in the average. The minimum value of each row has been bolded. Values shown are the average E-values calculated in log space.
- https://doi.org/10.7554/eLife.40308.022
Figure 2—figure supplement 1
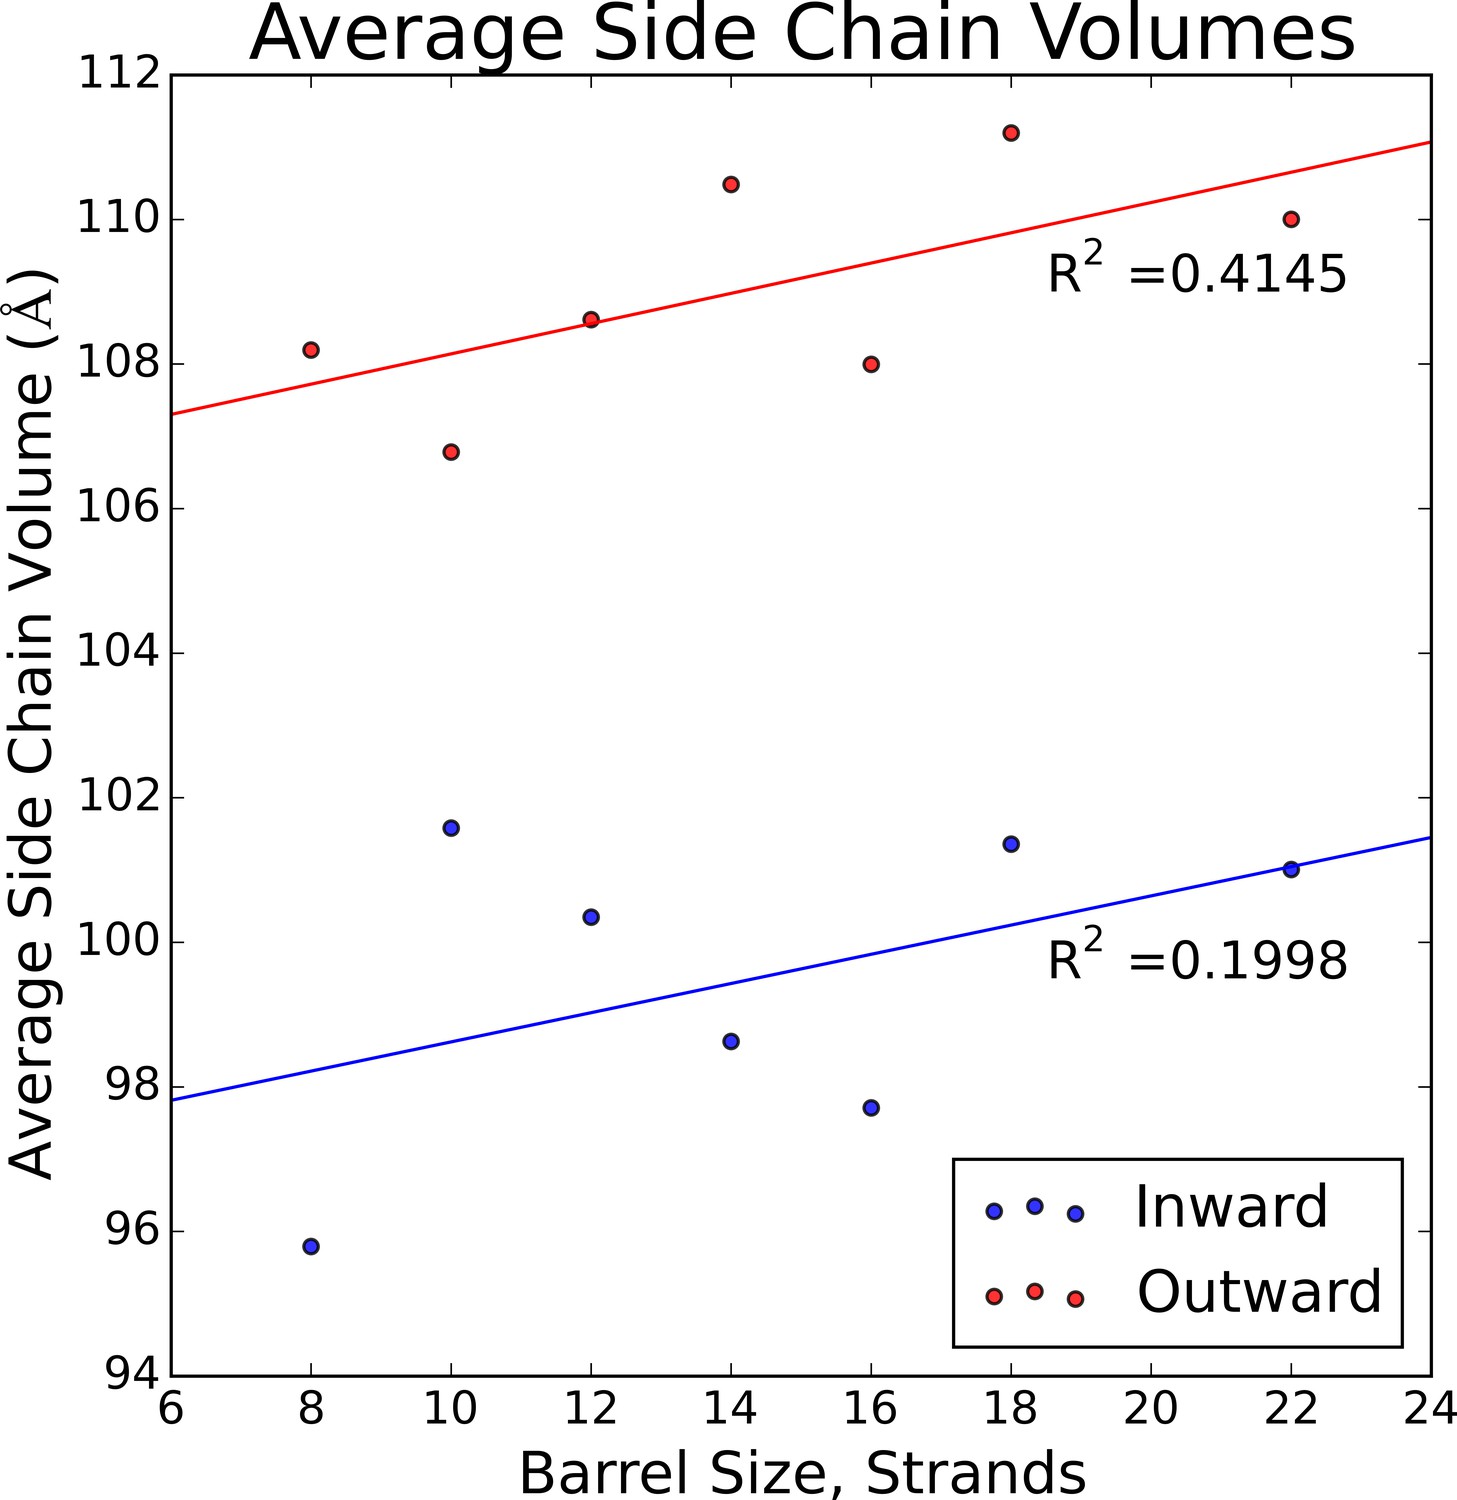
Average side chain volume by the size of the barrel in strands.
Inward-facing residues face towards the barrel pore, while the outward-facing residues face the membrane. R2 values for the line of best fit are shown.
Figure 3 with 1 supplement
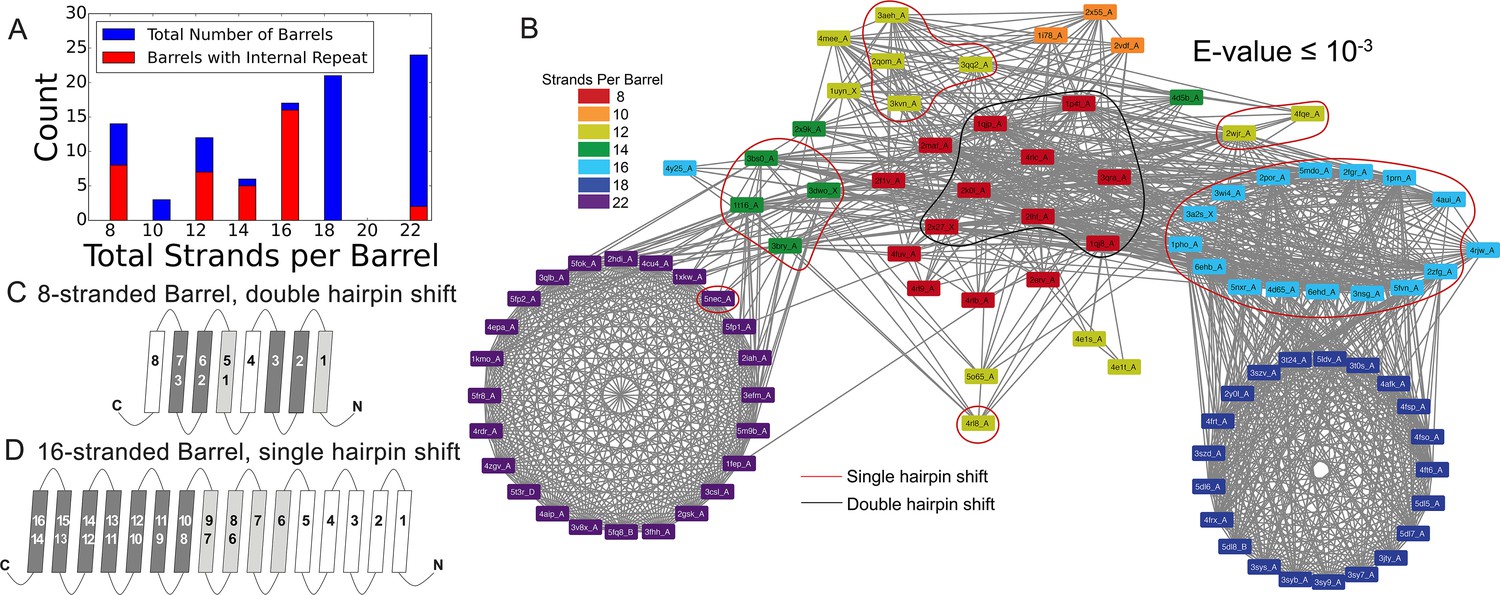
Internal repeats of the prototypical barrels.
(A) Distribution of all prototypical barrels with an internal repeat. The blue bars represent the total counts, while the red bars represent the counts with an internal repeat. (B) Internal repeats are identified for the barrels that are circled. Red circles indicate a single hairpin shift; black indicates a double hairpin shift (See text for definition). (C,D) Strands are shown going right to left, N to C, following the orientation in the membrane, with up indicating extracellular and down indicating intracellular. Dark grey strands indicate that all barrels of that size share those strands in the repeat; light grey strands indicate that only some of the barrels have those strands involved in the internal repeat. White strands indicate that these strands are never observed to participate in an internal repeat. The top row of numbers represents the strand number and the bottom row of numbers represents the strand numbers that align with the top numbers in the internal repeat. (C) 8-stranded barrels, (D) 16-stranded barrels. Figure 3—figure supplement 1 shows the breakdown of Figure 3A by type of repeat as well as the repeat patterns for 12- and 14-stranded barrels. Figure 3—source data 1 show all internal alignments.
-
Figure 3—source data 1
All internal repeat alignments.
Internal repeats for all 138 barrels with an E-value ≤10−3, complied from the output of HHalign. The last two columns list the strands involved, indexed from 0. When blank, no strands are involved in the repeat.
- https://doi.org/10.7554/eLife.40308.010
Figure 3—figure supplement 1

Additional details regarding internal repeats.
Strands are shown going right to left, N to C, following the orientation in the membrane, with up indicating extracellular and down indicating intracellular. Dark grey strands indicate that all barrels of that size share those strands in the repeat; light grey strands indicate that only some of the barrels have those strands involved in the internal repeat. White strands indicate that these strands are never observed to participate in an internal repeat. The top row of numbers represents the strand number and the bottom row of numbers represents the strand numbers that align with the top numbers in the internal repeat. (A) Distribution by barrel size of the types of internal repeats. Compare with Figure 3A. (B) Distribution of internal repeat type identified in the prototypical barrels. (C and D) Diagram of the internal repeat for the 12- and 14- stranded barrels.
Figure 4 with 1 supplement
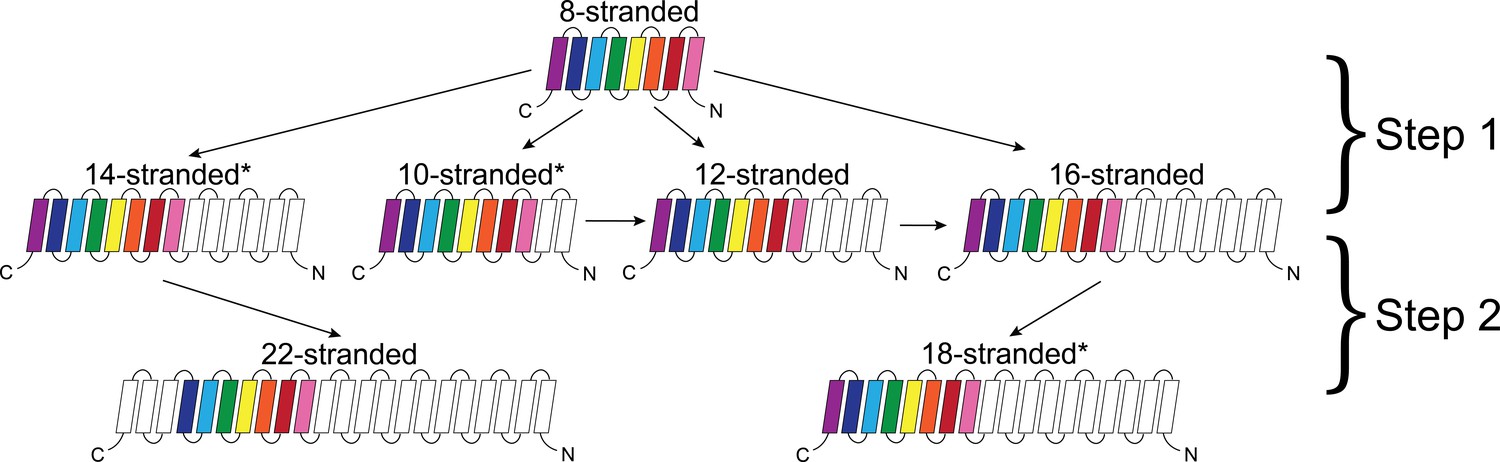
Dominant mode of persistence of the eight strands in strand diversification from 8 to 22 strands at an E-value ≤10−4.
8-stranded proteins are found to align to proteins with 10, 12, 14 and 16 strands. The strands that initially align from the 8-stranded barrels in the 16-stranded barrels can be aligned from 16-stranded barrels to 18-stranded barrels. Moreover, the strands that align between the 8- and 14-stranded barrels align between the 14- and 22-stranded barrels. However, 8-stranded barrels themselves do not directly align with the 18- or 22- stranded barrels. Arrows indicate alignment between proteins of different strand numbers. Pink strands align with pink strands, red strands align with red strands, etc. An asterisk indicates multiple patterns are observed as described in the text though only the most prevalent one is shown. White strands are strands that are not found to align to the original eight strands between barrels of different sizes, although they may be part of the alignment between proteins of different strand numbers. Examples of sequence alignments between barrels of different sizes and the lengths of the alignments are in supplement Figure 4—figure supplement 1, Figure 4—source data 1 respectively.
-
Figure 4—source data 1
Longest sequence alignments between barrels of different strand numbers.
Longest sequence alignments between barrels of different sizes at E-values ≤ 10–3. The colors - red, orange, yellow, green, cyan, blue, purple, plum - represent strand numbers 1,2,3,4,5,6,7,8 in that order. For example, in the second alignment, red is aligning to cyan signifying that strand one aligns with strand 5. If higher number strands align then the colors wrap around again so that red to plum represent 9–16, etc. In all alignments, the smaller barrel is the top sequence; the larger barrel is the bottom sequence.
- https://doi.org/10.7554/eLife.40308.012
Figure 4—figure supplement 1
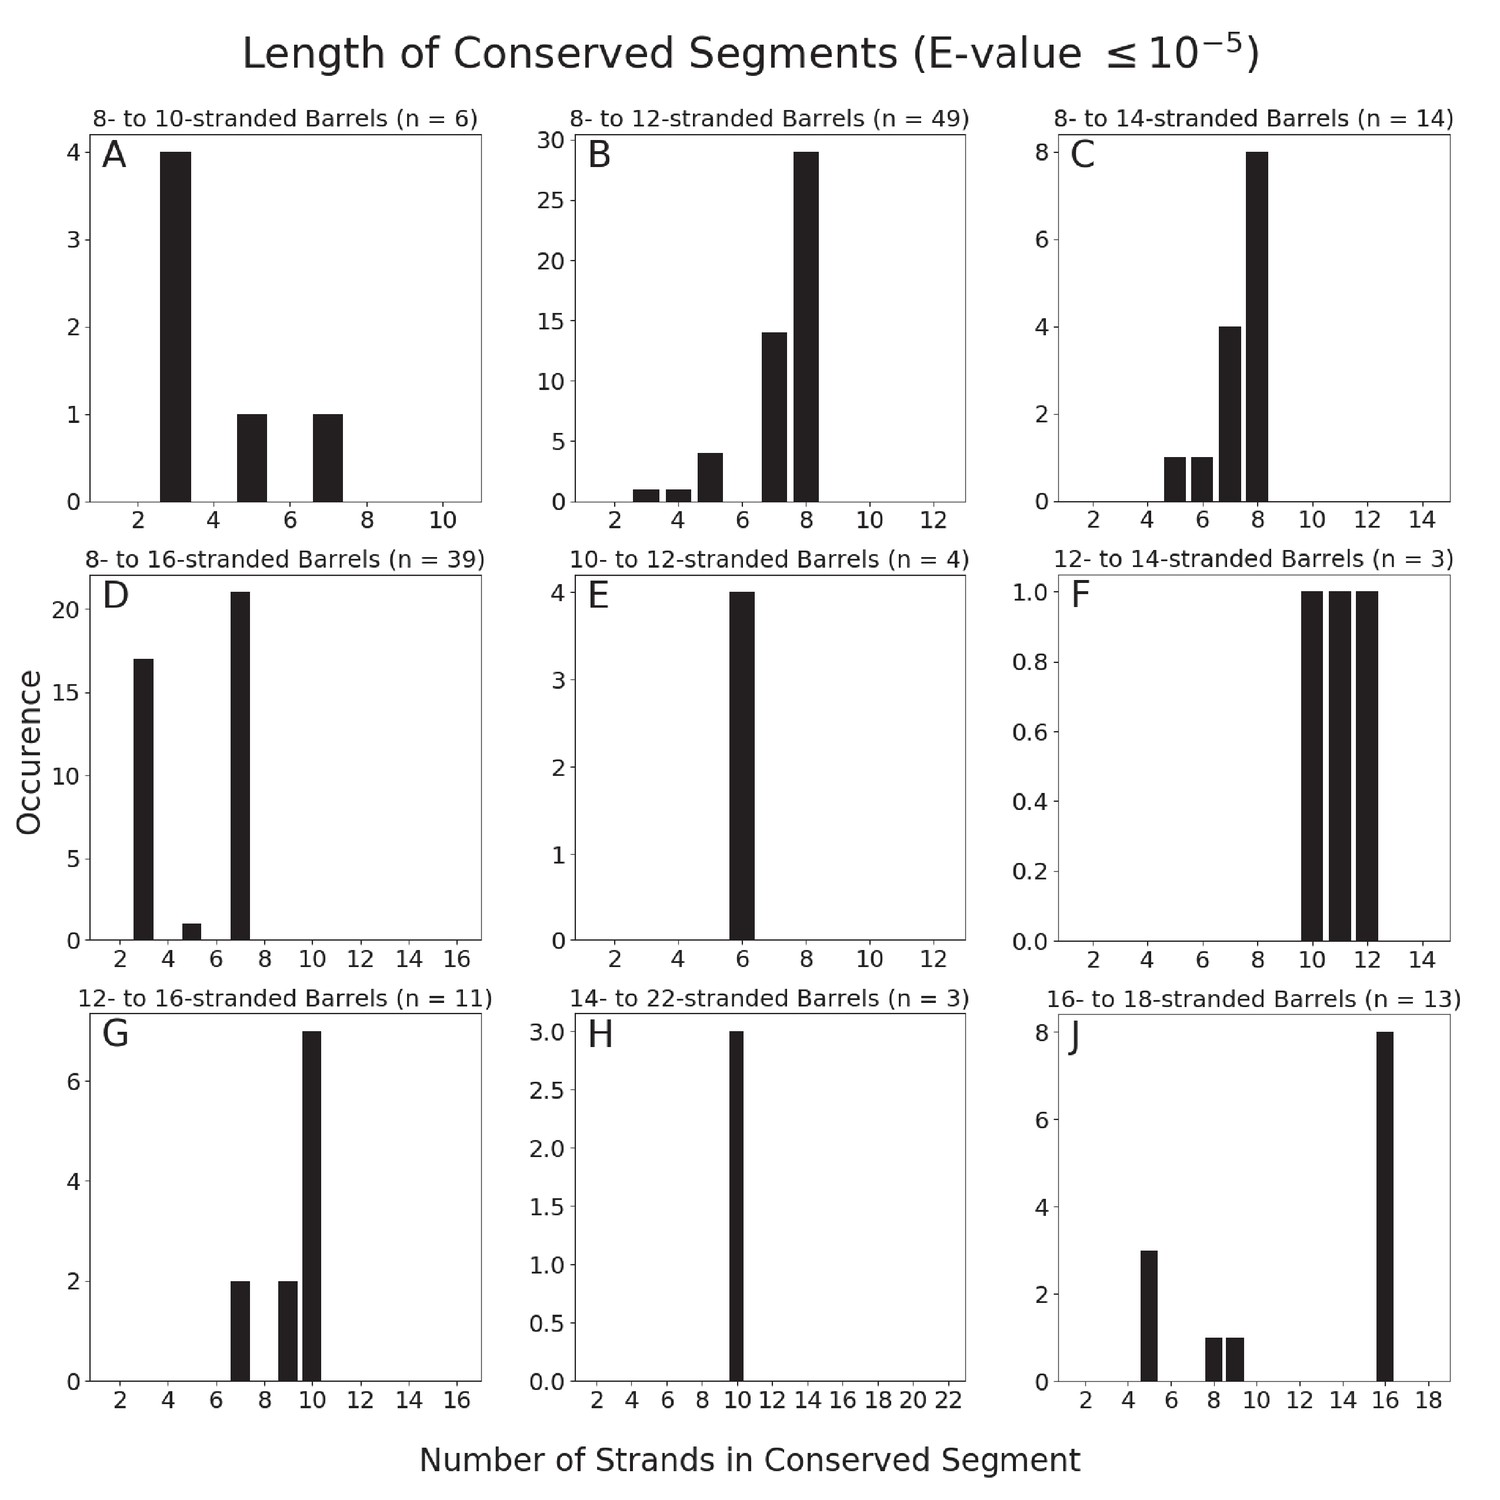
Number of strands involved in alignments.
Number of strands involved in the alignments between barrels of different sizes at an E-value ≤10–5 at 85% sequence identity. The number of strands of the smaller barrel is counted.
Figure 5 with 1 supplement
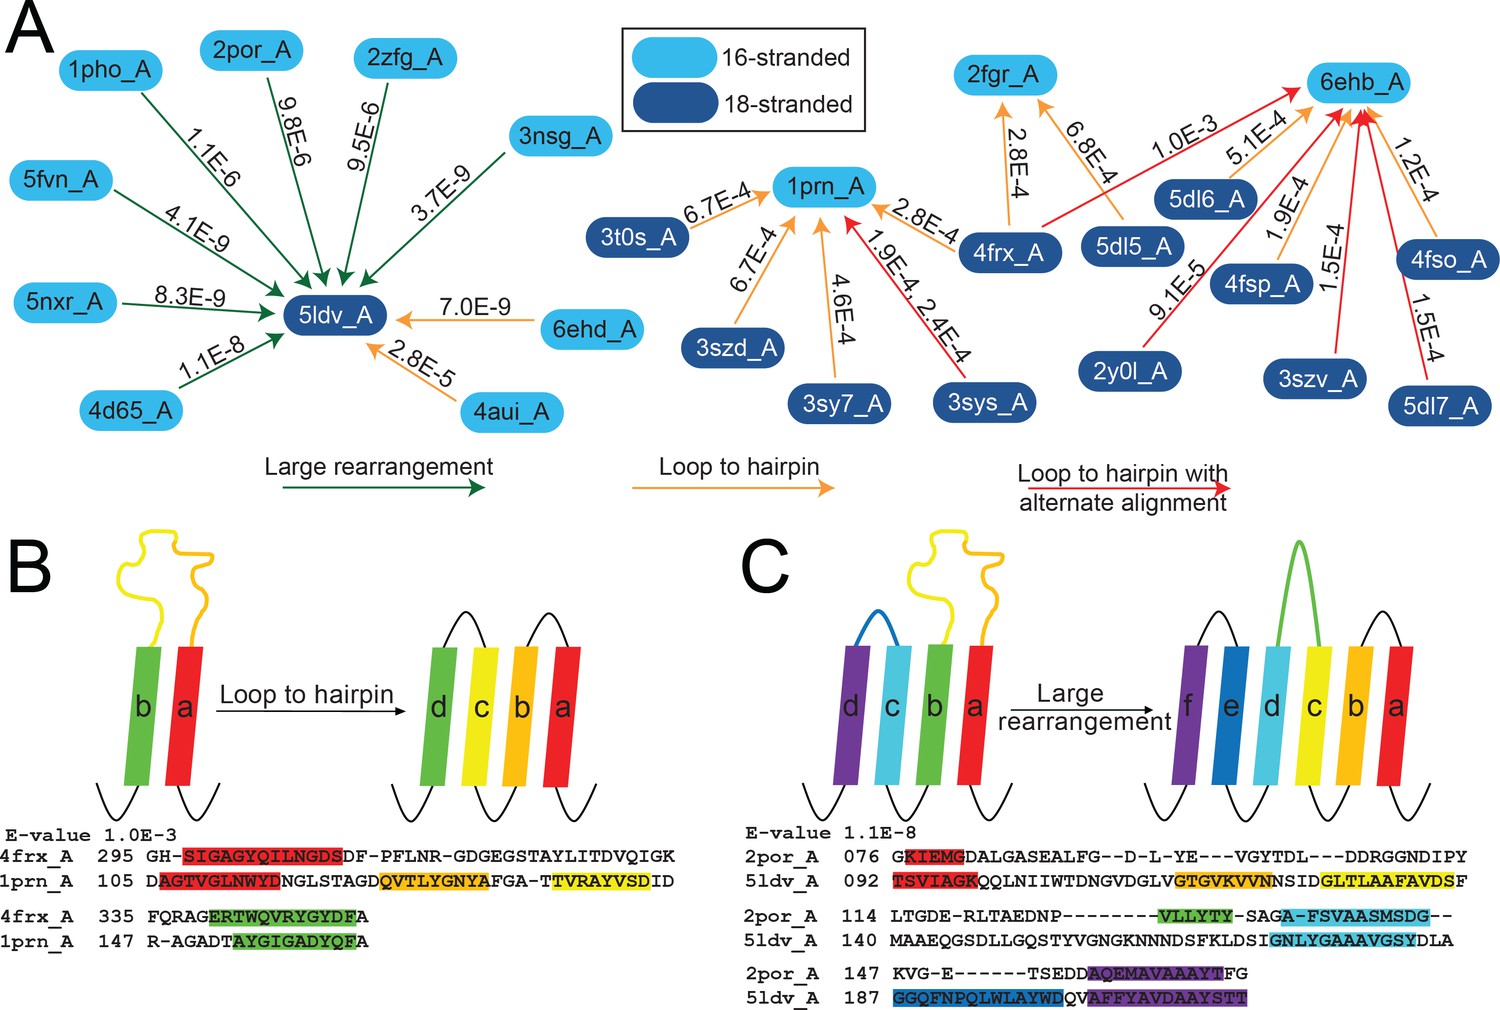
The unusual alignments of the 16- to 18-stranded barrels.
(A) The subnetwork of unusual alignments with E-values shown above the arrow. 16-stranded barrels are shown in cyan; 18-stranded barrels are shown in blue. Full alignments with E-values are shown in Figure 5—source data 1. In (B) and (C) loops are colored to reflect the strands that they were or have become. Strand boundaries are determined by a combination of ϕ and φ angles and hydrogen bonding patterns as described in the materials and methods section. A representative alignment is shown below each diagram. Only strands are colored in the alignments to match the colors in the diagrams. (B) Loop to hairpin. A large loop in the left barrel (yellow/orange) becomes two strands in the right barrel. (C) Large rearrangement. In this rearrangement, the loop between a and b in the 16-stranded barrel becomes two strands in the 18-stranded barrel and strand b of the 16-stranded barrel becomes a loop in the 18-stranded barrel while the loop between c and d becomes a strand. Some barrels have alternative structures in which some amino acids in the extracellular region of the barrel may be defined as loop where in other structures they are defined as strand or vice versa. Only one of the 1653 alignments in the 10–3 E-value network changes strand number alignment based on alternative structure. That alignment is shown in Figure 5—figure supplement 1 and does not change any data shown in Figure 5.
-
Figure 5—source data 1
Full alignments of Figure 5.
Full alignments for diagrams in Figure 5. Strands are colored - red, yellow, green, cyan, blue, lavender – to represent the strand numbers 1–6. In all alignments, the 16-stranded barrel is the top sequence and the 18-stranded barrel is the bottom sequence.
- https://doi.org/10.7554/eLife.40308.015
Figure 5—figure supplement 1
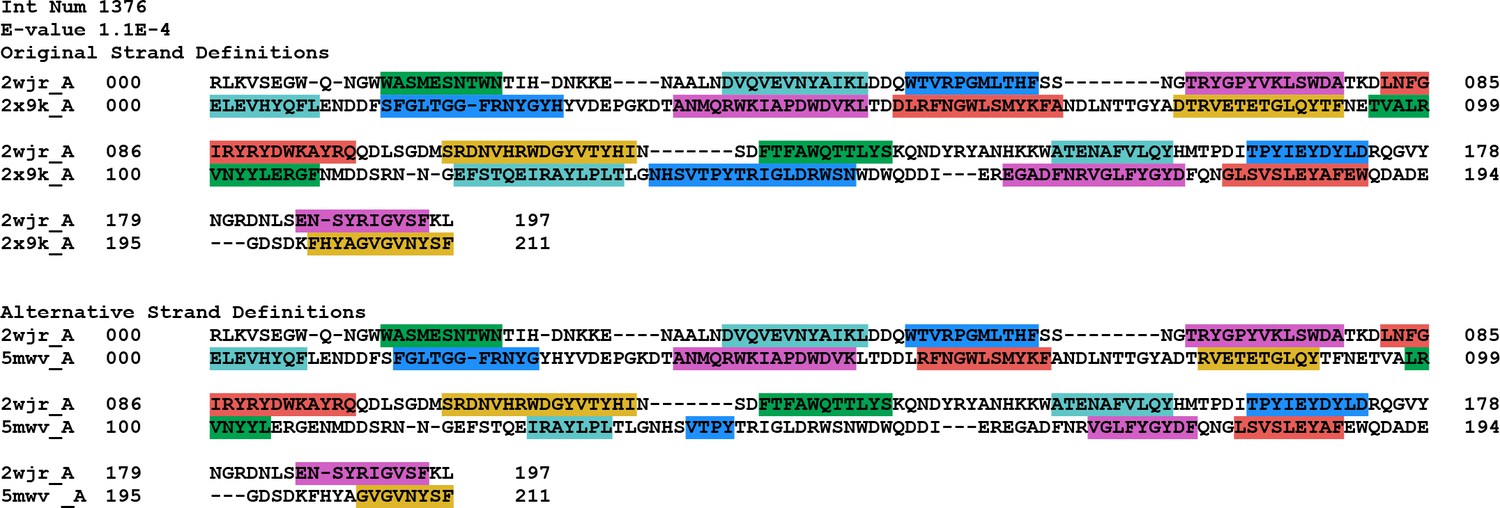
Changed alignment using alternative structures.
The only alignment with a different number of strands involved using the alternative structures, is the alignment between PDB IDs 2wjr and 2 × 9 k. While the number of strands are identical, in the alternative alignment using the strand definitions of PDB ID 5mwv, it is only aligned with gap residues and therefore the alignment is considered to be one strand shorter.
Figure 6 with 2 supplements
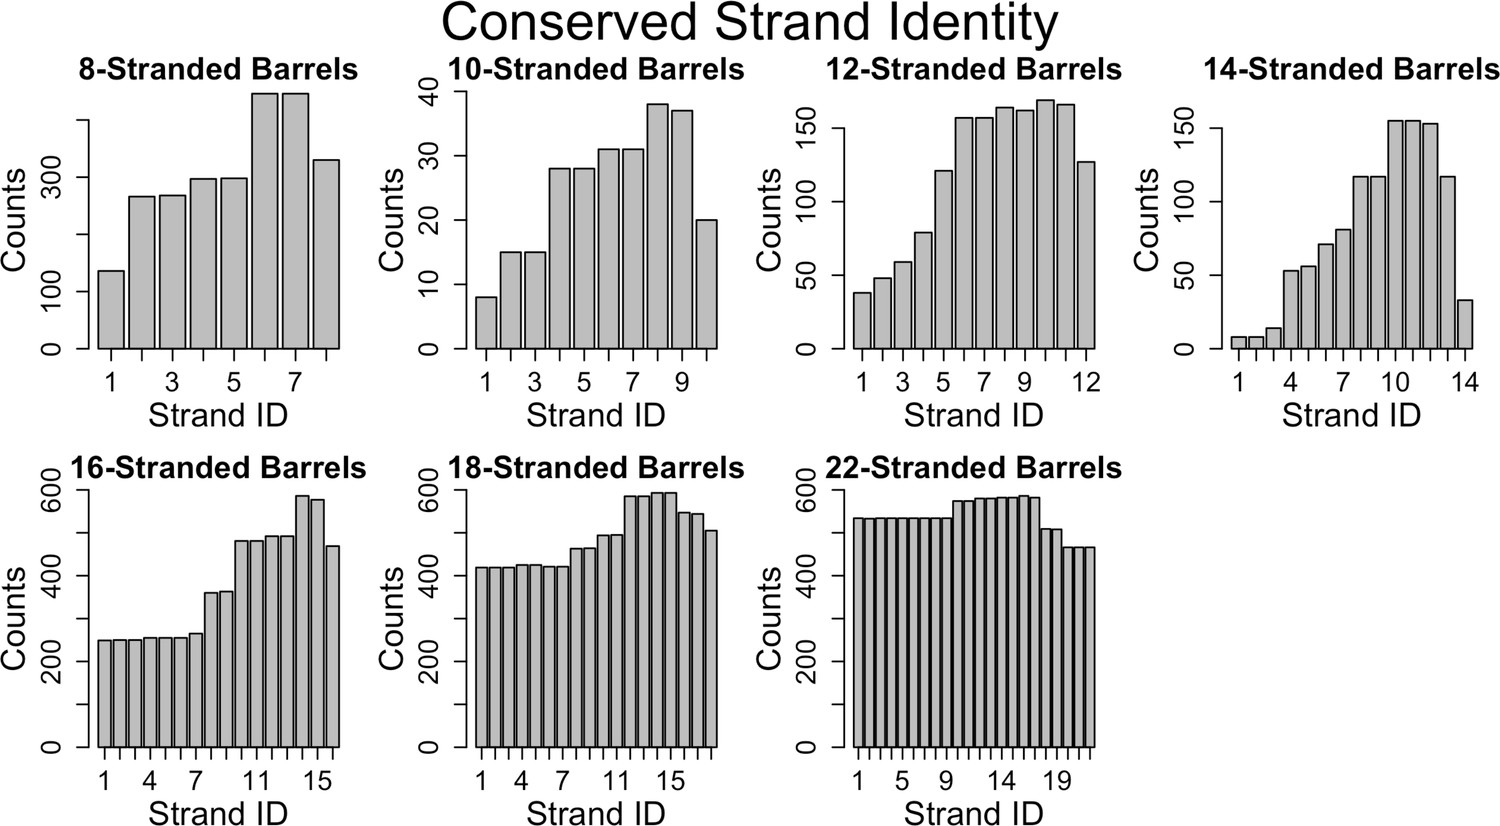
Conservation of strands in the prototypical barrels at <85% sequence identity.
For each alignment involving two prototypical barrels, we determined the identity of the strands in each barrel. Each graph represents the distribution of the strands reused in that barrel size. Figure 6—figure supplement 1 shows a similar trend at 25% sequence identity. The length distribution of these alignment (at 85% sequence) is shown in Figure 6—figure supplement 2.
Figure 6—figure supplement 1
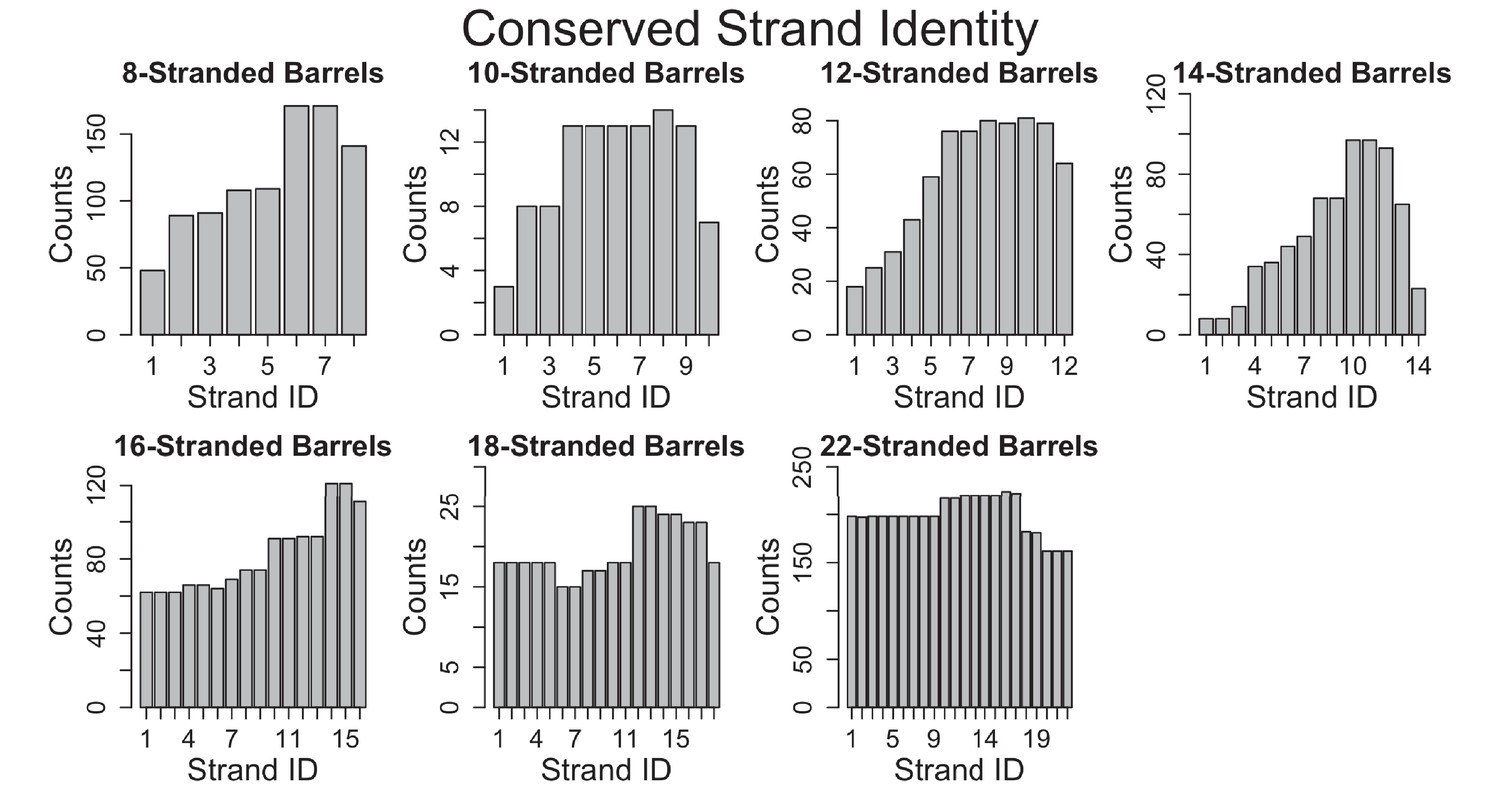
Identity of stands in alignments at 25% sequence identity.
Identity of strands involved in alignments at 25% sequence identity. For each alignment involving two prototypical barrels, we determined the identity of the strands in each barrel. Each graph represents the distribution of the strands reused in that barrel size.
Figure 6—figure supplement 2
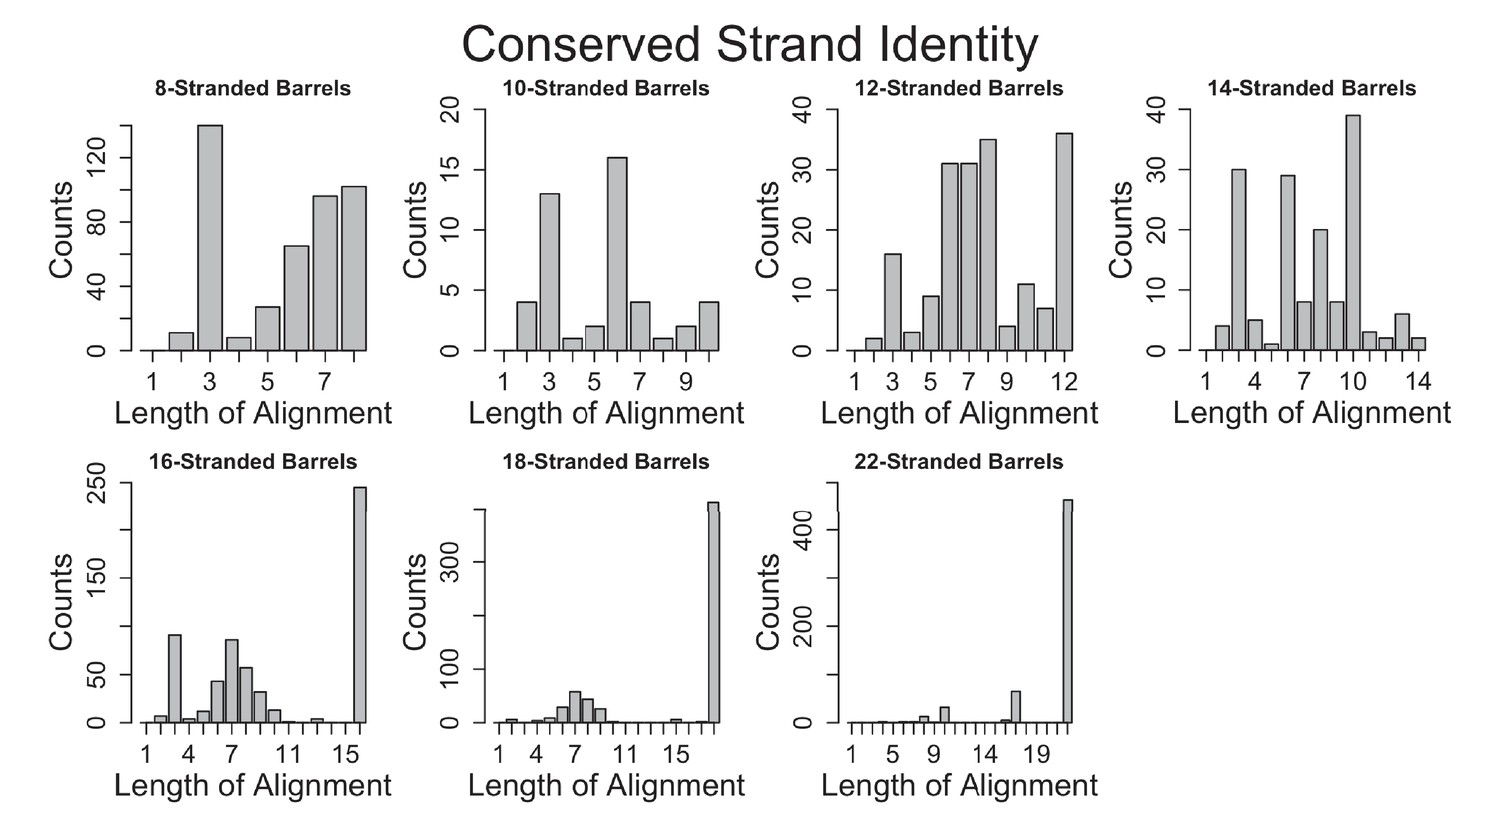
Number of strands in alignments.
Length of the strands involved in the alignments between barrels at 85% sequence identity and an E-value ≤10–3.
Figure 7

Possible mechanisms of OMBB folding.
The C-terminal half of beta barrels evince a strong evolutionary trace. The strong evolutionary trace may be indicative of nucleation. (A) Nucleation on side of barrel: Such nucleation could occur with the second half of the nascent barrel (red squiggly lines) forming beta hairpins in the membrane (boundaries shown with gray planes) along strands of the outer membrane translocation machinery, BamA with POTRA domains (solid blue barrel with five attached spheres). The rest of the nascent barrel would use the formed strands as a template. (B) Nucleation in incorporation of barrel: the strong evolutionary trace may also be indicative of beta strand incorporation, whereby the second half of the beta barrel is incorporated into BamA. In this model, the conserved strands form new strands in the BamA barrel while the N-terminal half of the protein inserts through the center of the barrel. Ultimately the nascent barrel buds off of the BamA, creating a new OMBB.
Videos
Video 1
Gif of the connection network showing the strength of the relationship between outer membrane barrels with different strand numbers.
Gif toggles from E-value ≤10−3 to E-value ≤10−12.
Additional files
-
Supplementary file 1
PDB list.
List of PDBs in the prototypical group. The format is PDB_chainID.
- https://doi.org/10.7554/eLife.40308.021
-
Transparent reporting form
- https://doi.org/10.7554/eLife.40308.023
Download links
A two-part list of links to download the article, or parts of the article, in various formats.
Downloads (link to download the article as PDF)
Open citations (links to open the citations from this article in various online reference manager services)
Cite this article (links to download the citations from this article in formats compatible with various reference manager tools)
Evolutionary pathways of repeat protein topology in bacterial outer membrane proteins
eLife 7:e40308.
https://doi.org/10.7554/eLife.40308


