Single-cell lineage tracing by endogenous mutations enriched in transposase accessible mitochondrial DNA
- Center for Personal Dynamic Regulomes, United States
- Stanford University School of Medicine, United States
- Howard Hughes Medical Institute, Stanford University, United States
Figures
Figure 1 with 5 supplements
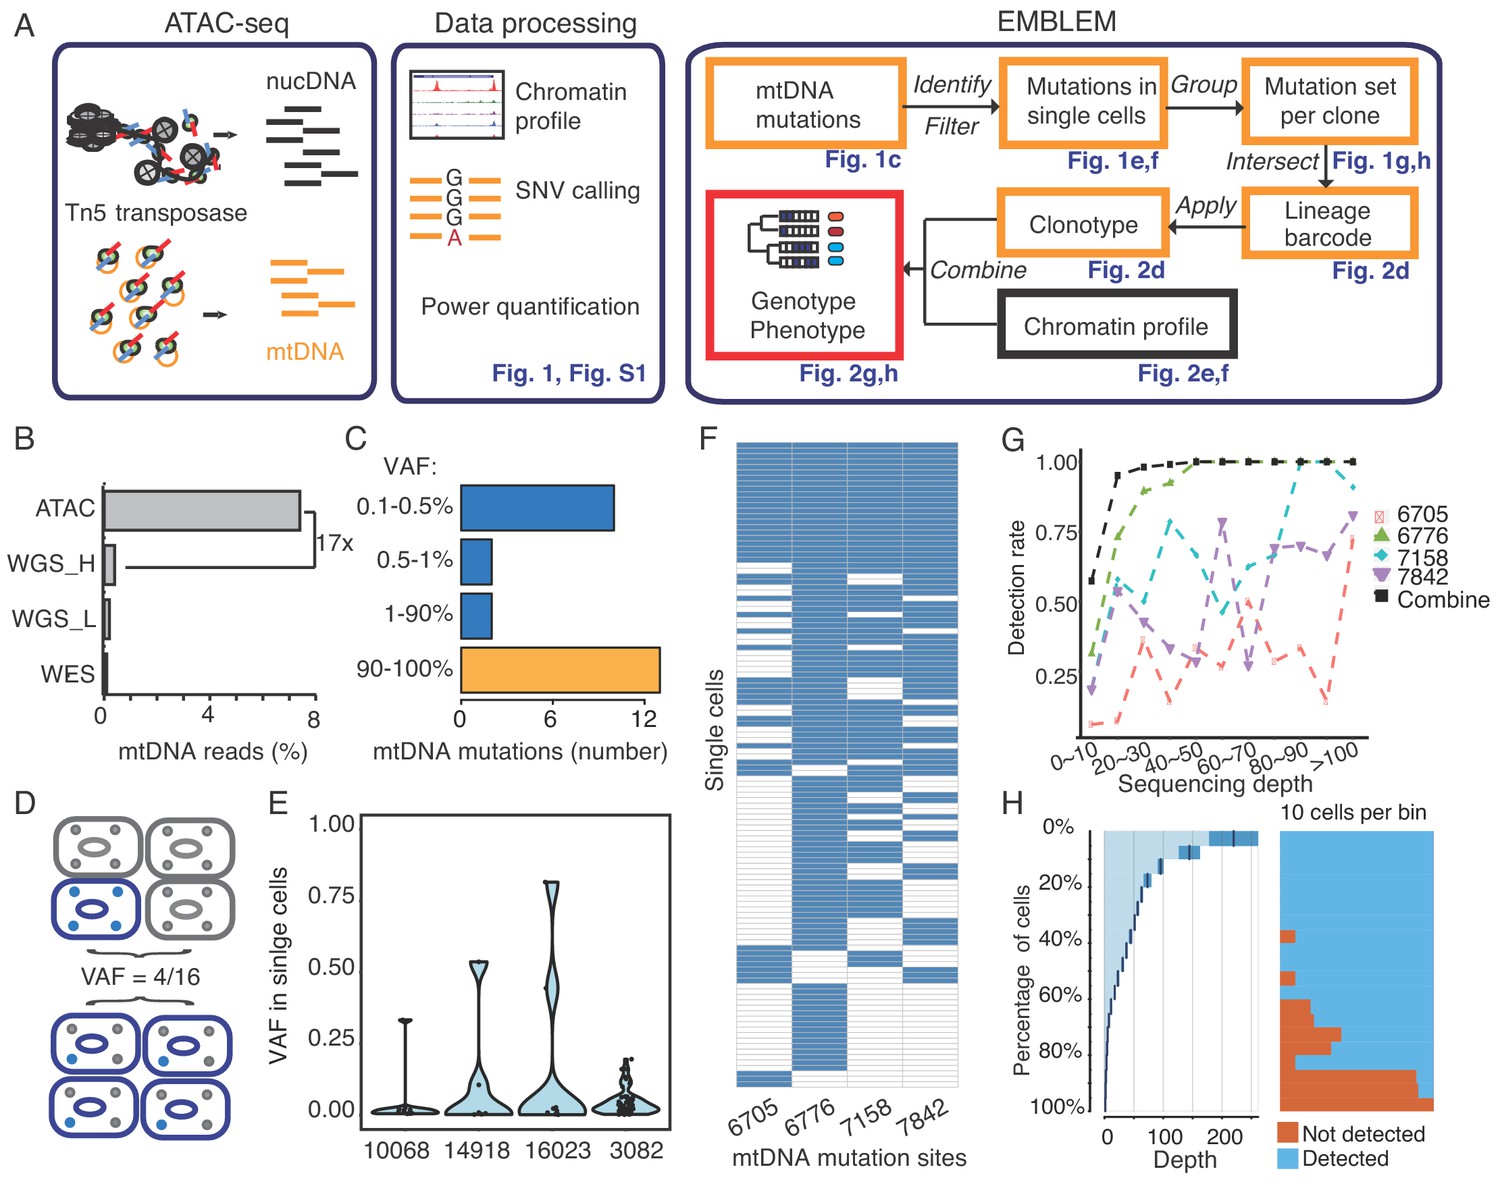
EMBLEM reveals cell lineage from mtDNA mutations.
(A) EMBLEM workflow. Usings standard ATAC-seq data as input (left), an SNV calling step was added to enumerate all single nucleotide variants in mtDNA (middle). EMBLEM identifies heteroplasmic mtDNA mutations in single cells, groups mutations into diagnostic sets, and infers cell lineage based on mtDNA variants, and overlays clonotype information on epigenomic profile of the same cells (right). (B) ATAC-seq enriches for mtDNA reads compared to whole exome sequencing (WES), low coverage whole genome sequence (WGS_L), or PCR-free, high-coverage whole genome sequence (WGS_H). (C) Bimodal distribution of variant allele frequency (VAF) of mtDNA mutations discovered using ATAC-seq. Yellow bar presents the homoplastic variants that can distinguish different individuals. Heteroplasmic variants can distinguish clonal cell populations within one individual. (D) Two possible models for 25% mtDNA VAF in bulk: Homoplastic variants in a small proportion of cells (top) or heteroplasmic variants in nearly every single cell (bottom). Blue cells: cells with mutated mtDNA, blue dots: mtDNA with mutated allele. (E) VAF of mtDNA mutations in single cell ATAC-seq data of human B cells. Each dot presents the VAF (y-axis) in single cells, and rotated kernel density on each side presents their distribution. The x-axis indicates the mutation site (the nucleotide position in mitochondrial genome). (F) mtDNA mutations in human AML. Each row in the heap map is a single cell (LSC or AML blast); each column is a heteroplasmic mtDNA mutation. Blue color indicates the mtDNA variant is detected (>1 reads); white color indicates no mutation. The nucleotide position in mitochondrial genome for each mutation is indicated. (G) Combined set of heteroplasmic mtDNA mutations improve cell lineage assignment in single cells. Cells were first separated into bins according to their mtDNA coverage (x-axis). The detection rate (y-axis) for each site (indicated by different color and shape) is calculated with the number of cells with that mutations divided by total number of cells in that bin. The detection rate of combining four sites (black line, METHOD) is substantially increased. (H) Quantitation of mtDNA mutation detection rate as a function of sequencing depth and number of single cells. Cells were sorted in descending order by their sequencing depth and grouped into bins (10% of cells in each row). Distribution of sequencing depth is shown on the left panel. The black line and dark blue shade indicate mean ± standard deviation, respectively. The light blue shade indicates remaining value of the bin. Cells with or without mtDNA variants are shown in blue and orange on the right panel, respectively.
Figure 1—figure supplement 1
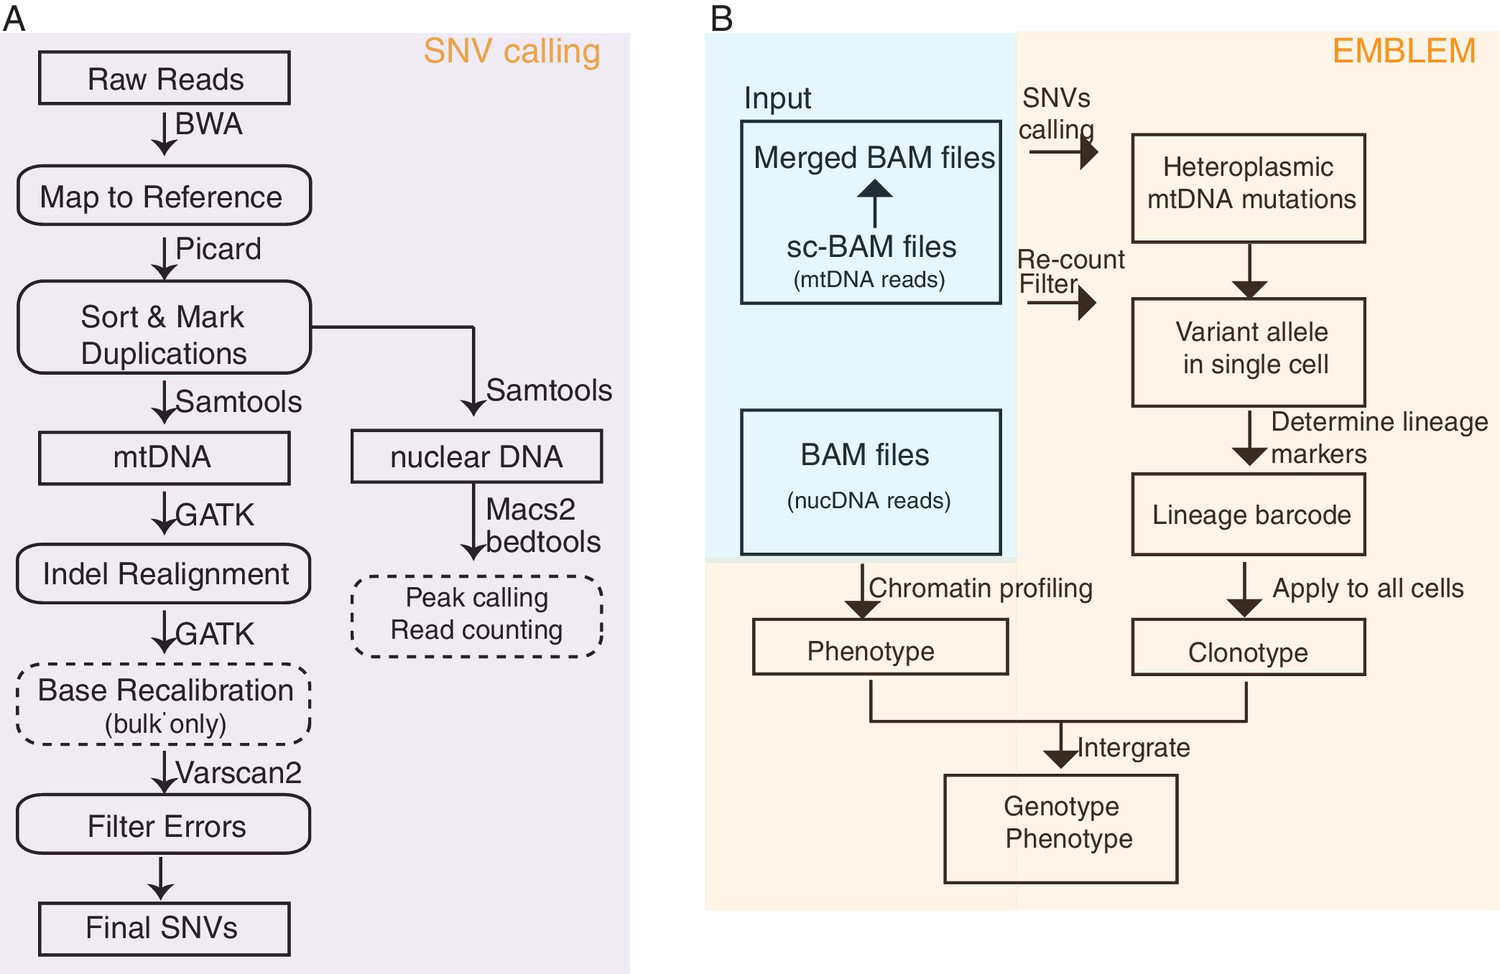
EMBLEM workflow for SNP calling and lineage inference.
(A) Workflow for mitochondrial DNA variant calling from ATAC-seq data. This workflow was applied to both bulk and single cell ATAC-seq. The steps indicated with dotted lines were not applied to single-cell data. (B) Workflow for inferring lineage relationships from single-cell ATAC-seq data. BAM files from single cells were first merged and confident mtDNA variants were called. Mutated alleles from these variant sites were then counted for each single cell. The cell lineage was then inferred from mtDNA variants and analyzed alongside the chromatin profile for each cell.
Figure 1—figure supplement 2
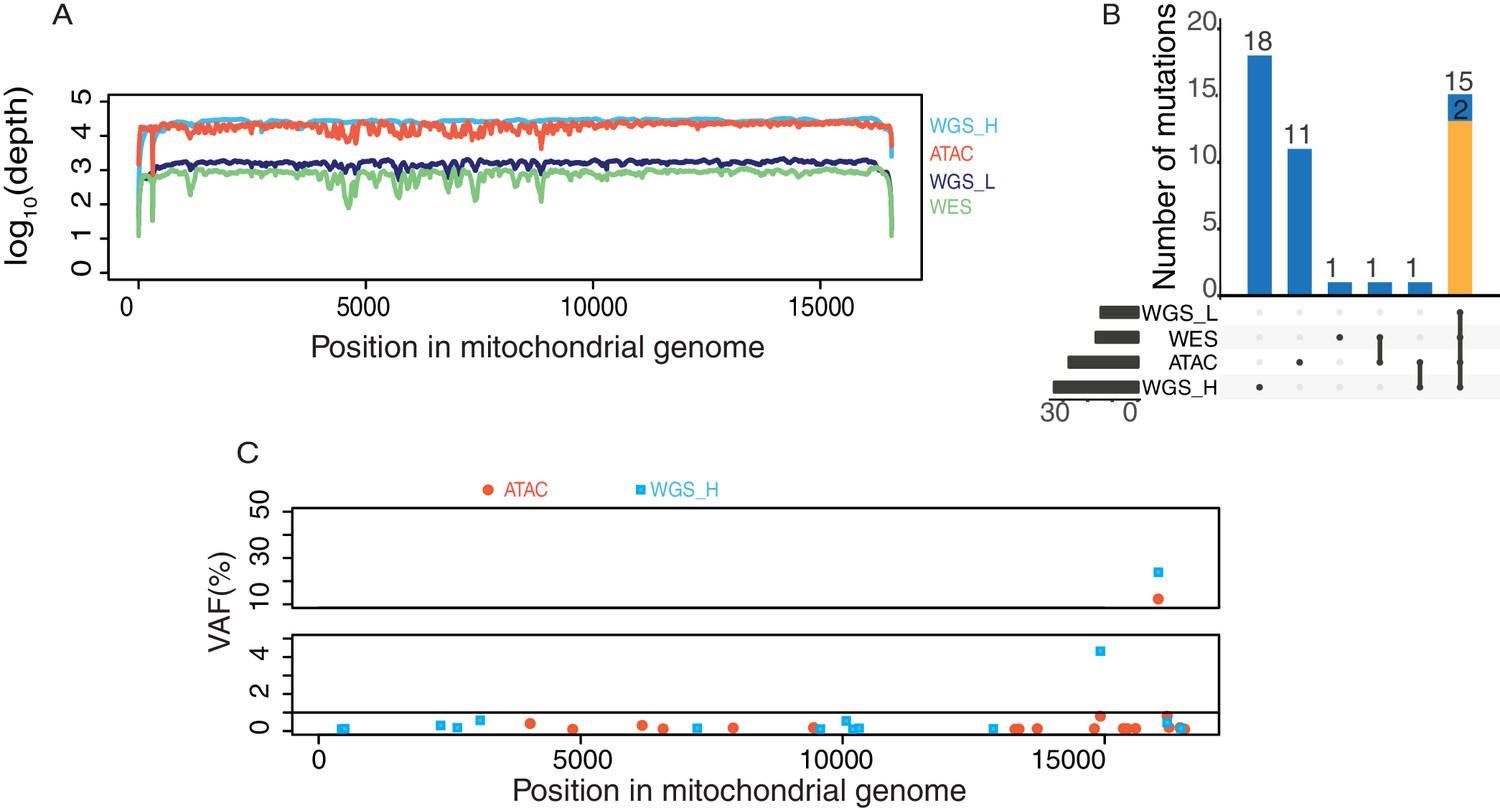
mtDNA coverage and variants from different sequencing libraries from GM12878 human B cells.
(A) Mitochondrial genome coverage from each of four different sequencing libraries including WGS_H (high coverage PCR-free whole genome sequencing), WGS_L (low coverage whole genome sequencing), WES(whole exome sequencing), ATAC-seq. The Y axis shows coverage scaled in log10. 43M paired-end ATAC-seq reads (2 × 50 bp) yielded the same coverage of mtDNA as 747M paired-end reads (2 × 250 bp) from WGS-H data. (B) Comparison of variants detected in sequencing data from four different library preparations. The number of variants detected in each library is shown on the bottom left. The intersection of different libraries (bottom-right) and the number of variants are shown on the top. Homoplasmic variants are in yellow and heteroplasmic variants are in blue. (C) Heteroplasmic mtDNA mutations detected by WGS_H (in blue) and ATAC-seq (in red). The X axis is the position of the mutation on mitochondrial genome and Y axis is the variant allele frequency in percentage.
Figure 1—figure supplement 3
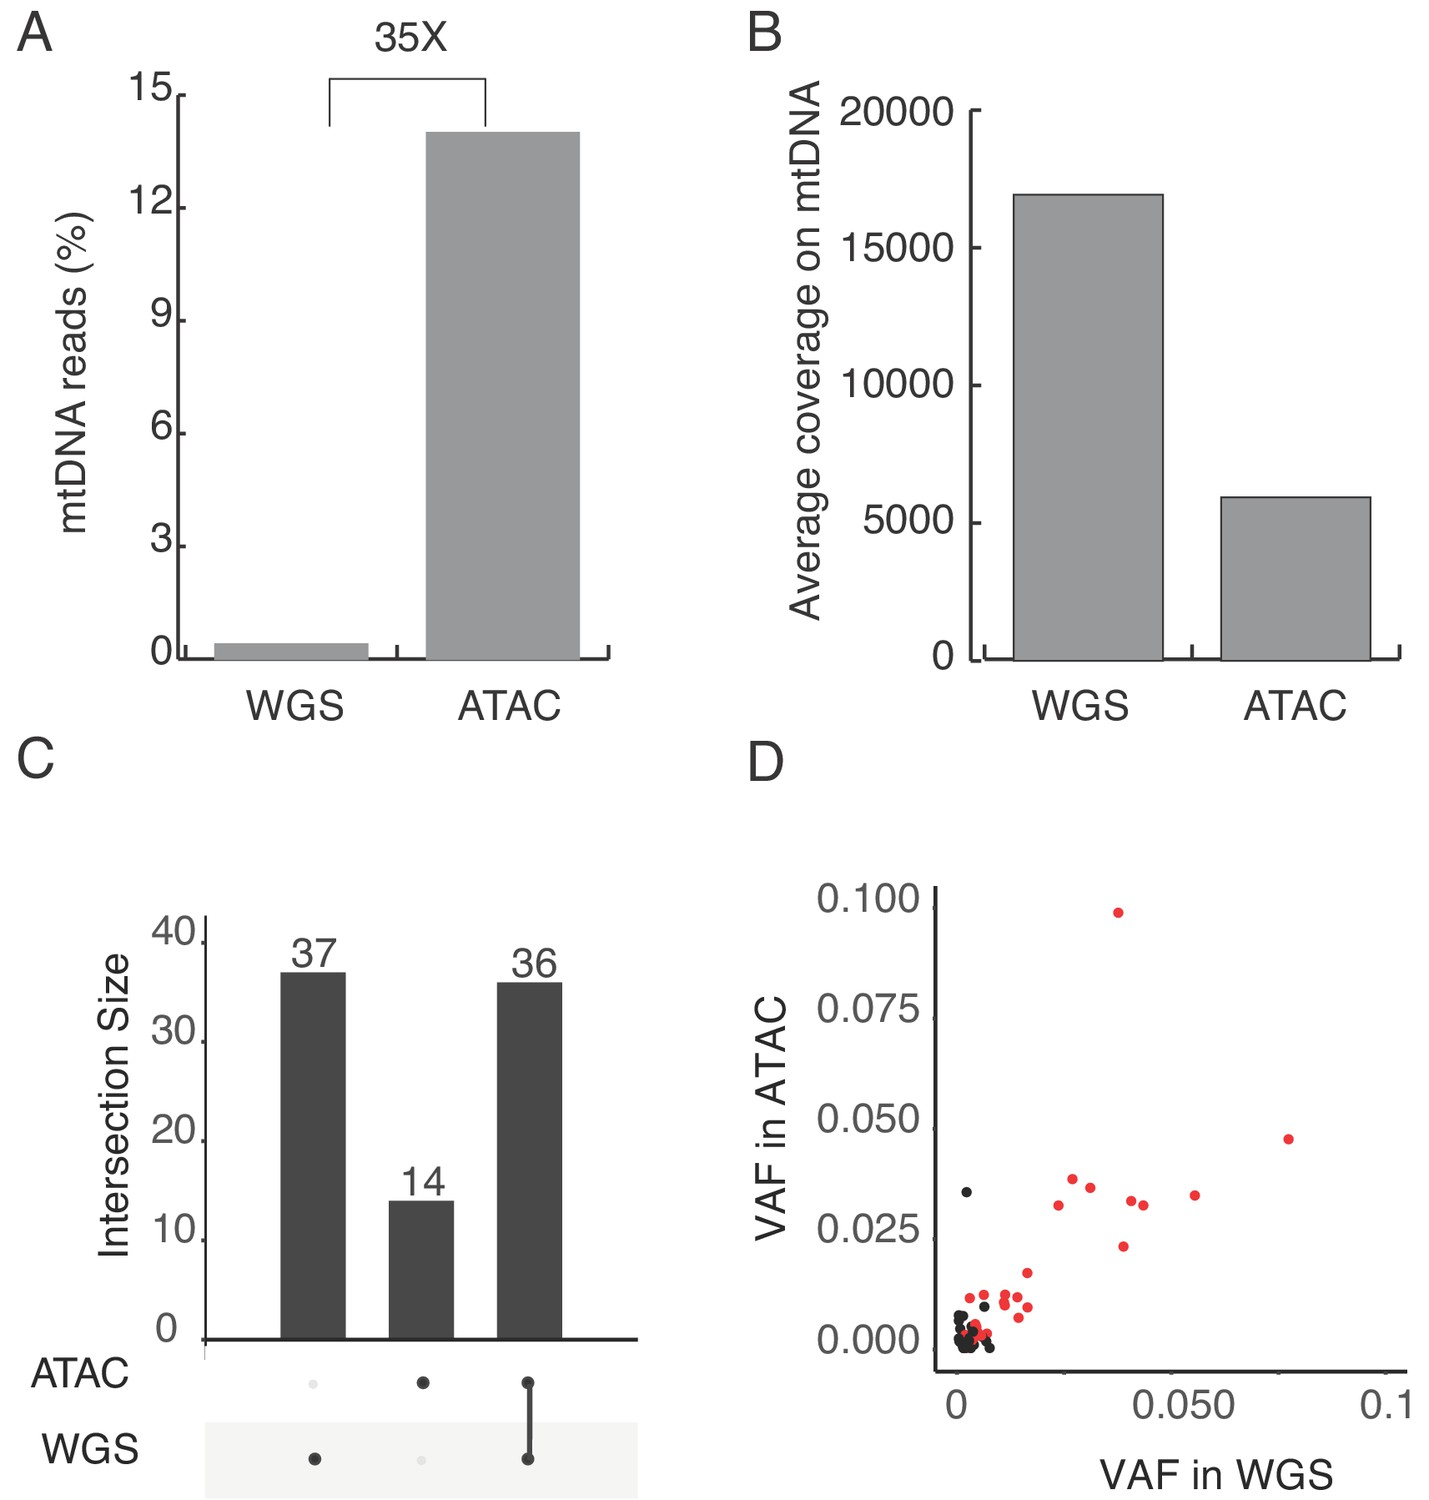
Heteroplasmic mtDNA mutation in K562 cells.
(A) Percentage of mtDNA reads in ATAC-seq and whole genome sequence(WGS) libraries from human K562 cells. Four millions mtDNA reads from 32 millions total mapped reads in ATAC, seven millions mtDNA reads from 1775 millions total reads in WGS. (B) The average coverage of the mitochondrial genome in ATAC and WGS from K562 cells. (C) Number of heterplasmic mtDNA mutations detected in ATAC and WGS. The intersection size represents mutations detected by single or both methods. (D) Variant allele frequency of mtDNA mutations and their correlation between ATAC and WGS. The red dots indicate the mutations detected by both ATAC and WGS, with the same criteria. The black dots indicate the mutations detected by ATAC or WGS only.
Figure 1—figure supplement 4

Heteroplasmic variants in single cells from AML blasts and LSCs (SU353).
(A) Heatmap showing variant mitochrondrial sites (columns) in each AML blast from patient SU353(rows). The color represents the number of reads supporting the variant allele (log2(depth)). The first two sites are negative controls, which are detected in pHSCs only. (B) Bar plot showing the number of cells in which we detect each mitochondrial variant. The last bar shows the number of cells with any one of the four variants detected. (C) The top right shows the number of cells with each different combination of variants detected. The number of cells is shown on top of the bar. The combination of variants detected is annotated below the bar. The total number of cells with each variant site detected is shown to the left. The average coverage of the mitochondrial genome for each intersection group is shown below. (D) VAF of mtDNA variants. The x-axis indicates the variant site notated by the nucleotide position in the mitochondrial genome. Each dot represents the VAF (y-axis) in single cells and the rotated kernel density on each side shows their distribution. (E–H) Same as (A–D), for leukemia stem cells (LSCs) from patient SU353.
Figure 1—figure supplement 5
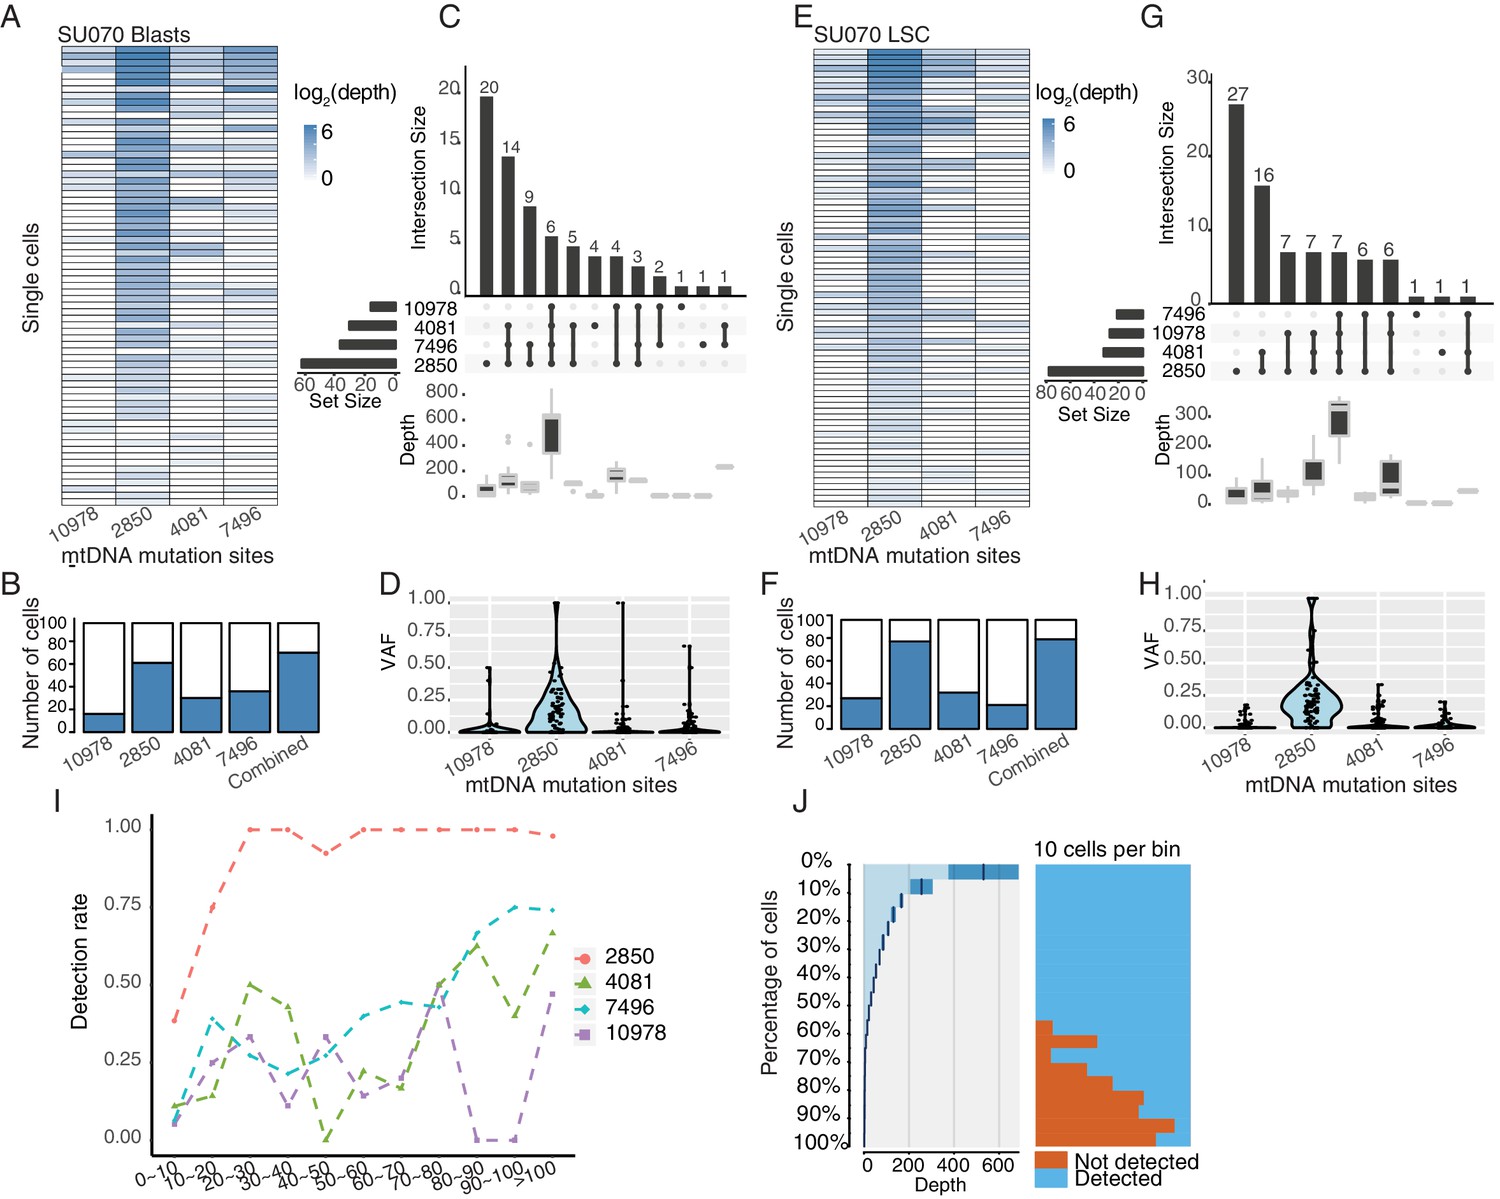
Heteroplasmic variants in single cells from AML blasts and LSCs (SU070).
(A–D) Same as Figure 1—figure supplement 3A–D for AML blasts from SU070. (E–H) Same as Figure 1—figure supplement 3A–D for LSCs from SU070. (I) Quantification of the detection rate for each heteroplasmic variant from mtDNA. Cells (both LSCs and AML blasts) were first separated into bins according to their coverage of mtDNA (x-axis). The detection rate (y-axis) for each site (notated by different color and shape) is calculated as the number of cells with that variant detected divided by the total number of cells in that bin. (J) Quantitation of mtDNA mutation detection rate as a function of sequencing depth and the number of single cells. Cells were sorted in descending order by their sequencing depth and grouped into bins (10% cells in each row). Distribution of sequencing depth is shown on the left panel. Cells with or without mtDNA mutations are shown in blue or orange, respectively.
Figure 2 with 4 supplements
Clonal evolution of pre-leukemic HSCs inferred from joint lineage tracing and single cell chromatin accessibility.
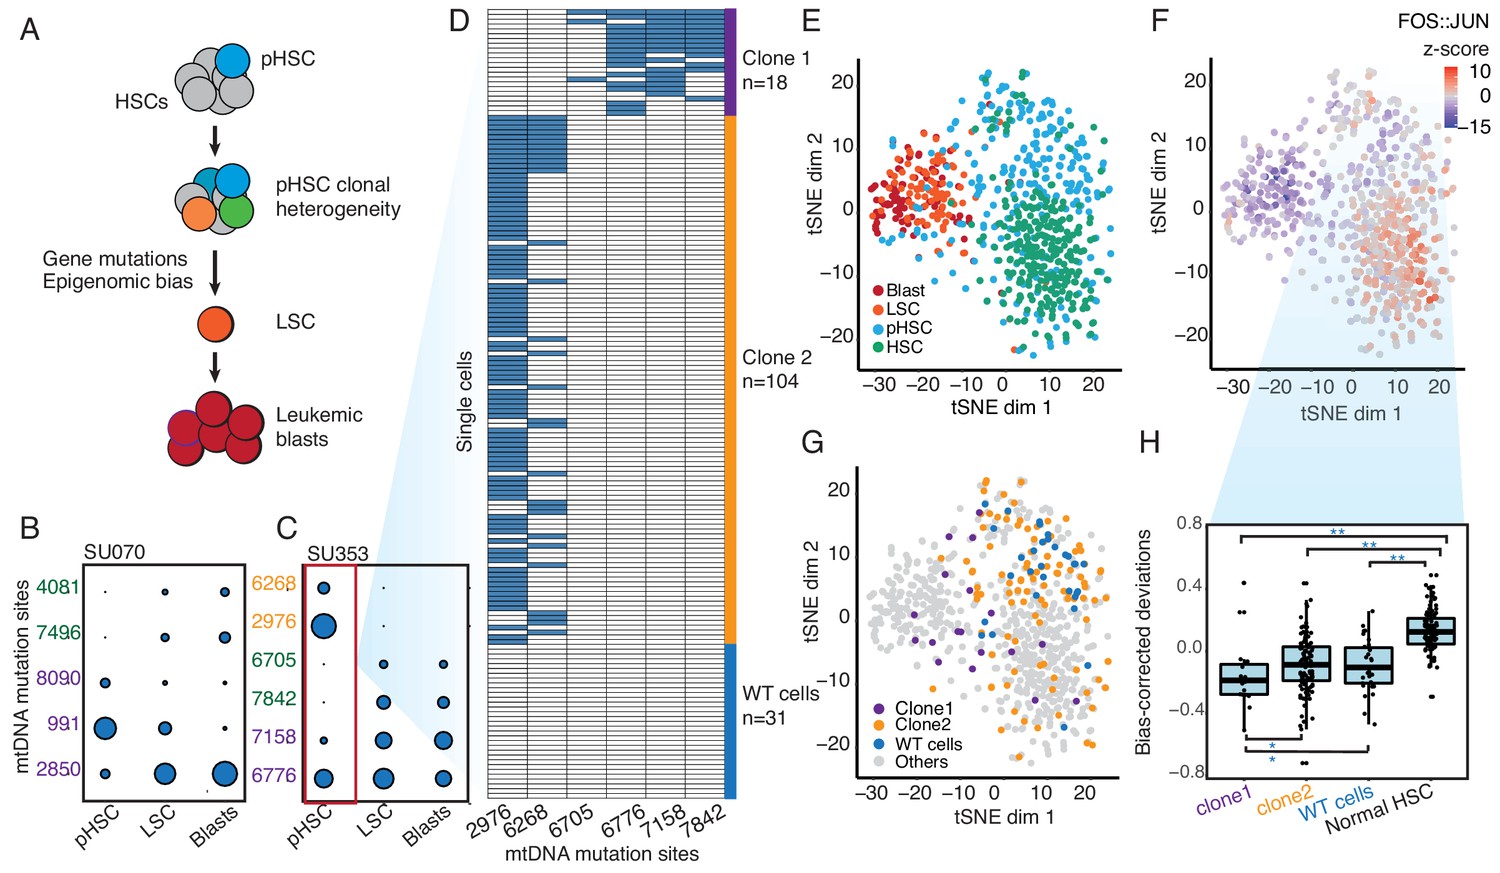
(A) Lineage hierarchy in acute myeloid leukemia based on EMBLEM and prior genetic information. mtDNA mutations reveals pHSC clonal heterogeneity. The clonal precursor of the leukemic stem cell is not the clone with most representation in the pHSC pool, but rather the clone with epigenomic bias towards the leukemic regulatory program, as depicted by related color schemes. (B) EMBLEM deconvolutes AML clonal heterogeneity. Heteroplasmic mtDNA mutations in three cell populations from patients SU070 are shown. Mutations sites (in rows) in each FACS-sorted cell population (in columns) are shown, with size of each circle representing its VAF. Several mtDNA mutations (sites shown in purple) are detected in pHSCs and transmitted to LSCs and blasts, confirming those pHSC clones at the apex of leukemia lineage. LSCs accumulated additional mtDNA mutations (sites shown in green) and are transmitted to leukemic blasts in patient SU070. Allele frequency, sequencing depth and annotation of the variant allele are shown in Figure 2—figure supplement 1 and Supplementary file 2. (C) Same plot as (B) shown for patient SU353. In addition to the shared mtDNA mutations in pHSCs, LSCs, and blasts (purple), two pHSCs-specific mtDNA mutations are also detected (yellow). Allele frequency, sequencing depth and annotation of the variant allele are shown in Figure 2—figure supplement 1 and Supplementary file 2. (D) Heteroplasmic mutations in single pHSCs from one patient reveal clonal heterogeneity. Each column is a mtDNA nucleotide position; each row is one cell. Blue color indicates the presence of the mtDNA variant. Shown are cells with any mtDNA mutation detected, or cells with more than 40X coverage of the mitochondrial genome without any detected mutation(pHSC with WT mtDNA). The number of cells in each clonotype are indicated on the right. (E) Landscape of single-cell chromatin accessibility of blood progenitor and leukemic cells in patient SU353. tSNE map using bias-corrected deviations from chromatin accessibility showing cluster of AML blasts, LSCs, pHSCs and normal HSC, colored by cell types. (F) Chromatin accessibility of the FOS:JUN binding motif across the same single cells. tSNE map colored by deviation z-score for motif associated to FOS:JUN, the most variable TF motif. (G) pHSC clones possess distinct epigenomic signatures. Clone 1 that gives rise to the AML has a chromatin accessibility profile that more resembles LSCs and leukemic blasts. ‘WT’ pHSC refers to the pHSC with WT mtDNA. Clonotype information from EMBLEM is overlaid on the tSNE map defined by TF motif deviations, and colored by different lineal sub-populations defined by mtDNA mutations. (H) Quantitation of distinct single-cell chromatin accessibility at FOS:JUN motifs among different pHSC clones defined by EMBLE. Clone 1 pHSCs tend to down regulate FOS:JUN accessibility, while clone 2 pHSC shows substantially greater cell-to-cell variability. pHSCs with no detectable mtDNA variants and normal HSCs are shown for comparison. TF deviation of single cells (black dots) is shown on the distribution box-plot. The statistical significant were indicated by ‘*” when p<0.05, ‘**” when p<0.01(Wilcoxon rank-sum test).
Figure 2—figure supplement 1
Heteroplasmic mtDNA mutations detected in bulk ATAC-seq from AML patients.
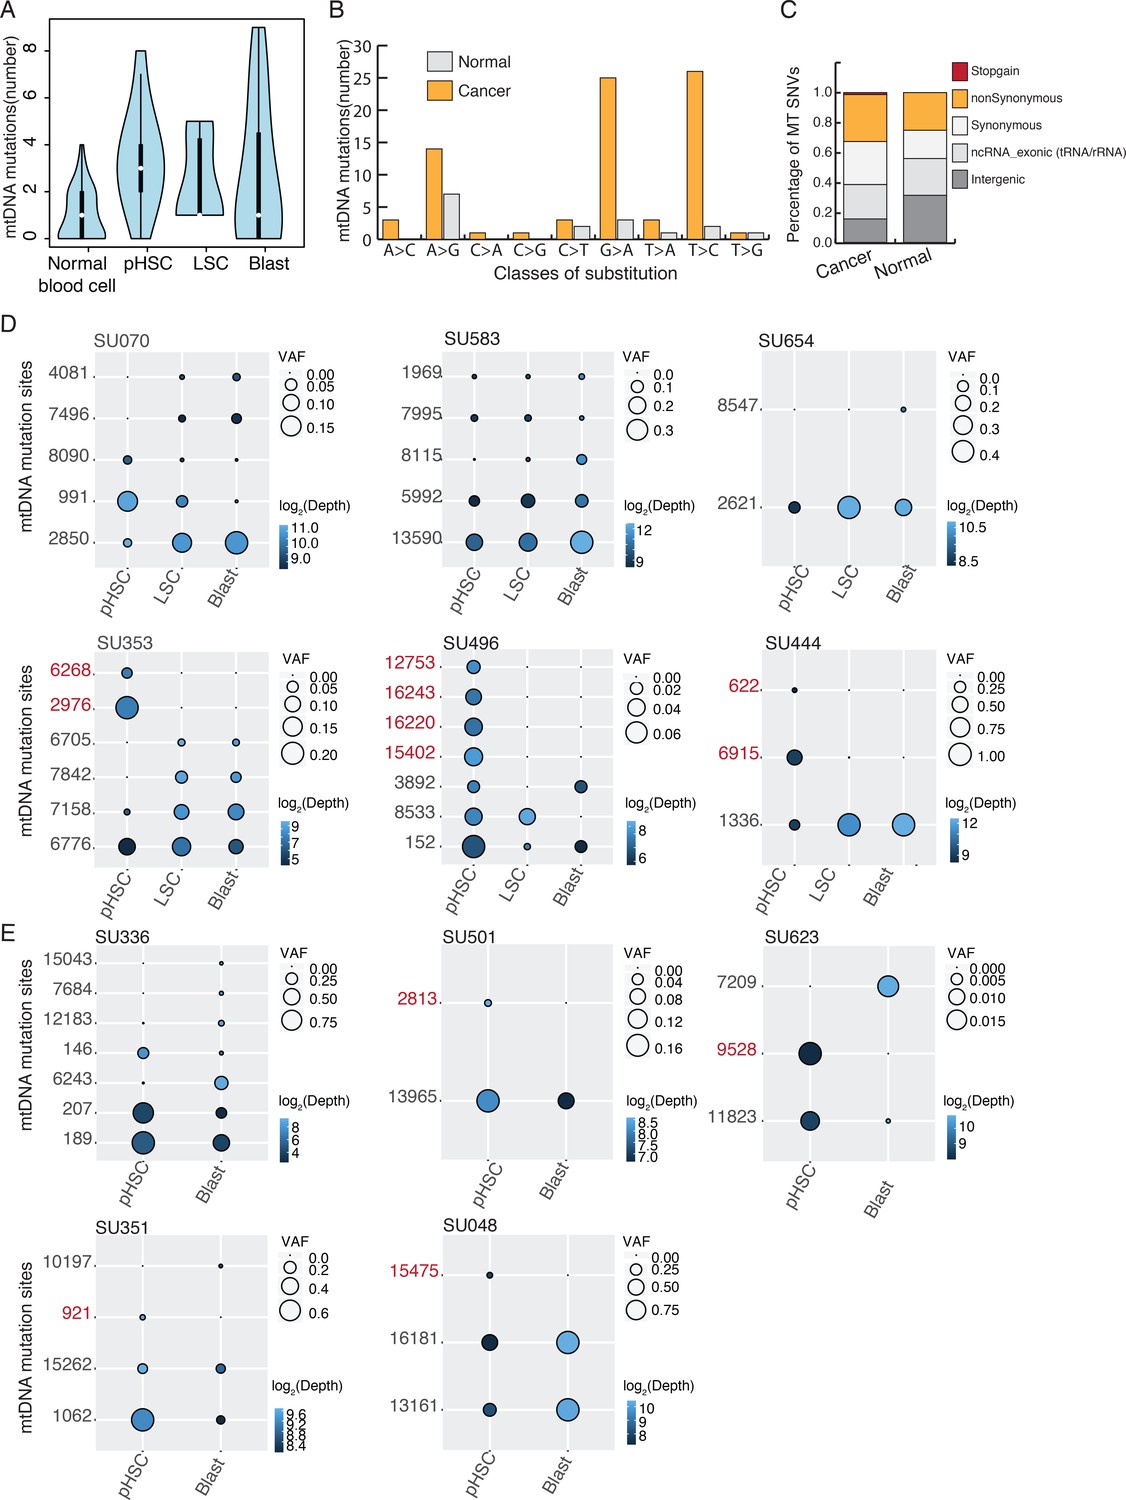
(A) The number of heteroplasmic variants detected using ATAC-seq data from normal primary blood cells and cancer cells from AML patients. (B) The number of mtDNA variants identified from normal and cancer samples in different substitution classes are shown as a bar plot. Mutations from normal (gray) and cancer (yellow) samples are separated. The C > T and T > C signature in mtDNA mutations has been observed in previous studies and it's equivalent to the one that has been operating during the evolution of human germline mtDNAs. (C) Annotation of mtDNA mutations and the proportion of mutations in coding and non-coding regions. Coding mutations are divided into synonymous, nonsynonymous, and gain of stop codon. Heteroplasmic mutations detected from cancer samples show a similar distribution as those from normal samples, with a slightly higher proportion falling within coding regions. (D) Heteroplasmic mutations in three cell stages for each AML patient. Variant alleles (in rows) in each cell population (in columns) are shown with a circle, with size indicating their variant allele frequency. Sequencing depth of the variant allele is indicated by the color of the circle (in log2 scale). pHSC-specific mutation sites are in red. Allele frequency and annotation of mtDNA mutations were shown in Supplementary file 2 (E) Heteroplasmic mutations in two cell stages for each AML patient. Variant alleles (in rows) in each cell population (in columns) are shown with a circle, with size indicating their variant allele frequency. Sequencing depth of the variant allele is indicated by the color of the circle (in log2 scale). pHSC-specific mutation sites are in red. Allele frequency and annotation of mtDNA mutations were shown in Supplementary file 2.
Figure 2—figure supplement 2
Single cell chromatin accessibility.
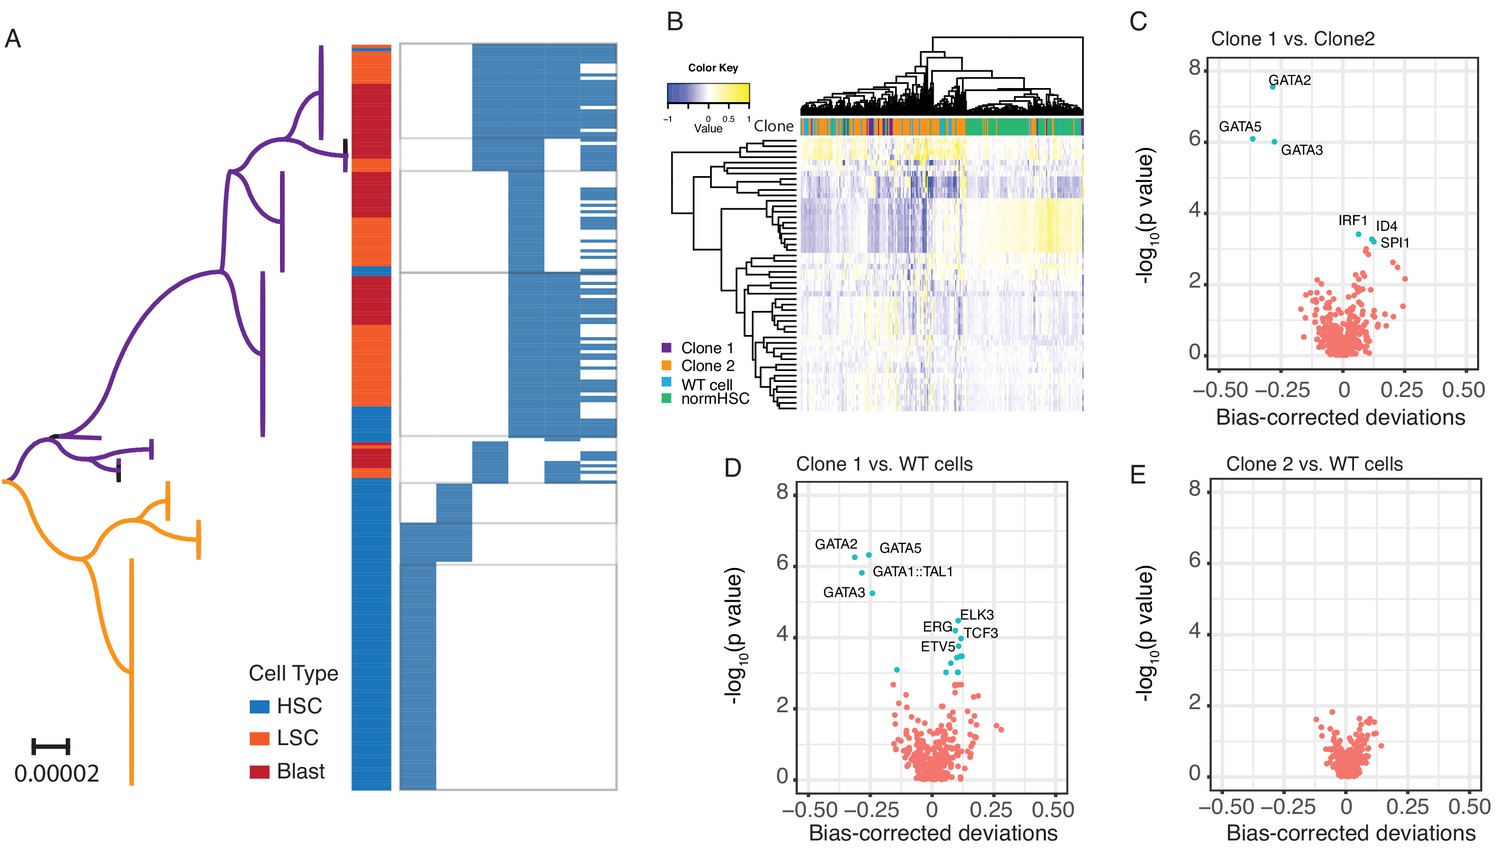
(A) Phylogenetic relationship of cells from SU353 was inferred using the Neighbor-Joining method. The phylogenetic tree is drawn to scale, with branch lengths in the units of the number of base difference per site. The clade in purple matched to clone 1 and the clade in yellow matched to clone 2 in Figure 2D. The cell type and mtDNA variants in each single cell are shown on the right. 229 single cells with at least one of the six heteroplasmic mtDNA mutations were included. (B) Heat map showing clusters of pHSCs from SU353 and normal HSCs from a healthy donor, based on the z-score of TF deviation. The Z-score deviation is shown for individual cells (columns) for each TF (rows). Clone information is shown on the top of the heat map. Top 50 most variable motifs were used in this heat map. (C) Volcano plot showing the difference in chromatin accessibility for transcription factor binding motifs between Clone 1 and Clone 2. The x-axis shows the mean difference of bias-corrected deviations and the y-axis shows the p-value (in log10 scale). The most significant differential motifs are annotated with TF names. (D) Same as in (C) for Clone 1 vs. WT cells. (E) Same as in (C) for Clone 2 vs. WT cells. No significantly differential motifs were detected.
Figure 2—figure supplement 3
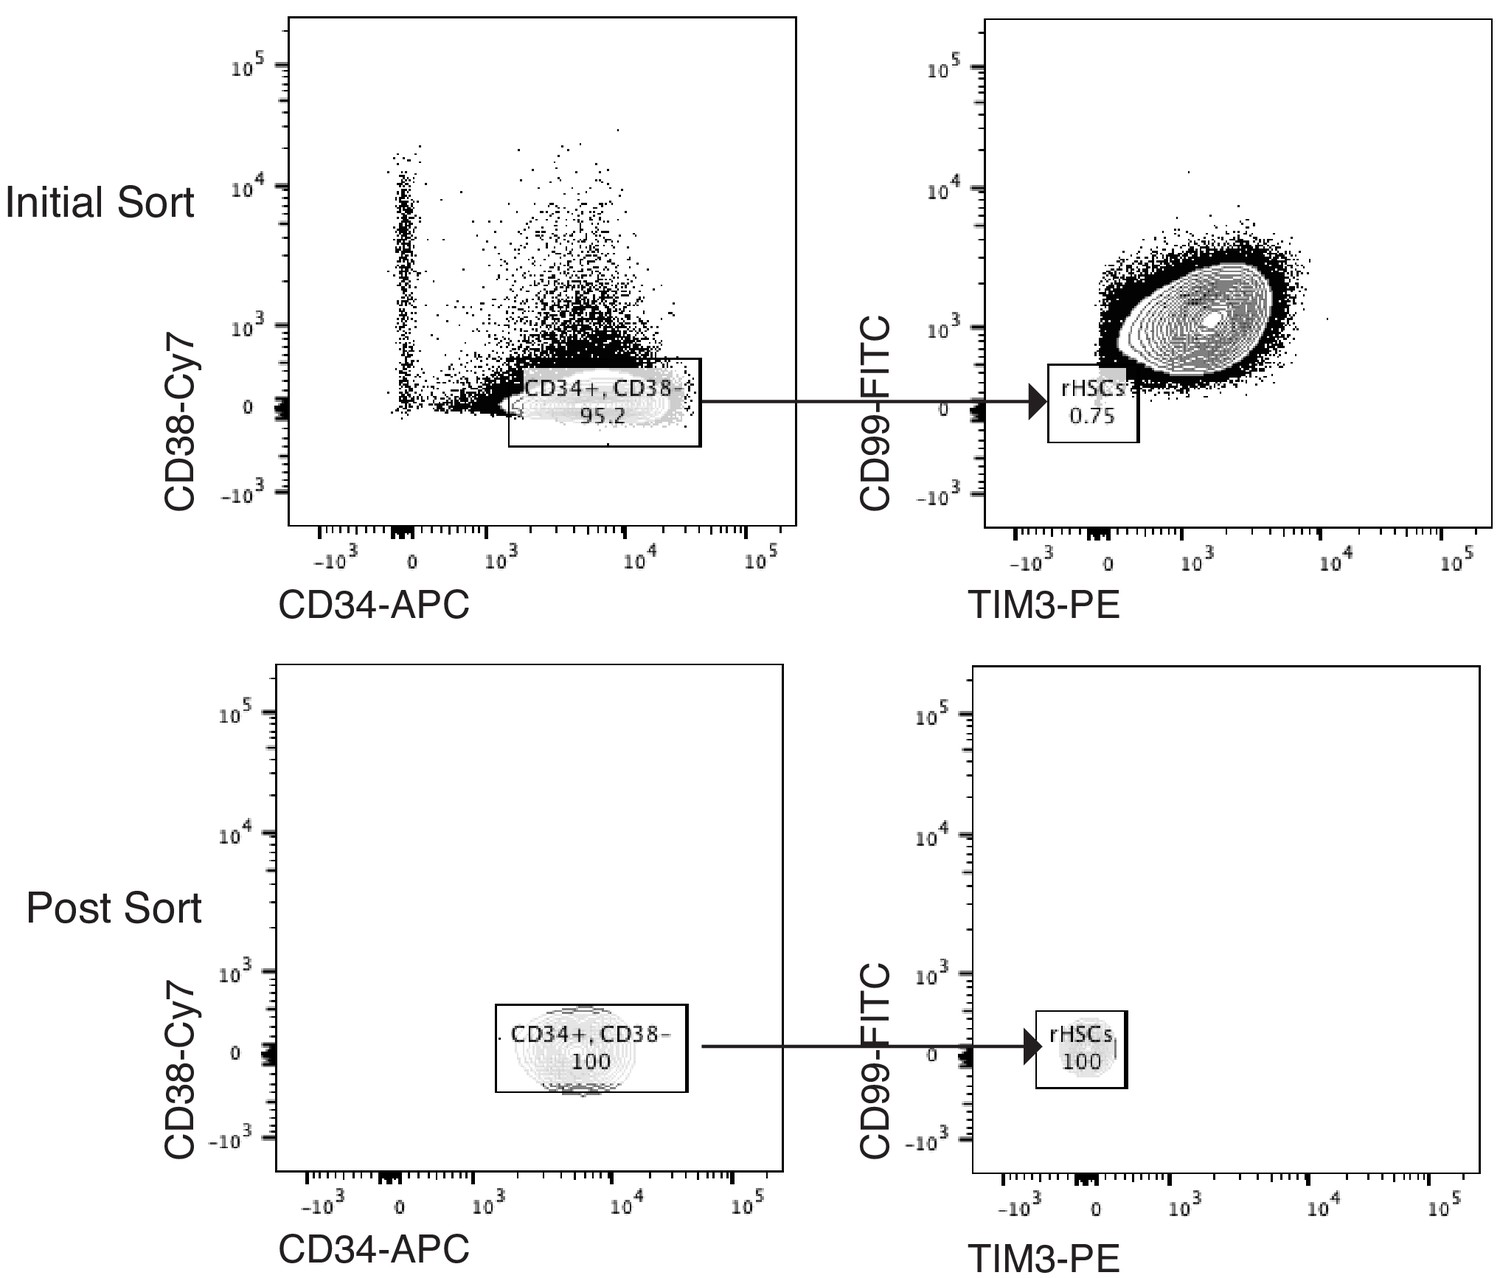
Sorting Scheme for pHSCs.
Scheme of FACS sorting of the pHSC population from AML patient SU353. Initial sort (top panel) and post-sort purity (bottom panel) are shown.
Figure 2—figure supplement 4

Investigation of horizontal mitochondrial transfer using mixing experiment from mouse and human cells.
(A) Scatter plot shows the number of unique reads mapped to human and moue nuclear genome(nucDNA). Red circle indicates cell doublet. Sequence reads from each single cell were mapped to human and mouse combined reference genome. Unique mapped reads on nucDNA and mtDNA were counted respectively. (B) Scatter plot shows the number of unique reads mapped to human and moue mitochondrial genome(mtDNA). Red circle indicates cell doublet. (C) Species-specific score for nucDNA and mtDNA. The species-specific score was calculated with (Chuman/(Chuman + Cmouse)−0.5. ‘−0.5’ or ‘0.5’ indicate 100% alignment to mouse or human reference. The positive correlation between nucDNA and mtDNA indicates the species-specific mtDNA always paired with species-specific nucDNA.
Additional files
-
Supplementary file 1
Information of datasets utilized in this study.
- https://doi.org/10.7554/eLife.45105.013
-
Supplementary file 2
Heteroplasmic mtDNA mutations detected in each AML patient.
Allele frequence, seqeunce coverage and annotation information of the mtDNA variants are provided.
- https://doi.org/10.7554/eLife.45105.014
-
Supplementary file 3
Relative merits of mtDNA vs. other genetic markers for lineage tracing.
- https://doi.org/10.7554/eLife.45105.015
-
Transparent reporting form
- https://doi.org/10.7554/eLife.45105.016
Download links
A two-part list of links to download the article, or parts of the article, in various formats.
Downloads (link to download the article as PDF)
Open citations (links to open the citations from this article in various online reference manager services)
Cite this article (links to download the citations from this article in formats compatible with various reference manager tools)
Single-cell lineage tracing by endogenous mutations enriched in transposase accessible mitochondrial DNA
eLife 8:e45105.
https://doi.org/10.7554/eLife.45105


