Population Genetics: Why structure matters
Great care is needed when interpreting claims about the genetic basis of human variation based on data from genome-wide association studies.
- IST Austria, Austria
- University of Vienna, Austria
- Austrian Academy of Sciences, Vienna BioCenter, Austria
Human height is the classic example of a quantitative trait: its distribution is continuous, presumably because it is influenced by variation at a very large number of genes, most with a small effect (Fisher, 1918). Yet height is also strongly affected by the environment: average height in many countries increased during the last century and the children of immigrants are often taller than relatives in their country of origin – in both cases presumably due to changing diet and other environmental factors (Cavalli-Sforza and Bodmer, 1971; Grasgruber et al., 2016; NCD Risk Factor Collaboration, 2016). This makes it very difficult to determine the cause of geographic patterns for height, such as the ‘latitudinal cline’ seen in Europe (Figure 1).
Figure 1
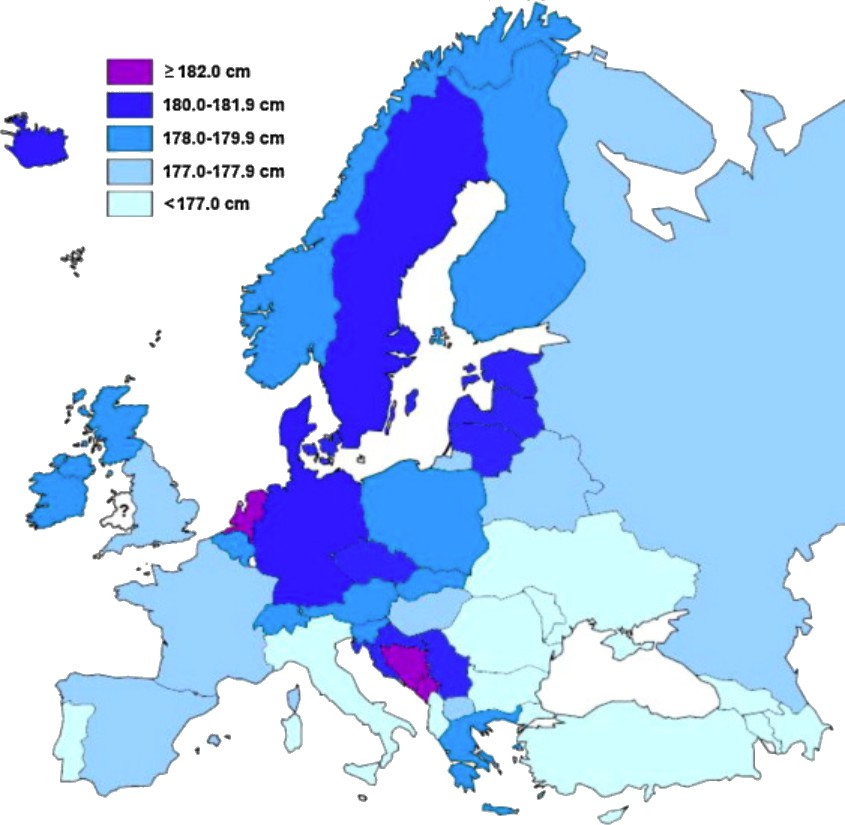
Distribution of average male height in Europe, calculated from studies performed between 1999–2013.
In general, southern Europeans tend to be shorter than northern Europeans. Image reproduced from Grasgruber et al., 2014 (CC BY 3.0).
Are such patterns caused by environmental or genetic differences – or by a complex combination of both? And to the extent that genetic differences are involved, do they reflect selection or simply random history? A number of recent papers have relied on so-called Genome-Wide Association Studies (GWAS) to address these questions, and reported strong evidence for both genetics and selection. Now, in eLife, two papers – one by Jeremy Berg, Arbel Harpak, Nasa Sinnott-Armstrong and colleagues (Berg et al., 2019); the other by Mashaal Sohail, Robert Maier and colleagues (Sohail et al., 2019) – independently reject these conclusions. Even more importantly, they identify problems with GWAS that have broader implications for human genetics.
As the name suggests, GWAS scan the genome for variants – typically single nucleotide polymorphisms (SNPs) – that are associated with a particular condition or trait (phenotype). The first GWAS for height found a small number of SNPs that jointly explained only a tiny fraction of the variation. Because this was in contrast with the high heritability seen in twin studies, it was dubbed ‘the missing heritability problem’ (reviewed in Yang et al., 2010). It was suggested that the problem was simply due to a lack of statistical power to detect polymorphisms of small effect. Subsequent studies with larger sample sizes have supported this explanation: more and more loci have been identified although most of the variation remains ‘unmappable’, presumably because sample sizes on the order of a million are still not large enough (Yengo et al., 2018).
One way in which the unmappable component of genetic variation can be included in a statistical measure is via so-called polygenic scores. These scores sum the estimated contributions to the trait across many SNPs, including those whose effects, on their own, are not statistically significant. Polygenic scores thus represent a shift from the goal of identifying major genes to predicting phenotype from genotype. Originally designed for plant and animal breeding purposes, polygenic scores can, in principle, also be used to study the genetic basis of differences between individuals and groups.
This, however, requires accurate and unbiased estimation of the effects of all SNPs included in the score, which is difficult in a structured (non-homogeneous) population when environmental differences cannot be controlled. To see why this is a problem, consider the classic example of chopstick-eating skills (Lander and Schork, 1994). While there surely are genetic variants affecting our ability to handle chopsticks, most of the variation for this trait across the globe is due to environmental differences (cultural background), and a GWAS would mostly identify variants that had nothing to do with chopstick skills, but simply happened to differ in frequency between East Asia and the rest of the world.
Several methods for dealing with this problem have been proposed. When a GWAS is carried out to identify major genes, it is relatively simple to avoid false positives by eliminating associations outside major loci regardless of whether they are due to population structure confounding or an unmappable polygenic background (Vilhjálmsson and Nordborg, 2013). However, if the goal is to make predictions, or to understand differences among populations (such as the latitudinal cline in height), we need accurate and unbiased estimates for all SNPs. Accomplishing this is extremely challenging, and it is also difficult to know whether one has succeeded.
One possibility is to compare the population estimates with estimates taken from sibling data, which should be relatively unbiased by environmental differences. In one of many examples of this, Robinson et al. used data from the GIANT Consortium (Wood et al., 2014) together with sibling data to estimate that genetic variation contributes significantly to height variation across Europe (Robinson et al., 2015). They also argued that selection must have occurred, because the differences were too large to have arisen by chance. Using estimated effect sizes provided by Robinson et al., a more sophisticated analysis by Field et al. found extremely strong evidence for selection for height across Europe (p=10−74; Field et al., 2016). Several other studies reached the same conclusion based on the GIANT data (reviewed in Berg et al., 2019; Sohail et al., 2019).
Berg et al. (who are based at Columbia University, Stanford University, UC Davis and the University of Copenhagen) and Sohail et al. (who are based at Harvard Medical School, the Broad Institute, and other institutes in the US, Finland and Sweden) now re-examine these conclusions using the recently released data from the UK Biobank (Sudlow et al., 2015). Estimating effect sizes from these data allows possible biases due to population structure confounding to be investigated, because the UK Biobank data comes from a (supposedly) more homogenous population than the GIANT data.
Using these new estimates, Berg et al. and Sohail et al. independently found that evidence for selection vanishes – along with evidence for a genetic cline in height across Europe. Instead, they show that the previously published results were due to the cumulative effects of slight biases in the effect-size estimates in the GIANT data. Surprisingly, they also found evidence for confounding in the sibling data used as a control by Robinson et al. and Field et al. This turned out to be due to a technical error in the data distributed by Robinson et al. after they published their paper.
This means we still do not know whether genetics and selection are responsible for the pattern of height differences seen across Europe. That genetics plays a major role in height differences between individuals is not in doubt, and it is also clear that the signal from GWAS is mostly real. The issue is that there is no perfect way to control for complex population structure and environmental heterogeneity. Biases at individual loci may be tiny, but they become highly significant when summed across thousands of loci – as is done in polygenic scores. Standard methods to control for these biases, such as principal component analysis, may work well in simulations but are often insufficient when confronted with real data. Importantly, no natural population is unstructured: indeed, even the data in the UK Biobank seems to contain significant structure (Haworth et al., 2019).
Berg et al. and Sohail et al. demonstrate the potential for population structure to create spurious results, especially when using methods that rely on large numbers of small effects, such as polygenic scores. Caution is clearly needed when interpreting and using the results of such studies. For clinical predictions, risks must be weighed against benefits (Rosenberg et al., 2019). In some cases, such as recommendations for more frequent medical checkups for patients found at higher ‘genetic’ risk of a condition, it may not matter greatly whether predictors are confounded as long as they work. By contrast, the results of behavioral studies of traits such as IQ and educational attainment (Plomin and von Stumm, 2018) must be presented carefully, because while the benefits are far from obvious, the risks of such results being misinterpreted and misused are quite clear. The problem is worsened by the tendency of popular media to ignore caveats and uncertainties of estimates.
Finally, although quantitative genetics has proved highly successful in plant and animal breeding, it should be remembered that this success has been based on large pedigrees, well-controlled environments, and short-term prediction. When these methods have been applied to natural populations, even the most basic predictions fail, in large part due to poorly understood environmental factors (Charmantier et al., 2014). Natural populations are never homogeneous, and it is therefore misleading to imply there is a qualitative difference between ‘within-population’ and ‘between-population’ comparisons – as was recently done in connection with James Watson’s statements about race and IQ (Harmon, 2019). With respect to confounding by population structure, the key qualitative difference is between controlling the environment experimentally, and not doing so. Once we leave an experimental setting, we are effectively skating on thin ice, and whether the ice will hold depends on how far out we skate.
References
-
BookQuantitative Genetics in the WildOxford University Press.https://doi.org/10.1093/acprof:oso/9780199674237.001.0001
-
XV.—The correlation between relatives on the supposition of Mendelian inheritanceTransactions of the Royal Society of Edinburgh 52:399–433.https://doi.org/10.1017/S0080456800012163
-
The role of nutrition and genetics as key determinants of the positive height trendEconomics & Human Biology 15:81–100.https://doi.org/10.1016/j.ehb.2014.07.002
-
Major correlates of male height: A study of 105 countriesEconomics & Human Biology 21:172–195.https://doi.org/10.1016/j.ehb.2016.01.005
-
WebsiteJames Watson had a chance to salvage his reputation on race. He made things worseThe New York Times. Accessed January 1, 2019.
-
The new genetics of intelligenceNature Reviews Genetics 19:148–159.https://doi.org/10.1038/nrg.2017.104
-
Population genetic differentiation of height and body mass index across EuropeNature Genetics 47:1357–1362.https://doi.org/10.1038/ng.3401
-
Interpreting polygenic scores, polygenic adaptation, and human phenotypic differencesEvolution, Medicine, and Public Health 2019:26–34.https://doi.org/10.1093/emph/eoy036
-
The nature of confounding in genome-wide association studiesNature Reviews Genetics 14:1–2.https://doi.org/10.1038/nrg3382
Article and author information
Author details
Acknowledgements
We thank Jeremy Berg and Peter Visscher for answering our questions, and Molly Przeworski for helpful discussions.
Publication history
Copyright
© 2019, Barton et al.
This article is distributed under the terms of the Creative Commons Attribution License, which permits unrestricted use and redistribution provided that the original author and source are credited.
Metrics
-
- 20,782
- views
-
- 1,341
- downloads
-
- 102
- citations
Views, downloads and citations are aggregated across all versions of this paper published by eLife.
Citations by DOI
-
- 102
- citations for umbrella DOI https://doi.org/10.7554/eLife.45380
Download links
A two-part list of links to download the article, or parts of the article, in various formats.
Downloads (link to download the article as PDF)
Open citations (links to open the citations from this article in various online reference manager services)
Cite this article (links to download the citations from this article in formats compatible with various reference manager tools)
Population Genetics: Why structure matters
eLife 8:e45380.
https://doi.org/10.7554/eLife.45380
Further reading
-
- Evolutionary Biology
- Genetics and Genomics
Several recent papers have reported strong signals of selection on European polygenic height scores. These analyses used height effect estimates from the GIANT consortium and replication studies. Here, we describe a new analysis based on the the UK Biobank (UKB), a large, independent dataset. We find that the signals of selection using UKB effect estimates are strongly attenuated or absent. We also provide evidence that previous analyses were confounded by population stratification. Therefore, the conclusion of strong polygenic adaptation now lacks support. Moreover, these discrepancies highlight (1) that methods for correcting for population stratification in GWAS may not always be sufficient for polygenic trait analyses, and (2) that claims of differences in polygenic scores between populations should be treated with caution until these issues are better understood.
Editorial note: This article has been through an editorial process in which the authors decide how to respond to the issues raised during peer review. The Reviewing Editor's assessment is that all the issues have been addressed (see decision letter).


