Cohesin and condensin extrude DNA loops in a cell cycle-dependent manner
- Max Planck Institute of Molecular Cell Biology and Genetics, Germany
- Max Planck Institute for the Physics of Complex Systems, Germany
- Centre for Systems Biology Dresden, Germany
- Cluster of Excellence Physics of Life, TU Dresden, Germany
- Cell Biology Center, Institute of Innovative Research, Tokyo Institute of Technology, Japan
Figures
Figure 1 with 11 supplements
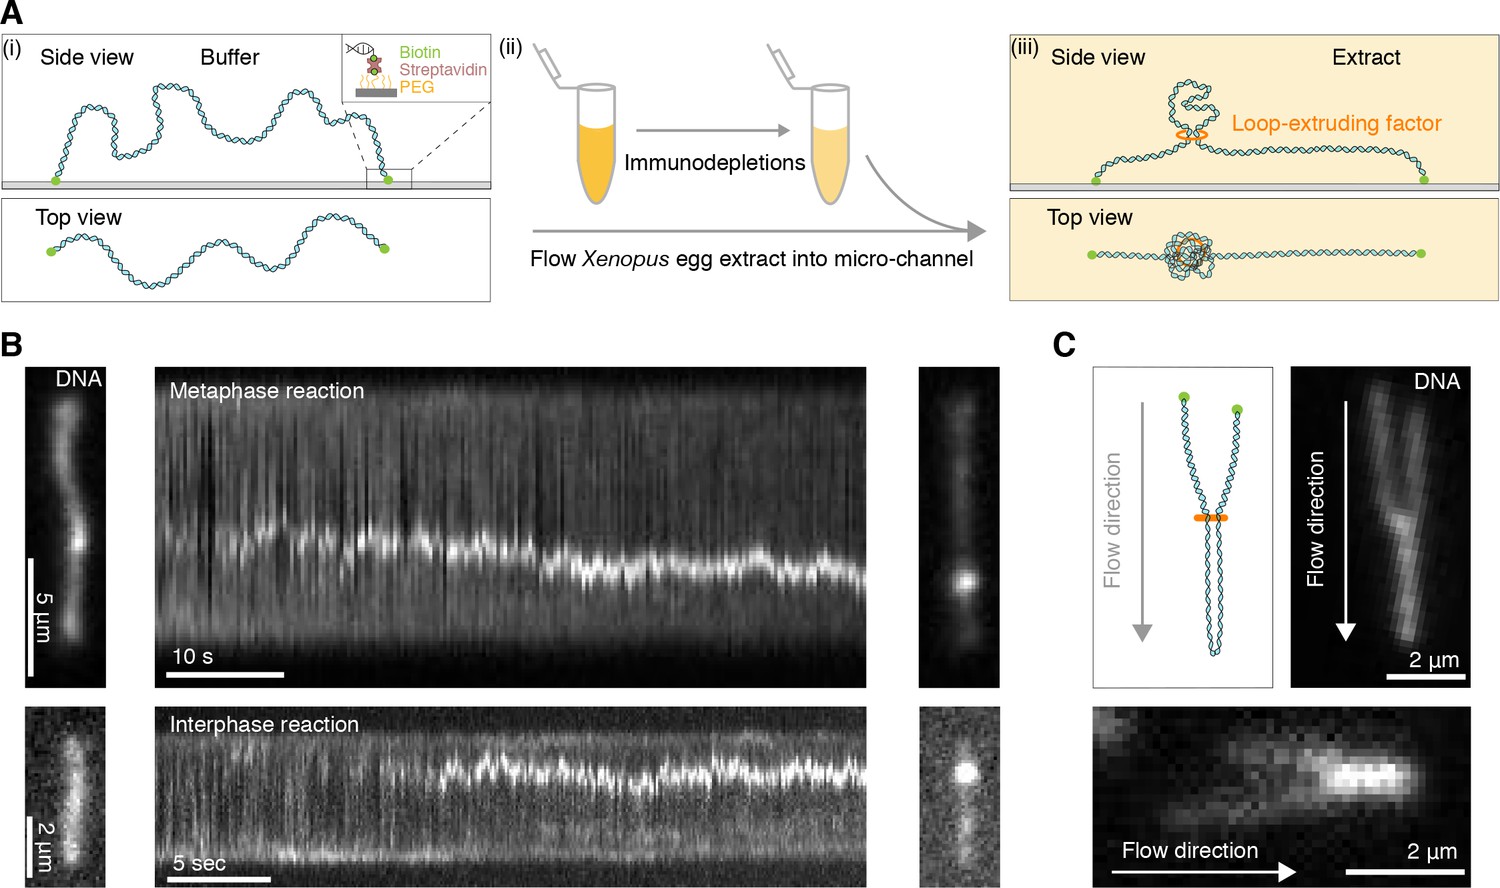
Single DNA molecule assay for direct visualization of DNA looping in Xenopus egg extracts.
(A) (i) Side and top view schematics of a single strand of λ-phage DNA attached to a functionalized cover slip via biotin-streptavidin linkers. (ii) Xenopus egg extract is flowed into the microfluidic chamber. (iii) Side and top view schematics visualizing how soluble active loop-extruding factors extrude loops in H3-H4-depleted extract. (B) Dynamics of the formation of DNA loops induced by H3-H4-depleted extract in metaphase (upper) and interphase (lower). Snapshot of a single molecule of λ-phage DNA visualized using Sytox Orange preceding treatment with H3-H4-depleted extract (left). Kymograph of DNA signal over time displaying a looping event upon addition of H3-H4-depleted extract (middle). Snapshot of steady-state DNA looping event after ~60 s (right). (C) Hydrodynamic flows reveal loop topology within DNA cluster. (i) Schematic of the loop topology revealed upon flow. (ii) Topology of extract-induced DNA loops in metaphase (upper) and interphase (lower) visualized using Sytox Orange revealed upon flow in the direction of the arrow.
Figure 1—figure supplement 1
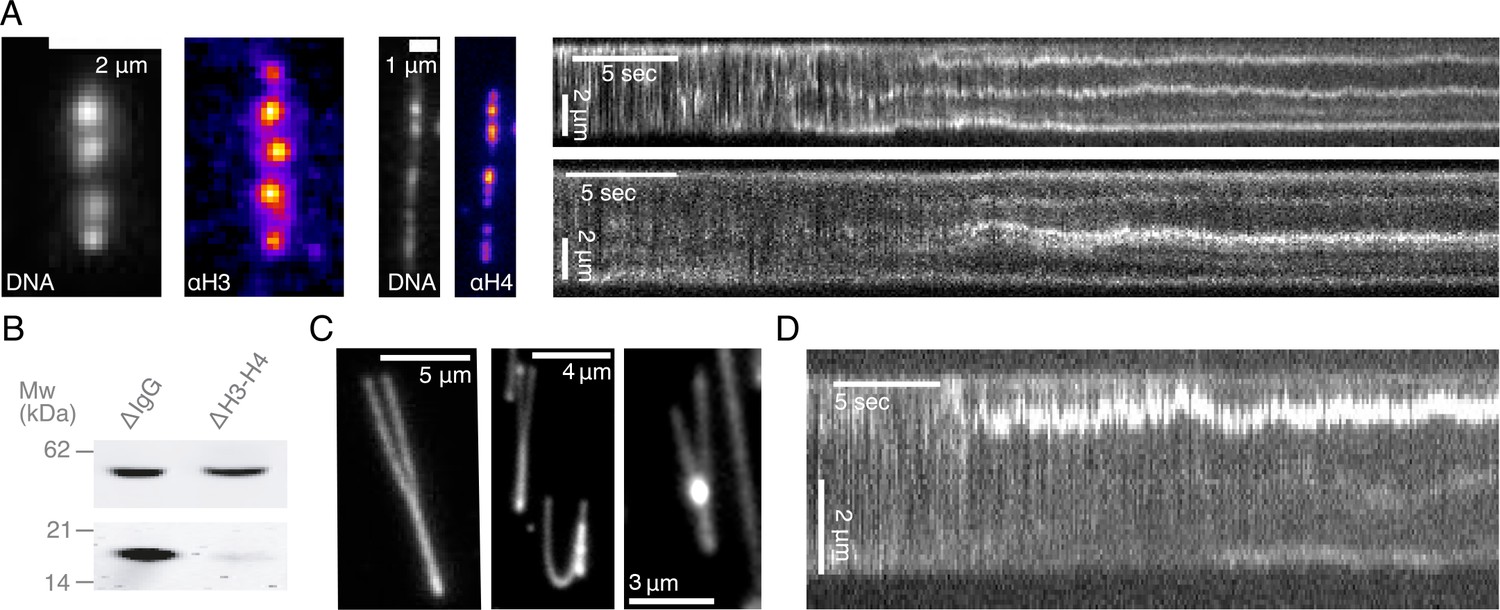
Characterization of DNA compaction in Xenopus laevis egg extracts.
(A) Addition of crude extract to λ-phage DNA molecules leads to the generation of multiple highly-enriched DNA clusters, suggestive of nucleosomal formation along the strand. Alexa488-labeled anti-H3 and anti-H4k12ac localize to these DNA clusters (left). Kymographs of nucleosomal cluster formation in both metaphase (upper) and interphase (lower) along a strand upon addition of crude extract. See also Figure 1—videos 1–2. (B) Quantitative western blot showing approximately 90–95% depletion of soluble H3-H4 heterodimers. (C) Examples of completely stretched loops in metaphase (left and middle) and a partially extended interphase loop (right) upon hydrodynamic stretching with buffer flow perpendicular to strand orientation. (D) Kymograph of a looping event on a strand upon treatment with crude extract. See also Figure 1—video 10.
Figure 1—video 1
Addition of crude Xenopus egg extract to a single strand of λ-phage DNA, visualized using Sytox Orange, leads to the generation of multiple highly-enriched DNA clusters, suggestive of nucleosomal formation along the strand.
Figure 1—video 2
Addition of crude Xenopus egg extract to a single strand of λ-phage DNA, visualized using Sytox Orange, leads to the generation of multiple highly-enriched DNA clusters, suggestive of nucleosomal formation along the strand.
Figure 1—video 3
Example of DNA loop formation in H3-H4-depleted egg extract arrested in metaphase visualized using Sytox Orange.
The movie duration is 90 s and the scale bar is 2 μm.
Figure 1—video 4
Example of DNA loop formation in H3-H4-depleted egg extract in metaphase visualized using Sytox Orange.
The movie duration is 195 s and the scale bar is 2 μm.
Figure 1—video 5
Example of DNA loop formation in H3-H4-depleted egg extract in interphase visualized using Sytox Orange.
The movie duration is 108 s and the scale bar is 2 μm.
Figure 1—video 6
Example of DNA loop formation in H3-H4-depleted egg extract in interphase visualized using Sytox Orange.
The movie duration is 34 s and the scale bar is 2 μm.
Figure 1—video 7
Example of hydrodynamically stretched DNA loops in H3-H4-depleted extract arrested in metaphase visualized using Sytox Orange.
The movie duration is 16 s and the scale bar is 5 μm.
Figure 1—video 8
Example of a hydrodynamically stretched DNA loop in H3-H4-depleted interphase extract visualized using Sytox Orange.
The movie duration is 104 s and the scale bar is 2 μm.
Figure 1—video 9
Example of a hydrodynamically stretched DNA loop in H3-H4-depleted interphase extract visualized using Sytox Orange.
The movie duration is 4 s and the scale bar is 2 μm.
Figure 1—video 10
Example of DNA loop formation in non-depleted crude extract visualized using Sytox Orange.
The movie duration is 87 s and the scale bar is 5 μm.
Figure 2 with 7 supplements
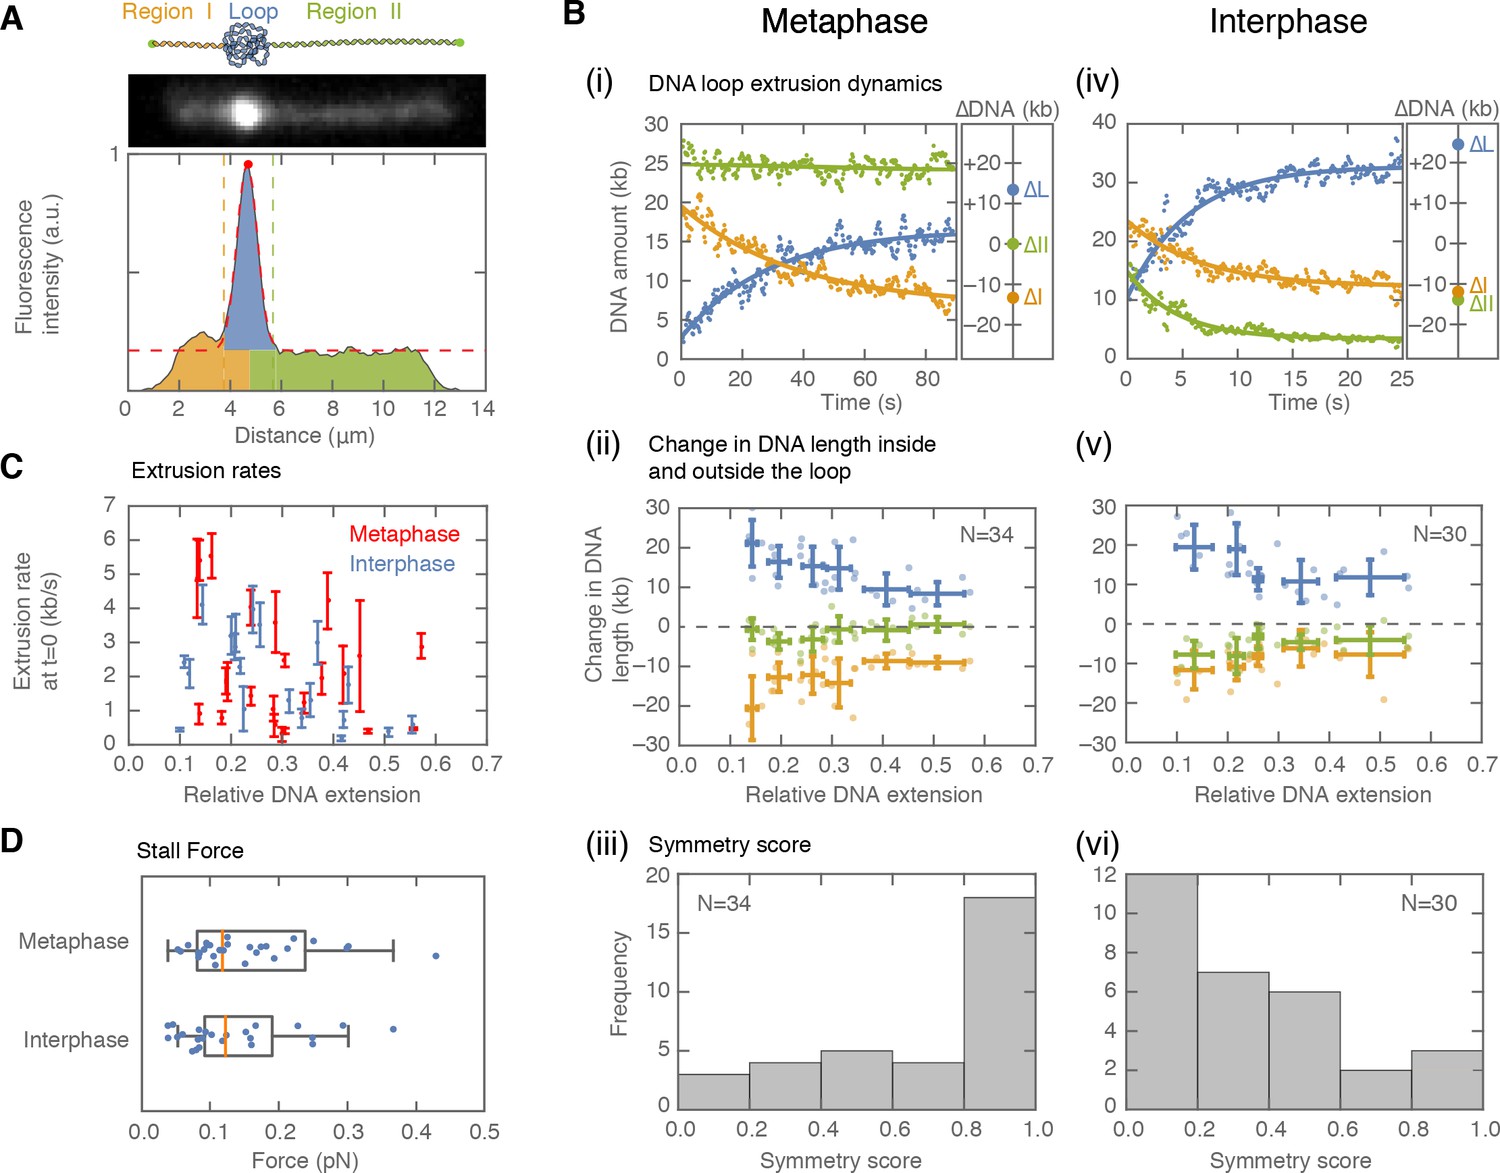
Symmetry of DNA loop extrusion is cell cycle-dependent with similar extrusion rates and stalling forces.
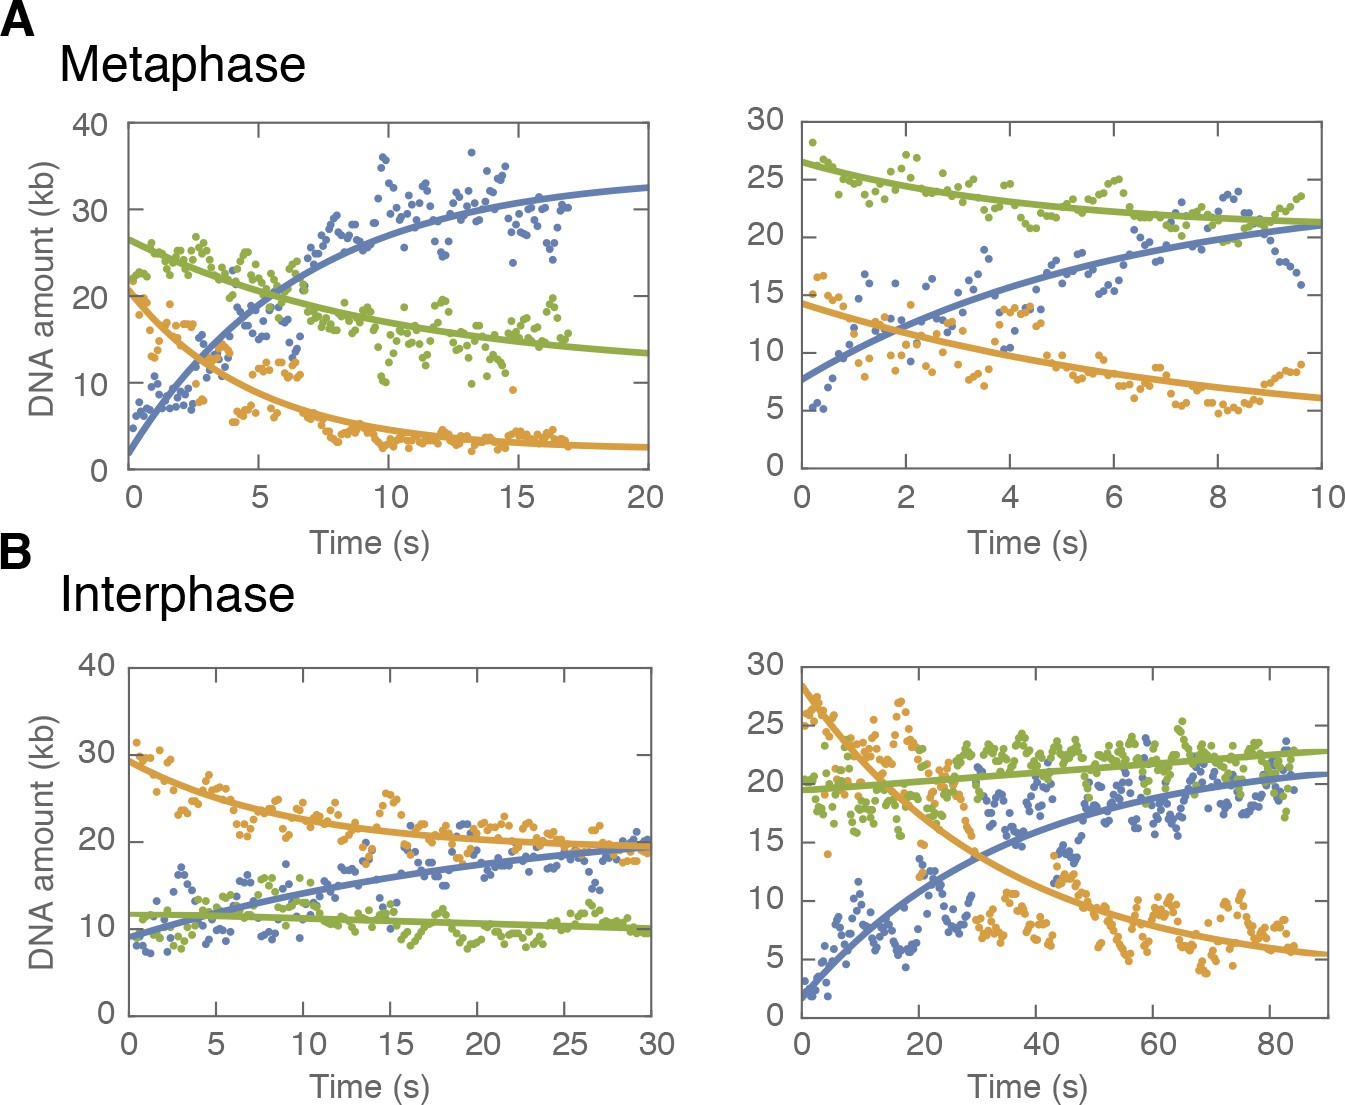
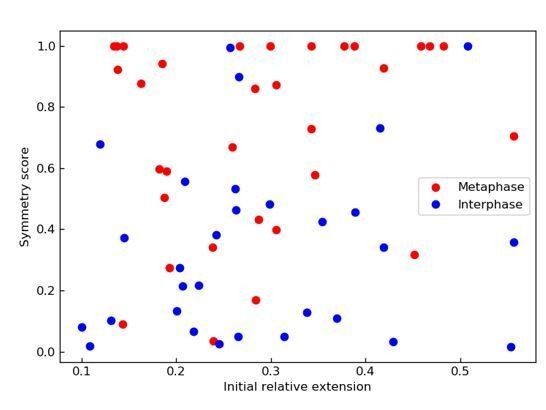
(A) Method to track DNA-loop dynamics through space and time. Upper: Schematic of the top view of a DNA-looping event segmented into three regions: region I (orange), region II (green), and the loop region (blue). Middle: Snapshot of DNA-looping event where DNA is labelled using Sytox Orange. Bottom: The integrated fluorescence intensity of the DNA generated by summing the intensity values along the perpendicular axis of the strand. The dashed red line represents a Gaussian fit to the data. Signal values above the fit’s offset define the looped region given in blue; signal values below this threshold correspond to the non-looped regions I and II, given in orange and in green. To convert the signal into DNA length, the integrated intensity of each region is divided by the total summed intensity of the DNA strand and multiplied by the total length of λ-phage DNA (48.5 kb). (B) Dynamics of DNA looping in H3-H4-depleted extract in metaphase and interphase. (Bi,iv left) DNA amount as a function of time computed for the looped region (blue) and non-looped regions I and II (green and orange). The dots represent experimental data and the solid lines represent exponential fits to the data. (Bi,iv right) The redistribution of DNA during the looping events shown in the left panel quantified as the change in DNA content in each region. (Bii,v) Change in the amount of DNA in the looped region and non-loop regions I and II (as in Bi,iv right) for the entire population of meta- and interphase looping events plotted as a function of the initial relative DNA extension of the corresponding molecules. Error bars correspond to standard deviations of data clustered by proximity. Points represent raw data. (Biii, vi) Analysis of loop extrusion symmetry shows predominantly non-symmetric extrusion (symmetry score ~1) in metaphase (Biii) and symmetric extrusion (symmetry score ~0) in interphase (Bvi). (C) Initial growth rates of DNA loop extrusion in metaphase (red) and interphase (blue) as a function of initial relative DNA extension. These rates were obtained from the slopes of the exponential fits to the loop data at time t = 0 for the subset of loop extrusion events that allowed for a fitting that converged within a tolerance (10−8relative change of the cost function), that corresponded to N = 21 out of 30 in interphase, and N = 24 out of 34 for metaphase. Error bars were obtained from error propagation of the uncertainties of the exponential fit parameters. (D) Box plots of the stall forces for DNA loop extrusion in metaphase and interphase obtained from the final relative extension of the DNA strand at the end of loop formation.
Figure 2—figure supplement 1

DNA looping examples demonstrating non-symmetric loop extrusion in metaphase and symmetric loop extrusion in interphase.
We tracked the position of the loop and segmented the DNA signal into a loop region (blue) and region I and II (orange and green). The integrated fluorescence intensity in each region was converted into the relative amount of DNA in that region as described above and plotted as a function of time. The dots are data from the analysis and the lines represent single exponential fits to the data. (A) In metaphase, we observed a saturating exponential increase in the DNA amount in the looped region, and only a single non-looped region decreasing in DNA amount, suggestive of one-sided (non-symmetric) DNA loop extrusion. (B) In interphase, we observed a similar saturating exponential increase in the DNA amount in the looped region, whereas both non-loop regions decreased in DNA amount, suggestive of two-sided (symmetric) DNA loop extrusion. (C) Representative snapshots of DNA looping in H3-H4-depleted interphase and metaphase extracts ordered by end-to-end distance. Left image represents the initial DNA configuration and right image the corresponding final loop configuration. Scale bar is 5 μm.
Figure 2—figure supplement 2
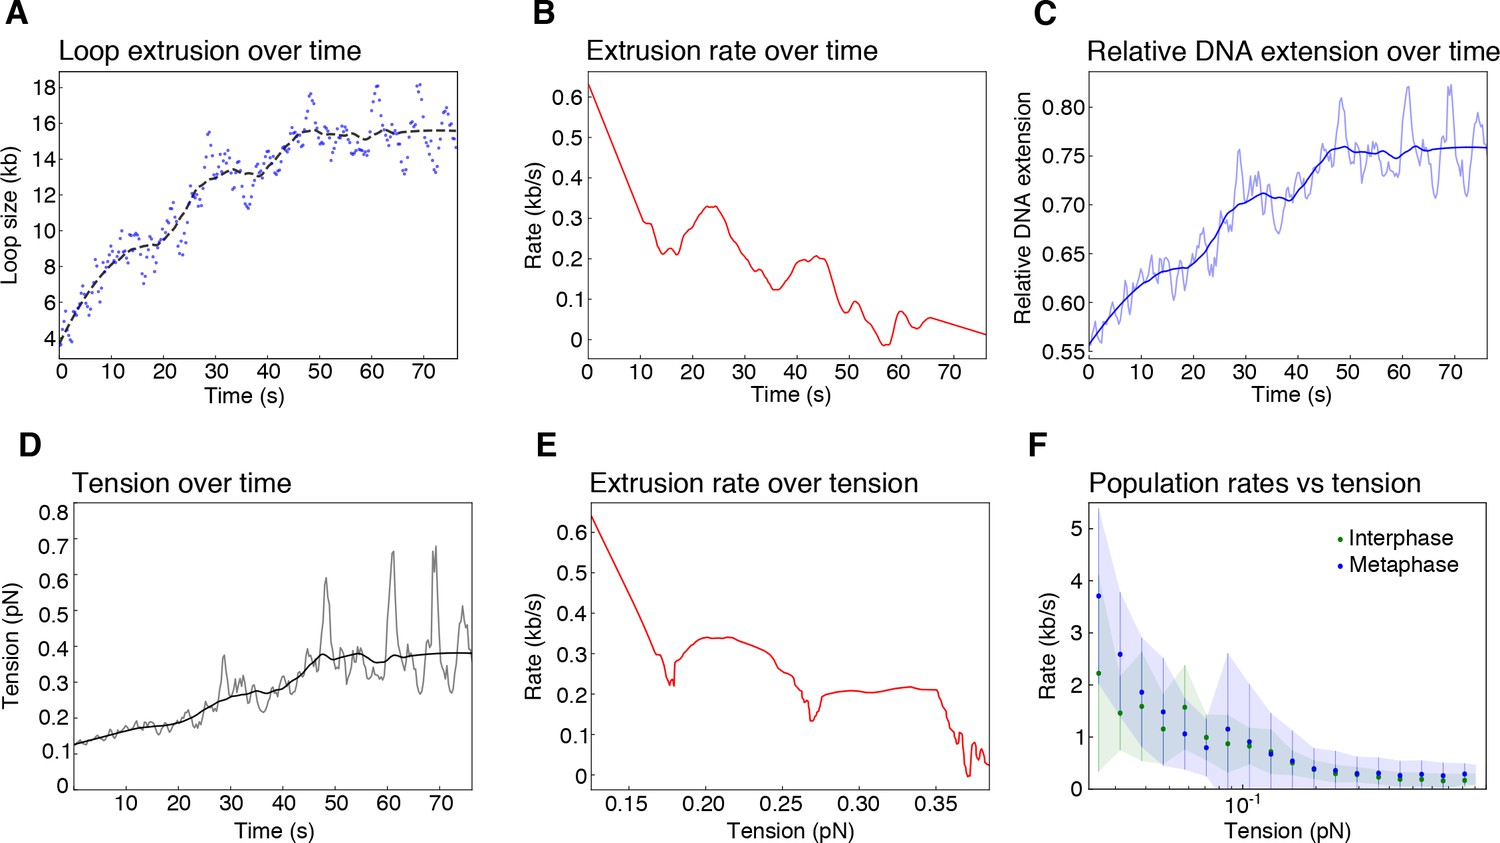
Biophysical characterization of loop extrusion rate and DNA tension.
(A) Example of one metaphase loop extrusion event (blue dots) smoothed by a Savitzky-Golay filtering with a 2nd-order polynomial and a window size of 63 points (black dashes). (B) The extrusion rate of the looping event was obtained from the first-order derivative of the smoothed curve. (C) Relative DNA extension was calculated as the end-to-end distance divided by the amount of DNA outside of the loop region using the raw loop data (blue shaded curve) and the smoothed loop data from (A). (D) Tension on the DNA strand, resulting from the reeling of DNA into the loop, was obtained from applying the worm like chain model (Marko and Siggia, 1995) for DNA to the relative extension values in (C) with the raw data as the shaded curve. (E) Rate of loop extrusion plotted over the tension on the DNA strand for the single looping event in (A). (F) Loop extrusion rates over DNA tension for the population of metaphase (blue dots and envelope) and interphase looping events (green dots and envelope) from exponential fit curves to the loop data. Dots represent mean values, error bars and envelope represent standard deviation.
Figure 2—figure supplement 3
Examples of symmetric DNA loop extrusion in metaphase and non-symmetric loop extrusion in interphase.
We quantified the amount of DNA inside the loop (blue dots) and the regions left and right of the loop (region I in orange and region II in green) from the relative integrated DNA fluorescence intensities in each region for each time point. The lines represent exponential fits to the data. (A) Examples of metaphase looping events exhibiting two-sided (symmetric) DNA loop extrusion where DNA is reeled in from both regions outside of the loop. (B) Examples of one-sided (non-symmetric) DNA loop extrusion events in interphase, showing one-sided reeling of DNA into the loop from only one region outside of the loop.
Figure 2—figure supplement 4
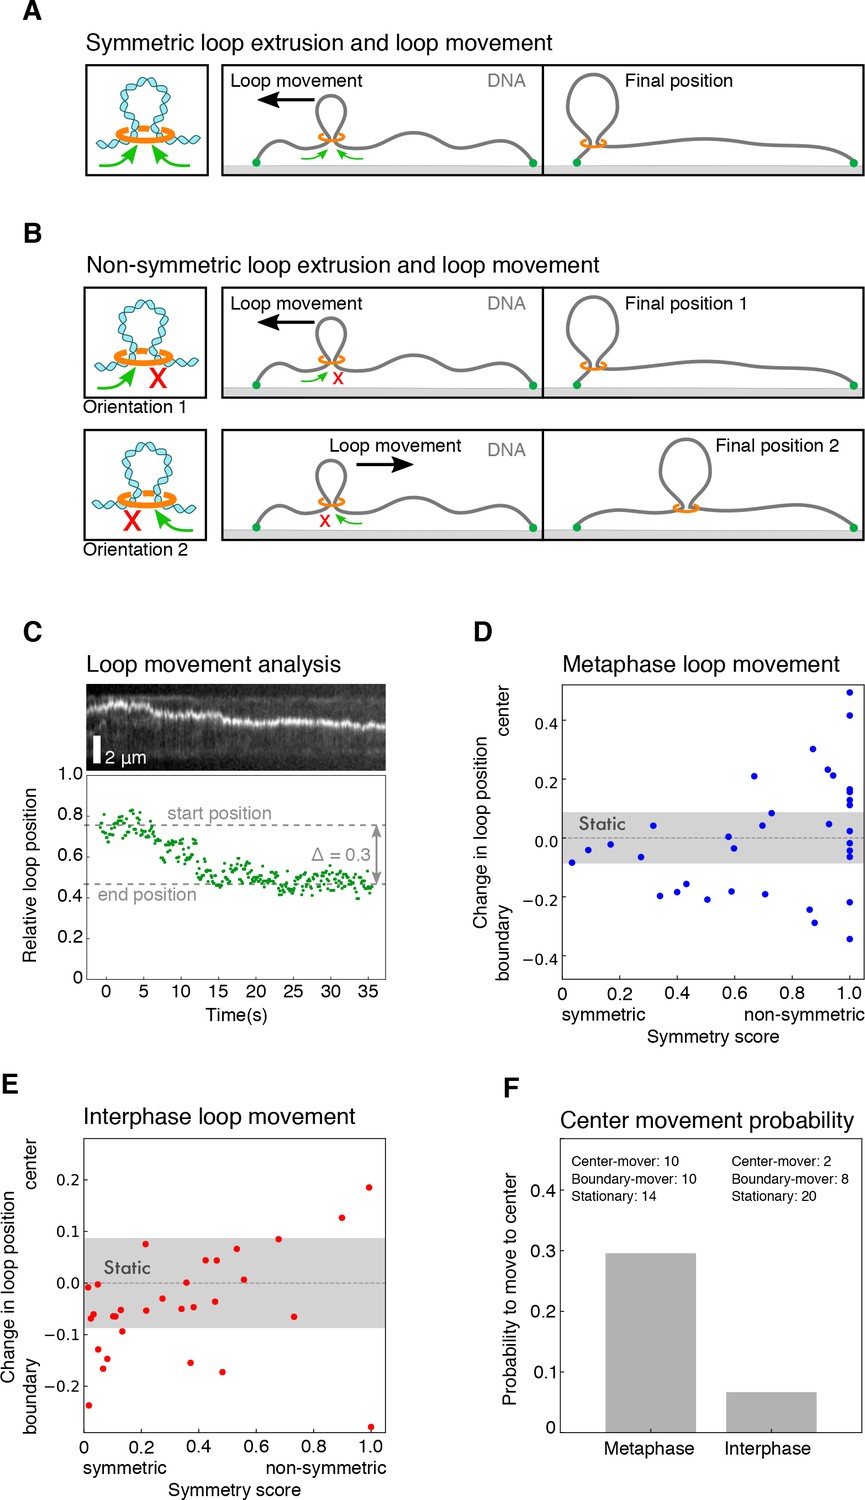
Characterization of loop movement and symmetry.
(A) Schematics of two-sided (symmetric) DNA loop extrusion. Reeling in DNA from both sides at similar rates displaces the loop towards the shorter end of the DNA, as the smaller amount of slack in the shorter region is used up faster. (B) The displacement of a loop along the DNA strand by one-sided (non-symmetric) extrusion depends on the direction of extrusion. If the orientation of the extrusion machinery is random, it has equal chances to be directed towards the center of the DNA or the closest boundary. (C) We followed the movement of the DNA loop by tracking the relative location of the maximum of signal intensity for each time point. Top: kymograph of a metaphase looping event. Bottom: corresponding relative position of the loop for each time point. We then quantified the relative change in loop position along the DNA strand with respect to the centre of the DNA strand and the nearest boundary. This allowed us to plot the relative change in loop position over the corresponding symmetry score for all looping events in (D) metaphase and (E) interphase. We classified each looping event by its displacement towards the center, the nearest boundary, or as static, if the displacement did not exceed a threshold of 0.08 (see Materials and methods). (F) Based on the displacement of all looping events, we could compare the probability for a loop to move to the centre of the DNA strand in metaphase and interphase.
Figure 2—figure supplement 5

Dependency of loop extrusion rate on extrusion symmetry and stall forces on initial relative DNA extension.
We quantified the loop extrusion rate as a function of extrusion symmetry (symmetry score) in both (A) interphase and (B) metaphase (C) for the events corresponding to Figure 2C. Using the worm-like chain model (Marko and Siggia, 1995), we computed the stall forces for both interphase and metaphase looping events from the plateau size of the loop and plot these values as a function of initial relative extension of the DNA strand before the loop formed. The hatched line shows the initial tension on the DNA strand before the onset of loop formation as a function of end-to-end distance of the DNA molecules. The resulting stall forces are conserved between inter- and metaphase and show a slight dependency on the initial relative extension of the DNA strand, possibly by selecting for stronger loops in stretched-out DNA molecules.
Figure 2—figure supplement 6
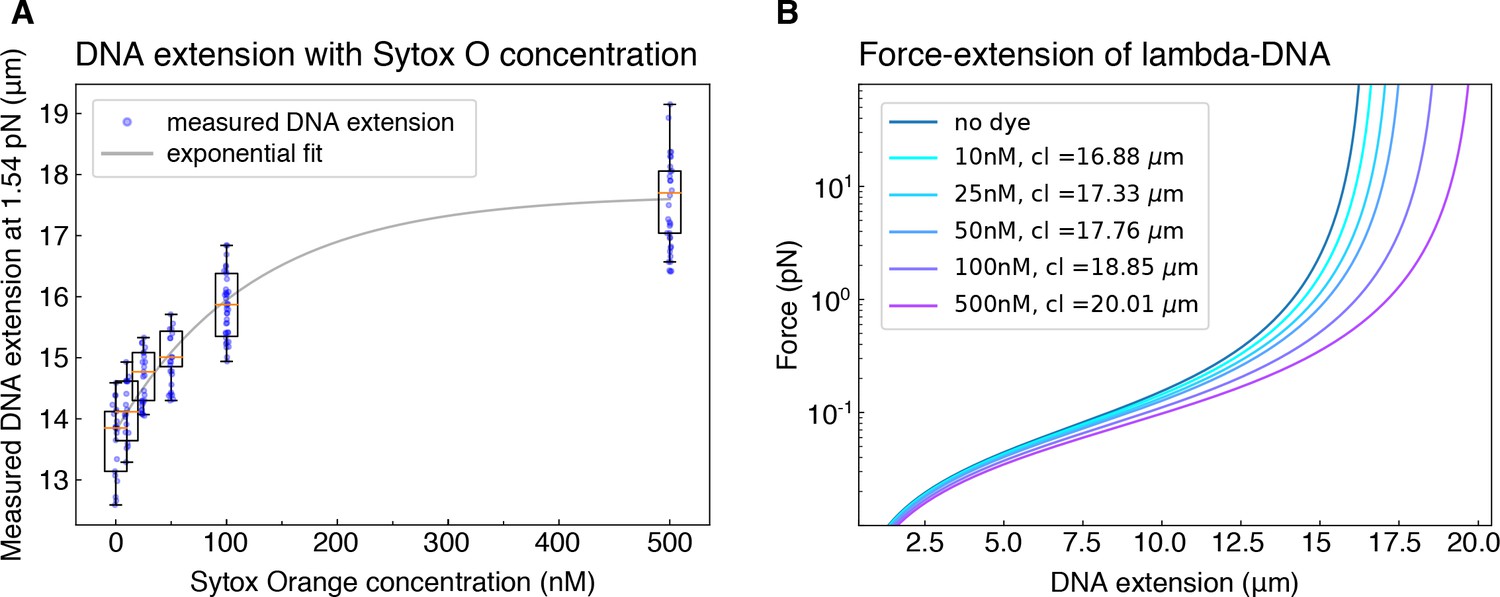
Correction for dye-induced DNA lengthening.
(A) To correct for the concentration-dependent lengthening of DNA by intercalating dye Sytox Orange, we measured the extension (in μm) of DNA molecules that we hydrodynamically stretched using a buffer flow-rate corresponding to a force of 1.54 pN, for all Sytox Orange concentrations employed in the study. The exponential fit to the data serves as a guide to the eye. (B) The corresponding contour lengths (cl) were determined for each dye concentration by applying the worm like chain model (Marko and Siggia, 1995) to the average measured DNA extension at the known stretching force of 1.54 pN.
Figure 2—video 1
Example of hydrodynamically stretched DNA loops in H3-H4-depleted extract arrested in metaphase visualized using Sytox Orange.
The movie duration is 19 s and the scale bar is 5 μm.
Figure 3 with 1 supplement
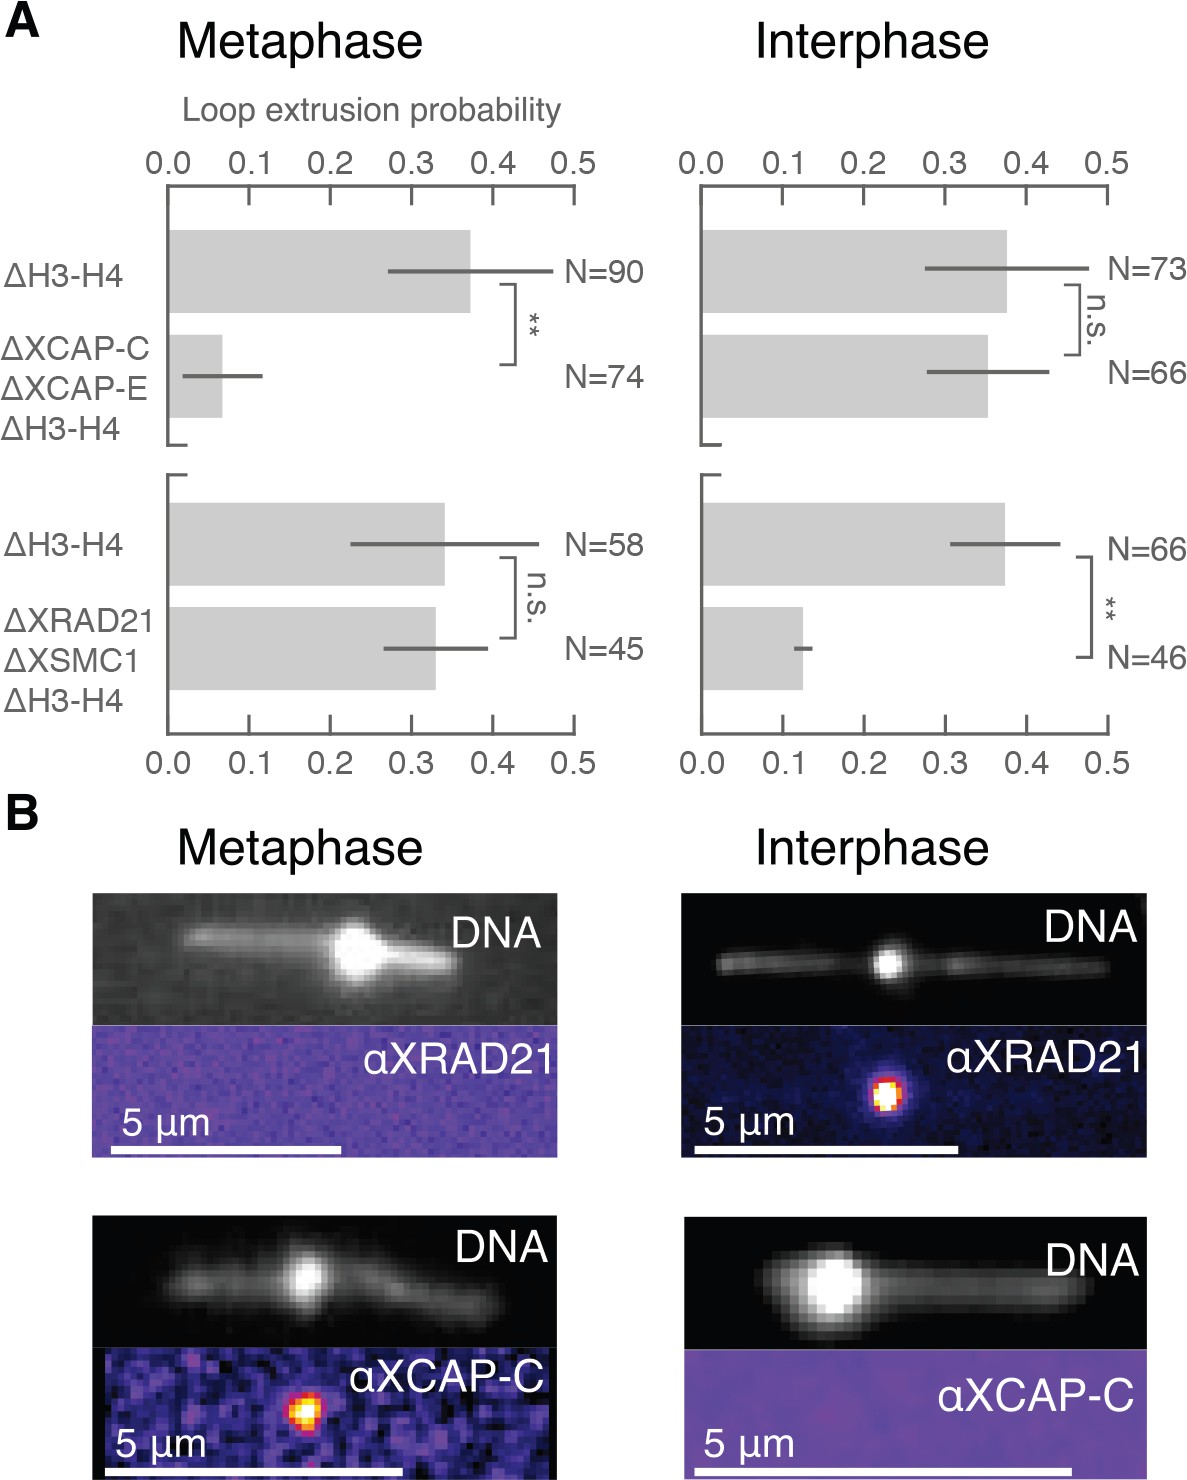
Condensin extrudes DNA loops in metaphase and cohesin extrudes loops in interphase.
(A) DNA loop extrusion probability—the frequency at which looping occurs on a DNA strand with sufficient slack—in metaphase and interphase under different depletion conditions. In metaphase, co-depleting condensin I, condensin II, and H3-H4 (using anti-XCAP-C/E and anti-H4K12Ac) significantly (** represents p<0.01, Binomial test) reduced loop extrusion probability, whereas the same depletion condition in interphase had no effect on loop extrusion probability compared to the control H3-H4-depleted extract. However, co-depleting cohesin and H3-H4 (using anti-XRAD21/XSMC1 and anti-H4K12Ac) had no effect in metaphase, though significantly (p<0.01) decreased loop extrusion probability in interphase compared to H3-H4-depleted extract. (B) Snapshots of antibody stainings of representative loops in metaphase and interphase. (Top) In metaphase, Alexa488-labeled anti-XRad21 bound to cohesin does not localize to the DNA loop, whereas in interphase (right panels), the anti-XRad21 co-localizes to the loop. (Bottom) Alexa488-labeled anti-XCAP-C bound to condensin localizes to the DNA loop in metaphase, but does not localize to the loop in interphase.
Figure 3—figure supplement 1
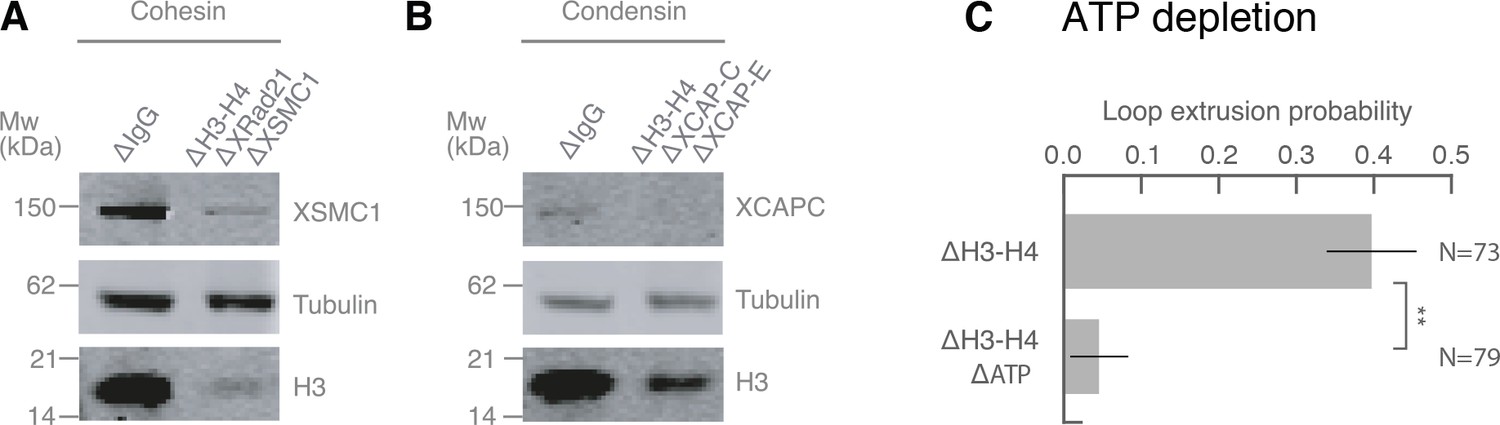
Co-immunodepletions of Xenopus egg extracts using antibodies targeting H3-H4, cohesin, and condensin I and II.
(A) Co-immunodepletion of H3-H4 using anti-H4K12Ac antibodies and cohesin using anti-XRAD21 and anti-XSMC1 antibodies. H3 protein levels are detected using anti-H3 and exhibits a ~ 90–95% depletion of soluble H3-H4 heterodimers compared to IgG-depleted extract. XSMC1 protein levels are detected using anti-XSMC1, which exhibits a ~ 90% depletion. We used anti-DM1a that detects tubulin as a loading control. (B) Co-immunodepletion of H3-H4 using anti-H4K12Ac antibodies and condensin using anti-XCAP-C and anti-XCAP-E antibodies. H3 protein levels are detected using anti-H3 and exhibits a ~ 90% depletion of soluble H3-H4 heterodimers compared to IgG-depleted extract. XCAP-C protein levels are detected using anti-XCAP-C, which displays a ~ 85% reduction, although the signal is rather weak and made it challenging to quantify. We used anti-DM1a that detects tubulin as a loading control. (C) Enzymatic depletion of ATP by apyrase (left) in H3H4-depleted interphase extract greatly reduces loop formation probability compared to control H3H4 depleted interphase extract (right).
Author response image 1
Videos
Video 1
Example of DNA loop formation in H3-H4-depleted egg extract arrested in metaphase visualized using Sytox Orange.
The movie duration is 87 s and the scale bar is 5 μm.
Video 2
Example of DNA loop formation in H3-H4-depleted egg extract in interphase visualized using Sytox Orange.
The movie duration is 80 s and the scale bar is 2 μm.
Additional files
-
Source code 1
DNA-strand analysis.
- https://cdn.elifesciences.org/articles/53885/elife-53885-code1-v2.ipynb
-
Source data 1
Interphase loops raw data.
- https://cdn.elifesciences.org/articles/53885/elife-53885-data1-v2.zip
-
Source data 2
Metaphase loops raw data.
- https://cdn.elifesciences.org/articles/53885/elife-53885-data2-v2.zip
-
Transparent reporting form
- https://cdn.elifesciences.org/articles/53885/elife-53885-transrepform-v2.docx
Download links
A two-part list of links to download the article, or parts of the article, in various formats.
Downloads (link to download the article as PDF)
Open citations (links to open the citations from this article in various online reference manager services)
Cite this article (links to download the citations from this article in formats compatible with various reference manager tools)
Cohesin and condensin extrude DNA loops in a cell cycle-dependent manner
eLife 9:e53885.
https://doi.org/10.7554/eLife.53885


