Histone deacetylase knockouts modify transcription, CAG instability and nuclear pathology in Huntington disease mice
- Center for Genomic Medicine, Harvard Medical School, United States
- Program in Medical and Population Genetics, Broad Institute of MIT and Harvard, United States
- Verna and Marrs McLean Department of Biochemistry and Molecular Biology, Baylor College of Medicine, United States
- Department of Neurology, Massachusetts General Hospital, Harvard Medical School, United States
Abstract
Somatic expansion of the Huntington’s disease (HD) CAG repeat drives the rate of a pathogenic process ultimately resulting in neuronal cell death. Although mechanisms of toxicity are poorly delineated, transcriptional dysregulation is a likely contributor. To identify modifiers that act at the level of CAG expansion and/or downstream pathogenic processes, we tested the impact of genetic knockout, in HttQ111 mice, of Hdac2 or Hdac3 in medium-spiny striatal neurons that exhibit extensive CAG expansion and exquisite disease vulnerability. Both knockouts moderately attenuated CAG expansion, with Hdac2 knockout decreasing nuclear huntingtin pathology. Hdac2 knockout resulted in a substantial transcriptional response that included modification of transcriptional dysregulation elicited by the HttQ111 allele, likely via mechanisms unrelated to instability suppression. Our results identify novel modifiers of different aspects of HD pathogenesis in medium-spiny neurons and highlight a complex relationship between the expanded Htt allele and Hdac2 with implications for targeting transcriptional dysregulation in HD.
Introduction
Huntington’s disease (HD) is a dominantly inherited neurodegenerative disorder typically manifesting in midlife with motor, cognitive, and psychiatric symptoms, leading to death after 15–20 years (Vonsattel et al., 1985; Harper, 1999). HD is caused by the inheritance of an expansion >35 repeats of a polymorphic CAG repeat tract in the HTT gene (Macdonald et al., 1993), ultimately resulting in cellular dysfunction and death, with medium-spiny neurons (MSNs) of the striatum being exquisitely sensitive to this mutation (Vonsattel et al., 1985). The expanded HTT CAG repeat undergoes further time-dependent, CAG length-dependent and tissue/cell-type-dependent expansion (Wheeler et al., 1999; Kennedy and Shelbourne, 2000; Kennedy et al., 2003; Veitch et al., 2007; Gonitel et al., 2008; Swami et al., 2009; Lee et al., 2010; Lee et al., 2011; Kovalenko et al., 2012; Larson et al., 2015; Geraerts et al., 2016; Ament et al., 2017; Mouro Pinto et al., 2020). The repeat is highly unstable in the brain, particularly in MSNs (Kovalenko et al., 2012), with individual-specific differences in the extent of somatic CAG expansion in HD postmortem brain associated with age of onset (Swami et al., 2009). Recent genome-wide association studies (GWAS) for modifiers of HD onset highlight somatic CAG expansion as a key driver of the rate of disease onset (Genetic Modifiers of Huntington’s Disease (GeM-HD) Consortium, 2019). Genetic data from these GWAS as well as extensive cross-tissue analyses of somatic instability (Mouro Pinto et al., 2020) support a two-step model of HD pathogenesis whereby cellular vulnerability is determined by both the rate of somatic CAG expansion and a toxic process(es) triggered by somatically expanded repeats. Thus, a comprehensive understanding of HD pathogenesis will necessitate insight into mechanisms underlying both CAG instability and cellular toxicity.
HD mouse models provide valuable systems in which to identify genetic modifiers. As the two components of the HD pathogenic process outlined above are separable mechanistically, they can be influenced by different modifiers, or by the same modifier via different underlying mechanisms. However, modifiers influencing somatic expansion may also alter downstream phenotypes depending on the sensitivity to detect the impact of altered CAG length. Several DNA repair genes modify somatic CAG expansion in HD mouse models, with mismatch repair (MMR) genes being critical drivers of this process. (Wheeler et al., 2003; Dragileva et al., 2009; Tomé et al., 2013; Pinto et al., 2013; Kovtun et al., 2007; Mollersen et al., 2012). Knowledge of additional modifiers in the mouse is likely to shed insight into underlying mechanisms that are currently unknown, or into ways in which the process might be regulated. For example, local chromatin structure has been suggested to influence repeat instability (Gorbunova et al., 2004; Jung and Bonini, 2007; Libby et al., 2003; Libby et al., 2008; Dion et al., 2008; Yang and Freudenreich, 2010; Nestor and Monckton, 2011; Neto et al., 2017). The precise molecular underpinnings of cellular toxicity also remain to be defined. However, global transcriptional dysregulation and epigenetic alterations have emerged as likely significant contributors to disease pathogenesis (Glajch and Sadri-Vakili, 2015; Sharma and Taliyan, 2015). There is an extensive history of investigating histone deacetylase (HDAC) inhibitors in HD and several studies have shown beneficial effects in HD mouse models (Hockly et al., 2003; Gardian et al., 2005; Thomas et al., 2008; Mielcarek et al., 2011; Jia et al., 2012a; Jia et al., 2012b; Jia et al., 2016; Chopra et al., 2016; Suelves et al., 2017; Siebzehnrübl et al., 2018). Interestingly one study found that a selective HDAC3 inhibitor also reduced CAG expansion in HD mice (Suelves et al., 2017).
Here, with the overarching goal of identifying novel HD modifiers, and with the possibility that epigenetic alterations may contribute both to CAG instability and cellular toxicity processes, we tested the roles of specific histone deacetylases (HDACs) in these different aspects of HD pathogenesis. We have taken a genetic approach using a well-established precise genetic HD knock-in mouse model (HttQ111) (Wheeler et al., 2000) and conditionally deleted either Hdac2 or Hdac3, encoding class I HDACs implicated by previous pharmacological studies, specifically in striatal MSNs. We performed RNA sequencing (RNA-seq) to investigate the impact of MSN-specific Hdac2 knockout on the transcriptome and on gene expression changes elicited by the HttQ111 allele, and tested the effect of MSN-specific Hdac2 and Hdac3 knockout on CAG instability and on nuclear huntingtin pathology, both of which occur selectively in MSNs in these mice (Kovalenko et al., 2012; Wheeler et al., 2000).
Results
MSN-specific knockout of Hdac2 and Hdac3 in HttQ111 knock-in mice
To investigate the role of HDACs in HttQ111 mice we took a genetic approach, focusing on two Class I HDACs, HDAC2 and HDAC3, due to previous interest in therapeutic targeting of this class of HDACs in HD (Glajch and Sadri-Vakili, 2015) and the relatively high expression levels of these HDACs in the striatum and in neurons (Broide et al., 2007). As constitutive genetic knockout of Hdac2 can result in perinatal lethality (Trivedi et al., 2007; Montgomery et al., 2007), and knockout of Hdac3 results in early embryonic lethality (Montgomery et al., 2008), we took advantage of conditional ‘floxed’ Hdac2 and Hdac3 alleles (Montgomery et al., 2007; Montgomery et al., 2008), and deleted each of these genes in striatal MSNs of heterozygous HttQ111/+ mice in crosses together with ‘DARPP-32 Cre’ (D9-Cre) transgenic mice expressing Cre recombinase under the control of the Ppp1r1b gene promoter and regulatory elements from 5 to 6 weeks of age (Bogush et al., 2005; Figure 1A; Figure 1—figure supplement 1). We previously used these mice in a similar strategy to delete the Msh2 gene in MSNs (Kovalenko et al., 2012). We generated HttQ111/+ or Htt+/+ mice harboring two floxed Hdac2 or Hdac3 alleles together with the D9-Cre transgene, resulting in deletion of the Hdac2 or Hdac3 alleles in MSNs (Hdac2 or Hdac3 knockout [KO]) and their littermates expressing both Hdac2 or Hdac3 alleles (Hdac2 WT or Hdac3 WT). HDAC2 or HDAC3 protein are no longer detectable in the majority of the striatal cells in Hdac2 KO or Hdac3 KO mice (Figure 1B). The remaining HDAC2- or HDAC3-immunopositive cells are DARPP-32 negative, reflecting continued expression in cell types other than MSNs in the striatum (Figure 1B). Western blots also confirmed the loss of HDAC2 protein in striata from Hdac2 KO mice and revealed a compensatory increase in HDAC1 protein levels as seen in other systems with long-term loss of HDAC2 (Figure 1—figure supplement 2). As expected, HDAC2 and HDAC3 expression were not altered in the cortex (Figure 1—figure supplement 3). Whereas Hdac2 ΚO mice appeared indistinguishable from their littermates, Hdac3 ΚO mice were significantly smaller in size and had lower body weight, with more than half of the total number of Hdac3 ΚO pups not surviving to five months of age, precluding some aspects of this study; notably, we were unable to generate sufficient numbers of Hdac3 KO mice to perform RNA-seq. We hypothesize that this may be the result of Ppp1r1b-driven Cre expression in cell types outside MSNs during development and/or in the periphery that are sensitive to levels of HDAC3, for example in the gut or liver (Alenghat et al., 2013; Knutson et al., 2008). Nonetheless, this observation highlights the non-redundant functions of HDAC2 and HDAC3 within the mammalian body.
Figure 1 with 3 supplements see all
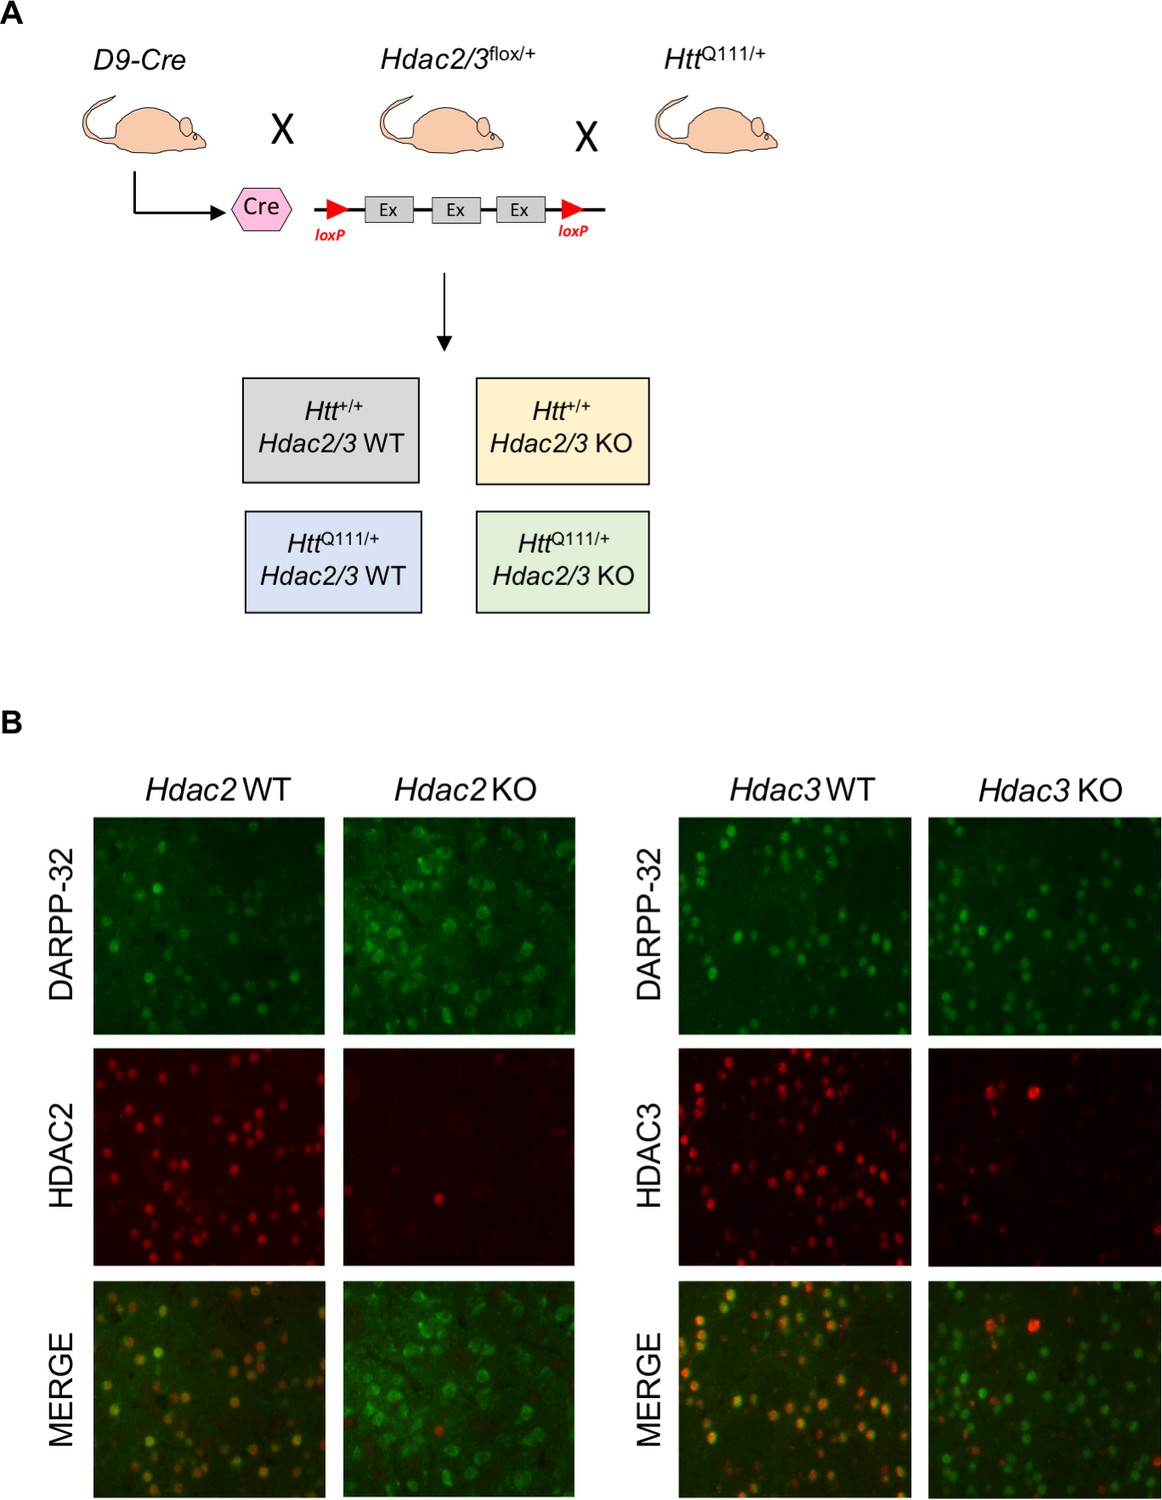
MSN-specific deletion of Hdac2 or Hdac3.
(A) D9-Cre mice, expressing Cre recombinase from the Ppp1r1b promoter from 5 to 6 weeks of age, were crossed with floxed Hdac2 or Hdac3 mice (schematic illustrates exons flanked by loxP sites), and with HttQ111/+ mice to obtain mice with or without a single HttQ111 allele either expressing HDAC2/3 (WT) or with Hdac2 or Hdac3 allele deleted in MSNs (KO). See Figure 1—figure supplement 1 for a detailed breeding scheme. (B) Fluorescent micrographs of 10 week HttQ111/+ Hdac2 KO (left) and HttQ111/+ Hdac3 KO (right) striata co-stained with DARPP-32/HDAC2 and DARPP-32/HDAC3 antibodies, respectively.
Impact of MSN-specific Hdac2 knockout and of the HttQ111 allele on the transcriptome
Due to the central role of HDAC2 in regulating transcription (Kelly and Cowley, 2013) and previous evidence for a beneficial effect of HDAC inhibitors in HD mouse models, we first performed RNA-seq in the Hdac2 KO cohort to assess both the global impact of MSN-specific Hdac2 KO and the extent to which genes dysregulated by the expression of the HttQ111 allele might be reversed. Transcriptional dysregulation occurs in HttQ111/+ mice by 2–6 months of age (Ament et al., 2017; Langfelder et al., 2016; Bragg et al., 2017). We performed RNA-seq in striata from 5-month Htt+/+ Hdac2 WT, HttQ111/+ Hdac2 WT, Htt+/+ Hdac2 ΚO and HttQ111/+ Hdac2 ΚO mice (Figure 2). HttQ111/+ mice with Hdac2 WT and Hdac2 KO genotypes were matched for constitutive CAG repeat lengths (Source data 1). Analyses of exon-specific Hdac2 transcripts revealed marked depletion of reads mapping to exons 2, 3, and 4 as well as the presence of exon 1-exon 5 splice junction reads in the Hdac2 ΚO mice, consistent with Cre-mediated deletion of exons 2–4 (Montgomery et al., 2007), and further supported by detection of Cre-specific transcripts in these mice (Figure 2—figure supplement 1). Analyses of transcript levels of other Hdac genes revealed a compensatory increase in Hdac1 transcripts in Hdac2 ΚO striata, consistent with western blots from the same mice (Figure 1—figure supplement 2), but no major impact on the expression level of any other Hdac gene (Figure 2—figure supplement 1). The HttQ111 allele did not alter expression of Hdac genes (Figure 2—figure supplement 1), consistent with previous observations that the HTT mutation does not influence HDAC expression in primary neurons, or in CAG140 knock-in mice, although expression of some HDACs was altered in R6/2 exon 1 transgenic mice (Hoshino et al., 2003; Quinti et al., 2010). Principal component analysis (PCA) of the full dataset revealed that the greatest variance between samples was attributable to Hdac2 genotype, with the second principal component largely separating males and females. There was no clear distinction between samples based on Htt genotype (Figure 2—figure supplement 2). Global levels of striatal H3K9 and H4K12 acetylation, previously shown to be sensitive to HDAC2 levels in the brain (Guan et al., 2009), revealed overall fairly subtle alterations that appeared to depend on age (Figure 2—figure supplement 3), consistent with cell-type-specific knockout of Hdac2 and previous observations that the effects of HDAC inhibition on histone acetylation are restricted to specific genomic loci (Lopez-Atalaya et al., 2013).
Figure 2 with 4 supplements see all
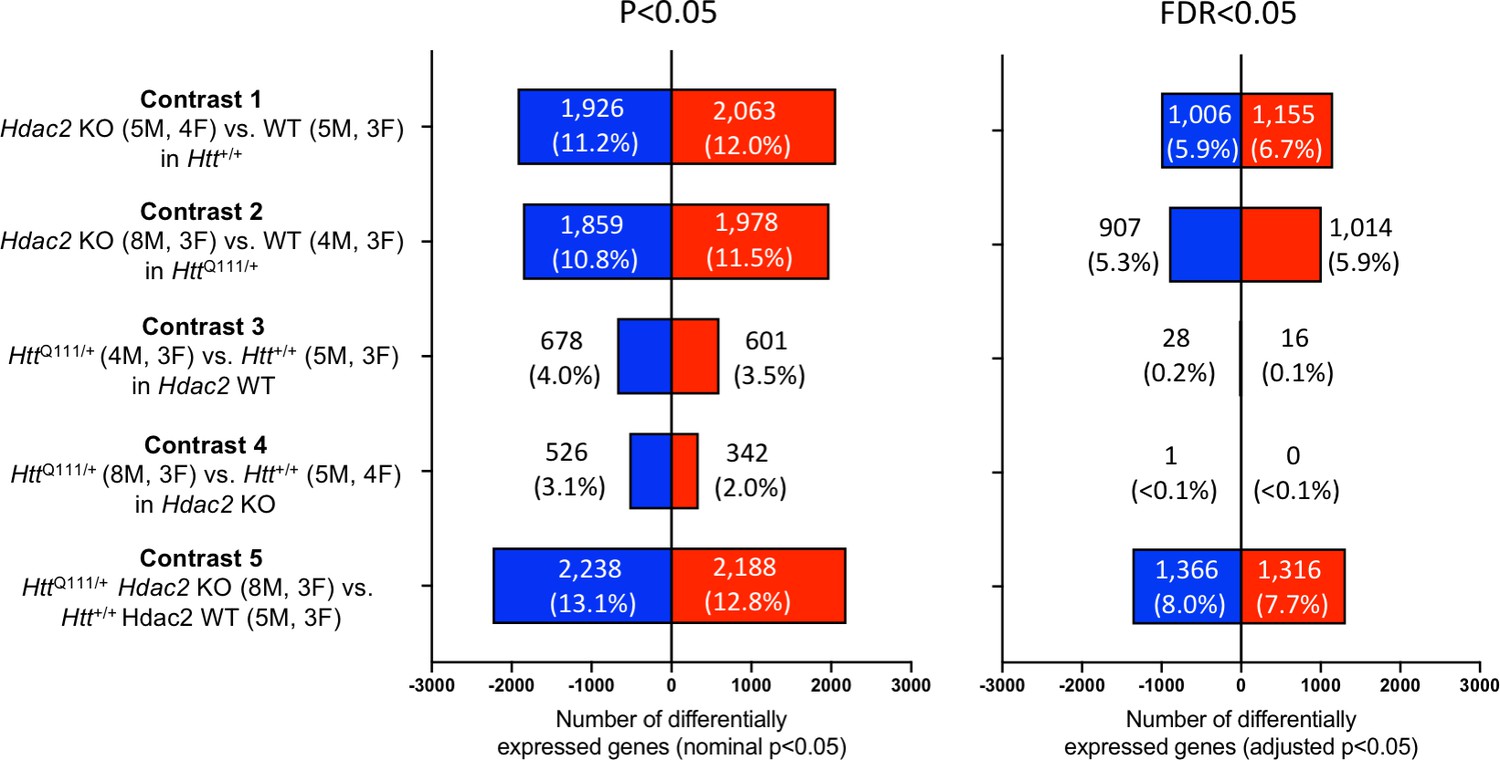
RNA-seq analyses in HttQ111 striata with MSN-specific Hdac2 knockout.
Results of differential gene expression analyses showing the number of differentially expressed genes (DEGs) for each of five contrasts. Number and % of DEGs at nominal p<0.05 or FDR adjusted p<0.05 are indicated. Total number of genes analyzed: contrast 1 = 17,132; contrast 2 = 17,175; contrast 3 = 17,139; contrast 4 = 17,116; contrast 5 = 17,094. The number of male (M) and female (F) mice in each group is indicated.
To assess the impact of the two genetic mutations (Hdac2 KO and HttQ111) on the transcriptome we performed differential gene expression analyses to test the effects of the MSN-specific Hdac2 KO in the Htt+/+ background (contrast 1), or the HttQ111/+ background (contrast 2), and the effects of the HttQ111 allele in a Hdac2 WT background (contrast 3) or the Hdac2 KO background (contrast 4). We also compared HttQ111/+ Hdac2 KO and Htt+/+ Hdac2 WT striata (contrast 5) (Figure 2; Source data 2). Figure 2 displays the number of differentially expressed genes (DEGs) in each of the differential gene expression contrasts. Strikingly, knockout of Hdac2 in MSNs elicited a substantial transcriptional response, roughly comparable in Htt+/+ or HttQ111/+ mice, with ~11–12% of genes statistically significantly dysregulated (FDR adjusted p<0.05) and being both up- and down-regulated in approximately equal proportion. In line with previous studies (Ament et al., 2017; Langfelder et al., 2016; Bragg et al., 2017), HttQ111/+ striata exhibited a large number of genes that were both up- and down-regulated, although only a moderate number reached statistical significance when accounting for multiple testing. Interestingly, the transcriptional dysregulation mediated by the HttQ111 allele appeared to be somewhat muted in the Hdac2 knockout background (Figure 2- compare contrasts 3 and 4). The comparison of HttQ111/+ Hdac2 KO and Htt+/+Hdac2 WT striata indicated an effect similar in magnitude to that of the Hdac2 KO mutation alone.
We compared the HttQ111-DEGs in this study with those in striata of heterozygous HttQ111/+ mice in a previous study by Langfelder et al., 2016. In the Langfelder study, heterozygous HttQ111/+ mice were analyzed as part of a larger allelic series of Htt CAG knock-in mice; here, we reanalyzed the Langfelder data comparing HttQ111/+ to wild-type striata using the same analysis method used in the current study (Figure 2—figure supplement 4; Materials and methods). A large proportion of gene expression changes in the current study overlapped with those in the Langfelder dataset, although many more DEGs were identified in the latter (Figure 2—figure supplement 4A, B). Differences may be due to the age of the mice - 5 months in current study and 6 months in the Langfelder study – especially considering the dramatic increase in transcriptional dysregulation that occurs between 2 and 6 months of age (Langfelder et al., 2016). In addition, factors such as genetic heterogeneity (Materials and methods) and disproportionate male:female ratios of mice in our study may contribute to reduced power to detect HttQ111- driven transcriptional changes. Importantly, the vast majority of the common genes were dysregulated in the same direction (Figure 2—figure supplement 4B); at a nominal p value of < 0.05, 721 genes were coordinately dysregulated (298 up-regulated in both studies and 433 down-regulated in both studies). Correcting for multiple testing (FDR adjusted p<0.05), 29 genes were coordinately dysregulated (11 up-regulated in both studies and 18 down-regulated in both studies). These 29 genes are displayed in Figure 2—figure supplement 4C, highlighting several genes including Ppp1r1b, Penk and Pde10a also found to be dysregulated in HttQ111/+ mice in additional previous studies (Ament et al., 2017; Bragg et al., 2017). We refer to these 29 genes as ‘commonly dysregulated genes’ in downstream analyses.
Overlaps in gene dysregulation elicited by the Hdac2 KO and the HttQ111 allele
To gain insight into the transcriptionally dysregulated genes in each of the four contrasts we determined the enrichment of the DEGs in biological pathways (Figure 3; Source data 3). These analyses revealed that the Hdac2 KO and HttQ111 mutations altered a number of shared processes and pathways. For example, pathways related to cell adhesion, plasma membrane, calcium ion binding and morphine addiction were amongst the most significantly up-regulated in response to either the Hdac2 KO mutation (Figure 3, contrast 1) or the HttQ111 allele (Figure 3, contrast 3). Broadly, pathways related to neuronal function were down-regulated in both in Hdac2 KO striata and HttQ111/+ striata, although the nature of these pathways was somewhat different, for example an enrichment for signaling pathways in HttQ111/+ striata and for pathways related to neuronal and synapse structure in the Hdac2 KO. To gain further insight into commonalities between the impacts of Hdac2 KO and HttQ111 mutations on transcriptional dysregulation we determined the overlaps in the DEGs and in the pathways enriched for DEGs elicited by the two mutations (i.e. overlap between contrasts 1 and 3) (Figure 3—figure supplement 1, yellow highlighted cells). There was a highly significant overlap in the DEGs and enriched pathways due to the Hdac2 KO or the HttQ111 allele, largely reflecting overlaps in DEGs and enriched pathways altered in the same direction, i.e. up- or down-regulated in both conditions (statistical tests of enrichment were performed using one-sided Fisher exact tests – see Materials and methods, and results are shown in Figure 3—figure supplement 1C). We also compared the effect of the Hdac2 KO in the presence and absence of the HttQ111 allele (Figure 3, contrasts 1 and 2). There were highly significant overlaps in the DEGs and enriched pathways altered in the same direction between two contrasts (Figure 3—figure supplement 1; pink highlighted cells). Finally, we compared the effect of the HttQ111 allele in the presence and absence of the Hdac2 KO mutation (Figure 3, contrasts 3 and 4). The pathways downregulated by the HttQ111 allele in the Hdac2 KO mice again largely encompassed those involved in neuronal function, whilst the most significantly upregulated pathways highlighted the extracellular matrix rather than cell adhesion pathways that were predominantly upregulated by the HttQ111 allele on the Hdac2 WT background. Again, there were significant overlaps in DEGs and enriched pathways that were altered in the same direction by the HttQ111 allele in Hdac2 WT and KO conditions (Figure 3—figure supplement 1, blue highlighted cells).
Figure 3 with 1 supplement see all
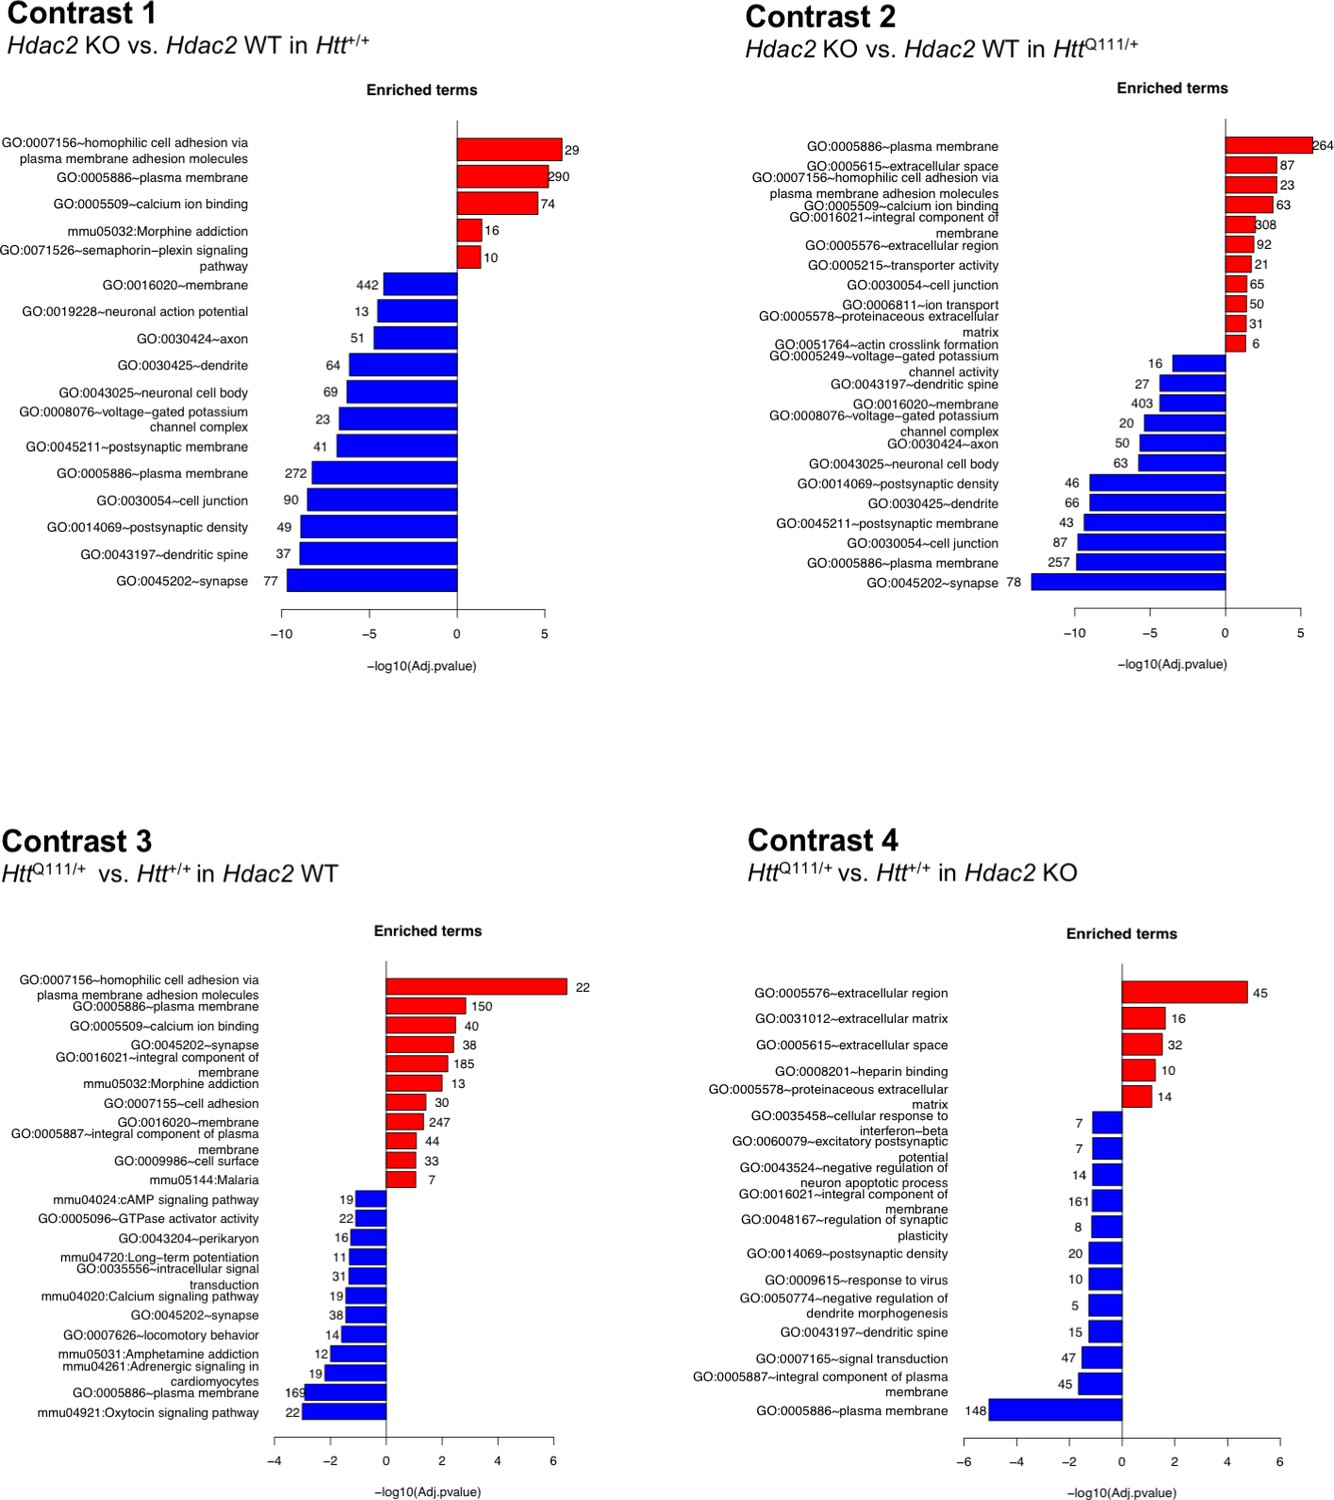
Pathway enrichment of differentially expressed genes.
The most significantly enriched pathways that are up- or down-regulated in each of four differential gene expression contrasts are shown. Numbers at the end of each bar show the number of genes represented in each pathway. For contrasts 1 and 2, DEGs used in the pathway analyses met the FDR < 0.05 threshold; for contrasts 3 and 4 DEG genes had a nominal p<0.05. The full set of pathways analyses is provided in Source data 2.
It should be noted that a direct comparison of gene dysregulation elicited by the HttQ111 allele and Hdac2 KO is complicated by the fact that the HttQ111 allele is constitutively expressed whereas the Hdac2 KO mutation is specific to striatal MSNs. Nevertheless, taken together, the results of our differential gene expression analyses, pathway enrichment and overlap analyses indicate that: (1) Genes and pathways can be dysregulated in the same direction by either the HttQ111 allele or the Hdac2 KO mutation; (2) There is substantial overlap in gene dysregulation by the Hdac2 KO mutation in the presence or absence of the HttQ111 allele, and vice versa. (3) The impact of one mutation depends in part on the presence of the other.
A subset of genes dysregulated in HttQ111/+ striata is reversed by knockout of Hdac2 in MSNs
We were interested to determine the extent to which HttQ111-dysregulated genes might be reversed by the MSN-specific Hdac2 KO. However, given the overlap in gene dysregulation elicited by either the HttQ111 allele or the Hdac2 KO (Figure 3; Figure 3—figure supplement 1) we wondered whether HttQ111-dysregulated genes might in fact be further changed in the same direction by the Hdac2 KO. To assess this, we first determined the set of genes that was dysregulated both in the comparison of HttQ111/+ vs. Htt+/+ striata in the Hdac2 WT background (contrast 3) and in the comparison of Hdac2 KO vs. Hdac2 WT striata in the HttQ111/+ background (contrast 2) (Figure 4A, left table; Figure 3—figure supplement 1, green highlighted cells, Source data 4). We identified 520 DEGs common to both comparisons applying a nominal p value < 0.05 to each differential gene expression analysis, while 17 were common to both comparisons applying an FDR-adjusted p value<0.05. The overlapping genes included both those that changed in opposite directions, i.e. up-regulated by HttQ111 and then down-regulated by Hdac2 KO and vice versa, and those that changed in the same direction. The former (69 up-regulated by HttQ111 and down-regulated by Hdac2 KO plus 144 down-regulated by HttQ111 and up-regulated by Hdac2 KO) comprise 17% of all HttQ111-dysregulated genes (p<0.05), indicating possible rescue. The latter (158 up-regulated and 149 down-regulated by HttQ111 and by Hdac2 KO in HttQ111 striata) comprise ~24% of all HttQ111-dysregulated genes (p<0.05), indicating a sizeable proportion of genes for which the HttQ111-mediated dysregulation is exacerbated by the Hdac2 KO. Therefore, it appears that gene dysregulation elicited by the HttQ111 allele can be both exacerbated and reversed by Hdac2 KO.
Figure 4 with 1 supplement see all
Rescue by Hdac2 KO of gene expression levels of a subset of genes dysregulated by the HttQ111 allele.
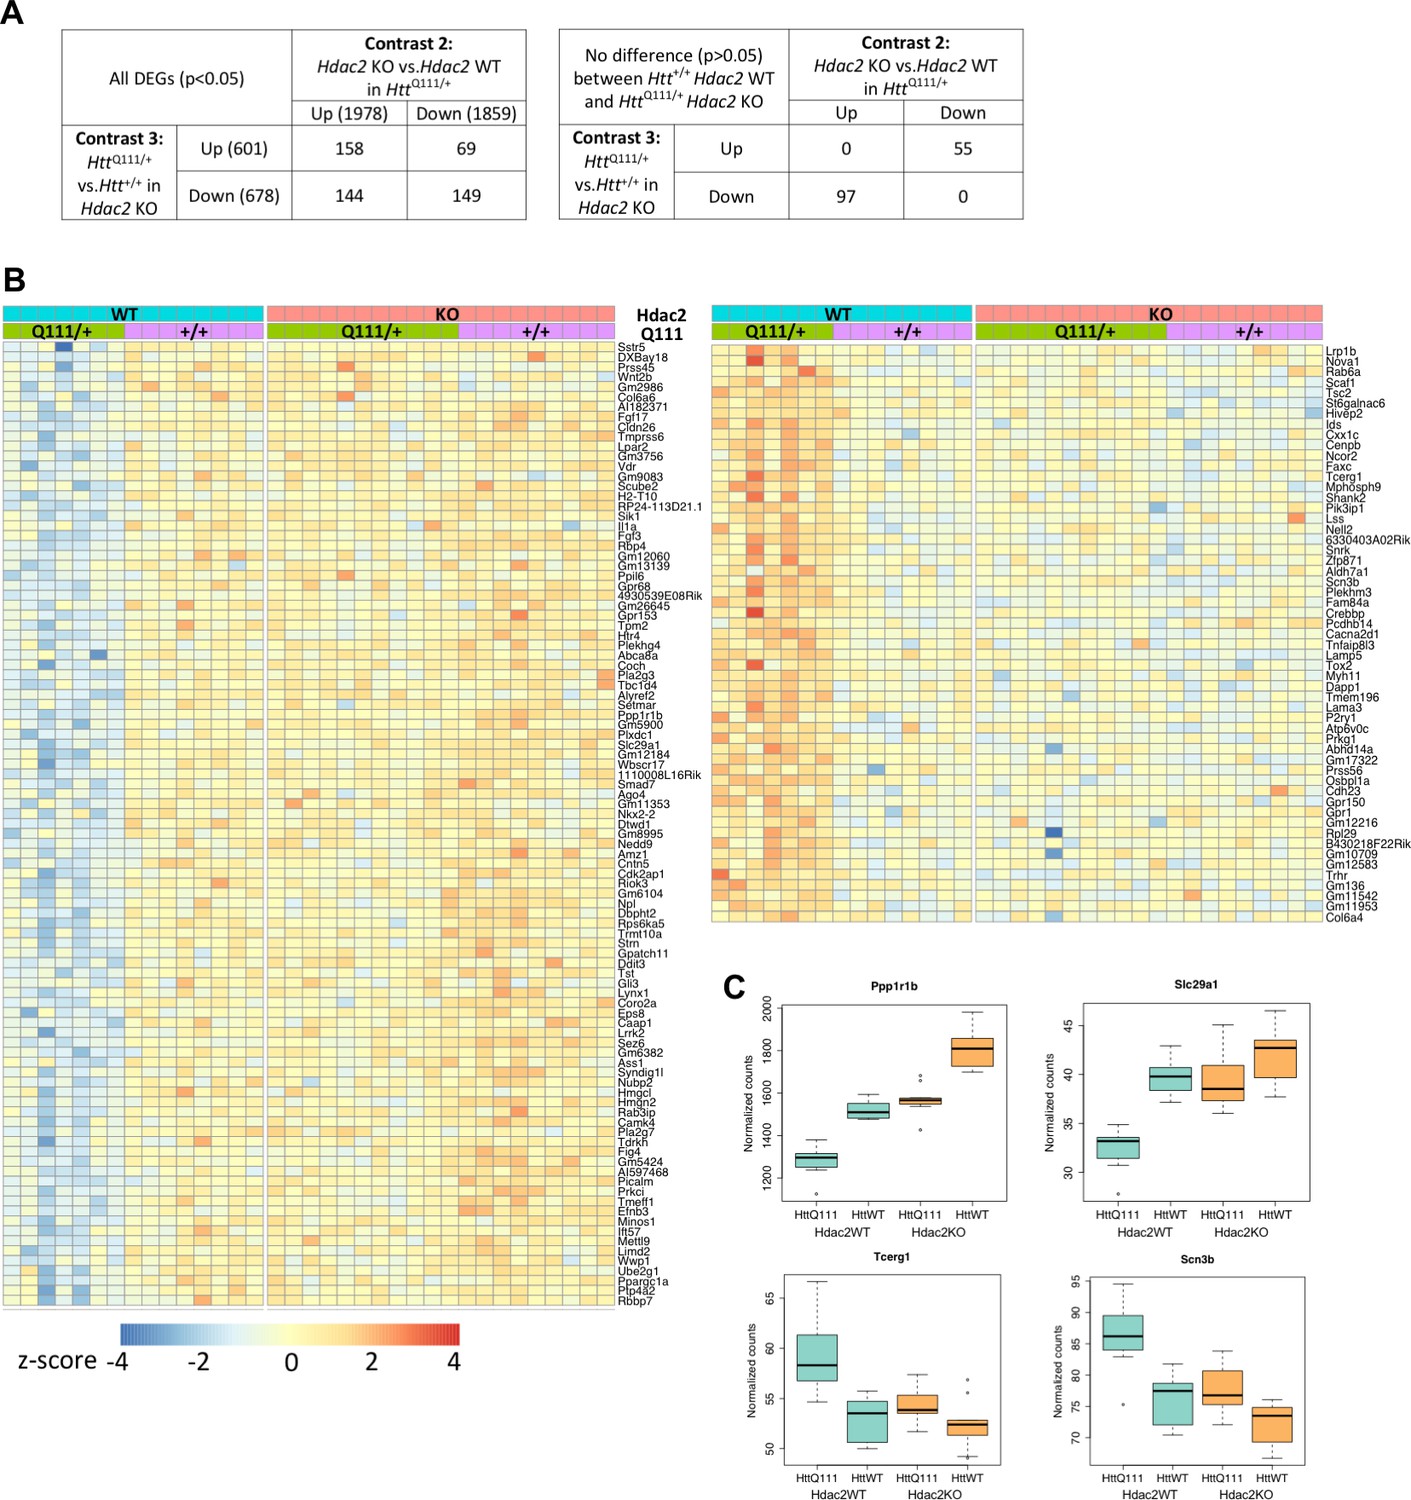
(A) To identify genes dysregulated by the HttQ111 allele and by Hdac2 KO in HttQ111/+ mice, the overlapping genes in contrasts 3 and 2 were identified (left table). This shows the numbers of genes (p<0.05) up-regulated by HttQ111 and either further up-regulated, or down-regulated by Hdac2 KO in HttQ111/+ mice, and the numbers of genes down-regulated by HttQ111 and either further down-regulated, or up-regulated by Hdac2 KO in HttQ111/+ mice. To identify HttQ111-dysregulated genes whose expression level was normalized by Hdac2 KO, genes from the contrast 3/2 overlap whose expression level did not differ significantly (p>0.05) between Htt+/+ Hdac2 WT and HttQ111/+ Hdac2 KO striata were identified (right table). (B) Heat map of the 97 genes down-regulated by HttQ111 and up-regulated by Hdac2 KO in HttQ111/+ striata and of the 55 genes up-regulated by HttQ111 and down-regulated by Hdac2 KO in HttQ111/+ striata, whose expression levels did not differ significantly between Htt+/+ Hdac2 WT and HttQ111/+ Hdac2 KO. (C) Examples of four such genes, two down-regulated by HttQ111 and two up-regulated by HttQ111 are displayed as box-plots.
To investigate reversal of HttQ111-mediated dysregulation by Hdac2 KO we performed t-tests on the 520 overlapping genes to define genes whose expression level did not differ significantly (p>0.05) between Htt+/+ Hdac2 WT and HttQ111/+ Hdac2 KO striata. i.e. reversion of gene expression to wild-type in the presence of both mutant alleles (Figure 4A, right table). 152 genes had expression levels that did not differ significantly between these two genotypes, of which 97 were down-regulated by HttQ111 and up-regulated by Hdac2 KO and 55 were up-regulated by HttQ111 and down-regulated by Hdac2 KO (Figure 4B, lower table, Source data 4). These genes represent ~12% of the total number of HttQ111-dysregulated genes (p<0.05). Note that a far greater number of genes did show significant differences in expression between Htt+/+ Hdac2 WT and HttQ111/+ Hdac2 KO striata (Figure 2, contrast 5). Gene expression values for these 152 genes across all four genotypes are displayed as a heat map in Figure 4B, highlighting the comparable gene expression levels in Htt+/+ Hdac2 WT and HttQ111/+ Hdac2 KO striata (middle two panels) for both HttQ111/+ down-regulated genes (left hand heat map) and HttQ111/+ up-regulated genes (right hand heat map). Also apparent are effects of the Hdac2 KO on these genes in Htt+/+ striata (compare second and fourth panels), though to a lesser degree than in HttQ111/+ striata. Examples of two of these HttQ111 down-regulated genes and two HttQ111-up-regulted genes are displayed as box-plots in Figure 4C. Of interest, one of these genes is Tcerg, a candidate human onset modifier (Genetic Modifiers of Huntington’s Disease (GeM-HD) Consortium, 2019).
We further specifically examined the impact of Hdac2 KO on the 29 genes (Figure 2—figure supplement 4) commonly dysregulated (FDR adjusted p<0.05) in the current study and in the Langfelder study (Figure 4—figure supplement 1) Two of these 29 genes (Ppp1r1b and Slc29a1) overlapped with the set of 152 genes whose expression level did not differ between Htt+/+ Hdac2 WT and HttQ111/+ Hdac2 KO (Figure 4D; Figure 4—figure supplement 1A). An additional 13 (Cd200, Dmkn, Dsg, Gpd1, Inpp5j, Myo5c, Pdp1, Ppp4r4, Ptprh, Ptprv, Sbsn, Syp, and Vill) overlapped with the set of 520 genes whose expression level was altered by HttQ111 and by Hdac2 KO in HttQ111 mice, but for which the HttQ111-mediated gene dysregulation was not normalized by Hdac2 KO in HttQ111 mice. For the majority of these genes, Hdac2 KO altered gene expression in the same direction as the HttQ111 allele, indicating an exacerbation of the HttQ111-mediated dysregulation (Figure 4—figure supplement 1B). For 14 of the 29 commonly HttQ111-dysregulated genes (B3gnt2, C4a, Foxp4, Gpr6, Homer1, Lrrtm4, Myadm, Ndst3, Olfm3, Pde10a, Penk, Rgs9, Trpv2, Vrk1), their expression level was not further altered by the Hdac2 KO (Figure 4—figure supplement 1C).
Interestingly, we noticed that in these 29 commonly dysregulated genes, the relative impact of the HttQ111 allele was reduced in Hdac2 KO mice. i.e. the difference in gene expression between HttQ111/+ and Htt+/+ is less in Hdac2 KO than in Hdac2 WT striata (Figure 4—figure supplement 1). To better visualize this, we plotted the absolute log 2-fold change (i.e. log2 fold-change regardless of the direction of change) between HttQ111/+ and Htt+/+ for each of these genes in Hdac2 WT mice and in Hdac2 KO mice (Figure 5), highlighting the reduced fold-change for each of these genes in the Hdac2 KO, though to different degrees. Permutation (Materials and methods) showed a statistically significant enrichment for a reduced relative impact (absolute log2 fold-change) of the HttQ111 allele in the Hdac2 KO in these 29 genes (p<1e-5).
Figure 5
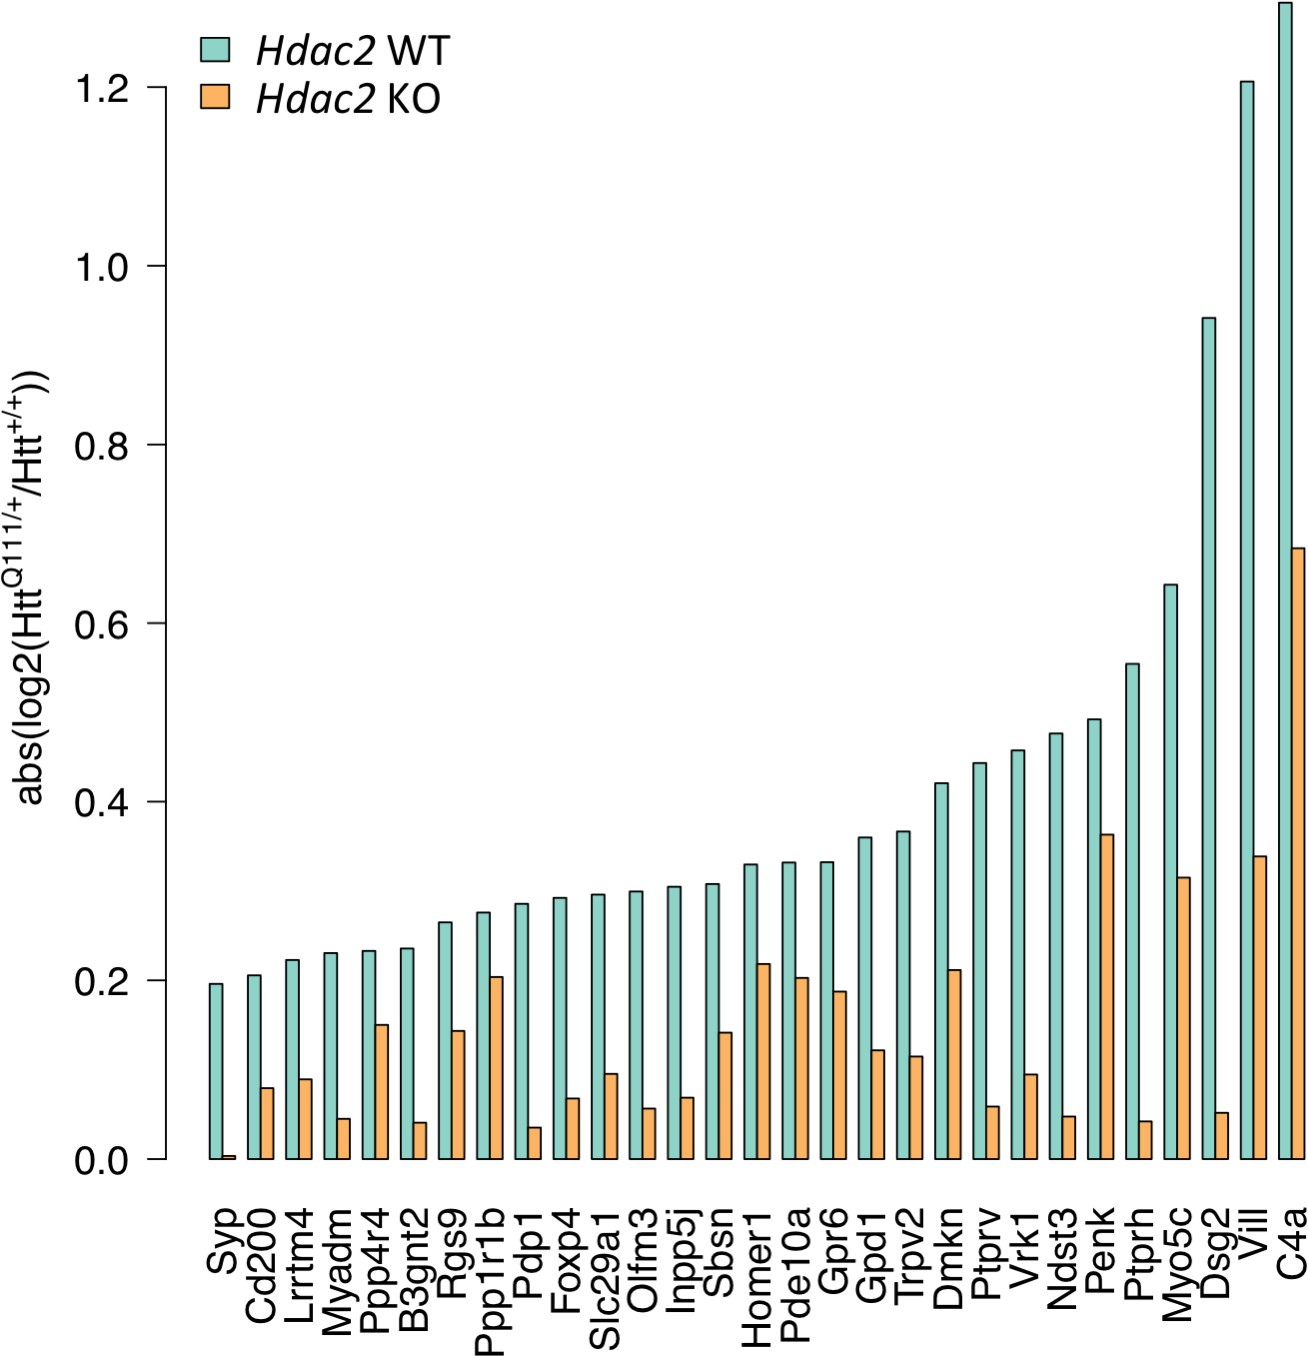
Hdac2 KO reduces the relative impact of the HttQ111 allele.
Absolute log2 fold-change of gene expression differences between HttQ111/+ and Htt+/+ were determined in Hdac2 WT mice and in Hdac2 KO mice as a measure of gene expression change regardless of direction of effect. x-axis indicates the set of 29 genes significantly dysregulated by HttQ111 (FDR adjusted p<0.05) in both this study and in Langfelder et al., 2016; Figure 2—figure supplement 4; Figure 4—figure supplement 1.
We therefore observe the following: (1) The absolute expression levels of a subset of HttQ111-dysregulated genes are effectively normalized in HttQ111 mice harboring the Hdac2 KO mutation to levels present in wild-type mice, suggesting rescue of these gene expression changes; (2) The normalization of absolute expression levels of a subset of HttQ111-dysregulated genes occurs in a substantially larger background of gene dysregulation elicited by the Hdac2 KO; (3) In addition, and apparent in a set of the most significantly HttQ111-dysregulated genes, Hdac2 KO lessens the relative impact of the HttQ111 mutation, regardless of the absolute effect of the Hdac2 KO on the level of gene expression. Taken together, our results indicate a potentially complex relationship between Hdac2 KO and the HttQ111 mutation.
Hdac2 and Hdac3 modify CAG expansion in HttQ111 knock-in mice
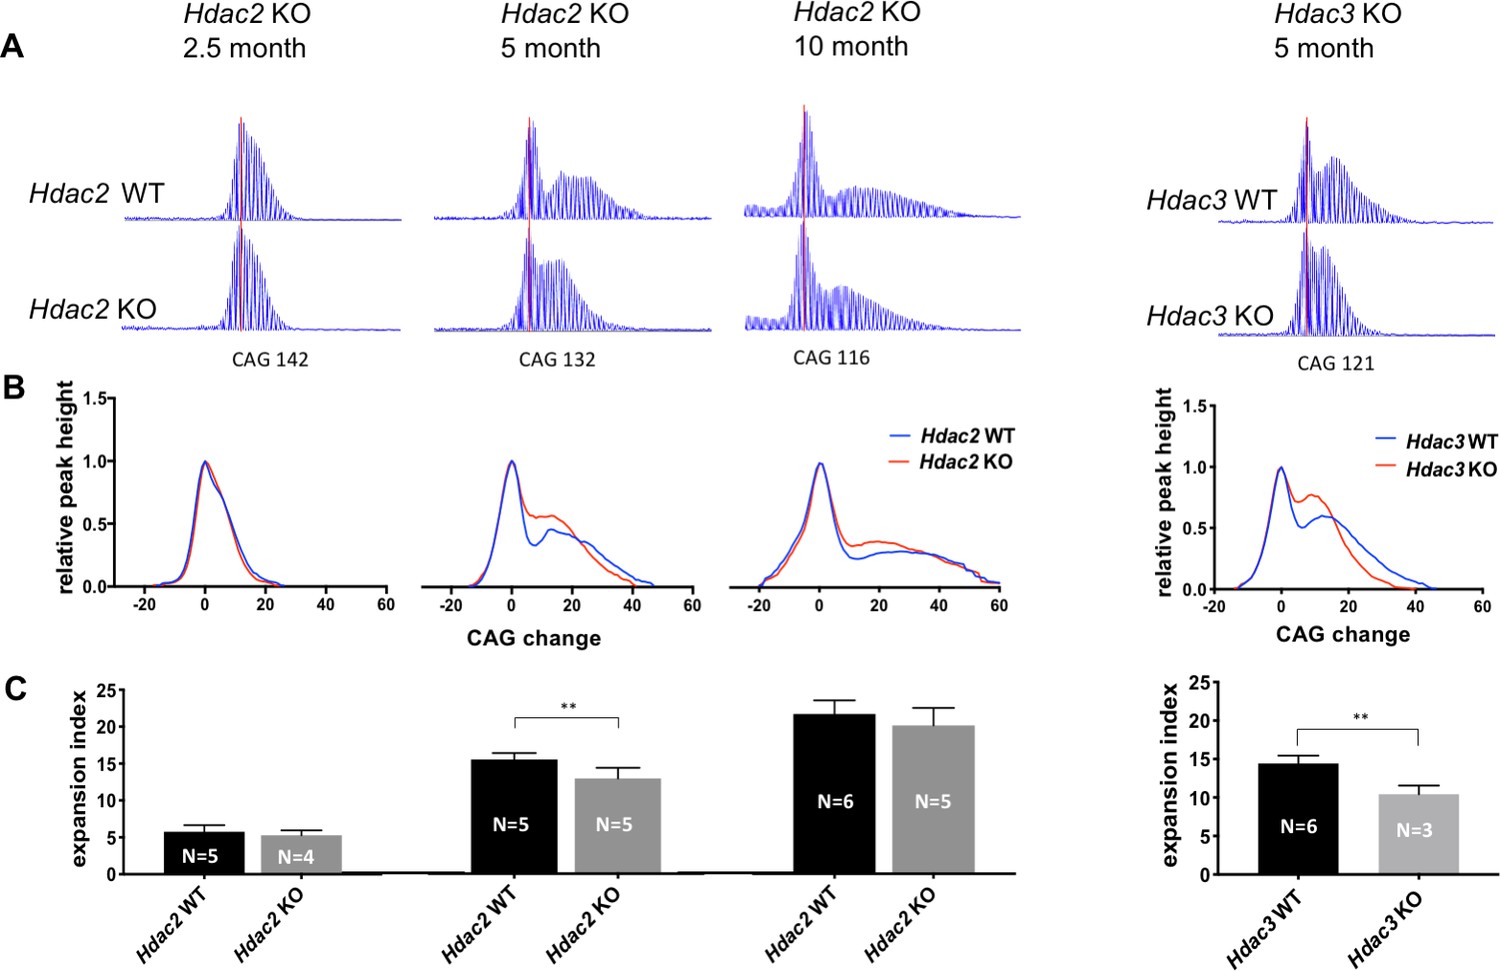
We next tested the impact of MSN-specific Hdac2 or Hdac3 KO on CAG expansion to determine whether these genes might be involved in the mechanism that drives the rate of phenotypic onset in this vulnerable cell population. We analyzed and quantified CAG striatal expansions in ABI GeneMapper traces of HTT CAG repeat-containing PCR products from cohorts of HttQ111/+ Hdac2 ΚO mice at 2.5, 5, and 10 months of age and from HttQ111/+ Hdac3 KO mice at 5 months of age (Figure 6). This analysis provides a measure of repeat length distribution across the entire population of striatal cells, and as MSNs contribute to the majority of the unstable alleles at the ages analyzed, it is sensitive to changes in repeat length that are confined to MSNs as shown previously (Kovalenko et al., 2012). Shown are representative raw GeneMapper traces (Figure 6A) and normalized GeneMapper data, averaged per genotype, showing the height of each peak and the change in CAG length relative to those of the main (modal) allele (Figure 6B). We determined an expansion index (Lee et al., 2010) from the GeneMapper data, a measure incorporating both the relative height and distance from the main allele of the expansion peaks representing the mean repeat expansion in the cell population (Figure 6C). Mean CAG lengths were matched between genotypes for each cohort (Source data 1). At 2.5 months of age, we observed a subtle decrease in expansion index in Hdac2 ΚO striata that was not statistically significant (Hdac2 WT: mean 5.76, 95% CI [4.64, 6.88]; Hdac2 KO: mean 5.29, 95% CI [4.23,6.35]; two-tailed unpaired t-test p=0.42). At 5 months of age the expansion index was significantly reduced in Hdac2 ΚO striata (Hdac2 WT: mean 15.22, 95% CI [14.16, 16.28]; Hdac2 ΚO: mean 12.69, 95% CI [10.91, 14.47]; 2-tailed unpaired t-test p=0.0094), while at 10 months of age, we again observed a small reduction in expansion in Hdac2 ΚO striata; this was most apparent from the GeneMapper traces of closely CAG repeat-matched mice (panel A), though this did not reach statistical significance (Hdac2 WT: mean 21.55, 95% CI [19.62–23.48]; Hdac2 ΚO: mean 20.02, 95% CI [17.1–22.94]; two-tailed unpaired t-test p=0.26) across this cohort of mice with a wide range of CAG lengths (Source data 1). Knockout of Hdac3 in MSNs also decreased the expansion index in the striata of 5 month mice (Hdac3 WT: mean 13.94, 95% CI [12.81–15.07]; Hdac3 ΚO: mean 10.43, 95% CI [7.62–13.24]; two-tailed unpaired t-test p=0.0026).
Figure 6 with 3 supplements see all
Deletion of Hdac2 or Hdac3 in striatal MSNs decreases striatal HTT CAG repeat expansions.
(A) Representative GeneMapper traces of PCR-amplified striatal HTT CAG repeats from individual mice matched by main allele repeat length within each age group (Source data 1). Main allele is marked with a vertical red line and the number of CAG repeats is indicated below. Peaks to the right of the main allele represent CAG repeat expansions. (B) Genotype-averaged GeneMapper-derived data showing peak heights normalized by the main allele peak height and CAG change relative to the main allele. (C) Mean striatal expansion indices per genotype. Error bars represent standard deviation. **p<0.01 (two-tailed unpaired t-test). *p<0.05, **p<0.01; ***p<0.005 (2-tailed unpaired t-test). Numbers of mice for each group are indicated on the bar graphs.
-
Figure 6—source data 1
Expansion Indices in Hdac2 and Hdac3 KO mice.
- https://cdn.elifesciences.org/articles/55911/elife-55911-fig6-data1-v2.xlsx
Note that the expression of Cre recombinase itself did not impact CAG expansion (Figure 6—figure supplement 1); therefore, the observed impacts on striatal instability are attributable to the Hdac2 or Hdac3 genotype of the mice. Further, as neither Hdac2 ΚO nor Hdac3 ΚO resulted in any significant loss of MSNs as determined by the number of DARPP-32-positive cells (Figure 6—figure supplement 2), reduced striatal expansions cannot be readily explained by an altered cellular population biased toward stable alleles. Of note, HDAC3 is required for the long-term maintenance of cerebellar purkinje cells (Venkatraman et al., 2014), although its knock-out in the CA1 region of the hippocampus did not have a detrimental effect on cell survival (McQuown et al., 2011) in line with the lack of obvious MSN degeneration in our Hdac3 knockout mice. Thus, HDAC3’s role in neuronal survival may depend on cell-type and/or stage of neuronal development or differentiation.
Overall, our results support the conclusion that Hdac2 and Hdac3 are moderate enhancers of CAG expansion in MSNs of HttQ111/+ mice, with the impact of Hdac2 KO appearing to depend on the age of the mice. To explore a possible mechanism for instability modification, we investigated the RNA-seq data for expression levels of DNA repair genes that modify repeat instability in mice (Kovalenko et al., 2012; Dragileva et al., 2009; Pinto et al., 2013; Kovtun et al., 2007; Mollersen et al., 2012; Zhao and Usdin, 2018; Miller et al., 2020). Of these, only Msh3 mRNA levels were modestly decreased in HttQ111/+ Hdac2 ΚO striata relative to HttQ111/+ Hdac2 KO striata (nominal p<0.01; adjusted p=0.07) (Figure 6—figure supplement 3A, B). However, MSH3 protein levels were not reduced in Hdac2 ΚO striata from these mice (Figure 6—figure supplement 3C, D). Therefore, dysregulation of DNA repair gene expression does not provide an obvious explanation for the impact of Hdac2 KO on CAG expansion.
Pharmacological HDAC inhibition promotes CAG contraction in a cell-based assay
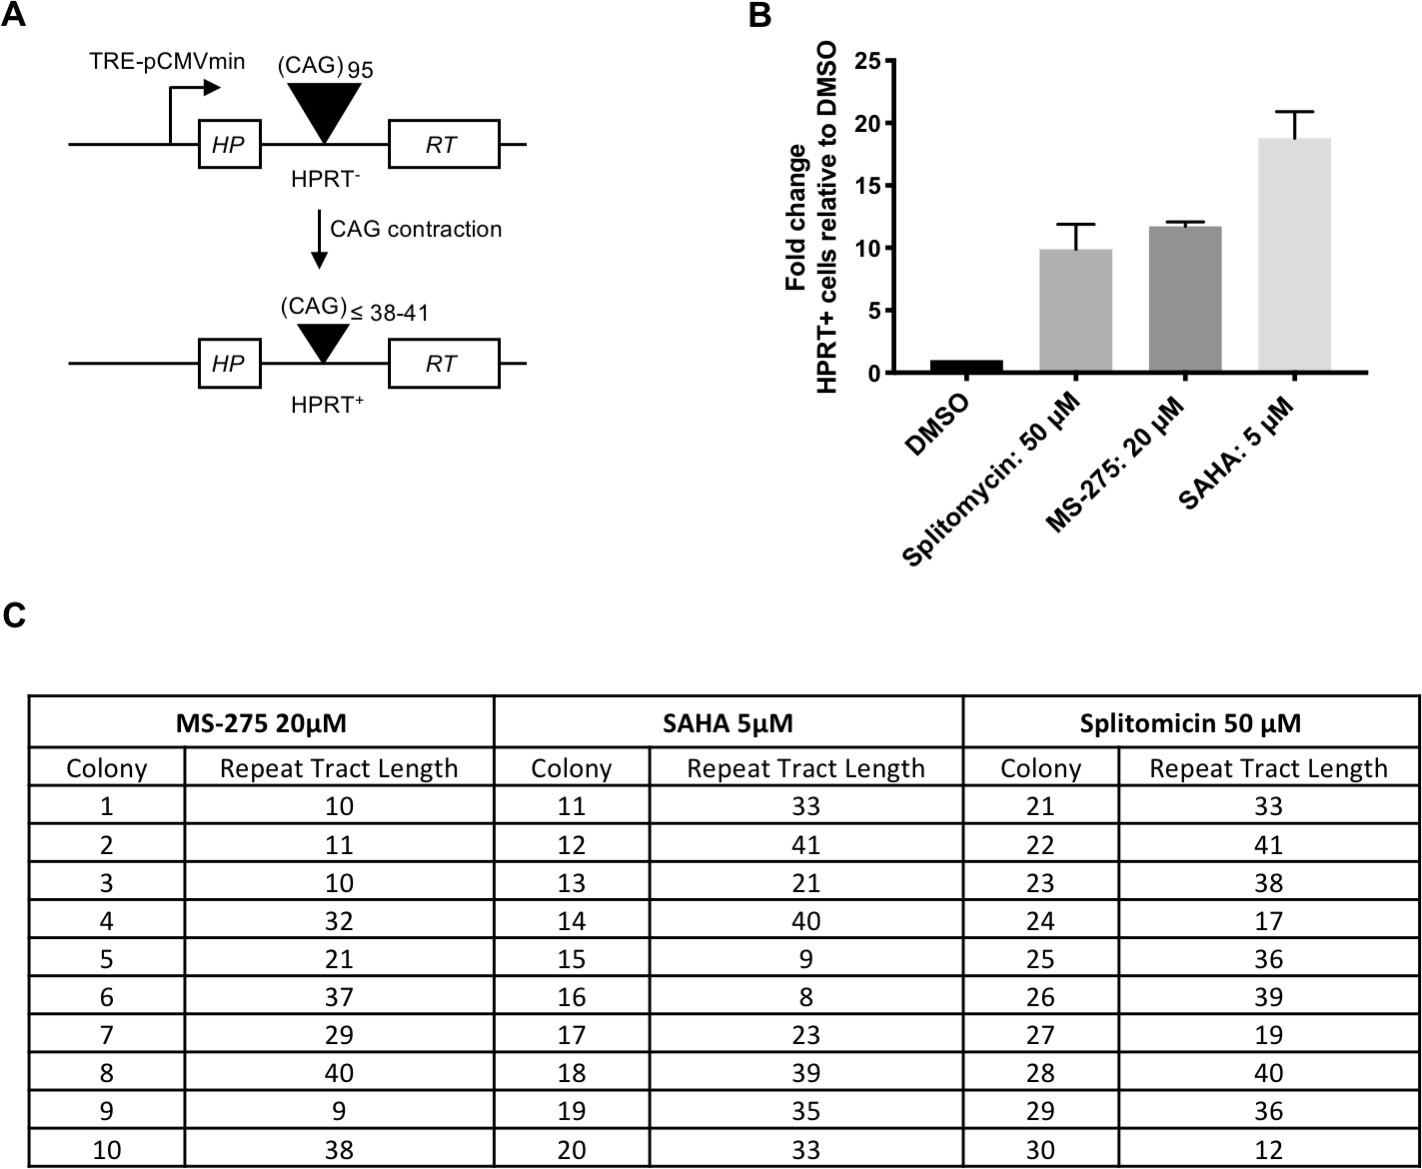
Previous studies have found that Class I HDAC inhibitors suppress CAG expansion (Jung and Bonini, 2007; Suelves et al., 2017; Debacker et al., 2012). To test further the impact of HDAC inhibition on CAG instability, we took advantage of a well-established, sensitive human cell-based assay for repeat contractions (Figure 7A). In this system, a CAG95 repeat is inserted in an intron of an HPRT mini-gene construct. Contractions below a threshold of ~38–41 CAGs restore HPRT activity allowing cell growth in selective media. Although the system is blind to expansions, there is relatively good consistency between genetic modifiers identified in this assay and those that modify CAG expansion in mouse models, although the direction of effect can be different (Lin and Wilson, 2009). In further support of a role for HDACs as modifiers of CAG instability we found that the small molecule HDAC inhibitors (Bradner et al., 2010), SAHA (suberanilohydroxamic acid), and MS-275, both of which share in common the potential inhibition of Zn2+-dependent Class I HDACs, and splitomicin, a weak inhibitor of NAD+ dependent Class III HDACs (Sirtuins) (Carafa et al., 2011), stimulated CAG contractions (Figure 7B,C). Remarkably, we note that the magnitude of effect of the HDAC inhibitors in this contraction assay was comparable to or exceeded that of the various other genetic and pharmacological manipulations we have previously performed (Lin and Wilson, 2009; Lin and Wilson, 2007; Lin and Wilson, 2012; Hubert et al., 2011). Note that the enhancement of contractions by HDAC inhibitors in this system is in contrast to the suppressive effect on CAG expansion of genetic or pharmacological inhibition of HDACs in the current study and in previous studies (Jung and Bonini, 2007; Suelves et al., 2017; Debacker et al., 2012), although we cannot exclude the possibility that Hdac2 or Hdac3 KO in MSNs also stimulated rare contraction events that are not detectable in the GeneMapper assay. Taken together, the data in mice and in cell models, both in this study and previous studies, suggest that Class I HDACs such as HDAC2 and HDAC3, as well as potentially other HDACs, can influence different aspects of CAG instability, perhaps depending on the cell-type and whether the cell is actively dividing or post-mitotic.
Figure 7
HDAC inhibitors increase instability in selectable cell-based assays for CAG repeat contraction.
(A) HPRT mini-gene reporter construct for contraction assay. (B) Fold-change in the number of HAT-resistant FLAH25 cells (HPRT+) when treated with HDAC inhibitors relative inhibitors relative to the number of resistant colonies in DMSO-treated cells. Bars show mean +/- SD of bars fold-change relative to DMSO in four biological replicates (independent wells treated with drug). (C) CAG repeat lengths in HPRT+ colonies following HDAC inhibitor treatment. DNA was extracted from HPRT+ colonies, and the repeat tract PCR-amplified and sequenced to determine repeat length.
Impact of MSN-specific Hdac2 and Hdac3 knockout on nuclear huntingtin pathology
HttQ111 mice exhibit both early (~2.5 months) diffusely immunostaining nuclear mutant huntingtin, detected with the anti-huntingtin antibody EM48 (or mAb5374), followed at ~6–12 months by the appearance of discreet intra-nuclear inclusions (Wheeler et al., 2000; Wheeler et al., 2002; Lloret et al., 2006). These cellular phenotypes, which occur selectively in MSNs in HttQ111 mice, are highly CAG repeat length-dependent and are modified by genes that alter somatic expansion (Kovalenko et al., 2012; Pinto et al., 2013). To assess the impact of MSN-specific Hdac2 and Hdac3 KO on these phenotypes we immunostained striatal sections from cohorts of mice (Hdac2 ΚO at 2.5, 5 and 10 months of age; Hdac3 KO at 5 months of age) matched for constitutive CAG repeat length (Source data 1) with mAb5374 (Figure 8). With the exception of the 2.5-month Hdac2 ΚO cohort, mAb5374 immunostaining was performed on the contralateral striata of the same mice analyzed for somatic CAG expansion above.
Figure 8 with 1 supplement see all
Impact of MSN-specific Hdac2 or Hdac3 knockout on striatal nuclear mutant huntingtin immunostaining phenotypes.
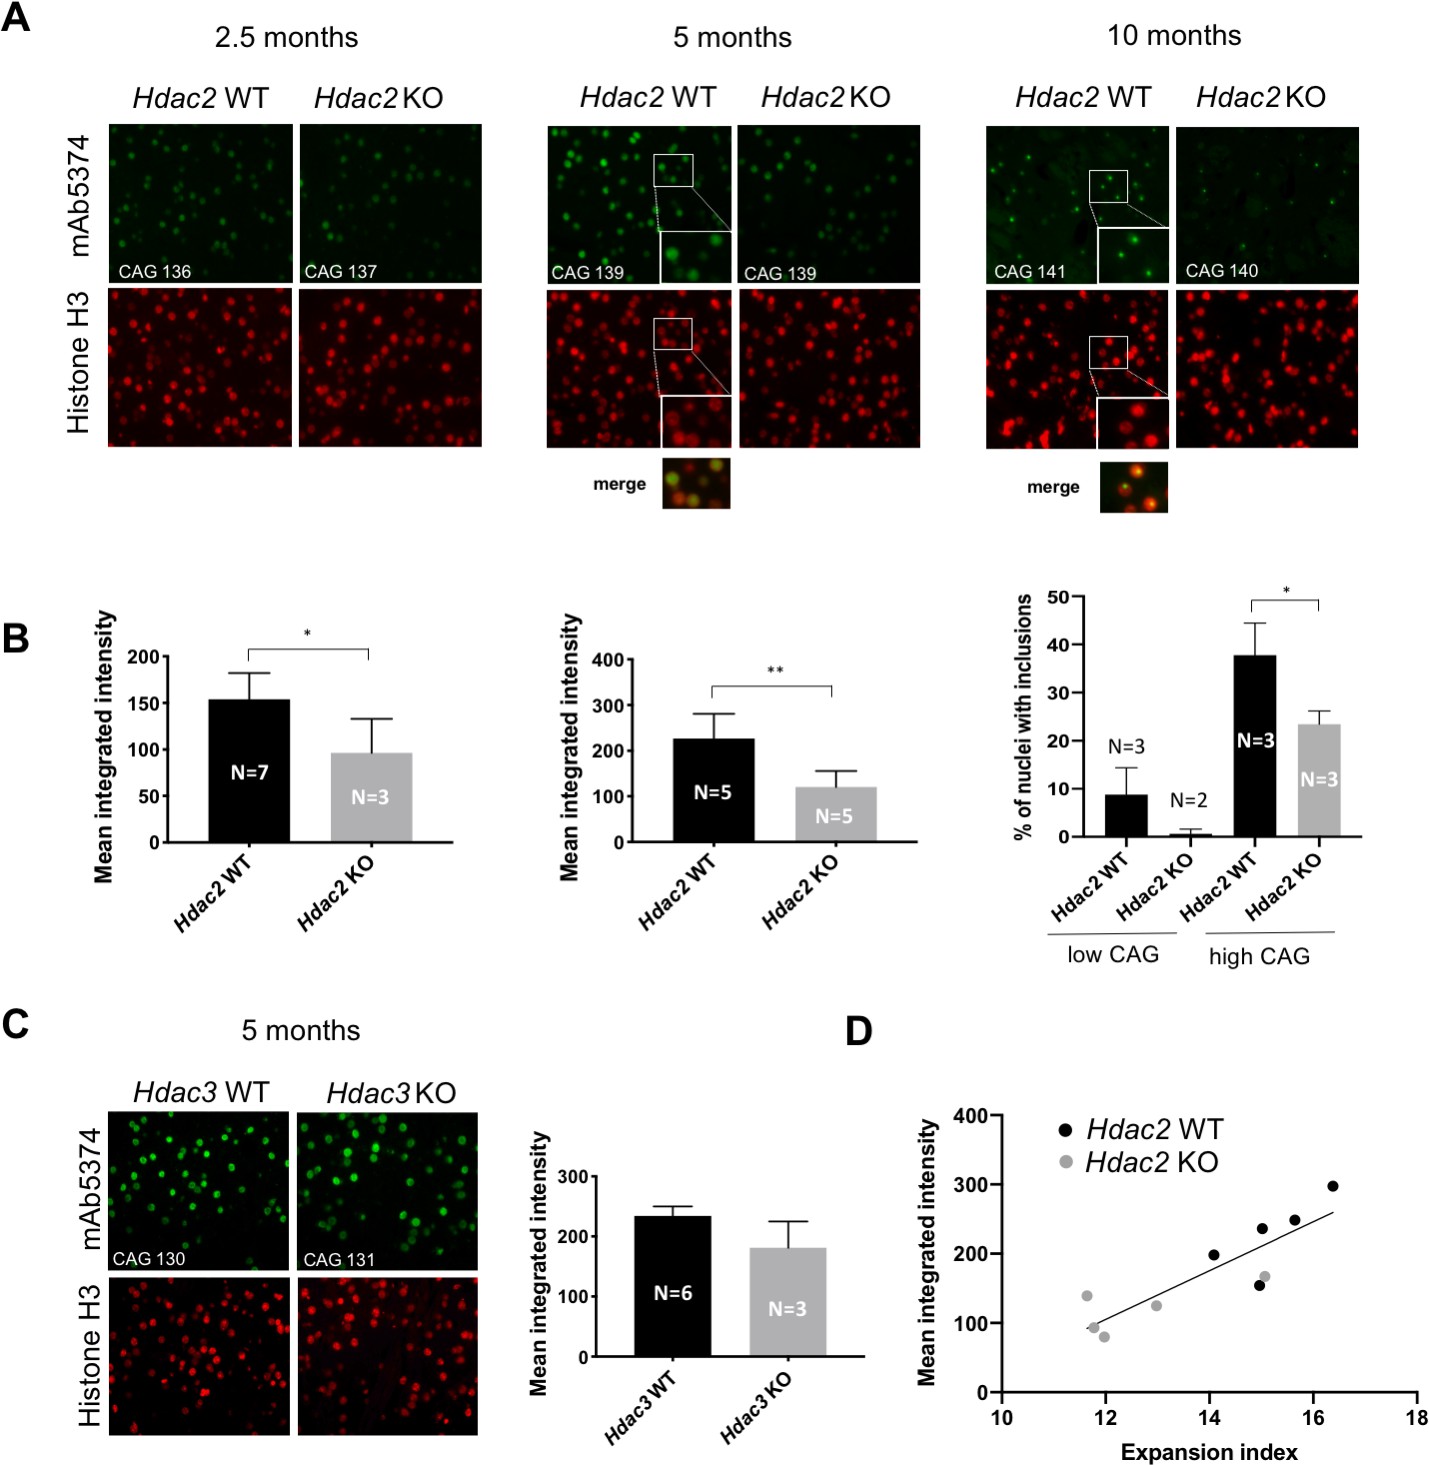
(A) Fluorescent micrographs of HttQ111/+ Hdac2 KO striata immunostained with anti-huntingtin mAb5374 and histone H3 antibodies. Mice were matched by CAG repeat length within each age group. Images of 2.5-month and 5-month striata were taken at 40x; images of 10-month striata taken at 20x with 2x digital zoom. The inserts in the 5-month and 10-month Hdac2 WT mAb5374 images and merged images below highlight the overlap of nuclear huntingtin immunostaining over the entire H3-positive nucleus in the 5-month mice, in contrast to the discrete nuclear huntingtin inclusion immunostaining intensity within the nucleus at 10 months. (B) Mean integrated intensity of mAb5374 staining (integrated intensity normalized by the total number of nuclei as determined by the number of H3-positive nuclei) is shown for 2.5-month and 5-month cohorts of HttQ111/+ Hdac2 KO mice. For 10-month mice, the number of nuclei containing an inclusion (we have not observed more than one inclusion per nucleus) was counted as a percentage of the total number of nuclei, determined by histone H3 immunostaining. The 10-month group of mice was divided into two subgroups based on CAG repeat length: low CAG repeat subgroup represented by the first two columns in the graph (Hdac2 WT CAG 117, 119, 120; Hdac2 KO CAG 110, 116) and high CAG repeat subgroup represented by the last two columns in the graph (Hdac2 WT CAG 138, 141, 146; Hdac2 KO CAG 132, 140, 140). (C) Fluorescent micrographs (20x) of 5 month Hdac3 KO from CAG length-matched mice stained with mAb5374 and histone H3 antibodies (left) and quantified mean integrated intensity of mAb5374 staining (right). 5-months. Numbers of mice for each group are indicated on the bar graphs.
-
Figure 8—source data 1
mAb5474 nulcear intensity and number of nuclear inclusions in Hdac2 and Hdaac3 KO mice.
- https://cdn.elifesciences.org/articles/55911/elife-55911-fig8-data1-v2.xlsx
In 2.5- and 5-month mice, we quantified the intensity of the diffuse nuclear signal. Hdac2 ΚO in MSNs reduced the intensity of diffusely immunostaining nuclear mutant huntingtin at both 2.5 months (Hdac2 WT: mean 153.9, 95% CI [127.9, 179.9]; Hdac2 ΚO: mean 96.35, 95% CI [5.63, 187.1]; two-tailed unpaired t-test p=0.025) and 5 months of age (Hdac2 WT: mean 226.8, 95% CI [159.9, 293.8]; Hdac2 ΚO: mean 120.9, 95% CI [77.34, 164.5]; two-tailed unpaired t-test p=0.0062), with a stronger impact at 5 months (Figure 8A, B). Diffuse nuclear huntingtin immunostaining was not altered by Cre expression alone (Figure 6—figure supplement 1). In 10-month mice, nuclei contained distinct inclusions. As the immunoflourescent signal is saturated in these dense inclusions we quantified their number rather than their intensity. This phenotype was variable between mice of the same genotype, largely due to constitutive CAG length. We therefore separated the mice into ‘high’ and ‘low’ CAG groups that reflected different breeding cohorts for comparison between Hdac2 genotypes (Figure 8A, B). We observed a decrease in the number of nuclei containing inclusions in the low CAG group that did not reach statistical significance (Hdac2 WT: mean 8.76, 95% CI [−5.29, 22.81]; Hdac2 ΚO: mean 0.66, 95% CI [−7.74, 9.06]; 2-tailed unpaired t-test p=0.153), and a statistically significant decrease in the number of cells containing inclusions in the high CAG group (Hdac2 WT: mean 37.8, 95% CI [21.26, 54.31]; Hdac2 ΚO: mean 23.44, 95% CI [16.58, 30.31]; 2-tailed unpaired t-test p=0.0261). In the 5-month Hdac3 KO cohort, we observed a non-statistically significant trend towards decreased diffuse nuclear mutant huntingtin in a small number of immunostained 5-month Hdac3 ΚO striata (Hdac3 WT: mean 234, 95% CI [91.13, 376.9]; Hdac3 ΚO: mean 181.2, 95% CI [72.92, 289.5]; two-tailed unpaired t-test p=0.21). (Figure 8C). To examine the relationship between CAG expansion and nuclear huntingtin pathology, we compared directly expansion indices and mAb5374 intensity in the 5-month Hdac2 KO cohort for which we had both measures from the same mice with a reasonable number (N = 5) of each genotype. There was a strong correlation (Pearson r = 0.87, p=0.0011) between mAb5374 intensity and expansion index (Figure 8D), consistent with somatic CAG expansion as a modifier of this cellular phenotype. Overall, the fairly moderate suppression of the mAb5374 nuclear intensity and nuclear inclusion phenotypes appears in line with the subtly reduced somatic expansion elicited by the Hdac2 or Hdac3 gene knockouts.
As altered huntingtin levels could contribute to the reduced nuclear immunostaining phenotypes, we investigated huntingtin mRNA and protein levels in the Hdac2 KO mice. In the RNA-seq data, Hdac2 KO decreased total huntingtin mRNA levels in Htt+/+ striata by 5.9% (nominal p=0.06; adjusted p=0.25) and in HttQ111/+ striata by 11% (nominal p<0.001; adjusted p<0.05) (Figure 8—figure supplement 1). However, western blot analyses on the contralateral striata from a subset of the mice used for RNA-seq did not provide evidence for an impact of Hdac2 KO on steady state levels of wild-type or mutant huntingtin protein (Figure 8—figure supplement 1C, D). We also investigated the RNA-seq data for reads spanning exon 1 and intron 1, reflecting aberrantly spliced transcripts identified in a number of other HD models and predicted to encode exon1-containig N-terminal fragment of mutant huntingtin (Sathasivam et al., 2013). In support of previous data (Sathasivam et al., 2013), we identified exon1-intron1-spanning transcripts in HttQ111/+ striata. However, Hdac2 KO had no impact on the number of these sequence reads (Figure 8—figure supplement 1B). It appears therefore that altered levels of mutant huntingtin or exon1 mutant huntingtin expressed from mis-spliced exon1-intron1 transcripts do not readily explain suppression of nuclear huntingtin pathology elicited by Hdac2 KO. This is consistent with modification of these highly CAG length-dependent cellular phenotypes occurring as a consequence of reduced CAG repeat lengths in striatal MSNs. However, analyses of larger cohorts of mice as well as analyses of rare expansions not captured using GeneMapper would be needed to rigorously discern Hdac2 and Hdac3 genotype effects on nuclear huntingtin pathology phenotypes that are dependent on or independent of somatic CAG expansion.
Discussion
Identification of genetic modifiers of disease phenotypes in HD mouse models provides an important route to dissecting underlying mechanisms of pathogenesis and ultimately for identifying therapeutic targets. Here, we have taken a cell type-specific genetic knockout approach to investigate the roles of Hdac2 and Hdac3 genes in as modifiers of molecular or cellular phenotypes elicited in MSNs by an expanded CAG repeat in heterozygous HttQ111 knock-in mice.
We restricted our analyses to previously described robust molecular and cellular changes in this model, specifically somatic instability, thought to drive the rate of disease onset in patients, transcriptional dysregulation and nuclear huntingtin pathology. We did not quantify neuronal cell loss and altered astrocytic or microglial cell density as these phenotypes are extremely subtle or not observed in this model. Similarly, we have not examined behavioral endpoints that are also subtle, as such studies would need significantly larger numbers of mice to be sufficiently powered.
Our results show that MSN-specific knockout of Hdac2 reversed the transcriptional dysregulation of a subset of genes and resulted in a moderate reduction in somatic CAG expansion and nuclear huntingtin pathology. MSN-specific knockout of Hdac3 resulted in a comparable reduction in somatic CAG expansion to the Hdac2 knockout. The impact of genetic knock-out or reduction of several Hdac genes (Hdac3, Hdac4, Hdac6, Hdac7) has previously been investigated in the R6/2 exon 1 mouse model of HD and in HdhQ150 knock-in mice with the goal of understanding which HDAC targets mediated the beneficial effects of broad-acting HDAC inhibitors (Benn et al., 2009; Bobrowska et al., 2011; Moumné et al., 2012; Mielcarek et al., 2013). With the exception of Hdac6, the impact of the full knock-out could not be studied due to embryonic or early postnatal lethality. Of the genes tested, only Hdac4 was found to modify mouse phenotypes, uncovering a novel role for this gene in modulating mutant huntingtin aggregation (Mielcarek et al., 2013). In R6/2 mice, the lack of any modifying effect of Hdac3 may be due to the modest reduction in HDAC3 protein level (to 80% of wild-type overall, or to 60% of wild-type in the nucleus) in the Hdac3+/- mice (Moumné et al., 2012).
Strikingly, knockout of Hdac2 in MSNs caused substantial transcriptional dysregulation, resulting in both up- and down-regulation of a large number of genes. These findings are consistent with data showing that HDAC1/2 can both positively and negatively regulate gene expression (Kelly et al., 2018). It is notable that the majority of mouse tissue-specific deletions of either Hdac2 or Hdac1 exhibited no discernible phenotype, presumably due to functional redundancy of the two highly related HDAC1 and HDAC2 proteins (Kelly et al., 2018). Our data reveal that, despite its up-regulation, HDAC1 is unable to compensate for the lack of HDAC2 in MSNs, providing evidence for a specific role of HDAC2 in MSNs and supporting distinct functions of HDAC1 and HDAC2 in adult neurons (Guan et al., 2009; Kim et al., 2008). The expression level of approximately 12% of genes dysregulated by the HttQ111 allele was normalized by the Hdac2 KO to levels present in wild-type mice. However, this occurs against a much larger background of transcriptional dysregulation elicited by the Hdac2 KO, with evidence for shared pathways and processes being impacted by both the HttQ111 and Hdac2 knockout mutations. Indeed, a large proportion (~24%) of genes dysregulated by the HttQ111 allele was further dysregulated in the same direction by the Hdac2 KO. It should be noted in interpreting these data that the majority of genes dysregulated by the HttQ111 allele did not meet a p value threshold corrected for multiple testing, although a large proportion of genes dysregulated by the Hdac2 KO did. We therefore examined a core set of 29 genes significantly dysregulated (FDR adjusted p<0.05) by HttQ111 in both in the current study and in Langfelder et al., an extensive investigation of transcriptional dysregulation in HD knock-in mice Langfelder et al., 2016. Of these genes, only two met our criteria for rescue (Ppp1r1b and Slc29a1); for the other genes in this set, Hdac2 KO either further altered the absolute gene expression level in the same direction as the HttQ111 allele or had no impact on expression. However, in these significantly dysregulated genes, we found that Hdac2 KO lessened the relative impact of the HttQ111 allele, regardless of the absolute gene expression change elicited by the Hdac2 KO. This genetic interaction indicates a functional relationship between these two mutations that may in part reflect a role of huntingtin in regulating the REST-containing transcriptional repressor complex that includes HDAC2 (Buckley et al., 2010).
Several studies have shown beneficial effects of HDAC inhibitors in HD mouse models, including broad-acting HDAC inhibitors SAHA, phenylbutyrate and parabinostat (LBH589), as well as compounds RGFP966 and 4b that show moderate selectivity towards HDAC3 (Hockly et al., 2003; Gardian et al., 2005; Thomas et al., 2008; Mielcarek et al., 2011; Jia et al., 2012a; Jia et al., 2012b; Jia et al., 2016; Chopra et al., 2016; Suelves et al., 2017; Siebzehnrübl et al., 2018). The impact on transcriptional dysregulation was investigated in a number of these studies, with most focusing on specific candidate genes. Overall, these studies revealed relatively modest reversal of transcriptional changes elicited by the mutant transgenes, though HDAC inhibitor 4b was found to normalize ~1/3 of genes altered in R6/2 mice harboring 300 CAG repeats (Thomas et al., 2008). Our data indicate that HDAC inhibitors with activity against HDAC2 would have the potential to reverse some of the early transcriptional changes elicited by an expanded CAG mutation. However, our results also indicate a complex relationship between the expanded CAG repeat mutation and Hdac2, with potential implications for therapies directed at HDAC2 inhibition.
We demonstrate here that Hdac2 and Hdac3 are enhancers of CAG expansion in MSNs. It is important to note that neither knockout of Hdac2 nor Hdac3 had a large impact on CAG expansion, in contrast to a number of MMR genes that are fundamental drivers of this process and whose knockouts eliminate expansion (Wheeler et al., 2003; Dragileva et al., 2009; Pinto et al., 2013). Our results are consistent with those of Suelves et al. in which treatment of HttQ111 mice with HDAC inhibitor RGFP966, resulted in a slight reduction in striatal CAG expansion (Suelves et al., 2017). HDAC3 and HDAC5 enhanced CAG expansion in a selectable human astrocyte cell-based assay, whereas HDAC9 suppressed expansions (Debacker et al., 2012; Gannon et al., 2012). A role for HDAC2 was not implicated in this system, based on differential effects of HDAC inhibitors with selectivity towards HDACs 1 and 2 or HDAC3 (Debacker et al., 2012). Further studies are needed to understand the mechanism(s) by which Hdac2 and Hdac3 enhance CAG expansion in HD mice. There is evidence that CAG instability may depend on the chromatin environment in the vicinity of the repeat (Libby et al., 2003; Libby et al., 2008; Nestor and Monckton, 2011; Neto et al., 2017; Goula et al., 2012; Dion and Wilson, 2009), and both HDAC2 and HDAC3 play roles in regulating genome stability via effects on histone acetylation and recruitment or accessibility of DNA repair proteins (Miller et al., 2010; Bhaskara et al., 2010). Therefore, it is possible that Hdac2 or Hdac3 modify CAG instability by altering chromatin structure close to the CAG repeat tract. We did observe a small reduction in huntingtin mRNA in Hdac2 knockout mice (Figure 8—figure supplement 1) suggesting a possible alteration in transcriptional dynamics at the Htt locus that may reflect an underlying change in chromatin structure. Our data argue, at least for the Hdac2 KO, against altered transcription of genes encoding DNA repair proteins underlying the reduction in somatic expansion. However, it is possible that changes in acetylation of DNA repair proteins could lead to their altered activity (Chatterjee et al., 2012; Choudhary et al., 2009; Zhang et al., 2014; Radhakrishnan et al., 2015; Piekna-Przybylska et al., 2016; Zhang et al., 2019). This was proposed as a plausible mechanism by which HDAC3 and HDAC5 enhance CAG expansion in a selectable human astrocyte cell-based assay, in part based on epistasis experiments showing that HDAC3 and HDAC5 act in the same pathway as MSH2 (Debacker et al., 2012; Gannon et al., 2012). It was recently suggested that HDAC3 might modify CAG instability by altering the subcellular localization of MSH3 (Williams et al., 2020). Understanding the interplay between HDACs and DNA repair proteins controlling CAG repeat dynamics may provide important insight into the regulation of these DNA repair proteins and potentially novel ways in which to intervene in the process of CAG expansion.
MSN-specific Hdac2 knockout also reduced nuclear huntingtin intensity and inclusion phenotypes, consistent with decreased striatal CAG expansions and the known sensitivity of these phenotypes to repeat length and to modification of somatic instability (Kovalenko et al., 2012; Dragileva et al., 2009; Pinto et al., 2013; Wheeler et al., 2002). We did not observe a significant effect of Hdac3 knockout on nuclear huntingtin intensity in the few mice analyzed and would likely need larger numbers of mice to observe a reduction in this phenotype that might be predicted by the lower striatal CAG repeat lengths in Hdac3 KO mice. Most studies of pharmacological or genetic inhibition of class I HDACs in HD mouse models have reported a lack of impact on nuclear inclusions or aggregation (Hockly et al., 2003; Gardian et al., 2005; Jia et al., 2016; Moumné et al., 2012), although HDAC inhibitor 4b reduced aggregates in the N171-82Q model (Jia et al., 2012b). We suggest that Hdac2 knockout modifies nuclear intensity and inclusion phenotypes in HttQ111 mice at least in part as a consequence of reduced CAG expansion in MSNs. Other mechanisms are also plausible, however, effects on mutant huntingtin levels themselves are not supported by our data. In contrast, the modest reduction in CAG expansion caused by the Hdac2 knockout is unlikely to explain the reversal of transcriptional dysregulation elicited by the HttQ111 allele, in which gene expression levels that can be distinguished between wild-type and HttQ111/+ mice appear effectively normalized to wild-type in HttQ111/+ mice harboring the Hdac2 knockout mutation.
In summary, we have tested whether Hdac2 and Hdac3 are modifiers of different aspects of the HD pathogenic process in MSNs that are both inherently prone to CAG repeat expansion and specifically vulnerable in the disease process. The results of this study indicate moderate effects of these genes on CAG expansion, which in humans drives the rate of disease onset, and for Hdac2, on downstream molecular and cellular phenotypes that may be important in cellular toxicity mechanisms.
Materials and methods
Mouse lines and breeding
Request a detailed protocolHttQ111 knock-in mice used in this study were on a C57BL/6J background (Lee et al., 2011) and were maintained by breeding heterozygous males to C57BL/6J wild-type females from The Jackson Laboratory (Bar Harbor, ME). D9-Cre transgenic mice contain a genomic fragment, comprising about 2 kb of 5´ regulatory sequence, the endogenous ATG, and some of the introns and exons of the mouse Ppp1r1b gene encoding DARPP-32, driving the expression of Cre recombinase in MSNs after 5–6 weeks of age (Bogush et al., 2005). These mice were maintained on a C57BL/6J background. Mice harboring conditional ‘floxed’ Hdac2 or Hdac3 alleles contained loxP sites upstream of exon2/downstream of exon 4 of the Hdac2 gene (Montgomery et al., 2007) and upstream of exon 11/downstream of exon 14 of Hdac3 gene (Montgomery et al., 2008). Both floxed mouse lines were originally on a mixed C57BL/6/129SeEv background and subsequently maintained by breeding heterozygous males or females to C57BL/6J wild-type mice from The Jackson Laboratory.
Detailed breeding schemes are shown in Figure 1—figure supplement 1. Mice carrying conditional floxed Hdac2 or Hdac3 alleles were crossed with HttQ111 mice and, in a separate cross, with D9-Cre mice. The progeny from the two crosses were bred together to obtain Htt+/+ and HttQ111/+ mice with or without the Hdac2 (or Hdac3) floxed allele and/or Cre transgene. Mice harboring either no floxed Hdac alleles in the presence of Cre or one, two, or no floxed alleles in the absence of Cre were wild-type with respect to HDAC expression and are called Hdac2 WT or Hdac3 WT. Mice homozygous for the floxed Hdac alleles and expressing Cre are called Hdac2 KO or Hdac3 KO. In these mice the Hdac2 or Hdac3 alleles are deleted in MSNs and do not express HDAC2 or HDAC3 in MSNs. In a parallel cross, HttQ111/+ mice were crossed with D9-Cre mice to generate Htt+/+ and HttQ111/+ mice with or without the Cre transgene, with the purpose of testing the effect of Cre expression alone on the phenotypes being measured. Note that mice were not fully backcrossed to C57BL/6J prior to the crosses with B6J.D9-Cre mice and B6J.HttQ111 mice. However, analyses of our RNA-seq data showed that all mice had a B6 haplotype for the Mlh1 gene, where genetic variation between B6 and 129 strains is known to associate with CAG instability (Pinto et al., 2013).
Numbers of mice used in this study were gauged based on extensive prior knowledge of cellular and molecular phenotypes elicited by the HttQ111 allele and their genetic modification (Kovalenko et al., 2012; Pinto et al., 2013; Langfelder et al., 2016), and incorporated controlling for inherited CAG repeat length (Source data 1). In all the mouse experiments, ‘N’=number of mice (biological replicates).
Genotyping
Request a detailed protocolGenomic DNA was extracted from tail or ear biopsies taken at weaning for genotyping, or from adult striatum for the CAG repeat instability assay (Qiagen DNeasy blood and tissue kit). Genotypes were further confirmed in striatal DNA. CAG sizing was carried out as previously described, using human HTT CAG-specific primers (Dragileva et al., 2009). PCR products were resolved using the AB13730xl automated DNA analyzer (Applied Biosystems). GeneMapper v3.7 with GeneScan 500-LIZ as internal size standard was used to assign repeat size, defined as the highest peak in the GeneMapper trace. All runs included the same control DNAs of known HTT CAG repeat size. We incorporated a novel PCR genotyping assay that distinguished knock-in and mouse wild-type alleles using primers flanking the 5’ loxP site remaining after excision of the floxed neomycin resistance cassette used in the original gene targeting (White et al., 1997; Wheeler et al., 1999). The assay included 0.5 μM forward primer (5´ TCTGATACAGCCCATGCTGA), 0.5 μM reverse primer (5´ CTGAGTTCAATCCCTGCATTT) and 2x Phusion High-Fidelity PCR Master Mix with HF Buffer (New England Biolabs). Cycling conditions were 98°C for 30 s; 30 cycles of 98°C for 5 s, 62°C for 15 s, 72°C for 20 s; 72°C for 10 min, generating a 129 bp product from the wild-type allele and a 240 bp product from the HttQ111 knock-in allele.
D9-Cre mice were genotyped as described (Bogush et al., 2005). For Hdac2 genotyping, wild-type and floxed alleles were detected by a triplex PCR assay. The forward primer upstream of 5´ loxP site (HDAC2WT-F: 5´ GGCCAAGCATATTCAAACCACC) and the reverse primer between the 5´ loxP site and exon 2 (HDAC2-REV: 5´ GTCAGCTAGTAGTGCTTCTTGG) generated a 226 bp product for the wild type Hdac2 allele, while the forward primer within the 5´ loxP site (HDAC2MUT-F; 5´ GTCCCTCGACCTGCAGGAATTC) and the same reverse primer gave a 146 bp PCR product for the floxed allele. The PCR assay contained 0.2 μM each of HDAC2WT-F and HDAC2MUT-F primers, 0.4 μM of HDAC2-REV primer, 0.025 units GoTaq DNA polymerase (Promega), 5x GoTaq buffer (Promega), additional MgCl2 (5 mM), and dNTP mixture (0.05 mM each). Cycling conditions were 94°C for 2 min; 30 cycles of 94°C for 15 s, 60°C for 30 s, 72°C for 40 s; 72°C for 5 min. To detect specifically the deleted Hdac2 allele, a different forward primer upstream of 5´ loxP site (5´ GTGGGAAGCATGGCAGCATGC) and reverse primer downstream of the 3´ loxP site, between exons 4 and 5 (5´ GCCTTCTAAGAACCCCAGGGAAC) were used, resulting in a 550 bp product upon Cre-mediated excision. PCR conditions were 0.2 μM of each primer, 0.025 units GoTaq DNA polymerase (Promega), 5x GoTaq buffer (Promega), additional MgCl2 (5 mM), and dNTP mixture (0.05 mM each). Cycling conditions were 94°C for 2 min; 30 cycles of 94°C for 15 s, 68°C for 30 s, 72°C for 40 s; 72°C for 5 min. For Hdac3 genotyping, a triplex assay was used to detect all three alleles, with one forward/reverse pair of primers up- and downstream from the 5´ loxP site (HDAC3-5´-loxP-F: 5´ GCTTGGTAGCCAGCCAGCTTAG, and HDAC3-5´-loxP-R: 5´ CATGTGACCCCAGACATGACTGG), and the third (reverse) primer downstream of the 3´ loxP site (HDAC3-3´-loxP-R: 5´ CAGTCCATGCCTATAATCCCAGC). This assay produced a 350 bp product for the wild-type Hdac3 allele, a 450 bp product for the ‘floxed’ allele (both products were from HDAC3-5´-loxP-F and HDAC3-5´-loxP-R primers), and a 650 bp product for the deleted Hdac3 allele after Cre-mediated excision (from HDAC3-5´-loxP-F and HDAC3-3´-loxP-R primers). The PCR assay contained 0.2 μM each of the three primers, 0.025 units GoTaq DNA polymerase (Promega), 5x GoTaq buffer (Promega), additional MgCl2 (5 mM), and dNTP mixture (0.05 mM each). Cycling conditions were 94°C for 2 min; 30 cycles of 94°C for 15 s, 60°C for 30 s, 72°C for 40 s; 72°C for 5 min.
Measurement of CAG expansion
Request a detailed protocolExpansion indices in striatum were quantified from GeneMapper traces of PCR-amplified HTT CAG repeat, as described previously (Lee et al., 2010), taking into account only expansion peaks to the right of the highest peak (main allele) and without filtering peaks based on relative peak height. Although there is intrinsic PCR bias in analyses of instability from ‘bulk DNA’, this nevertheless allows quantification of subtle differences in repeat instability, and metrics derived from the GeneMapper traces correlate well with repeat length distributions obtained from analyses of single molecules (Lee et al., 2010). Briefly, normalized peak heights were calculated by dividing each expansion peak height by the sum of the heights of the main allele plus all expansion peaks, the change in CAG length of each expansion peak from the main allele was determined, each normalized peak height was multiplied by the CAG change from the main allele, and these values were summed to generate an expansion index that represents the mean positive CAG repeat length change in the population of cells being analyzed.
Immunohistochemistry
Request a detailed protocolPrimary antibodies used were: mouse monoclonal anti-huntingtin (mAb5374, Millipore), rabbit polyclonal anti-histone H3 (ab1791, Abcam), rabbit polyclonal anti-HDAC2 (ab7029, Abcam), rabbit monoclonal anti-HDAC3 (clone Y415; formerly available from Millipore), mouse monoclonal anti-DARPP-32 (D32-6a; a kind gift from Dr. Angus Nairn) and rabbit polyclonal anti-DARPP-32 (ab40801, Abcam).
Immunostaining was performed on 8 μm coronal sections of periodate-lysine-paraformaldehyde (PLP)-perfused and -post-fixed, paraffin-embedded brains. Perfusion and tissue processing/embedding methods have been described previously (Wheeler et al., 2000). For most mouse cohorts, one hemisphere of the brain was embedded for sectioning and the other one was used for dissection of striatum for analysis of somatic instability. Sections chosen for immunostaining were aligned with respect to their anterior/posterior location in the brain. The sections were deparaffinized, rehydrated and subjected to heat-mediated epitope retrieval (Na-citrate buffer pH 6.0) followed by quenching of endogenous peroxidase with 0.3% H2O2/methanol for 30 min at room temperature (RT), and blocked in 3% normal horse serum (NHS) in Tris-buffered saline (TBS) for 1 hr at room temperature. Immunostaining for diffuse nuclear huntingtin, huntingtin inclusions and histone H3 was described in detail (Kovalenko et al., 2012). For double staining with mouse anti-DARPP-32/rabbit anti-HDAC3 antibodies sections were incubated with both primary antibodies (D32-6a at 1:200 and Y415 at 1:2000 in 1% NHS/TBS) overnight at 4°C, followed by sequential amplification of HDAC3 and DARPP-32 signal. First, HDAC3 signal was amplified using the TSA Biotin System (Perkin Elmer) according to manufacturer’s instructions and quenching of HRP activity (0.1% sodium azide/0.3% H2O2 in TBS for 30 min at RT) was performed before the addition of streptavidin-Alexa Fluor 555. Then, DARPP-32 signal was amplified using TSA kit #2 (Invitrogen/Thermo Fisher Scientific) by incubating with goat anti mouse-HRP at 1:100 for 1 hr at RT and then with Tyramide-Alexa Fluor-488 at 1:100 in the amplification diluent (all provided with the TSA kit #2), for 25 min at RT. For double staining with mouse anti-DARPP-32/rabbit anti-HDAC2 antibodies sections were incubated with both primary antibodies (D32-6a at 1:200 and ab7029 at 1:1000 in 1% NHS/TBS) overnight at 4°C. DARPP-32 signal was amplified as described above, and HDAC2 signal was detected with donkey anti-rabbit Alexa Fluor 555-conjugated secondary antibody (Invitrogen/Thermo Fisher Scientific, 1:1000) added as the last step after DARPP-32 signal amplification. For staining with rabbit anti-DARPP-32 antibody sections were incubated with ab40801 at 1:750 at 4°C overnight, followed by donkey anti-rabbit Alexa Fluor 488 secondary antibody.
All slides were mounted in ProLong Gold antifade reagent (Invitrogen/Thermo Fisher Scientific). Fluorescent microscopy was performed with a Zeiss Axioskop two microscope equipped with AxioCamMRm camera and AxioVision 4.6 image acquisition software, using Plan Apochromat 20x/0.8 M27 or Plan Neofluar 40x/0.75 Ph2 objectives. Images that were to be quantified and compared were taken with the same exposure times.
Quantification of immunohistochemical data
Request a detailed protocolQuantification was performed as described previously (Kovalenko et al., 2012), using CellProfiler 3.0.0 image analysis software (Carpenter et al., 2006). Briefly, diffuse nuclear huntingtin immunostaining was quantified in four 40x striatal images per mouse (one medial, located next to the lateral ventricle, and one lateral, located at the end of external capsule; from two consecutive sections). Total (integrated) intensity of mAb5374 staining was measured in all mAb5374-positive nuclei in each image and normalized by the total number of nuclei (as determined by the number of all histone H3-positive nuclei) in the same image. The resulting value, representing the mean intensity of mAb5374 staining per nucleus, was averaged from four images for each mouse. The number of nuclear huntingtin inclusions (total per image) was quantified, blind to genotype, with CellProfiler 3.0.0 in two 20x images per mouse (taken mid-striatum from two consecutive coronal sections), normalized by the total number of histone-H3-positive nuclei in each image (taken as 100%), and resulting percentages were averaged over these two images for each mouse. Number of DARPP-32-positive cells and total integrated intensity of DARPP-32 staining in DARPP-32-positive cells were also quantified with CellProfiler 3.0.0 in four 40x images per mouse, taken in the same striatal locations as for diffuse nuclear huntingtin immunostaining quantification. Total integrated intensity was normalized by the number of DARPP-32-positive cells in each image to obtain mean integrated intensity values. Both mean integrated intensity of DARPP-32 staining and the number of DARPP32-positive cells were averaged from four images for each mouse.
Western blot analysis
Request a detailed protocolStriatal extracts were prepared as described previously (Kovalenko et al., 2012). For detection of huntingtin protein, 90 μg of striatal extracts were resolved by SDS-PAGE in Novex 3–8% Tris-acetate gels (Invitrogen/Thermo Fisher Scientific) and transferred to 0.45 μm nitrocellulose membrane (Bio-Rad) in Transfer Buffer (Boston BioProducts) at 100 V for 72 min. After blocking with 5% non-fat milk, HTT protein was detected using mAb2166 antibody (Millipore) at 1:1000 in 5% non-fat milk/TBS/0.05% Tween-20 and visualized with ECL kit (ThermoScientific).
For HDAC2 and HDAC1, 40 μg of striatal extracts were resolved on 12% Bis-Tris gels (Invitrogen/Thermo Fisher Scientific) and transferred in Transfer Buffer with 10% methanol, 0.025% SDS at 110 V for 75 min. The membranes were blocked with 5% non-fat milk in TBS/0.05% Tween-20 and incubated with anti-HDAC2 H3159 antibody (Sigma) at 1:10000 or anti-HDAC1 ab31263 (Abcam) at 1:2000 in 1% non-fat milk/TBS/0.05% Tween-20 and developed with ECL kit.
For detection of acetylated histones H3AcK9 and H4AcK12, 35 μg of striatal extracts were resolved on 12% Bis-Tris gels (Invitrogen/Thermo Fisher Scientific) and transferred in Transfer Buffer with 10% methanol, 0.025% SDS at 150 V for 75 min. The membranes were blocked as above and incubated with anti-H3AcK9 ab10812 (Abcam) at 1:500 or anti-H4AcK12 #04–119 (Millipore) at 1:500 in 1% non-fat milk/TBS/0.01% Tween-20 and developed with ECL kit.
Total histone H3 was detected after stripping and re-probing the same membrane with ab1791 (Abcam) at 1:2000 in 1% non-fat milk/TBS/0.05% Tween-20.
For detection of MSH3, SDS-PAGE and transfer was as for HDAC1 and HDAC2 (above). The membranes were blocked as above and incubated with anti-MSH3 mouse monoclonal antibody 2F11 -a kind gift from Glen Morris and Ian Holt (Holt et al., 2011)- at 1:300 in 5% non-fat milk/TBS/0.05% Tween-20.
For quantification of Western blot data the density of protein bands of interest was measured with Quantity One software (Bio-Rad) with local background subtraction and normalized by the total amount of protein per corresponding lane as measured by the density of the entire lane stained by Novex reversible protein stain (Invitrogen/Thermo Fisher Scientific). Normalized values (one per mouse) were averaged over each genotype group.
Selectable cell-based assay for CAG repeat contractions
Request a detailed protocolThe selectable assay for repeat contractions, based on insertion of a CAG repeat into an intron of an HPRT minigene, was performed in FLAH25 cells as described (Hubert et al., 2011). Cell maintenance, inhibitor treatment regimen, and selection for resistant colonies in HAT medium (0.1 mM hypoxanthine, 0.4 µM aminopterin, and 16 µM thymine) were as described (Hubert et al., 2011).~4.5×10⁶ cells were plated and the number of HPRT+ colonies was adjusted by cell survival ([number of positive colonies] / [number of plated cells multiplied by plating efficiency]). The effect of inhibitors on CAG repeat contractions was expressed as fold change of the adjusted number of positive colonies over DMSO.
RNA-seq library preparation and sequencing
Request a detailed protocolRNA was isolated from striatal tissues of 36 5-month mice of four genotype groups: Htt+/+ Hdac2 WT (N = 9: six males, three females), HttQ111/+ Hdac2 WT (N = 7: four males, three females), Htt+/+ Hdac2 ΚO (N = 9: five males, four females) and HttQ111/+ Hdac2 ΚO (N = 11: eight males, three females) lines using TRIzol reagent. Briefly, pelleted cells were resuspended in TRIzol reagent and then extracted with chloroform, followed by isopropanol precipitation of RNA from the aqueous phase and three 70% ethanol washes. RNA pellets were solubilized in 30–50 µl of RNase-free water (Ambion, AM9937). RNA quality was assessed using the Agilent Bioanalyzer TapeStation 2200 (Agilent Technologies, Santa Clara, CA). In total, 36 RNA-seq libraries were prepared using the Illumina TruSeq Stranded mRNA Sample Prep Kit. Each library in this study included 1 ul of a 1:10 dilution of ERCC RNA Control Spike-Ins (Ambion) that were added from one of two mixes, each containing the same 92 synthetic RNA standards of known concentration and sequence. These synthetic RNAs cover a 106 range of concentration, as well as varying in length and GC content to allow for validation of dose response and the fidelity of the procedure in downstream analyses (Jiang et al., 2011). Libraries were multiplexed, pooled, and sequenced on multiple lanes of an Illumina HiSeq2000, generating median 40.7M paired-end reads per library of 75 bp.
RNA-seq data processing and analysis
Request a detailed protocolQuality checking of sequence reads was assessed using fastQC (v. 0.10.1) (http://www.bioinformatics.babraham.ac.uk/projects/fastqc), blind to genotype. Sequence reads were aligned to the mouse reference genome (GRCm38, Ensembl build v. 75) using GSNAP (version 2015-06-23) with parameters ‘-a off -N 1 –pairexpect=450 -B 3 –query-unk-mismatch=1’ (Wu and Nacu, 2010). Gene level counts were tabulated using BedTools’s multibamcov algorithm on unique alignments for each library at all Ensembl genes (GRCm38 v.75). Based on quality checking of alignments assessed by custom scripts utilizing PicardTools (https://broadinstitute.github.io/picard/), RNASeQC (DeLuca et al., 2012), RSeQC (Wang et al., 2012) and SamTools (Li et al., 2009), one male sample with genotype Htt+/+ Hdac2 WT was identified as an outlier and thus excluded from further analysis as this sample showed high intergenic (25%), intronic (23%), duplication rates (57%) and low exonic rates (53%), which indicated DNA contamination in this sample. Analysis of ERCC spike-ins as described (Blumenthal et al., 2014) estimated the expression threshold for detection to be at least six uniquely mapped reads. Genes smaller than 250 nt in length and tRNA and rRNA genes were removed from further analyses. Principal component analysis (PCA) of the remaining 35 samples was performed using a Bioconductor package, DESeq2 (v. 1.18.1) (Love et al., 2014) relying on regularized log-transformed counts after keeping genes expressed in all the samples from at least one genotype group with at least six counts. Differentially expressed genes (DEGs) in five pair-wise comparisons Htt+/+ Hdac2 KO vs. Htt+/+ Hdac2 WT [contrast 1], HttQ111/+ Hdac2 KO vs. HttQ111/+ Hdac2 WT [contrast 2], HttQ111/+ Hdac2 WT vs. Htt+/+ Hdac2 WT [contrast 3], HttQ111/+ Hdac2 KO vs. Htt+/+ Hdac2 KO [contrast 4] and HttQ111/+ Hdac2 KO vs. Htt+/+ Hdac2 WT [contrast 5], were identified by edgeR’s quasi-likelihood F test (v. 3.12) (Robinson et al., 2010) with surrogate variables (SVs) accounting for batch effects and unknown factors in data, which were determined by Bioconductor Package SVA (v. 3.18) (Leek et al., 2012; Leek, 2014). To this end, SVA was applied to all 35 RNAseq samples separately for each comparison of interest where the full model was mod = ~ 0 + genotype_group, while the null model was mod0 = ~ 1, analyzing genes that passed the expression detection threshold (≥ 6 counts), in at least one genotype group samples in a given comparison. As the number of analyzed genes differed from comparison to comparison, SVA identified a distinct set of SVs for each comparison, although they were highly similar between comparisons (average correlation = 0.99). DEGs were defined at two statistical significance levels: less stringent, using a nominal p < 0.05 cut-off, and more stringent, using a false discovery rate (FDR) cut-off of < 0.05, calculated based on the Benjamini-Hochberg procedure (Benjamini and Hochberg, 1995). KEGG pathway and gene ontology (GO) enrichments were performed using DAVID (v. 6.8) for DEGs at both p < 0.05 and FDR < 0.05 levels (Huang et al., 2009). In doing so, lists of DEGs in either category of direction of dysregulation (upregulated, downregulated and both) for a given comparison were used as a query list, while a list of all the analyzed genes was treated as a background list. Differentially regulated pathways were also defined at less stringent (p<0.05) and more stringent (FDR<0.05) significance levels. We compared our differential expression results from the HttQ111/+ Hdac2 WT vs Htt+/+ Hdac2 WT comparison (contrast 3) with those from a comparison of 6 month HttQ111/+ (4 female, 4 male) vs Htt+/+ (4 female, 4 male) striata using the RNA-Seq dataset described in Langfelder et al., 2016. To this end, we reanalyzed the Langfelder RNA-Seq data employing the same EdgeR + SVA pipeline as in the present study (as above). 16,395 genes that passed our expression threshold (≥ 6 counts) in either all mutant or all control samples were analyzed. We compared DEGs identified in both studies at both p < 0.05 and FDR < 0.05 thresholds as above. To assess the statistical significance of overlaps between DEGs or enriched pathways between pairs of contrasts (Figure 3—figure supplement 1) we performed one-tailed Fisher’s Exact tests, commonly used to assess the statistical significance of overlap of two sets or enrichment of one set in other (overrepresentation). To identify genes where Hdac2 knockout is either protective or exacerbates the effect of the HttQ111 allele, we first compared DEGs (p < 0.05) in contrast 3 (HttQ111/+ vs. Htt+/+ in Hdac2 WT background) with those in contrast 2 (Hdac2 KO vs. WT in HttQ111/+ background). Next, we performed 2-tailed unpaired t-tests on those shared DEGs to identify genes that were not significantly differentially expressed (p > 0.05) between Htt+/+ Hdac2 WT and HttQ111/+ Hdac2 KO. To assess the statistical significance of observing reduced relative expression (fold-change of HttQ111 versus Htt+/+) of the 29 commonly dysregulated genes shared between thus study and Langfelder et al. in the Hdac2 KO background compared to the Hdac2 WT background we performed a permutation test. To this end, we randomly selected 29 genes 100,000 times from 15,508 genes analyzed in both this study and Langfelder et al. In each iteration, we compared the absolute value of log2 fold-changes of genes between HttQ111/+ and Htt+/+ genotypes in Hdac2 KO and Hdac2 WT backgrounds and assessed how many times the randomly selected 29 genes showed the observed effect, that is where is absolute value of log2 fold-change of ith gene between HttQ111/+ and Htt+/+ genotypes in Hdac2 KO background. All analyses were run on R platforms (versions 3.2.2, 3.3.2, 3.4.3, 3.6).
Statistical analyses
Request a detailed protocolWe performed statistical analyses to compare quantitative instability and mAb5374 phenotypes between genotype groups. As we were not testing the effect of age on these phenotypes, and as our datasets were well controlled for inherited CAG length, we performed two-tailed unpaired t-tests to compare mean values between two genotype groups at any one age. Statistical analyses relevant to the RNA-seq data analyses are described in the section above.
Data availability
RNA-Seq data is deposited in GEO, under the accession number GSE148440.
-
NCBI Gene Expression OmnibusID GSE148440. Histone deacetylase knockouts modify transcription, CAG instability and nuclear pathology in Huntington disease mice.
References
-
Controlling the false discovery rate: a practical and powerful approach to multiple testingJournal of the Royal Statistical Society: Series B 57:289–300.https://doi.org/10.1111/J.2517-6161.1995.TB02031.X
-
Transcriptional Consequences of 16p11.2 Deletion and Duplication in Mouse Cortex and Multiplex Autism FamiliesThe American Journal of Human Genetics 94:870–883.https://doi.org/10.1016/j.ajhg.2014.05.004
-
Chemical phylogenetics of histone deacetylasesNature Chemical Biology 6:238–243.https://doi.org/10.1038/nchembio.313
-
Distribution of histone deacetylases 1-11 in the rat brainJournal of Molecular Neuroscience 31:47–58.https://doi.org/10.1007/BF02686117
-
Histone deacetylase inhibitors: recent insights from basic to clinical knowledge & patenting of anti-cancer actionsRecent Patents on Anti-Cancer Drug Discovery 6:131–145.https://doi.org/10.2174/157489211793980088
-
Post-translational modifications of lysine in DNA-damage repairEssays in Biochemistry 52:93–111.https://doi.org/10.1042/bse0520093
-
LBH589, A hydroxamic Acid-Derived HDAC inhibitor, is neuroprotective in mouse models of Huntington's DiseaseJournal of Huntington's Disease 5:347–355.https://doi.org/10.3233/JHD-160226
-
Dnmt1 deficiency promotes CAG repeat expansion in the mouse germlineHuman Molecular Genetics 17:1306–1317.https://doi.org/10.1093/hmg/ddn019
-
Instability and chromatin structure of expanded trinucleotide repeatsTrends in Genetics 25:288–297.https://doi.org/10.1016/j.tig.2009.04.007
-
MutSβ and histone deacetylase complexes promote expansions of trinucleotide repeats in human cellsNucleic Acids Research 40:10324–10333.https://doi.org/10.1093/nar/gks810
-
Neuroprotective effects of phenylbutyrate in the N171-82Q transgenic mouse model of Huntington's diseaseJournal of Biological Chemistry 280:556–563.https://doi.org/10.1074/jbc.M410210200
-
Comparison of Huntington's disease CAG Repeat Length Stability in Human Motor Cortex and Cingulate GyrusJournal of Huntington's Disease 5:297–301.https://doi.org/10.3233/JHD-160203
-
Epigenetic mechanisms involved in Huntington's Disease PathogenesisJournal of Huntington's Disease 4:1–15.https://doi.org/10.3233/JHD-140134
-
Genome-wide demethylation destabilizes ctg.cag trinucleotide repeats in mammalian cellsHuman Molecular Genetics 13:2979–2989.https://doi.org/10.1093/hmg/ddh317
-
Huntington's disease: a clinical, genetic and molecular model for polyglutamine repeat disordersPhilosophical Transactions of the Royal Society of London - Series B: Biological Sciences 354:957–961.https://doi.org/10.1098/rstb.1999.0446
-
The mouse mismatch repair protein, MSH3, is a nucleoplasmic protein that aggregates into denser nuclear bodies under conditions of stressJournal of Cellular Biochemistry 112:1612–1621.https://doi.org/10.1002/jcb.23075
-
Histone deacetylase activity is retained in primary neurons expressing mutant huntingtin proteinJournal of Neurochemistry 87:257–267.https://doi.org/10.1046/j.1471-4159.2003.01991.x
-
Topoisomerase 1 and single-strand break repair modulate transcription-induced CAG repeat contraction in human cellsMolecular and Cellular Biology 31:3105–3112.https://doi.org/10.1128/MCB.05158-11
-
Synthetic spike-in standards for RNA-seq experimentsGenome Research 21:1543–1551.https://doi.org/10.1101/gr.121095.111
-
The physiological roles of histone deacetylase (HDAC) 1 and 2: complex co-stars with multiple leading partsBiochemical Society Transactions 41:741–749.https://doi.org/10.1042/BST20130010
-
Dramatic tissue-specific mutation length increases are an early molecular event in Huntington disease pathogenesisHuman Molecular Genetics 12:3359–3367.https://doi.org/10.1093/hmg/ddg352
-
Svaseq: removing batch effects and other unwanted noise from sequencing dataNucleic Acids Research 42:e161.https://doi.org/10.1093/nar/gku864
-
The sequence alignment/Map format and SAMtoolsBioinformatics 25:2078–2079.https://doi.org/10.1093/bioinformatics/btp352
-
Transcription-induced CAG repeat contraction in human cells is mediated in part by transcription-coupled nucleotide excision repairMolecular and Cellular Biology 27:6209–6217.https://doi.org/10.1128/MCB.00739-07
-
Genomic targets, and histone acetylation and gene expression profiling of neural HDAC inhibitionNucleic Acids Research 41:8072–8084.https://doi.org/10.1093/nar/gkt590
-
HDAC3 is a critical negative regulator of Long-Term memory formationJournal of Neuroscience 31:764–774.https://doi.org/10.1523/JNEUROSCI.5052-10.2011
-
Human HDAC1 and HDAC2 function in the DNA-damage response to promote DNA nonhomologous end-joiningNature Structural & Molecular Biology 17:1144–1151.https://doi.org/10.1038/nsmb.1899
-
Neil1 is a genetic modifier of somatic and germline CAG trinucleotide repeat instability in R6/1 miceHuman Molecular Genetics 21:4939–4947.https://doi.org/10.1093/hmg/dds337
-
Maintenance of cardiac energy metabolism by histone deacetylase 3 in miceJournal of Clinical Investigation 118:3588–3597.https://doi.org/10.1172/JCI35847
-
Histone deacetylase 10 regulates DNA mismatch repair and may involve the deacetylation of MutS homolog 2Journal of Biological Chemistry 290:22795–22804.https://doi.org/10.1074/jbc.M114.612945
-
Transcriptional dysregulation in Huntington's disease: The role of histone deacetylasesPharmacological Research 100:157–169.https://doi.org/10.1016/j.phrs.2015.08.002
-
Neuropathological classification of Huntington's diseaseJournal of Neuropathology and Experimental Neurology 44:559–577.https://doi.org/10.1097/00005072-198511000-00003
-
RSeQC: quality control of RNA-seq experimentsBioinformatics 28:2184–2185.https://doi.org/10.1093/bioinformatics/bts356
-
Length-dependent gametic CAG repeat instability in the Huntington's disease knock-in mouseHuman Molecular Genetics 8:115–122.https://doi.org/10.1093/hmg/8.1.115
-
Mismatch repair gene Msh2 modifies the timing of early disease in hdh(Q111) striatumHuman Molecular Genetics 12:273–281.https://doi.org/10.1093/hmg/ddg056
-
HDAC6 regulates DNA damage response via deacetylating MLH1Journal of Biological Chemistry 294:5813–5826.https://doi.org/10.1074/jbc.RA118.006374
Article and author information
Author details
Stephen J Haggarty

Funding
Huntington Society of Canada (New Pathways Research Grant)
- Vanessa C Wheeler
National Institutes of Health (NS049206)
- Vanessa C Wheeler
Huntington's Disease Society of America (Berman Topper Career Development Award)
- Ricardo Mouro Pinto
National Institutes of Health (GM38219)
- John H Wilson
National Institutes of Health (EY11731)
- John H Wilson
National Institutes of Health (1F3HG004918)
- Leroy Hubert
The funders had no role in study design, data collection and interpretation, or the decision to submit the work for publication.
Acknowledgements
We are very grateful to Dr. Michelle Ehrlich for providing the DARPP-32 Cre transgenic mice, and to Dr. Eric Olson for providing the Hdac2 and Hdac3 floxed mice. We would like to thank CHDI for providing the ‘allelic series’ RNA-seq data described in Langfelder et al., 2016.
Ethics
Animal experimentation: This study was carried out in accordance with the recommendations in the Guide for the Care and Use of Laboratory Animals of the National Institutes of Health under an approved protocol (2009N000216) of the Massachusetts General Hospital Subcommittee on Research Animal Care.
Copyright
© 2020, Kovalenko et al.
This article is distributed under the terms of the Creative Commons Attribution License, which permits unrestricted use and redistribution provided that the original author and source are credited.
Metrics
-
- 2,316
- views
-
- 327
- downloads
-
- 18
- citations
Views, downloads and citations are aggregated across all versions of this paper published by eLife.
Citations by DOI
-
- 18
- citations for umbrella DOI https://doi.org/10.7554/eLife.55911
Download links
A two-part list of links to download the article, or parts of the article, in various formats.
Downloads (link to download the article as PDF)
Open citations (links to open the citations from this article in various online reference manager services)
Cite this article (links to download the citations from this article in formats compatible with various reference manager tools)
Histone deacetylase knockouts modify transcription, CAG instability and nuclear pathology in Huntington disease mice
eLife 9:e55911.
https://doi.org/10.7554/eLife.55911


