The genetic architecture of NAFLD among inbred strains of mice
- University of California, Los Angeles, United States
- University of Oslo, Norway
- Harvard Medical School, United States
- Bristol-Myers Squibb, United States
Abstract
To identify genetic and environmental factors contributing to the pathogenesis of non-alcoholic fatty liver disease, we examined liver steatosis and related clinical and molecular traits in more than 100 unique inbred mouse strains, which were fed a diet rich in fat and carbohydrates. A >30-fold variation in hepatic TG accumulation was observed among the strains. Genome-wide association studies revealed three loci associated with hepatic TG accumulation. Utilizing transcriptomic data from the liver and adipose tissue, we identified several high-confidence candidate genes for hepatic steatosis, including Gde1, a glycerophosphodiester phosphodiesterase not previously implicated in triglyceride metabolism. We confirmed the role of Gde1 by in vivo hepatic over-expression and shRNA knockdown studies. We hypothesize that Gde1 expression increases TG production by contributing to the production of glycerol-3-phosphate. Our multi-level data, including transcript levels, metabolite levels, and gut microbiota composition, provide a framework for understanding genetic and environmental interactions underlying hepatic steatosis.
https://doi.org/10.7554/eLife.05607.001eLife digest
Non-alcoholic fatty liver disease is a major health problem worldwide and is caused by an abnormal build-up of fat molecules in liver cells that disrupts how the cells work. Although many people with the disease show only mild or no symptoms, if the disease progresses the consequences—such as organ damage and an increased risk of liver cancer—can be severe.
Although non-alcoholic fatty liver disease has been linked with obesity and diabetes, how it develops is poorly understood. The most widely supported explanation suggests that the disease begins with an imbalance in the process that normally maintains the correct amount of fat molecules called triglycerides inside cells. As a result, triglycerides accumulate in the liver cells in a process known as steatosis, which is then thought to make the liver vulnerable to further problems. However, this theory has been questioned by genetic experiments that suggest triglyceride build-up actually protects cells from other kinds of damage.
Hui et al. studied mice that had been fed a diet that was high in fat and sugar. The extent of liver steatosis varied considerably between the mice, with some mice accumulating 30 times more triglyceride in their liver than others. The underlying variation in the genes of the mice was then examined to investigate whether this can explain the differences in liver condition. This revealed at least three DNA stretches that appear to be linked to triglyceride accumulation in the liver, including several genes that appear to be active during steatosis. One of these genes, known as Gde1, had not previously been shown to have a role in controlling how cells make and use triglycerides.
To confirm the role of Gde1, Hui et al. artificially turned the gene on in some mice and prevented it from turning on in others. Turning on Gde1 significantly increased the amount of triglyceride in the liver and keeping it turned off decreased triglyceride levels. Hui et al. suggest that this is because Gde1 helps to make a precursor molecule that is needed to build triglycerides. Certain gut bacteria also appear to be linked to steatosis.
This study used a population-based approach in mice to examine genetic factors in the development of fatty liver disease. The challenge now is to find out how the genes work and to understand their interactions with each other and with the environment.
https://doi.org/10.7554/eLife.05607.002Introduction
Non-alcoholic fatty liver disease (NAFLD) encompasses a wide spectrum of liver abnormalities, ranging from benign hepatocellular accumulation of lipids (steatosis), through non-alcoholic steatohepatitis (NASH), to fibrosis and cirrhosis in the absence of excessive consumption of alcohol and hepatitis viral infection. Advanced NAFLD can eventually progress to end-stage liver disease with increased risk of hepatocellular carcinoma (HCC) (Kopec and Burns, 2011). Population studies have shown that NAFLD is strongly associated with obesity, diabetes, and dyslipidemia (Marchesini et al., 2003). As such, NAFLD can be viewed as the hepatic manifestation of the metabolic syndrome. With the increasing prevalence of obesity, diabetes, and metabolic syndrome, it is not surprising that NAFLD is rapidly becoming the most common form of chronic liver disease worldwide (Ratziu et al., 2010). It is estimated that 20–30% of the population in Western developed countries is affected (Vernon et al., 2011). Despite the high prevalence of this disease, its natural history and etiology is poorly understood. Although simple steatosis appears to be benign and non-progressive in the majority of individuals affected with NAFLD (Teli et al., 1995), excessive fat accumulation in the liver is associated with organ pathology, including NASH and cirrhosis. NASH frequently progresses to fibrosis, cirrhosis, liver failure, and HCC, resulting in poor long-term prognosis.
The factors determining the progressive phenotype of this complex disease remain largely unknown, although it is clear that subtle genetic variations and environmental factors (such as diet and lifestyle) play a role in determining the disease phenotype and progression (Day, 2002; Anstee et al., 2011). According to the prevailing ‘two-hit hypothesis’ model (Day and James, 1998), it is believed that the first insult involves lipid accumulation in the hepatocytes, due to an imbalance in triglyceride homeostasis. Subsequently, steatosis increases the vulnerability of the liver to a ‘second hit’, which promotes liver injury, oxidative stress, inflammation, and fibrosis. However, silencing of diacylglycerol acyltransferase 2 (DGAT2) by an antisense oligo improved steatosis but worsened liver injury and fibrosis in mice (Yamaguchi et al., 2007). DGAT2-knockdown mice exhibit increased fatty acid (FA) oxidation through CYP2E1, leading to increased oxidative stress, inflammation, and tissue damage. These findings lead to the proposal that steatosis may be an adaptive response to protect the liver from lipotoxicity through partitioning toxic lipids into stable intracellular triglyceride stores. Hence, despite the fact that accumulation of TG was alleviated in DGAT2-knockdown liver, blocking this protective mechanism exacerbated lipotoxicity and led to more severe liver injury. These data suggest that TG accumulation per se is not the ‘first hit’ but the underlying inability to compensate for increased FA flux, which makes the liver prone to subsequent oxidative damage. It is proposed that the ‘second hit’ could involve diverse parallel pro-inflammatory signals derived from multiple sources (Tilg and& Moschen, 2010).
So far, there exists no established therapy targeting NAFLD. Since most NAFLD patients suffer from obesity and insulin resistance, treatment options aim at weight reduction, control of dyslipidemia and improving insulin sensitivity through lifestyle changes and pharmacological agents, such as metformin, statins, fibrates, and thiazolidinediones (Schreuder et al., 2008). Understanding the underlying genetic factors contributing to NAFLD would not only fill the void of knowledge but would also facilitate the design of effective strategies in treating and preventing this important disease.
Considerable variations in the flux of TG and FAs occur in the liver in response to changing nutritional and hormonal status. Nevertheless, under normal physiological conditions, the liver does not accumulate considerable amounts of TG despite its active regulatory role in lipid trafficking. Processes that offset the balance of TG acquisition and disposition give rise to hepatic steatosis, which is the hallmark of NAFLD. These include increased FA uptake or de novo biosynthesis, reduced FA oxidation, and impaired lipoprotein production and secretion (Farrell and Larter, 2006). The FA moiety of hepatic TG is derived from three major sources: diet, de novo biosynthesis, and adipose tissue. In humans, it is estimated that 15% of hepatic TG comes directly from the diet, 26% from de novo lipogenesis, and 59% from adipose tissue in the form of non-esterified FAs (Donnelly et al., 2005). Together, the adipose tissue and liver play a major role in hepatic TG accumulation and supply >85% of FAs for the biosynthesis of TG in the liver.
Epidemiologic studies in human populations and animal studies indicate that genetics plays a substantial role in determining the susceptibility to the development of NAFLD (Browning et al., 2004; Guerrero et al., 2009; Kahle et al., 2013). The coexistence of NASH and cirrhosis clusters within families supports the existence of a common genetic link (Struben et al., 2000; Willner et al., 2001). The broad-sense heritability of hepatic steatosis has been estimated to be ∼39% after adjustment for age, sex, race, and body mass index (Schwimmer et al., 2009). Although genetic predisposition to obesity and diabetes undoubtedly explains a fraction of the genetic component, additional independent genetic factors clearly contribute to the susceptibility to NAFLD (Browning et al., 2004). To date, only a small fraction of genes accounting for fatty liver disease have been identified and the molecular pathogenesis of NAFLD is poorly understood.
To gain insight into the etiology of NAFLD, we have employed a ‘systems genetics’ strategy to generate a comprehensive view of the genetic architecture of NAFLD in mice (Civelek and Lusis, 2014; Mato et al., 2014). We examined natural variations in the development of steatosis in a panel of inbred strains of mice fed a high-fat, high-sucrose (HF/HS) diet for 8 weeks. This diet has previously been shown to have a profound effect on obesity and insulin resistance depending upon the genetic background (Parks et al., 2013). We observed a wide range in phenotypes associated with hepatic steatosis following feeding the HF/HS diet. To further understand the molecular basis of steatosis, we employed a multi-omic approach to characterize the steatotic phenotype. Using global expression analysis of liver and adipose transcriptomes, we identified pathways enriched in strains susceptible to steatosis. We also showed that the susceptibility to steatosis is highly dependent on genetic background and was able to identify genetic loci contributing to steatosis. A causal gene at one of the loci was identified as Gde1. Furthermore, we identified metabolites and gut microbes, which are associated with steatosis. These multi-dimensional data provide a valuable resource for understanding the genetic–environmental interactions in the disorder.
Results
Large genetic variation in hepatic TG accumulation in mice fed with HF/HS diet
NAFLD is often referred to as the hepatic manifestation of metabolic syndrome, as it is associated with obesity, dyslipidemia, and insulin resistance (Lazo and& Clark, 2008). The development of NAFLD is strongly influenced by both dietary and genetic factors. We previously showed that the increase in body weight and fat accumulation in response to a HF/HS diet in mice is highly dependent on the genetic background of individual strains (Parks et al., 2013). To study the gene-by-diet effects on hepatic steatosis, a panel of 8-week-old male HMDP mice were fed a HF/HS diet for 8 weeks to induce obesity and steatosis (Parks et al., 2013). Lipids were extracted and quantified in 478 individual livers from 113 strains of male mice. A wide spectrum of hepatic TG content was observed among the strains with more than 30-fold difference between the high and low responders (Figure 1A and Supplementary file 1). Hepatic TG content was significantly correlated with the liver weight (r = 0.38, p = 5.75 × 10⁻¹⁴, Figure 1B). Contrary to the large variations in TG among strains, less than threefold difference in cholesterol and phospholipid levels was observed among the strains (Supplementary file 1). Modest correlations between these lipids with hepatic TG were observed. The TG content in the liver was positively correlated with hepatic total cholesterol (TC) content (r = 0.35, p = 1.18 × 10⁻¹², Figure 1C) but negatively correlated with the levels of phospholipids (r = −0.26, p = 3.45 × 10⁻⁷, Figure 1D). These data suggest that increased neutral lipids content, in particular TG, contributes significantly to the enlarged livers.
Figure 1

Effects of genetic background on hepatic TG accumulation.
(A) Hepatic TG levels in male mice after 8 weeks of HF/HS feeding. Results are presented as mean + SD. (B–D) Correlation of hepatic TG with liver weight (B), hepatic total cholesterol (TC) (C), and hepatic phospholipid (D). r, biweight midcorrelation; p, p-value.
To assess liver damage, we measured alanine aminotransferase (ALT) enzyme activity in the plasma (Figure 2A). Similar to hepatic TG content, we also observed a large variation in ALT activities among the strains. Plasma ALT activities showed a positive correlation with hepatic TG levels, implicating a role of increased hepatic TG levels in liver damage (Figure 2B). ALT is an established biochemical and clinical marker for liver damage as this enzyme is released into the circulation when the integrity of the cell membrane of hepatocytes is compromised. We performed histologic examination of livers from a subset of strains including some with high TG and did not observe evidence of significant pathology other than lipid accumulation (data not shown). Furthermore, mRNA levels of markers for B-lymphocytes (CD45/PTPPRC) and macrophages (CD68) were not increased in steatotic liver samples (Figure 2C,D). Similarly, markers for other immune cells, such as T cells (Cd28, Csf2, Cd4, Ccr5, Gata3 Cxcr4), B cells (Pax5, Cd70, Cd79b), and leukocytes (Cd33, Cd52, Cd53, Cd44, Prg2) were also not increased (data not shown), suggesting the absence of significant immune cell infiltration and steatohepatitis in these mice after 8 weeks on the HF/HS diet.
Figure 2
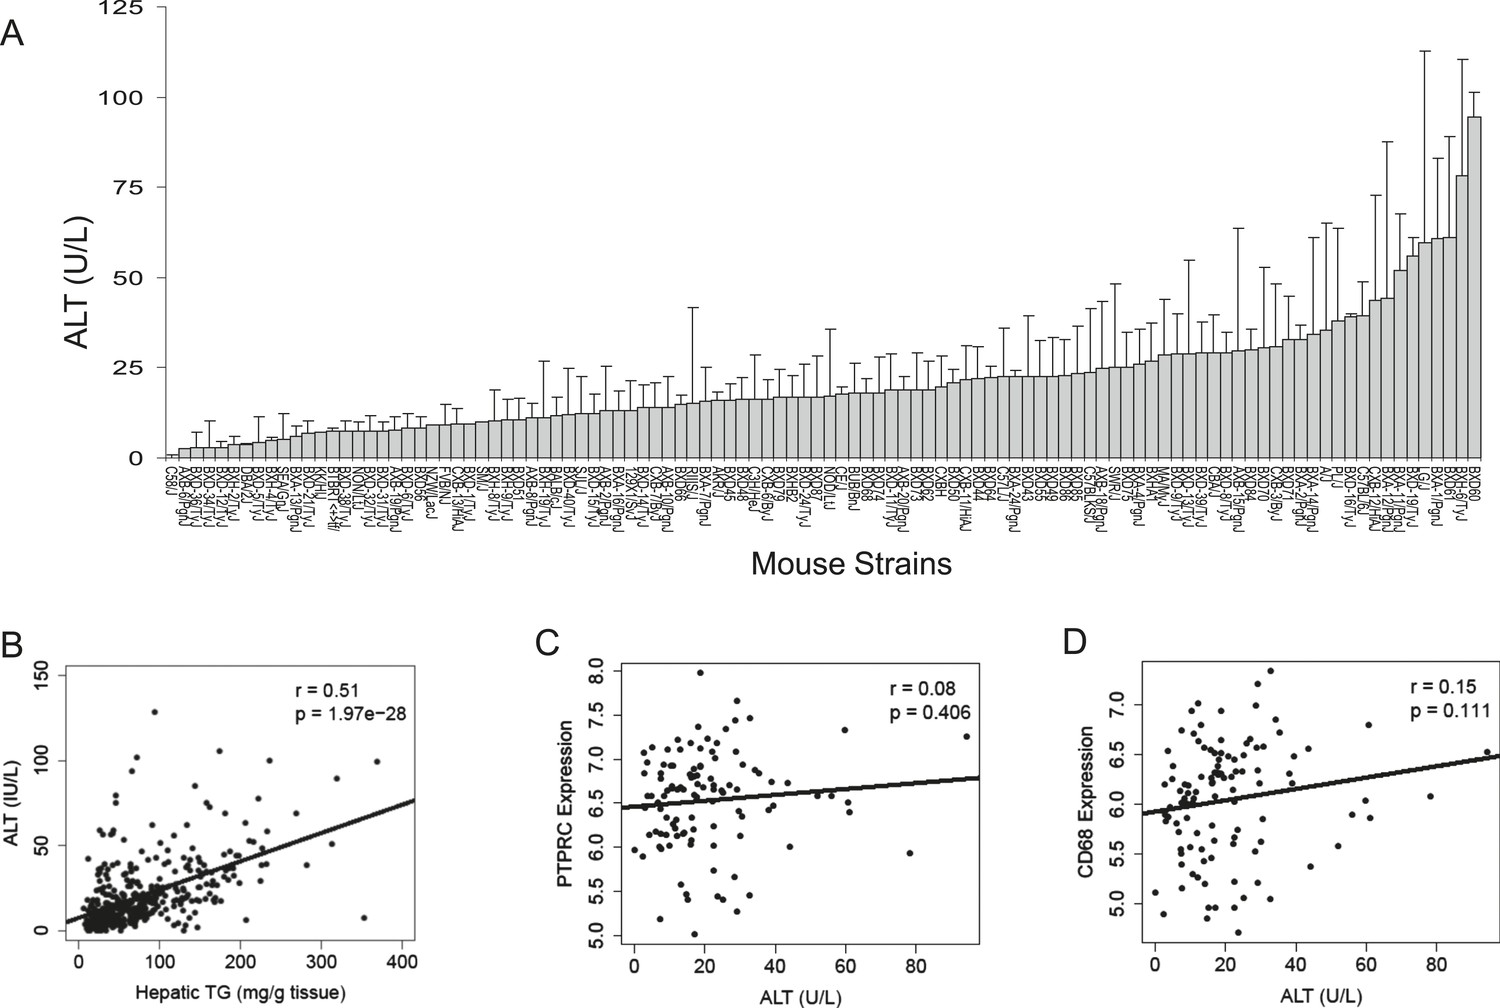
Plasma ALT activities and immune cell marker expression among inbred and recombinant inbred strains of mice.
(A) Plasma alanine aminotransferase (ALT) activities in male mice after 8 weeks of HF/HS feeding. Results are presented as mean + SD. (B–D) Correlation of plasma ALT activities with hepatic triglyceride (B), hepatic Ptprc (Cd45r) expression (C) and hepatic. Cd68 expression. r, biweight midcorrelation; p, p-value.
Hepatic TG accumulation is highly correlated with plasma cholesterol, insulin resistance, and adiposity
A substantial amount of hepatic TG is derived from FAs of extrahepatic sources, in particular, the white adipose tissue. We measured lipid and metabolites in the plasma and compared them to the hepatic TG content. Hepatic TG content was poorly correlated with plasma TG levels (r = −0.13, p = 0.0115, Figure 3A), whereas it was positively correlated with plasma cholesterol levels (r = 0.41, p = 5.04 × 10⁻¹⁷, Figure 3B). The correlation between hepatic TG levels and plasma free FAs (FFAs) levels was not significant (r = 0.04, p = 0.44); however, hepatic TG levels were correlated with plasma glycerol levels (r = 0.20, p = 0.0001, Figure 3C), suggesting a link between liver steatosis and lipolysis in the adipose tissue. NAFLD is often associated with dyslipidemia (Diehl et al., 1988) and insulin resistance (Marchesini et al., 1999) in humans. Similar to the findings in humans, there was a robust association between hepatic steatosis and plasma insulin (r = 0.47, p = 4.51 × 10⁻²¹, Figure 3D), glucose (r = 0.23, p = 1.26 × 10⁻⁵, Figure 3E) as well as insulin resistance (HOMA-IR) (r = 0.45, p = 2.18 × 10⁻²⁰, Figure 3F).
Figure 3
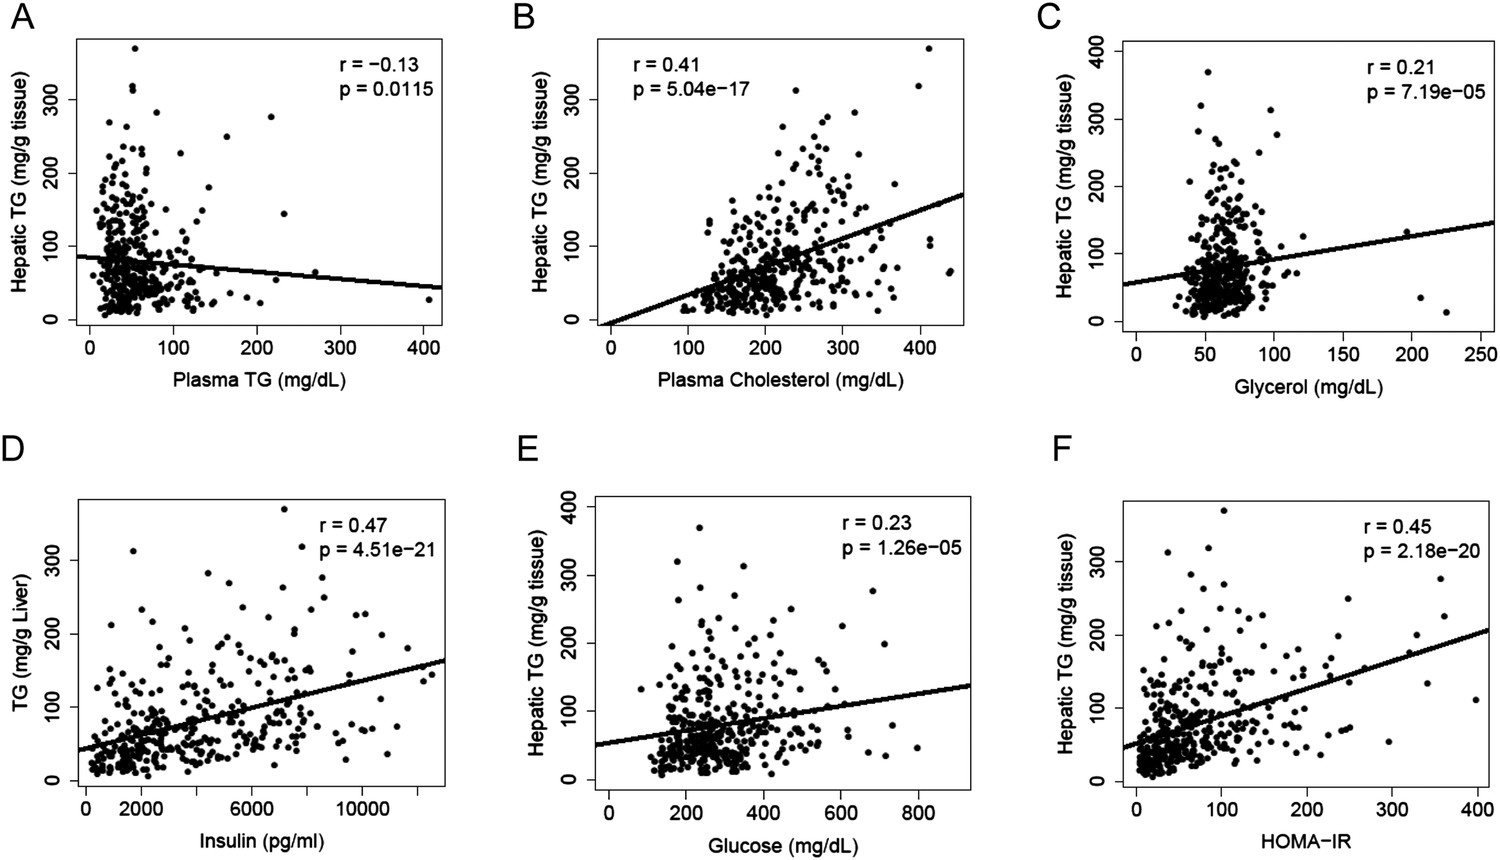
Correlation of hepatic TG content with plasma metabolites and HOMA-IR.
(A–F) Correlation of hepatic TG with plasma TG (A), plasma cholesterol (B), plasma glycerol (C), plasma insulin (D), plasma glucose (E), and HOMA-IR (F). r, biweight midcorrelation; p, p-value.
Increased adiposity has been linked to the incidence of NAFLD in humans. Consistent with this finding, there was a robust correlation between hepatic TG levels and adiposity (r = 0.59, p = 6.70 × 10⁻³⁵, Figure 4A). We dissected the individual fat depots and found that steatosis was associated with increased subcutaneous, gonadal and mesenteric fat mass but not with retroperitoneal fat content (Figure 4B–E). The aforementioned p-values were not adjusted for multiple testing since the correlation analyses were performed based on knowledge of potential association between NAFLD and those clinical traits (e.g., insulin resistance, plasma lipids, and adiposity). Nevertheless, the correlations remained significant after Bonferroni correction for all measured traits.
Figure 4
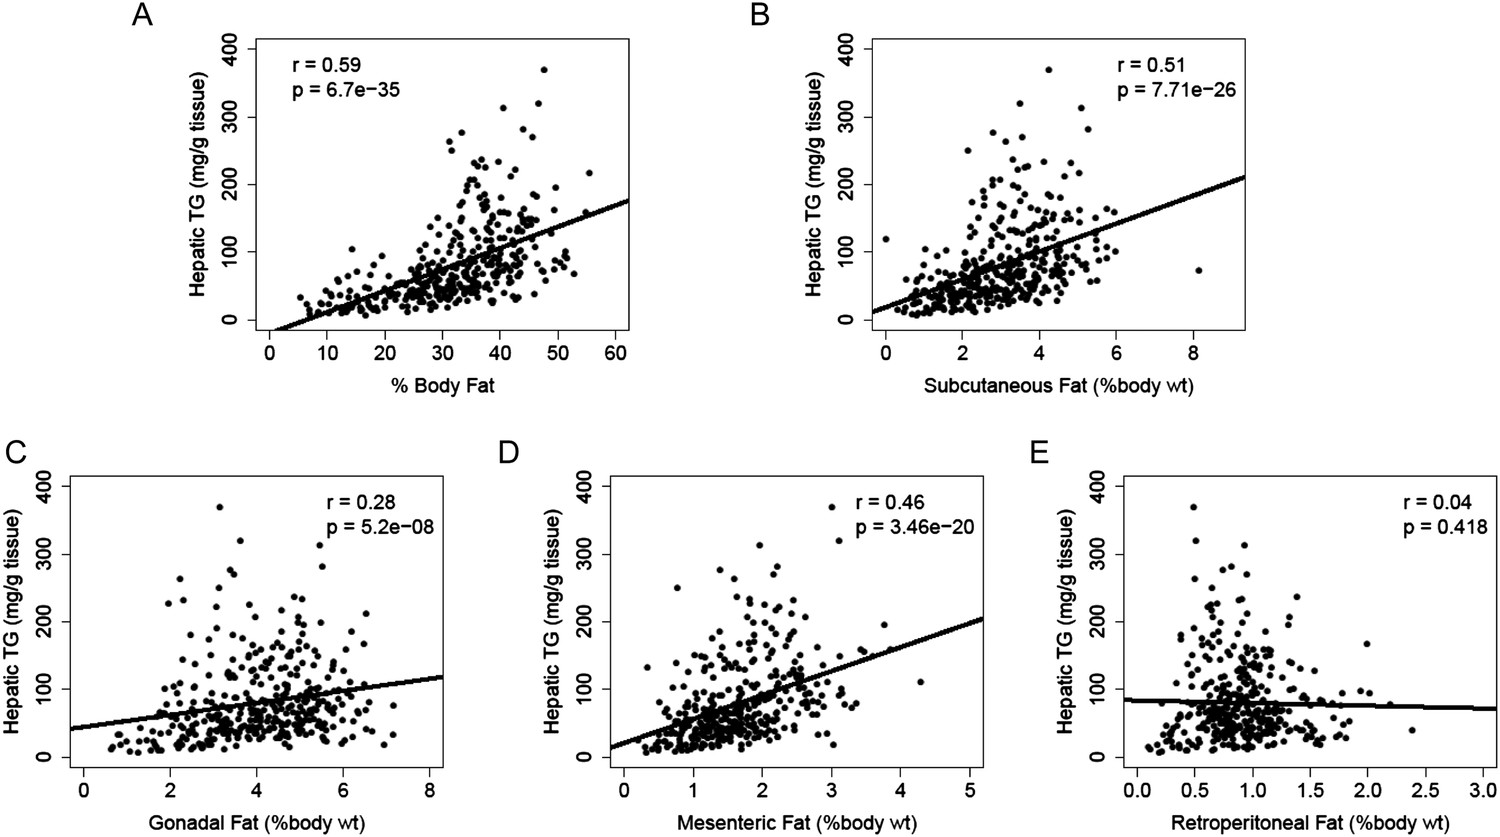
Correlation of hepatic TG content with adiposity and fat mass.
(A–E) Correlation of hepatic TG with adiposity (A), subcutaneous fat (B), gonadal fat (C), mesenteric fat (D), and retroperitoneal fat (E). r, biweight midcorrelation; p, p-value.
Transcriptomic analysis of the liver and adipose tissue
As liver and adipose tissues are primarily responsible for modulating liver TG accumulation, we performed transcriptomic analysis on these two tissues to gain insights into the pathogenesis of steatosis. Tables 1, 2 show the top 50 most correlated genes with hepatic TG levels in the liver and adipose, respectively. None of the genes is in close proximity (<1.5 Mb) to each other on the same chromosome, and thus, it is unlikely that some were correlated due to shared linkage disequilibrium (LD) blocks with biologically linked genes.
Table 1
Top 50 liver genes correlated with hepatic TG levels
| Rank | Gene symbol | r | P |
|---|---|---|---|
| 1 | Cd36 | 0.695 | 1.85E-17 |
| 2 | Mrpl16 | 0.622 | 2.57E-13 |
| 3 | Enc1 | 0.611 | 8.12E-13 |
| 4 | 2010003K11Rik | 0.600 | 2.84E-12 |
| 5 | Tceal8 | 0.599 | 3.00E-12 |
| 6 | Cmpk1 | 0.598 | 3.32E-12 |
| 7 | Avpr1a | −0.595 | 4.45E-12 |
| 8 | Hmgcl | 0.590 | 7.60E-12 |
| 9 | Akap2 | 0.581 | 1.86E-11 |
| 10 | C1ra | −0.572 | 4.34E-11 |
| 11 | Reep3 | 0.562 | 1.16E-10 |
| 12 | Skp1a | 0.554 | 2.33E-10 |
| 13 | Esd | 0.551 | 3.11E-10 |
| 14 | Hadh | 0.550 | 3.48E-10 |
| 15 | Syap1 | 0.549 | 3.66E-10 |
| 16 | Ermp1 | 0.545 | 5.44E-10 |
| 17 | Ang | −0.544 | 5.53E-10 |
| 18 | Dak | 0.543 | 6.24E-10 |
| 19 | Matr3 | −0.541 | 7.12E-10 |
| 20 | Nudt9 | 0.538 | 9.35E-10 |
| 21 | Srsf5 | −0.538 | 9.89E-10 |
| 22 | Vps29 | 0.537 | 1.04E-09 |
| 23 | Ttc23 | 0.537 | 1.05E-09 |
| 24 | Entpd5 | 0.536 | 1.14E-09 |
| 25 | Chchd6 | 0.535 | 1.27E-09 |
| 26 | Plekha1 | 0.534 | 1.32E-09 |
| 27 | Mogat1 | 0.531 | 1.76E-09 |
| 28 | S100a10 | 0.528 | 2.11E-09 |
| 29 | Plin4 | 0.527 | 2.36E-09 |
| 30 | Anxa2 | 0.525 | 2.73E-09 |
| 31 | Srxn1 | 0.524 | 2.96E-09 |
| 32 | Cstb | 0.523 | 3.36E-09 |
| 33 | Cml1 | −0.522 | 3.70E-09 |
| 34 | Tpp1 | 0.521 | 4.00E-09 |
| 35 | Apoc2 | 0.518 | 5.06E-09 |
| 36 | F7 | −0.515 | 6.32E-09 |
| 37 | Wfdc2 | 0.514 | 6.72E-09 |
| 38 | Bche | 0.514 | 6.72E-09 |
| 39 | Mms19 | −0.514 | 6.74E-09 |
| 40 | Jun | 0.513 | 7.05E-09 |
| 41 | Lifr | −0.513 | 7.33E-09 |
| 42 | Gjb1 | −0.512 | 7.63E-09 |
| 43 | Fabp2 | 0.511 | 8.56E-09 |
| 44 | Morc4 | 0.510 | 9.22E-09 |
| 45 | Rnf11 | 0.510 | 9.33E-09 |
| 46 | Egfr | −0.509 | 1.03E-08 |
| 47 | Slc16a7 | 0.507 | 1.12E-08 |
| 48 | Gfm1 | 0.505 | 1.32E-08 |
| 49 | Chpt1 | 0.505 | 1.33E-08 |
| 50 | Rbbp4 | −0.505 | 1.33E-08 |
Table 2
Top 50 adipose genes correlated with hepatic TG levels
| Rank | Gene symbol | r | p |
|---|---|---|---|
| 1 | Nrbp2 | −0.624 | 2.42E-13 |
| 2 | Cp | −0.598 | 4.15E-12 |
| 3 | Hoxa7 | −0.591 | 8.42E-12 |
| 4 | Prkcb | 0.585 | 1.62E-11 |
| 5 | Cstb | 0.582 | 2.03E-11 |
| 6 | Cd53 | 0.582 | 2.06E-11 |
| 7 | Smap2 | 0.580 | 2.62E-11 |
| 8 | Sft2d1 | 0.578 | 3.04E-11 |
| 9 | Btk | 0.576 | 3.56E-11 |
| 10 | Was | 0.576 | 3.62E-11 |
| 11 | Il7r | 0.575 | 3.94E-11 |
| 12 | Tmem53 | −0.573 | 4.77E-11 |
| 13 | Rgs10 | 0.572 | 5.70E-11 |
| 14 | Srp19 | 0.571 | 6.27E-11 |
| 15 | Gpc3 | −0.570 | 6.53E-11 |
| 16 | Bcl10 | 0.570 | 6.72E-11 |
| 17 | Gpr65 | 0.570 | 6.82E-11 |
| 18 | Tlr7 | 0.569 | 7.18E-11 |
| 19 | Efhd2 | 0.569 | 7.26E-11 |
| 20 | Actr3 | 0.568 | 7.77E-11 |
| 21 | Cd72 | 0.568 | 8.02E-11 |
| 22 | Dera | 0.567 | 8.89E-11 |
| 23 | Pip4k2a | 0.566 | 9.63E-11 |
| 24 | Hcst | 0.566 | 9.64E-11 |
| 25 | Tyms | 0.566 | 9.78E-11 |
| 26 | Cenpv | −0.566 | 9.79E-11 |
| 27 | Plxnc1 | 0.565 | 1.05E-10 |
| 28 | Birc5 | 0.565 | 1.07E-10 |
| 29 | Ptpn18 | 0.563 | 1.27E-10 |
| 30 | Hoxa5 | −0.562 | 1.37E-10 |
| 31 | Fam105a | 0.562 | 1.43E-10 |
| 32 | Capza1 | 0.562 | 1.44E-10 |
| 33 | Nap1l3 | −0.561 | 1.50E-10 |
| 34 | Rgs18 | 0.561 | 1.51E-10 |
| 35 | Phtf2 | 0.560 | 1.59E-10 |
| 36 | Nckap1l | 0.560 | 1.65E-10 |
| 37 | Coro1c | 0.560 | 1.67E-10 |
| 38 | Coro1a | 0.559 | 1.78E-10 |
| 39 | Lrrfip1 | 0.559 | 1.89E-10 |
| 40 | C1qb | 0.557 | 2.13E-10 |
| 41 | Taok3 | 0.556 | 2.28E-10 |
| 42 | Ms4a6c | 0.556 | 2.29E-10 |
| 43 | Bco2 | −0.556 | 2.33E-10 |
| 44 | Adrb3 | −0.556 | 2.34E-10 |
| 45 | Arhgap9 | 0.556 | 2.37E-10 |
| 46 | Lrmp | 0.556 | 2.47E-10 |
| 47 | Fyb | 0.555 | 2.50E-10 |
| 48 | Lipa | 0.555 | 2.63E-10 |
| 49 | Cdt1 | 0.555 | 2.65E-10 |
| 50 | S100a4 | 0.554 | 2.80E-10 |
In the liver, Cd36 had the highest correlation with TG levels (r = 0.70, p = 1.85 × 10⁻¹⁷). CD36 is a multifunctional protein that enhances cellular FA uptake. Previous studies have shown that CD36-deficient mice are resistant to the induction of hepatic steatosis by alcohol and high-carbohydrate feeding (Clugston et al., 2014). Besides Cd36, many genes involved in lipid metabolism were also among the most correlated genes: Hmgcl (HMG-CoA lyase), Hadh (hydroxyacyl-CoA dehydrogenase), Mogat1 (monoacylglycerol O-acyltransferase 1), Plin4 (perlipin 4), Apoc2 (apolipoprotein C-II), Fabp2 (FA binding protein 2), Slc16a7 (monocarboxylic acid transporters), and Chpt1 (diacylglycerol cholinephosphotransferase). Interestingly, expression of the proto-oncogene c-Jun was positively correlated with hepatic TG content (r = 0.51, p = 7.05 × 10−09). Enhanced hepatic c-Jun levels were observed in NAFLD patients, which correlated with inflammation and the degree of hepatic steatosis (Dorn et al., 2014). Increased c-Jun/AP-1 activation has been implicated in the progression of NAFLD (Dorn et al., 2014; Hasenfuss et al., 2014).
In the adipose, hepatic steatosis was significantly correlated with genes associated with adiposity and inflammation. Prkcb (protein kinase cβ), whose expression was significantly correlated with hepatic steatosis (r = 0.58, p = 1.62 × 10⁻¹¹), has been shown to be important in adipose tissue remodeling and FA metabolism (Huang et al., 2012). Prkcb-null mice are protected against diet-induced obesity and the development of hepatic steatosis and insulin resistance (Huang et al., 2009). Cd53, an adipose inflammatory marker, was also highly correlated with hepatic steatosis (r = 0.58, p = 2.06 × 10⁻¹¹). Previous microarray profiling showed that Cd53 was significantly up-regulated in preadipocytes from obese human subjects (Nair et al., 2005).
Additionally, expression of many genes participating in immune response and inflammatory response was elevated in steatotic livers (Bcl10, Il7r, Tlr7, and C1qb). Hcst (hematopoietic cell signal transducer), previously shown to be a key hub gene in gene co-expression network that was significantly associated with serum TG levels (Haas et al., 2012) in humans, was also highly correlated with hepatic TG content (r = 0.57, p = 9.64 × 10⁻¹¹). The homeobox transcription factor Hoxa5 has previously been shown to be up-regulated after fat loss in human patients who have undergone bariatric surgery (Dankel et al., 2010). In our study, Hoxa5 expression was negatively correlated with hepatic TG content (r = −0.56, p = 1.37 × 10⁻¹⁰). Human GWAS studies have shown that a missense mutation in LRRFIP1 was associated with adiposity and inflammation (Plourde et al., 2013). Lrrfip1 expression was significantly associated with hepatic steatosis in our study (r = 0.56, p = 1.89 × 10⁻¹⁰). Adrb3 (β3-adrenergic receptor) activation induces white adipose remodeling and brown adipogensis (Lee et al., 2012). In our study, Adrb3 expression was negatively correlated with hepatic TG levels (r = −0.56, p = 2.34 × 10⁻¹⁰). Increased expression of Lipa (lysosomal acid lipase), which is involved in lysosomal lipophagy and TG/cholesterol ester catabolism, was found to be associated with hepatic steatosis (r = 0.56, p = 2.63 × 10⁻¹⁰).
Enrichment analysis using the top 1000 hepatic genes correlated with hepatic TG levels (Table 3) showed a significant enrichment of mitochondrial genes (1.57 fold, adjusted p = 1.99 × 10⁻⁵). Among the 127 mitochondrial genes, the majority (100 genes) were higher in steatotic livers, suggesting that altered mitochondria function is linked to the disease process of NAFLD. In addition, components of the extracellular matrix were enriched (2.91 fold, adjusted p = 5.89 × 10⁻³) and were also predominantly (13 out of 17 genes) higher in steatotic livers (Table 3). Many of these genes are involved in wound healing and fibrosis, consistent with the observation of positive correlation between ALT and hepatic TG levels (Figure 2B). Complement and the coagulation cascade were specifically enriched (3.03 fold, adjusted p = 3.93 × 10⁻³) and the genes were predominantly (15 out of 18 genes) lower in steatotic livers. In the adipose tissue, mitotic cell cycle, actin polymerization, cytoskeleton organization, immune response, response to wounding, leukocyte activation and positive regulation of cytokine production, lysosome pathway, and B cell receptor signaling were all enriched (Table 4). These findings suggest that inflammation in adipose tissue likely plays a role in the development of NAFLD. Enrichment analysis using the top 500 positively or negatively regulated genes separately did not reveal any additional enriched pathways.
Table 3
Pathway-enrichment analysis of the top 1000 hepatic genes correlated with hepatic TG levels, assessed with the DAVID database, and presented as total genes meeting that criterion in each pathway (Count), along with Benjamini corrected p values (Adj. p)
| Category | Term | Count | Adj. p | Fold enrichment |
|---|---|---|---|---|
| GOTERM_CC_FAT | GO:0005739 ∼ mitochondrion | 127 | 1.99E-05 | 1.57 |
| KEGG_PATHWAY | mmu04610:Complement and coagulation cascades | 18 | 3.93E-03 | 3.03 |
| GOTERM_CC_FAT | GO:0044420 ∼ extracellular matrix part | 17 | 5.89E-03 | 2.91 |
Table 4
Pathway-enrichment analysis of the top 1000 adipose genes correlated with hepatic TG levels, assessed with the DAVID database, and presented as total genes meeting that criterion in each pathway (Count), along with Benjamini corrected p values (Adj. p)
| Category | Term | Count | Adj. p | Fold enrichment |
|---|---|---|---|---|
| GOTERM_BP_FAT | GO:0000087 ∼ M phase of mitotic cell cycle | 36 | 9.69E-06 | 2.87 |
| KEGG_PATHWAY | mmu04142:Lysosome | 25 | 1.73E-03 | 2.50 |
| GOTERM_BP_FAT | GO:0008064 ∼ regulation of actin polymerization or depolymerization | 19 | 5.97E-06 | 5.43 |
| GOTERM_BP_FAT | GO:0007010 ∼ cytoskeleton organization | 39 | 1.89E-02 | 1.87 |
| GOTERM_BP_FAT | GO:0006955 ∼ immune response | 50 | 1.80E-02 | 1.72 |
| GOTERM_BP_FAT | GO:0009611 ∼ response to wounding | 42 | 2.64E-02 | 1.78 |
| GOTERM_BP_FAT | GO:0045321 ∼ leukocyte activation | 34 | 7.64E-04 | 2.36 |
| KEGG_PATHWAY | mmu04662:B cell receptor signaling pathway | 20 | 8.62E-04 | 3.08 |
| GOTERM_BP_FAT | GO:0001819 ∼ positive regulation of cytokine production | 13 | 1.85E-02 | 3.56 |
The expression of several genes identified in human NAFLD GWAS also showed significant correlation with hepatic TG level (Table 5) (Romeo et al., 2008; Chambers et al., 2011; Speliotes et al., 2011; Kozlitina et al., 2014). In the liver, these included Gckr (r = 0.19, p = 0.044) and Lyplal1 (r = 0.27, p = 0.003) and in adipose these included Ncan (r = 0.37, p = 6.1 × 10⁻⁵), Tm6sf2 (r = −0.23, p = 0.012), and Trib1 (r = 0.24, p = 0.012).
Table 5
Correlation between human GWAS candidate gene expression in mouse liver and adipose tissue with hepatic TG level
Identification of a genetic loci contributing to hepatic steatosis
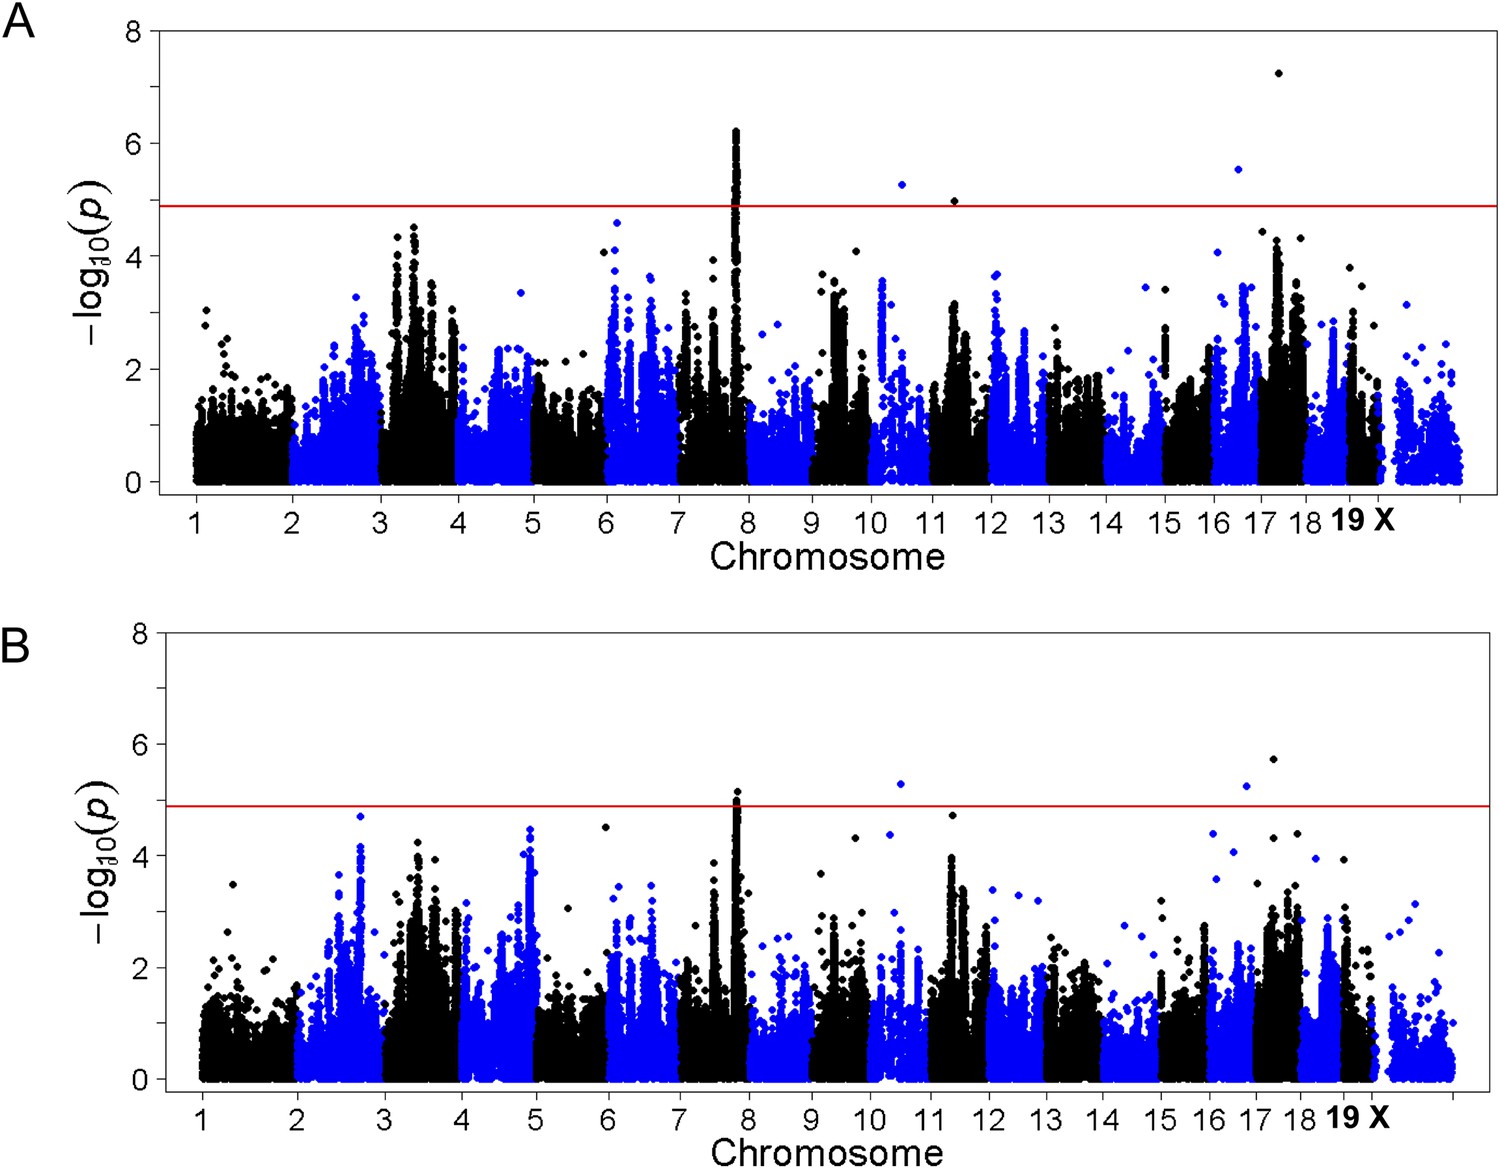
To identify genetic loci associated with hepatic steatosis, we performed GWAS analysis on the hepatic TG contents with ∼200,000 high-quality SNPs spaced throughout the genome. The genome-wide significant threshold was set at 1.31 × 10⁻⁵, which corresponds to a 1% false discovery rate (FDR). We identified one genome-wide significant peak associated with hepatic TG content on chromosome 7 (Figure 5A). This peak does not overlap with any loci identified for obesity and insulin resistance in the same cohort of mice (Parks et al., 2013, 2015). In addition, the peak locus on chromosome 7 still reached genome-wide significance when association mapping was conditioned using adiposity (% fat) or insulin resistance (HOMA-IR) as covariates (Figure 6), indicating that the effect of the chromosome 7 locus on hepatic steatosis is independent of obesity and diabetes. The peak SNP (rs32519715, p = 1.15 × 10⁻⁶) falls in a LD block containing 17 genes (Figure 5B and Table 6). Three suggestive peaks, on chromosomes 3 (rs3708683; p = 5.47 × 10⁻⁵), 9 (rs36804270; p = 1.30 × 10⁻⁵), and 11 (rs13481015; p = 1.72 × 10⁻⁵) passed the genome-wide significant threshold of 5% FDR (p = 1.34 × 10⁻⁴). The peak on chromosome 9 also coincides with a genome-wide significant locus for insulin resistance (data not shown) and contains 13 genes within the LD block, whereas the peaks on chromosomes 3 and 11 contain 12 and 15 genes, respectively, within the associated LD blocks (Table 7).
Figure 5
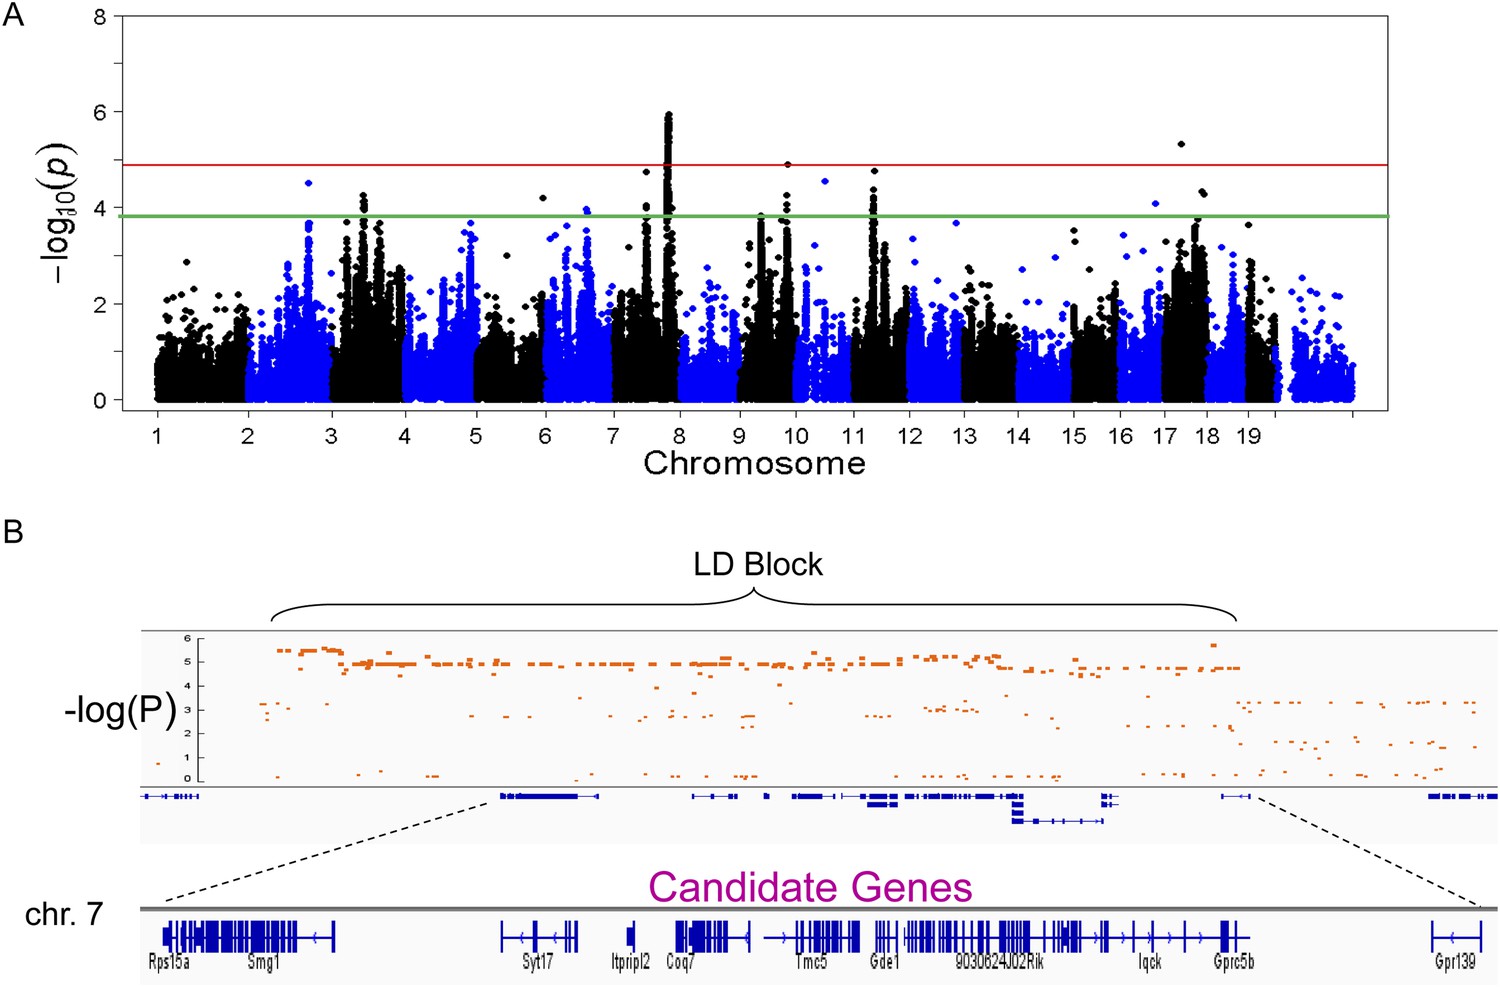
Association mapping of hepatic TG.
(A) Manhattan plot showing the significance (−log of p) of all SNPs and hepatic TG. Genome-wide significance cut-off at 1% false discovery rate (FDR) is shown by the red line and cut-off at 5% FDR is shown in green. (B) Locus plot for genome-wide significant locus on chromosome 7 with approximate linkage disequilibrium block and candidate genes.
Figure 6
Association mapping of hepatic TG with adiposity or insulin resistance as covariates.
Manhattan plot showing the significance −log10 (p value) of all SNPs and hepatic TG conditioned for percentage body fat (A) or HOMA-IR (B) as covariates. Genome-wide significance cut-off at 1% FDR is shown by the red line.
Table 6
Association p-values of candidate genes on chromosome 7 with the peak SNP for hepatic triglyceride levels
| Gene | Liver p-value | Liver expression | Adipose p-value | Adipose expression |
|---|---|---|---|---|
| Rps15a | NA | Yes | NA | Yes |
| Arl6ip1 | 0.011 | Yes | 0.294 | Yes |
| Smg1 | NA | No | NA | Yes |
| 4930583K01Rik | NA | No | NA | Yes |
| Syt7 | 0.495 | No | 0.748 | Yes |
| Itpripl2 | NA | Yes | NA | Yes |
| Coq7 | 7.18E-13 | Yes | 7.96E-14 | Yes |
| Tmc7 | NA | Yes | NA | Yes |
| Tmc5 | NA | No | NA | Yes |
| Gde1 | 3.21E-05 | Yes | 3.98E-08 | Yes |
| Ccp110 | NA | No | NA | No |
| 9030624J02Rik | NA | Yes | NA | Yes |
| Knop1 | 3.85E-07 | Yes | 0.043 | Yes |
| Iqck | NA | No | NA | No |
| Gprc5b | 0.002 | No | 0.661 | Yes |
| Gpr139 | NA | Yes | NA | No |
| Gp2 | 0.910 | No | 0.209 | No |
Table 7
Candidate genes under the chromosomes 3, 9, and 11 loci
| Chromosome 3 | Chromosome 9 | Chromosome 11 |
|---|---|---|
| 1110032F04Rik | Nphp3 | Il12b |
| Ift80 | Uba5 | Ublcp1 |
| Smc4 | Acad11 | Rnf145 |
| Trim59 | Dnajc3 | Ebf1 |
| Kpna4 | Acpp | Gm12159 |
| Gm1647 | Cpne4 | F630206G17Rik |
| Arl14 | Mrpl3 | Clint1 |
| Ppm1l | Nudt16 | Lsm11 |
| B3galnt1 | 1700080E11Rik | Thg1l |
| Nmd3 | Nek11 | Sox30 |
| Sptssb | Aste1 | Adam19 |
| Otol1 | Atp2c1 | Nipal4 |
| Pik3r4 | Cyfip2 | |
| Itk | ||
| Fam71b |
Integration of transcriptomic and association mapping data
The genetic variations underlying complex traits, such as steatosis, most often affect gene expression levels rather than structural (coding) aspects (Wang et al., 2005; Hindorff et al., 2009). Most of the large differences in gene expression are due to local differences (Orozco et al., 2012). Therefore, a useful approach to prioritizing candidate genes at a locus is to determine if the genes at the locus exhibit variation in expression that is controlled in cis. Such a variant is termed a cis-expression Quantitative Trait Locus (eQTL). We therefore identified significant cis-eQTL for liver and adipose for the genes in the chromosome 7 locus (Table 8). In addition, we asked whether the expression levels correlated with the clinical trait of interest (i.e., hepatic TG levels), since that would be consistent with a causal relationship. Among the candidate genes in the chromosome 7 locus, only three genes (Coq7, Gde1, and Knop1) have significant cis-eQTL and are also expressed in the liver (Tables 6, 8). These three genes also have significant cis-eQTL associations in adipose tissue (Table 8). The expression variation of these three candidate genes showed a continuous spectrum across the strains, indicating that the expression variations are not bimodal (data not shown). Hepatic TG levels correlated with Gde1 expression in both the liver (r = 0.35, p = 1.5 × 10⁻⁴) and adipose tissue (r = −0.21, p = 1.6 × 10⁻³) (Figure 7A,C). Likewise, Knop1 expression correlated with hepatic TG levels (r = 0.29, p = 2.5 × 10⁻², Figure 7B) but not in the adipose tissue (r = 0.14, p = 0.133). On the other hand, hepatic TG levels did not correlate with Coq7 expression in the liver (r = 0.09, p = 0.368) or adipose tissue (r = −0.14, p = 0.142). Gde1 (also known as MIR16) encodes glycerophosphodiester phosphodiesterase 1, a ubiquitously expressed enzyme involved in phospholipid metabolism, whereas Knop1 encodes a lysine-rich nucleolar protein. Neither of these two genes has previously been identified in studies related to TG or lipid metabolism. We also examined coding variants for genes at the chromosome 7 locus using the PROVEAN prediction tool (Choi and Chan, 2015). A number of genes exhibited missense variants but these tended to be neutral and not likely to cause deleterious effects on protein stability and function (Table 9). Only the Q117R substitution in Syt7 was predicted to be deleterious. Syt7 (synaptotagmin VII) belongs to a protein family, which mediates Ca2+−dependent vesicular trafficking and exocytosis (Moghadam and& Jackson, 2013). Ablation of Syt7 has been shown to decrease insulin and glucagon secretion in pancreatic cells (Gustavsson et al., 2008, 2009).
Table 8
Significant cis-eQTL at chromosome 7 locus
| Gene | Gene start position | SNP ID | Position | Liver p-value |
|---|---|---|---|---|
| Arl6ip1 | 118118891 | rs30668041 | 118266969 | 2.79E-24 |
| Coq7 | 118509659 | rs32461510 | 118350009 | 5.01E-24 |
| Gde1 | 118688545 | rs32511419 | 119070521 | 1.32E-06 |
| Knop1 | 118842237 | rs32246745 | 119160823 | 1.18E-07 |
| Gene | Gene start position | SNP ID | Position | Adipose p-value |
|---|---|---|---|---|
| Arl6ip1 | 118118891 | rs30668041 | 118266969 | 1.14E-36 |
| Coq7 | 118509659 | rs32430851 | 117961092 | 1.65E-18 |
| Gde1 | 118688545 | rs31516425 | 118372786 | 2.53E-12 |
| Knop1 | 118842237 | rs32532370 | 119288974 | 3.47E-10 |
| Gprc5b | 118972040 | rs48647926 | 118918455 | 3.70E-09 |
-
eQTL, expression Quantitative Trait Locus.
Figure 7
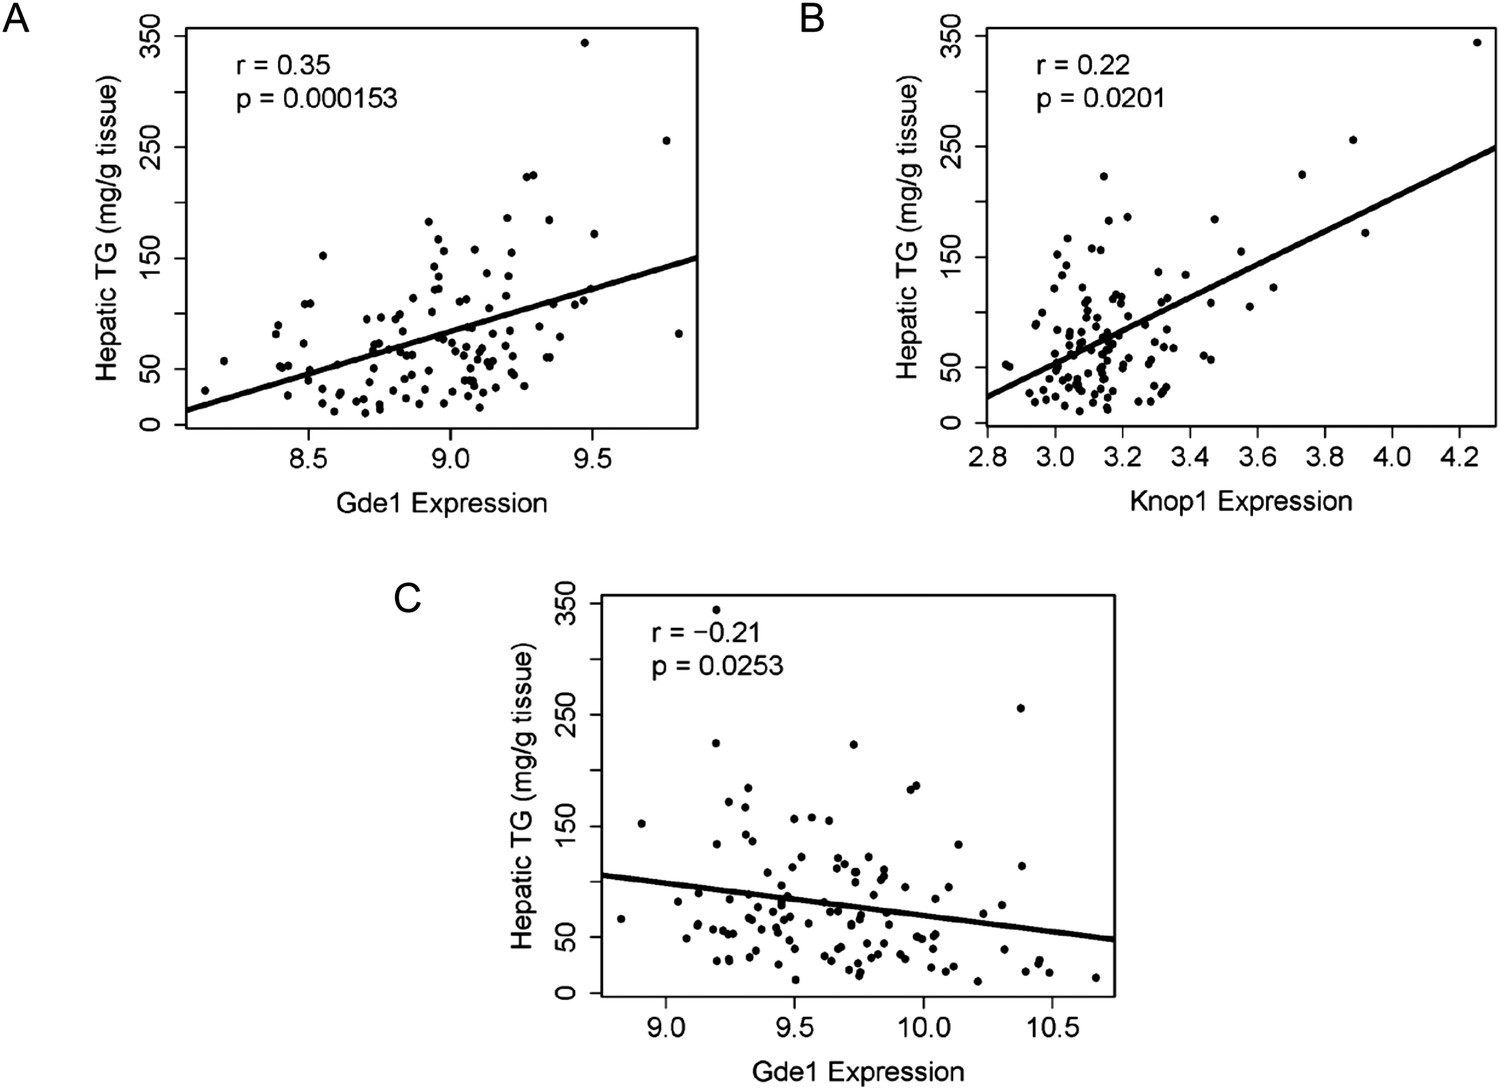
Correlation of candidate gene expression with hepatic TG content.
(A–B) Correlation of hepatic TG with expression levels of Gde1 (A) and Knop1 (B) in the liver. (C) Correlation of hepatic TG with expression levels of Gde1 in the white adipose tissue. r, biweight midcorrelation; p, p-value.
Table 9
Missense variants of candidate genes on chromosome 7
| Gene | Missense variants |
|---|---|
| Rps15a | None |
| Arl6ip1 | None |
| Smg1 | None |
| 4930583K01Rik | None |
| Syt7 | |
| Itpripl2 | |
| Coq7 | |
| Tmc7 | |
| Tmc5 | |
| Gde1 | None |
| Ccp110 | |
| 9030624J02Rik | |
| Knop1 | |
| Iqck | |
| Gprc5b | None |
| Gpr139 | None |
| Gp2 |
-
The effect of missense mutation was assessed by PROVEAN software. Neutral amino acid substitutions, which do not affect protein stability and function are shown in blue whereas deleterious mutations are labeled in red.
Based on cis-eQTL analyses, the chromosome 3 locus contains 3 strong candidate genes: Smc4, Kpna4, and B3galnt1. Expression of Smc4 in adipose tissue significantly correlated with hepatic TG content (r = 0.51 and p = 9.8 × 10⁻⁹). Smc4 encodes structural maintenance of chromosomes 4-like 1, which is a core subunit of condensins I and II, large protein complexes involved in chromosome condensation and repair (Onn et al., 2007). Hepatic expression of Kpna4 was correlated with liver TG content (r = 0.23 and p = 0.01). Kpna4 encodes the subunit alpha-3 of importin, which is a cytoplasmic protein that recognizes nuclear localization signals of protein to be imported into the nucleus. Adipose expression of B3galnt1, encoding for the enzyme beta-1,3-galactosyltransferase 3, was correlated with steatosis (r = 0.30 and p = 0.001).
Validation of Gde1 as a causal gene for hepatic steatosis at the chromosome 7 locus using adenoviral overexpression of Gde1 and shRNA knockdown
The finding of positive correlation between hepatic Gde1 expression and steatosis suggests that increased expression of Gde1 would promote hepatic TG accumulation. To directly assess the effect of Gde1 on hepatic TG in vivo, Gde1 was overexpressed in 8-week-old C57BL/6 mice (Ad-Gde1, 1 × 10⁹ pfu per mouse, i.v.) by adenoviral transduction (Figure 8A). The control group (Ad-LacZ) received the same dose of adenovirus expressing LacZ. Mice were fed a HF/HS diet for 7 days after adenovirus injection and their hepatic lipids were measured. This regimen was chosen because gene expression by adenoviral transduction is only sustained for a short period of time (a few weeks or less). Preliminary studies in mice showed that HF/HS diet induced a threefold increase in hepatic TG accumulation in 1 week (data not shown). While there was no significant difference in body weight, the weight of livers from Gde1-overexpressing mice was 40% higher than that of the control (Figure 8B, p = 4.7 × 10⁻⁵). In addition, plasma TG, TC, and FFA were all elevated in Ad-Gde1 mice (Figure 8C). MRI analysis showed that livers from Gde1-overexpressing mice contained significantly higher fat content (Figure 8D, p = 0.0002). Lipid analyses revealed that the increase in hepatic fat content was primarily due to increased accumulation of TG (Figure 8E, p = 0.014), as hepatic TC and phospholipid content were not significantly different from the control group (Figure 8F,G). Hepatic genes involved in TG biosynthesis (Fasn, Dgat2, and Gpd1) were down-regulated in mice overexpressing Gde1 (Figure 8H).
Figure 8

Effects of Gde1 overexpression in mice by adenoviral transduction.
C57BL/6 mice were injected with Ad-Gde1 (1 × 10⁹ pfu per mouse, i.v.) and fed with a HF/HS diet for 7 days. Control group received the same dose of Ad-LacZ. (A) Western-blot of liver homogenate using anti-GDE1 or anti-tubulin antibody. (B) Comparison of liver weight between Gde1-overexpressing mice and the control mice. (C) Differences in plasma triglyceride (TG), TC, and free fatty acids levels between Gde1-overexpressing mice (filled bars) and the control mice (empty bars). (D) Hepatic fat percentage in the two groups of mice was determined by MRI. (E–G) Liver lipids were extracted and quantified: triglyceride (TG), TC, and phospholipids (PL). (H) Expression of lipogenic genes was measured by qPCR and normalized to the level of the housekeeping gene 36B4. Ad-LacZ (empty bars) and Ad-Gde1 (filled bars) Results are presented as mean + SD (n = 7–8) * denotes p < 0.05 and ** denotes p < 0.01.
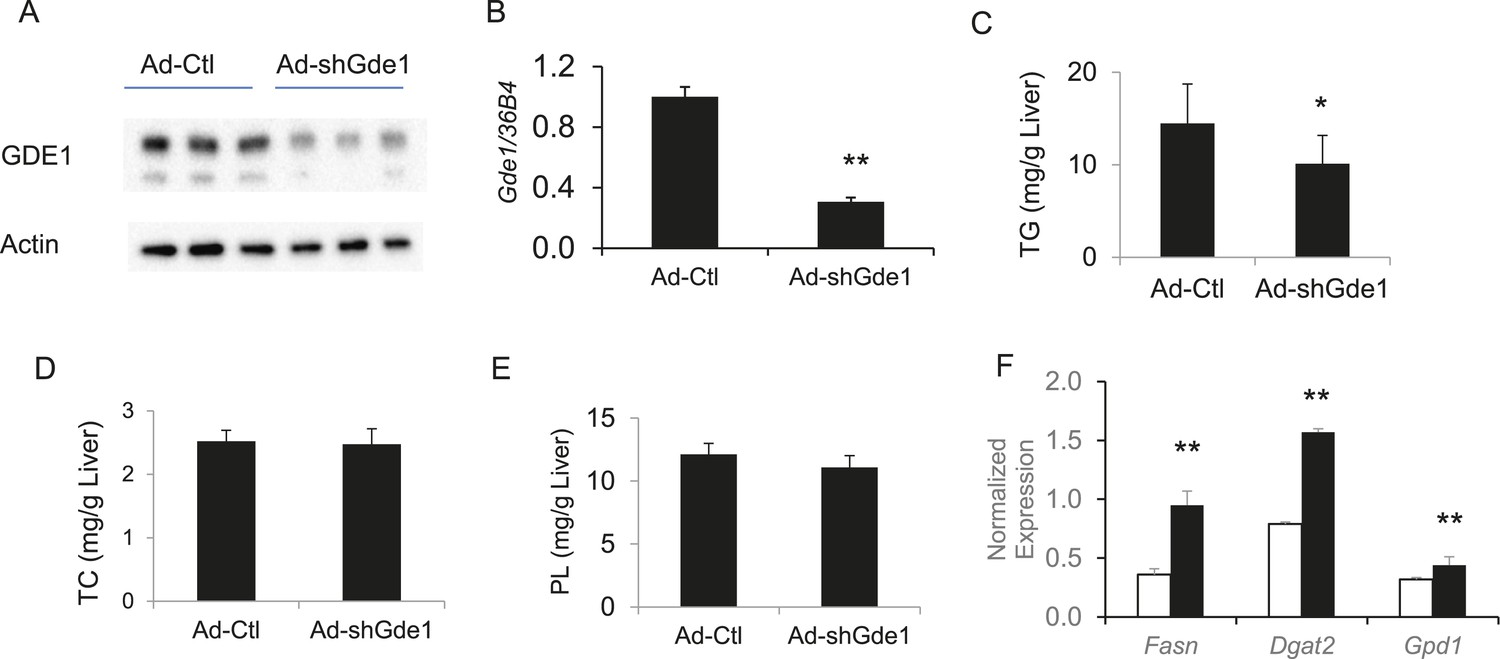
Complementary to the overexpression studies, we also knocked down hepatic Gde1 expression in vivo by adenoviral expression of shRNA. The virus dose and diet treatment were identical to that described above for the overexpression studies. Both Gde1 protein and mRNA levels were ∼75% decreased in the mice received adenoviral shRNA (Figure 9A,B). In contrast to the overexpression studies, knockdown of Gde1 led to a significant decrease in hepatic TG content (Figure 9C, p = 0.011), whereas TC and phospholipid levels were not different from the control group (Figure 9D,E). Similarly, expression of lipogenic genes (Fasn, Dgat2, and Gpd1) was increased in Gde1-knockdown livers (Figure 9F). These findings support a causal role for Gde1 in hepatic steatosis under the chromosome 7 locus.
Figure 9
Effects of Gde1 knockdown in mice by adenoviral transduction.
C57BL/6 mice were injected with Ad-shGde1 (1 × 10⁹ pfu per mouse, i.v.) and fed with a HF/HS diet for 7 days. Control group received the same dose of Ad-Ctl. (A) Equal amounts of liver protein were loaded in each lane and Western-blotted using anti-GDE1 or anti-actin antibody. (B) Comparison of Gde1 mRNA levels between Gde1-knockdown mice and the control mice. (C–E) Liver lipids were extracted and quantified: triglyceride (TG), TC, and phospholipids (PL). (F) Expression of lipogenic genes was measured by qPCR and normalized to the level of the housekeeping gene 36B4. Results are presented as mean + SD (n = 11–12) * denotes p < 0.05 and ** denotes p < 0.01.
It is noteworthy that the direction of the effect of Gde1 expression with respect to hepatic TG levels in these studies is consistent with that observed in the HMDP in liver (i.e., a positive correlation).
Plasma metabolites and hepatic steatosis
To identify metabolites associated with hepatic steatosis, we employed a metabolomic approach to measure 47 metabolites (amino acids, amines, and other polar compounds, Supplementary file 2) in the plasma of mice after 8 weeks of HF/HS feeding. Correlation analysis revealed a significant negative relationship between hepatic TG levels and plasma levels of arginine (r = −0.53, p = 9.85 × 10⁻¹²) and its degradative metabolite ornithine (r = −0.18, p = 0.027) (Figure 10A,B), whereas citrulline, another degradative metabolite of arginine, showed a positive correlation with hepatic TG content (r = 0.18, p = 0.034, Figure 10C). Hepatic TG levels were positively correlated with plasma levels of trimethylamine-N-oxide (TMANO, r = 0.18, p = 0.034, Figure 10D). Increased TMANO levels have previously been implicated in the susceptibility of strain 129S6 mice to diet-induced impaired glucose homeostasis and NAFLD (Dumas et al., 2006). TMANO is an oxidative product of trimethylamine (TMA), a metabolite of choline in animals. TMANO levels are regulated by both genetic and dietary factors and are strongly associated with atherosclerosis (Bennett et al., 2013). The oxidation of TMA is catalyzed by the hepatic flavin-containing monooxygenase (FMO) family of enzymes with FMO3 having the highest catalytic activity. No significant correlation between FMO3 expression and hepatic TG content was observed; however, among the 5 members in the FMO family, FMO5 expression exhibited a significant correlation with hepatic TG content (r = 0.46, p = 2.71 × 10⁻⁷). Hepatic TG content was also positively associated with plasma creatine (r = 0.23, p = 6 × 10⁻³, Figure 10E) and creatinine levels (r = 0.25, p = 6 × 10⁻³, Figure 10F).
Figure 10
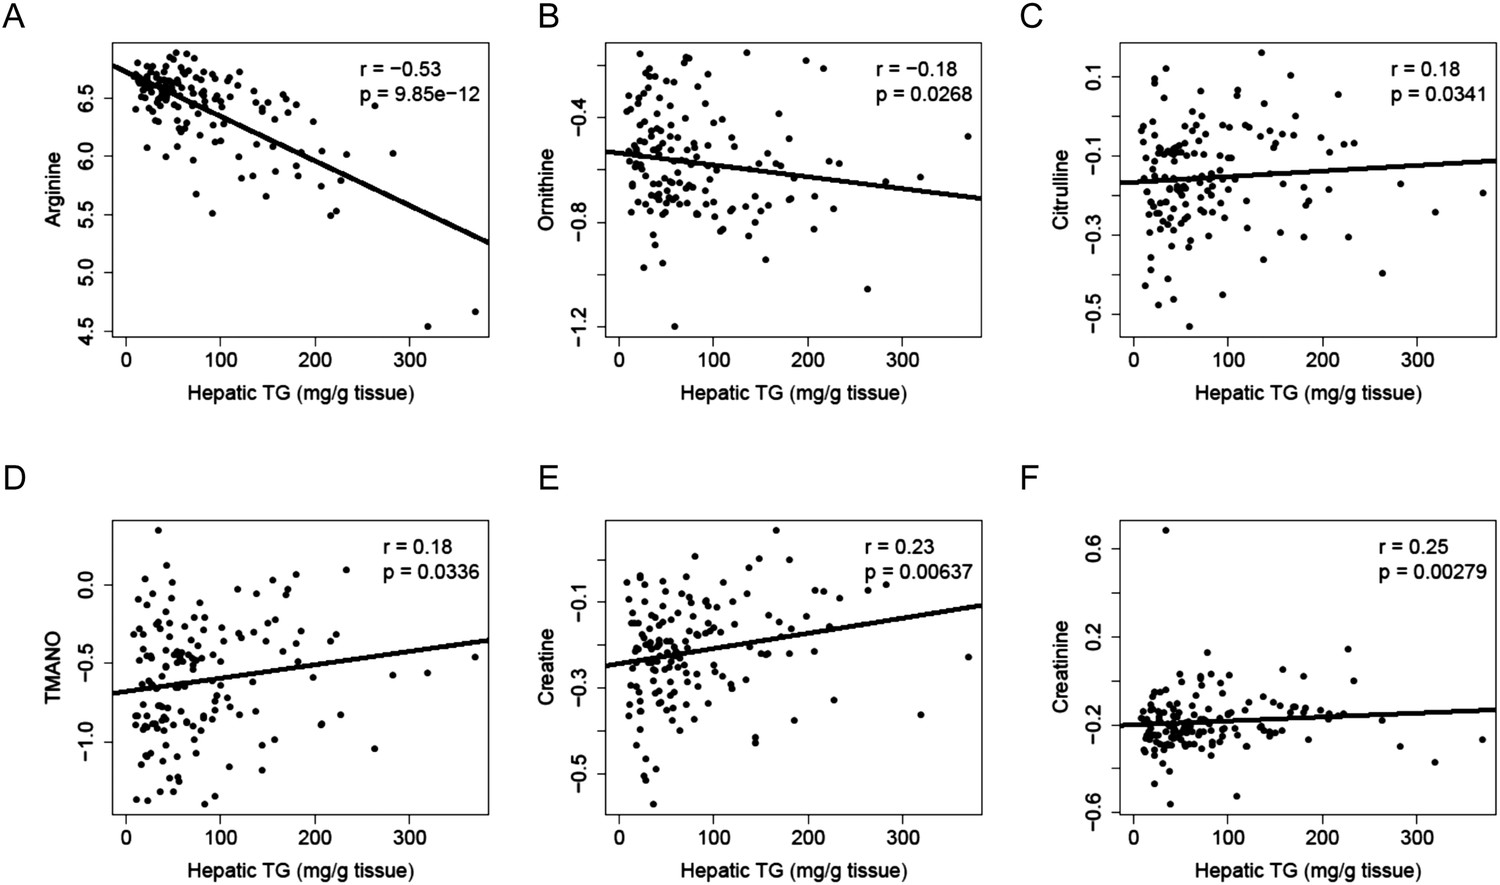
Correlation of hepatic TG and polar metabolites in the plasma.
Correlation of hepatic TG with plasma levels of arginine (A), ornithine (B), citrulline (C), TMANO (D), creatine (E), and creatinine (F). r, biweight midcorrelation; p, p-value.
Association of gut microbiota with hepatic lipid accumulation
Gut microbiota has been implicated in certain human inflammatory and metabolic diseases, including obesity (Ley et al., 2006; Turnbaugh et al., 2009), inflammatory bowel disease (Lepage et al., 2011), and type II diabetes (Qin et al., 2012). Accumulating evidence also suggests that alterations in gut microbiota composition could contribute to the susceptibility and progression of NAFLD (Mouzaki et al., 2013; Zhu et al., 2013). To understand the relationship between microbiota composition and hepatic lipid accumulation in mice fed a HF/HS diet, we employed deep sequencing of a conserved region of the bacterial 16S ribosomal RNA gene to determine the cecal microbiota composition in 237 male mice among 100 different strains. There was no significant correlation between hepatic TG levels and overall microbial diversity, as determined by Shannon diversity index (Mills and& Wassel, 1980). For the bacterial families and genera detected at significant levels, none were significantly associated with hepatic TG levels (5% FDR) (Table 10). However, associations between certain taxa were observed with other hepatic lipids (Table 10). Coprococcus and Oscillospira were positively associated with hepatic unesterified cholesterol levels, whereas negative associations were observed with Blatuia. Blautia and Allobaculum were negatively associated with TC. Coprococcus and Oscillospira were positively associated with phospholipids, whereas Ruminococcus showed negative association (Table 10).
Table 10
Correlation between hepatic lipids and gut microbiota
| TG | TC | UC | PL | |
|---|---|---|---|---|
| Family: | ||||
| Clostridiaceae | −0.133 | 0.035 | 0.116 | 0.052 |
| Erysipelotrichaceae | 0.138 | 0.005 | −0.057 | −0.016 |
| Lachnospiraceae | 0.066 | −0.112 | 0.000 | 0.045 |
| Mogibacteriaceae | 0.033 | −0.055 | −0.092 | −0.089 |
| Peptostreptococcaceae | 0.006 | −0.019 | −0.003 | 0.096 |
| Rikenellaceae | 0.002 | 0.142 | 0.125 | −0.047 |
| Ruminococcaceae | 0.138 | 0.176 | 0.169 | 0.030 |
| S24-7 | −0.092 | 0.003 | −0.111 | −0.166 |
| Genus: | ||||
| 02d06 | −0.146 | −0.062 | −0.05 | 0.012 |
| Adlercreutzia | 0.014 | 0.001 | 0.133 | 0.084 |
| Akkermansia | −0.031 | 0.029 | 0.080 | 0.074 |
| Allobaculum | −0.083 | −0.205* | −0.178 | −0.009 |
| Anaeroplasma | −0.019 | −0.047 | 0.001 | 0.018 |
| Bifidobacterium | −0.014 | −0.082 | −0.131 | −0.084 |
| Blautia | 0.003 | −0.217* | −0.244† | −0.183 |
| Clostridium | −0.108 | −0.063 | −0.044 | −0.008 |
| Clostridium.1 | 0.081 | 0.044 | −0.023 | 0.015 |
| Coprobacillus | −0.008 | −0.075 | −0.138 | −0.130 |
| Coprococcus | −0.016 | 0.174 | 0.261† | 0.212* |
| Dehalobacterium | 0.086 | 0.070 | 0.066 | 0.070 |
| Dorea | 0.078 | 0.070 | 0.056 | 0.081 |
| Lactobacillus | 0.005 | 0.021 | −0.012 | −0.073 |
| Lactococcus | 0.085 | 0.001 | 0.048 | 0.065 |
| Oscillospira | 0.140 | 0.127 | 0.261† | 0.206* |
| R.Gnavus | 0.103 | −0.024 | −0.037 | −0.016 |
| Roseburia | 0.063 | −0.090 | −0.132 | −0.151 |
| Ruminococcus | 0.099 | −0.131 | −0.160 | −0.218* |
| Sarcina | −0.109 | 0.035 | 0.067 | 0.014 |
| SMB53 | −0.012 | −0.069 | −0.029 | 0.052 |
| Turicibacter | −0.035 | 0.016 | 0.019 | 0.013 |
-
TG: triglyceride; TC: total cholesterol; UC: unesterified cholesterol; PL: phospholipids.
-
*
Denotes FDR < 0.05.
-
†
Denotes FDR <0.01.
Discussion
Along with the increased prevalence of obesity and diabetes, NAFLD has become the most common cause of chronic liver disease in a number of Western countries including the United States (Ratziu et al., 2010; Vernon et al., 2011). The etiology and pathogenesis of NAFLD are still poorly understood, reflecting the genetic and environmental heterogeneity of the disease. The molecular basis of the metabolic response to dietary fat and its role in NAFLD development remains to be elucidated. Previous studies using inbred mouse strains have shown that genetic background affects lipid accumulation in the liver (Hill-Baskin et al., 2009; Millward et al., 2009; Shockley et al., 2009; Montgomery et al., 2013). In this study, we employed over 100 strains of inbred and recombinant inbred mice and demonstrated vast genetic variation in hepatic TG accumulation in fed with a HF/HS diet. We examined the relationship between NAFLD and insulin resistance, obesity, plasma metabolites, plasma lipoproteins, and gut microbiota. We also carried out global gene expression array analyses on two key metabolically relevant tissues for NAFLD (liver and white adipose tissue) and identified molecular pathways enriched in NAFLD. Finally, we identified genetic loci contributing to NAFLD in common inbred strains of mice and validated the role of a novel gene, Gde1, at one of the loci. Our data substantially expand our knowledge of the genetic architecture of NAFLD and provide a rich resource for future biochemical and genetic studies.
While there is strong evidence that genetic factors contribute significantly to the onset and progression of the disease, only a few genes have been identified by human GWAS studies (Browning et al., 2004; Romeo et al., 2008; Chalasani et al., 2010; Adams et al., 2013; Kozlitina et al., 2014). Because genetic and environmental factors can be strictly controlled in mice, such models are valuable for dissecting the genetic and environmental contributions to complex disease traits. Nevertheless, classical linkage analysis approaches to dissect NAFLD in mice have been relatively unsuccessful. While a number of loci have been identified by quantitative QTL analyses, a major problem has been an inability to carry out fine genetic mapping to identify the responsible genes (Rangnekar et al., 2006; Kumazawa et al., 2007; Minkina et al., 2012). In this study, we employed an innovative genome-wide association approach using >100 strains of inbred and recombinant inbred strains of mice to finely map genetic loci contributing to the development of steatosis. This approach circumvents the obstacles associated with human studies (namely, environmental heterogeneity) and mouse linkage analyses (namely, poor mapping resolution). Furthermore, by integrating transcriptomic information for the liver and adipose tissue, we identified two high-confidence candidate genes (Gde1 and Knop1) for hepatic steatosis on chromosome 7. We pursued Gde1 using experimental perturbation based on its known role in lipid metabolism.
Several lines of evidence indicate that Gde1 is a causal gene for hepatic steatosis in the chromosome 7 locus. First, the presence of cis-eQTL suggests that Gde1 expression is regulated locally, associating with the SNP haplotype. Second, hepatic expression of Gde1 is significantly correlated with the levels of hepatic TG. Third, overexpression of Gde1 promoted specifically TG accumulation in vivo, whereas hepatic cholesterol and phospholipid levels were unaffected. Forth, shRNA knockdown of Gde1 reduced hepatic TG accumulation.
Gde1 encodes glycerophosphodiester phosphodiesterase 1 (EC 3.1.4.46), a broadly expressed integral membrane glycoprotein, which catalyzes the degradation of glycerophosphoethanolamine and glycerophosphocholine (Okazaki et al., 2010; Simon and& Cravatt, 2010). Two forms of the protein (∼37 kDa and 43 kDa) were detected in Western blots of endogenous and adenoviral overexpressed GDE1, which is likely be due to variable glycosylation as previously documented (Zheng et al., 2000). Its role in triglyceride metabolism has not been documented. Expression levels of TG biosynthetic pathways in the livers of Gde1-overexpressing mice were down-regulated, indicating that increased de novo lipogenesis due to increased lipogenic gene expression is unlikely the cause of TG accumulation. Increased expression of Cd36 in Gde1-overexpressing livers raises the possibility that Cd36 acts as a mediator of the effect of Gde1 through its lipid transport activity. One of the products of the Gde1 enzymatic reaction is glycerol-3-phosphate, which can be converted to phosphatidate by glycerol-3-phosphate acyltransferase (GPAT) and subsequently dephosphorylated by the phosphatidate phosphatase lipin to form diacylglycerol (DAG). DAG can then be acylated by DGAT to form TG. We hypothesize that Gde1 affects the availability of glycerol-3-phosphate and modulates the flux of TG in the liver. The negative correlation of adipose Gde1 expression and hepatic TG may be due to a different role of glycerol-3-phosphate in the adipose tissue. Increased glycerol-3-phosphate production (when Gde1 expression is high) in the adipose tissue would promote FA re-esterification, leading to a decrease in FA release to the circulation. This reduction in FA supply to the liver may result in diminished TG synthesis. The opposite pattern of regulation of Gde1 implicates tissue-specific regulatory elements. Mouse ENCODE data (Yue et al., 2014) showed that there are differences in DNA hypersensitive sites in the gene region, suggesting that there may be differences in DNA accessibility and transcription factor binding in the liver and adipose tissue.
The candidate genes under the chromosome 9 locus are likely to affect hepatic TG content via an insulin-dependent manner as the peak of association was diminished by co-mapping with obesity or insulin resistance. Insulin is a key hormone that drives lipogenesis and hepatic steatosis is often accompanied by hepatic insulin resistance. Our data showed that hepatic TG load has a robust association with plasma insulin levels and HOMA-IR (Figure 6). Impaired insulin signaling in the liver leads to the failure of insulin to suppress gluconeogenesis through the FoxO1 pathway, leading to hyperglycemia and ultimately diabetes (Haas and Biddinger, 2009; Leavens and& Birnbaum, 2011). Paradoxically, insulin-stimulated hepatic lipogenesis through SREBP-1c induction is not impaired in steatosis-associated insulin resistant livers (Brown and Goldstein, 2008; Li et al., 2010). This selective insulin resistance leads to increased production of lipids and steatosis. The chromosome 3 signal was not affected by conditioning on percentage body fat or HOMA-IR, suggesting that the causal gene(s) determining hepatic TG content at this locus are unlikely to be mediated by pathways involving body fat or insulin sensitivity.
Our observed enrichment of mitochondrial genes in steatotic livers suggests that disrupted mitochondrial bioenergetics may play a role in NAFLD pathobiology. This is in accordance with finding that chronic consumption of a HF diet-induced NAFLD with reduced mitochondrial oxidation and increased ROS production (Mantena et al., 2009). Obesity-induced steatosis has also been linked to decreased hepatic ATP synthesis (Chavin et al., 1999). These findings highlighted the importance of mitochondrial function in the pathogenesis of NAFLD. Variations in mitochondrial capacity and activity may contribute to the differences in susceptibility to HF/HS diet challenge. Strains with higher mitochondrial capacity would be more resistant to the development of NAFLD due to more efficient oxidation and disposal of surplus nutrients and lower production of ROS as a result of more efficient coupling between oxidation and phosphorylation. Determining the connection between the genetic determinants of mitochondrial bioenergetics and hepatic TG accumulation could provide important insights into the etiology of NAFLD.
Metabolomics has been used to identify biomarkers for NAFLD (reviewed in Dumas et al., 2014). Our analysis showed that hepatic steatosis was associated with low-plasma levels of arginine. The inverse relationship between arginine levels and hepatic TG content may be due to increased arginine degradation in steatotic mice. Previous studies have shown that an arginine-deficient diet-induced hepatic steatosis in rats (Milner and& Hassan, 1981). The levels of arginase 1, which catabolizes L-arginine to urea and L-ornithine, were increased in steatotic livers from mice fed a high-fat diet (Eccleston et al., 2011). Exposure to HF diet led to decreased hepatic levels of activated endothelial nitric oxide synthase (eNOS), which converts L-arginine to nitric oxide (NO) and citrulline. In our study, gene expression of Arg1 and Nos3 did not show a significant correlation with hepatic TG content, suggesting the effect of HF diet on the activities of these two enzymes acts post-transcriptionally. Arginine plays an important role in maintaining the integrity of cell junctions and in the regulation of the epithelial barrier (Marc Rhoads and& Wu, 2009). It also modulates immune response and is essential for tissue healing (Wu et al., 2009). Low levels of arginine may lead to increased gut bacterial and endotoxin translocation, which promotes liver inflammation and NAFLD progression. We observed that TMANO was positively correlated (r = 0.18, p = 0.034) with hepatic steatosis; however, the correlation was not significant after correction for multiple testing. Previous results from studies of 129S6 mice, a model of diet-induced fatty liver disease, showed that TMANO was a marker for NAFLD (Dumas et al., 2006). Increased TMANO levels may indicate increased conversion of dietary choline into methylamines by microbiota, leading to reduced bioavailability of choline and mimicking the effect of a choline-deficient diet.
Our study also identified Coprococcus and Oscillospira as potentially important microbes in lipid homeostasis, as the abundance of these microbes showed significant association with levels of cholesterol and phospholipids. Studies in humans showed a large reduction in abundance of these microbes in obese and NASH subjects (Zhu et al., 2013). Little is known about the biochemical activities of these microbes; however, it has been shown that dietary composition could affect their abundance in humans (Walker et al., 2011). Studies of diet-induced obesity in mice suggest that abundance of Oscillospira may affect gut barrier function in the proximal colon (Lam et al., 2012). Further analysis of the genomic sequences to identify the specific strains involved could provide new insights into the role of these microbes in the pathogenesis of NAFLD.
Our study has generated a rich resource for future analyses of NAFLD. The primary data are available from the authors and summary tables are posted at http://systems.genetics.ucla.edu.
Materials and methods
Animals
The HMDP strains have previously been described in detail (Bennett et al., 2010). The strain names and number of mice used in this study are listed in Table 11. All mice were obtained from the Jackson Laboratory and bred at University of California, Los Angeles. The experimental design for the diet studies was previously described (Parks et al., 2013). Briefly, male mice were maintained on a chow diet (Ralston Purina Company) until 8 weeks of age when they were given a HF/HS diet (Research Diets-D12266B, New Brunswick, NJ) with the following composition: 16.8% kcal protein, 51.4% kcal carbohydrate, 31.8% kcal fat. After 8 weeks on the HF/HS diet, mice were sacrificed after a 4-hr fast. Blood was collected by retro-orbital bleeding under isoflurane anesthesia. Plasma and livers were frozen immediately in liquid nitrogen and stored at −80°C until analysis. All assays and phenotypes were from the same mice. Mice were housed in rooms with a 14-hr light/10-hr dark cycle (light is on between 6 a.m. and 8 p.m.). On the day of experiment, mice were fasted at 6:30 a.m. and sacrificed between 10:30 a.m. and noon. All animal procedures were approved by the Institutional Care and Use Committee (IACUC) at University of California, Los Angeles.
Table 11
Inbred and recombinant inbred strains used in this study
| Inbred strains | Recombinant inbred strains | ||||
|---|---|---|---|---|---|
| Strain | n | Strain | n | Strain | n |
| 129X1/SvJ | 4 | AXB10/PgnJ | 3 | BXD1/TyJ | 3 |
| A/J | 4 | AXB12/PgnJ | 5 | BXD11/TyJ | 2 |
| AKR/J | 5 | AXB13/PgnJ | 5 | BXD12/TyJ | 5 |
| BALB/cJ | 5 | AXB15/PgnJ | 4 | BXD13/TyJ | 2 |
| BTBR T<+> tf/J | 4 | AXB19/PgnJ | 5 | BXD14/TyJ | 4 |
| BUB/BnJ | 5 | AXB19a/PgJ | 4 | BXD15/TyJ | 5 |
| C3H/HeJ | 4 | AXB19b/PgJ | 5 | BXD16/TyJ | 3 |
| C57BL/6J | 4 | AXB2/PgnJ | 3 | BXD19/TyJ | 4 |
| C57BLKS/J | 4 | AXB5/PgnJ | 4 | BXD20/TyJ | 7 |
| C57L/J | 5 | AXB6/PgnJ | 3 | BXD21/TyJ | 5 |
| C58/J | 4 | AXB8/PgnJ | 5 | BXD24/TyJ | 4 |
| CBA/J | 4 | BXA1/PgnJ | 3 | BXD31/TyJ | 2 |
| CE/J | 4 | BXA11/PgnJ | 4 | BXD32/TyJ | 5 |
| DBA/2J | 4 | BXA12/PgnJ | 4 | BXD34/TyJ | 4 |
| FVB/NJ | 5 | BXA13/PgnJ | 3 | BXD36/TyJ | 4 |
| I/LnJ | 5 | BXA14/PgnJ | 4 | BXD38/TyJ | 4 |
| KK/HlJ | 5 | BXA16/PgnJ | 3 | BXD39/TyJ | 4 |
| LG/J | 4 | BXA2/PgnJ | 5 | BXD40/TyJ | 7 |
| MA/MyJ | 4 | BXA24/PgnJ | 4 | BXD43/RwwJ | 5 |
| NOD/ShiLtJ | 2 | BXA4/PgnJ | 4 | BXD44/RwwJ | 4 |
| NON/ShiLtJ | 5 | BXA7/PgnJ | 6 | BXD45/RwwJ | 5 |
| NZB/BlNJ | 4 | BXA8/PgnJ | 4 | BXD48/RwwJ | 4 |
| NZW/LacJ | 1 | BXH19/TyJ | 6 | BXD49/RwwJ | 4 |
| PL/J | 6 | BXH2/TyJ | 3 | BXD5/TyJ | 5 |
| RIIIS/J | 4 | BXH20/KccJ | 3 | BXD50/RwwJ | 4 |
| SEA/GnJ | 4 | BXH22/KccJ | 4 | BXD51/RwwJ | 4 |
| SJL/J | 5 | BXH4/TyJ | 4 | BXD55/RwwJ | 4 |
| SM/J | 4 | BXH6/TyJ | 5 | BXD56/RwwJ | 6 |
| SWR/J | 4 | BXH8/TyJ | 3 | BXD6/TyJ | 5 |
| BXH9/TyJ | 6 | BXD60/RwwJ | 2 | ||
| CXB11/HiAJ | 5 | BXD61/RwwJ | 4 | ||
| CXB12/HiAJ | 5 | BXD62/RwwJ | 6 | ||
| CXB13/HiAJ | 5 | BXD64/RwwJ | 4 | ||
| CXB3/ByJ | 5 | BXD66/RwwJ | 5 | ||
| CXB4/ByJ | 5 | BXD68/RwwJ | 4 | ||
| CXB6/ByJ | 6 | BXD70/RwwJ | 4 | ||
| CXB7/ByJ | 6 | BXD71/RwwJ | 4 | ||
| BXD73/RwwJ | 4 | ||||
| BXD74/RwwJ | 4 | ||||
| BXD75/RwwJ | 4 | ||||
| BXD79/RwwJ | 4 | ||||
| BXD8/TyJ | 2 | ||||
| BXD84/RwwJ | 4 | ||||
| BXD85/RwwJ | 4 | ||||
| BXD86/RwwJ | 5 | ||||
| BXD87/RwwJ | 3 | ||||
| BXD9/TyJ | 4 | ||||
Hepatic lipid content
Request a detailed protocolLiver lipids were extracted by the method of Folch et al. (1957). About 100 mg of livers was used for lipid extraction and the dried organic extract was dissolved in 1.8% (wt/vol) Triton X-100. The amount of lipids in each extract was determined by colorimetric assay from Sigma (St. Louis, MO) (triglyceride, TC and unesterified cholesterol) and Wako (Richmond, VA) (phospholipids) according to the manufacturer's instructions.
ALT activity assay
Request a detailed protocolPlasma ALT activity was assayed using a kinetic colorimetric assay kit from Pointe Scientific, Inc (Canton, MI, USA) according to the manufacturer's protocol. Activity of ALT was determined by the rate of decrease in NADH as measured by the change in absorbance at 340 nm.
RNA isolation and gene expression analyses
Request a detailed protocolFlash-frozen liver and epididymal adipose samples were weighed and homogenized in Qiazol (Qiagen, Valencia, CA), and RNA was isolated according to the manufacturer's protocol using RNeasy columns (Qiagen). Isolated RNA was analyzed for global gene expression using Affymetrix HT_MG430A arrays, and data from the microarray analysis were filtered as described (Bennett et al., 2010). Gene enrichment analysis was performed using the Database for Annotation, Visualization and Integrated Discovery (DAVID, v6.7) program (Huang da et al., 2009; Huang da et al., 2009).
Genome-wide association analysis
Request a detailed protocolGenotypes for 113 strains of mice (29 classical inbred, 84 recombinant inbred) were obtained from Jackson Laboratories using the Mouse Diversity Array (Yang et al., 2009). After removing SNPs that were flagged as poor quality, 459911 SNPs remained. We further filtered these to about 200,000 SNPs by removing SNPs that did not have a minor allele frequency of >5% and a missing genotype rate of <10%. Genome-wide association mapping of the hepatic TG content was performed using FaST-LMM (Factored Spectrally Transformed Linear Mixed Models), which uses a linear mixed model to correct for population structure (Listgarten et al., 2012). Cut-off values for genome-wide significance were determined by computing the FDR estimated by the q values (Storey and& Tibshirani, 2003).
Generation of adenovirus and in vivo transduction
Request a detailed protocolRecombinant adenovirus was generated using the AdEasy system as previously described (Bennett et al., 2013). Briefly, a shuttle vector containing the full-length mouse Gde1 cDNA and a C-terminal c-myc tag or bacterial LacZ sequence was cotransformed with the adenoviral backbone plasmid pAdEasy-1 for homologous recombination in Escherichia coli BJ5183 cells. Positive recombinants were linearized and transfected into 293 cells for virus packaging and propagation. Adenoviruses were purified by CsCl banding and stored at −80°C until use. Adenovirus expressing shRNA for Gde1 (5′-CCGGGACATCGAGTTTACTTCTGATCTCGAGATCAGAAGTAAACTCGATGTCTTTTTG-3′) driven by a U6 promoter was generated in a similar fashion. For adenoviral infection, 8-week-old chow-fed male C57BL/6 mice (8 per group) were injected with adenoviral construct (1 × 10⁹ pfu diluted in 0.2 ml saline, i.v.) via the tail vein. After injection, the mice were switched to a HF/HS diet. The control group consisted of mice injected with adenoviral construct expressing the LacZ gene in the overexpression studies or empty virus in shRNA knockdown experiments. Mice were sacrificed 7 days post injection after a 4-hr fast. Expression of Gde1 in the liver was assessed by qPCR and Western blotting. Data from mice showing the absence of overexpression or knockdown were excluded from the analysis.
Quantitation of plasma metabolites by metabolomics
Request a detailed protocolMetabolic profiling by LC-MS of amino acids, biogenic amines, and other polar metabolites in plasma was performed as previously described (Wang et al., 2011; Roberts et al., 2012). Metabolite concentrations were determined using the standard addition method (Ito and Tsukada, 2002).
Gut microbiota analysis
Request a detailed protocolMicrobial DNA was isolated from the cecum using the PowerSoil DNA Isolation Kit according to the manufacturer's instructions (MO BIO Laboratories, Carlsbad, CA). Region-specific primers including the Illumina flowcell adapter sequences were used for amplifying the V4 region of the 16S rRNA gene. The reverse amplicon primer contains a 12-base barcode sequence that allows sample pooling for sequencing. The barcoded primers and sample preparation were performed as previously described (Hamady et al., 2008; Costello et al., 2009; Caporaso et al., 2012). Each sample was amplified in triplicate, combined and cleaned using the PCR clean-up kit (MO BIO Laboratories, Carlsbad, CA). Cleaned and quantified amplicons were sequenced with the Illumina MiSeq machine at the GenoSeq Core Facility at the University of California, Los Angeles using 500-cycle PE kit. The MiSeq run contained a control library, which was made from phiX174 as described (Caporaso et al., 2012). The raw data from the MiSeq run were first processed through a quality filter using established guidelines (Bokulich et al., 2013). The remaining sequences were analyzed using the open source software package Quantitative Insights Into Microbial Ecology (QIIME) version 1.7.0 (Caporaso et al., 2010; Kuczynski et al., 2011). Demultiplexed sequences from all of the samples were clustered into operational taxonomic units (OTUs) based on their sequence similarity (97% identity) using a reference based OTU picking protocol in QIIME. The taxonomic composition was assigned to the representative sequence of each OTU using Ribosomal Database Project (RDP) Classifier 2.0.1 (greengenes 13-08) (Wang et al., 2007). The relative abundance of bacteria at each taxonomic level (e.g., phylum, class, order, family, and genus) was computed for each mouse. Biweight midcorrelation (bicor) values between microbiota and measured traits were determined using R statistic program.
References
-
Genetic modifiers of non-alcoholic fatty liver disease progressionBiochimica et Biophysica Acta 1812:1557–1566.https://doi.org/10.1016/j.bbadis.2011.07.017
-
Genome-wide association study identifies variants associated with histologic features of nonalcoholic Fatty liver disease1567–1576, Gastroenterology, 139, 76 e1–6, 10.1053/j.gastro.2010.07.057.
-
Obesity induces expression of uncoupling protein-2 in hepatocytes and promotes liver ATP depletionThe Journal of Biological Chemistry 274:5692–5700.https://doi.org/10.1074/jbc.274.9.5692
-
PROVEAN web server: a tool to predict the functional effect of amino acid substitutions and indelsBioinformatics.
-
Systems genetics approaches to understand complex traitsNature Reviews. Genetics 15:34–48.https://doi.org/10.1038/nrg3575
-
CD36-deficient mice are resistant to alcohol- and high-carbohydrate-induced hepatic steatosisJournal of Lipid Research 55:239–246.https://doi.org/10.1194/jlr.M041863
-
Steatohepatitis: a tale of two "hits"?Gastroenterology 114:842–845.https://doi.org/10.1016/S0016-5085(98)70599-2
-
Pathogenesis of steatohepatitisBest Practice & Research. Clinical Gastroenterology 16:663–678.https://doi.org/10.1053/bega.2002.0333
-
Alcohollike liver disease in nonalcoholics. A clinical and histologic comparison with alcohol-induced liver injuryGastroenterology 95:1056–1062.
-
Sources of fatty acids stored in liver and secreted via lipoproteins in patients with nonalcoholic fatty liver diseaseThe Journal of Clinical Investigation 115:1343–1351.https://doi.org/10.1172/JCI23621
-
Increased expression of c-Jun in nonalcoholic fatty liver diseaseLaboratory Investigation 94:394–408.https://doi.org/10.1038/labinvest.2014.3
-
Metabolic profiling reveals a contribution of gut microbiota to fatty liver phenotype in insulin-resistant miceProceedings of the National Academy of Sciences of USA 103:12511–12516.https://doi.org/10.1073/pnas.0601056103
-
A simple method for the isolation and purification of total lipides from animal tissuesThe Journal of Biological Chemistry 226:497–509.
-
Impaired insulin secretion and glucose intolerance in synaptotagmin-7 null mutant miceProceedings of the National Academy of Sciences of USA 105:3992–3997.https://doi.org/10.1073/pnas.0711700105
-
Synaptotagmin-7 is a principal Ca2+ sensor for Ca2+ -induced glucagon exocytosis in pancreasThe Journal of Physiology 587:1169–1178.https://doi.org/10.1113/jphysiol.2008.168005
-
Dissecting the role of insulin resistance in the metabolic syndromeCurrent Opinion in Lipidology 20:206–210.https://doi.org/10.1097/MOL.0b013e32832b2024
-
Diet-induced hepatocellular carcinoma in genetically predisposed miceHuman Molecular Genetics 18:2975–2988.https://doi.org/10.1093/hmg/ddp236
-
Potential etiologic and functional implications of genome-wide association loci for human diseases and traitsProceedings of the National Academy of Sciences of USA 106:9362–9367.https://doi.org/10.1073/pnas.0903103106
-
Nonalcoholic fatty liver disease: a review of the spectrum of disease, diagnosis, and therapyNutrition in Clinical Practice 26:565–576.https://doi.org/10.1177/0884533611419668
-
Using QIIME to analyze 16S rRNA gene sequences from microbial communitiesCurrent Protocols in Bioinformatics, Chapter 10, Unit 10 7, 10.1002/0471250953.bi1007s36.
-
The epidemiology of nonalcoholic fatty liver disease: a global perspectiveSeminars in Liver Disease 28:339–350.https://doi.org/10.1055/s-0028-1091978
-
Insulin signaling to hepatic lipid metabolism in health and diseaseCritical Reviews in Biochemistry and Molecular Biology 46:200–215.https://doi.org/10.3109/10409238.2011.562481
-
Bifurcation of insulin signaling pathway in rat liver: mTORC1 required for stimulation of lipogenesis, but not inhibition of gluconeogenesisProceedings of the National Academy of Sciences of USA 107:3441–3446.https://doi.org/10.1073/pnas.0914798107
-
Improved linear mixed models for genome-wide association studiesNature Methods 9:525–526.https://doi.org/10.1038/nmeth.2037
-
High fat diet induces dysregulation of hepatic oxygen gradients and mitochondrial function in vivoThe Biochemical Journal 417:183–193.https://doi.org/10.1042/BJ20080868
-
Association of nonalcoholic fatty liver disease with insulin resistanceThe American Journal of Medicine 107:450–455.https://doi.org/10.1016/S0002-9343(99)00271-5
-
Aspects of diversity measurement for microbial communitiesApplied and Environmental Microbiology 40:578–586.
-
Species specificity of arginine deficiency-induced hepatic steatosisThe Journal of Nutrition 111:1067–1073.
-
The functional significance of synaptotagmin diversity in neuroendocrine secretionFrontiers in Endocrinology 4:124.https://doi.org/10.3389/fendo.2013.00124
-
A novel glycerophosphodiester phosphodiesterase, GDE5, controls skeletal muscle development via a non-enzymatic mechanismThe Journal of Biological Chemistry 285:27652–27663.https://doi.org/10.1074/jbc.M110.106708
-
Reconstitution and subunit geometry of human condensin complexesThe EMBO Journal 26:1024–1034.https://doi.org/10.1038/sj.emboj.7601562
-
Genetic architecture of insulin resistance in the mouseCell Metabolism 21:334–346.https://doi.org/10.1016/j.cmet.2015.01.002
-
A position statement on NAFLD/NASH based on the EASL 2009 special conferenceJournal of Hepatology 53:372–384.https://doi.org/10.1016/j.jhep.2010.04.008
-
Targeted metabolomics1–24, Current Protocols in Molecular Biology, Chapter 30, Unit 30 2, 10.1002/0471142727.mb3002s98.
-
Nonalcoholic fatty liver disease: an overview of current insights in pathogenesis, diagnosis and treatmentWorld Journal of Gastroenterology 14:2474–2486.https://doi.org/10.3748/wjg.14.2474
-
Heritability of nonalcoholic fatty liver diseaseGastroenterology 136:1585–1592.https://doi.org/10.1053/j.gastro.2009.01.050
-
Effects of atherogenic diet on hepatic gene expression across mouse strainsPhysiological Genomics 39:172–182.https://doi.org/10.1152/physiolgenomics.90350.2008
-
Statistical significance for genomewide studiesProceedings of the National Academy of Sciences of USA 100:9440–9445.https://doi.org/10.1073/pnas.1530509100
-
Nonalcoholic steatohepatitis and cryptogenic cirrhosis within kindredsThe American Journal of Medicine 108:9–13.https://doi.org/10.1016/S0002-9343(99)00315-0
-
Systematic review: the epidemiology and natural history of non-alcoholic fatty liver disease and non-alcoholic steatohepatitis in adultsAlimentary Pharmacology & Therapeutics 34:274–285.https://doi.org/10.1111/j.1365-2036.2011.04724.x
-
Genome-wide association studies: theoretical and practical concernsNature Reviews. Genetics 6:109–118.https://doi.org/10.1038/nrg1522
-
Naive Bayesian classifier for rapid assignment of rRNA sequences into the new bacterial taxonomyApplied and Environmental Microbiology 73:5261–5267.https://doi.org/10.1128/AEM.00062-07
-
Metabolite profiles and the risk of developing diabetesNature Medicine 17:448–453.https://doi.org/10.1038/nm.2307
-
Ninety patients with nonalcoholic steatohepatitis: insulin resistance, familial tendency, and severity of diseaseThe American Journal of Gastroenterology 96:2957–2961.https://doi.org/10.1111/j.1572-0241.2001.04667.x
-
MIR16, a putative membrane glycerophosphodiester phosphodiesterase, interacts with RGS16Proceedings of the National Academy of Sciences of USA 97:3999–4004.https://doi.org/10.1073/pnas.97.8.3999
Article and author information
Author details
Funding
National Heart, Lung, and Blood Institute (NHBLI) (HL028481)
- Aldons J Lusis
European Commission (EC) (FP7 - 330381)
- Elin Org
Norges Forskningsråd (240405/F20)
- Frode Norheim
National Institute of Diabetes and Digestive and Kidney Diseases (NIDDK) (DK094311)
- Aldons J Lusis
National Institutes of Health (NIH) (T32-HD07228)
- Brian W Parks
The funders had no role in study design, data collection and interpretation, or the decision to submit the work for publication.
Acknowledgements
We thank Hannah Qi, Zhiqiang Zhou, Judy Wu, and Tieyan Han for their expert assistance with mouse experiments.
Ethics
Animal experimentation: This study was performed in strict accordance with the recommendations in the Guide for the Care and Use of Laboratory Animals of the National Institutes of Health. All of the animals were handled according to approved institutional animal care and use committee (IACUC) protocols (#92-169) of the University of California at Los Angeles.
Copyright
© 2015, Hui et al.
This article is distributed under the terms of the Creative Commons Attribution License, which permits unrestricted use and redistribution provided that the original author and source are credited.
Metrics
-
- 0
- citations
Views, downloads and citations are aggregated across all versions of this paper published by eLife.
Download links
A two-part list of links to download the article, or parts of the article, in various formats.
Downloads (link to download the article as PDF)
Open citations (links to open the citations from this article in various online reference manager services)
Cite this article (links to download the citations from this article in formats compatible with various reference manager tools)
The genetic architecture of NAFLD among inbred strains of mice
eLife 4:e05607.
https://doi.org/10.7554/eLife.05607


