A systematic review of population-based studies on lipid profiles in Latin America and the Caribbean

  1. Rodrigo M Carrillo-Larco  Is a corresponding author
  2. C Joel Benites-Moya
  3. Cecilia Anza-Ramirez
  4. Leonardo Albitres-Flores
  5. Diana Sánchez-Velazco
  6. Niels Pacheco-Barrios
  7. Antonio Bernabe-Ortiz
  1. Department of Epidemiology and Biostatistics, School of Public Health, Imperial College London, United Kingdom
  2. CRONICAS Centre of Excellence in Chronic Diseases, Universidad Peruana Cayetano Heredia, Peru
  3. Universidad Católica Los Ángeles de Chimbote, Instituto de Investigación, Peru
  4. Facultad de Medicina de la Universidad Nacional de Trujillo, Peru
  5. Sociedad Científica de Estudiantes de Medicina de la Universidad Nacional de Trujillo-SOCEMUNT, Peru
  6. Universidad Científica del Sur, Peru

Abstract

We aimed to study time trends and levels of mean total cholesterol and lipid fractions, and dyslipidaemias prevalence in Latin America and the Caribbean (LAC). Systematic-review and meta-analysis of population-based studies in which lipid (total cholesterol [TC; 86 studies; 168,553 people], HDL-Cholesterol [HDL-C; 84 studies; 121,282 people], LDL-Cholesterol [LDL-C; 61 studies; 86,854 people], and triglycerides [TG; 84 studies; 121,009 people]) levels and prevalences were laboratory-based. We used Scopus, LILACS, Embase, Medline and Global Health; studies were from 1964 to 2016. Pooled means and prevalences were estimated for lipid biomarkers from ≥2005. The pooled means (mg/dl) were 193 for TC, 120 for LDL-C, 47 for HDL-C, and 139 for TG; no strong trends. The pooled prevalence estimates were 21% for high TC, 20% for high LDL-C, 48% for low HDL-C, and 21% for high TG; no strong trends. These results may help strengthen programs for dyslipidaemias prevention/management in LAC.

eLife digest

Cholesterol and triglycerides are fatty substances found in the blood. They are crucial components of cell membranes and important for a variety of processes in the body. But, too much, or too little blood fat can damage the blood vessels. For example, high levels of fat in the blood can clog arteries, which can increase the chances of heart disease, heart attacks and strokes.

Fat starts to build up if ‘bad’ fats, such as triglycerides and LDL cholesterol, are too high. But it can also happen if levels of 'good' fats, like HDL cholesterol, are too low. The causes of, and treatments for, these different types of dyslipidaemia (or fat levels outside normal ranges) are not the same. So, to plan interventions effectively, public health authorities need to know which type of blood fat imbalance is most common in the local population, and whether this has changed over time. In many parts of the world, this kind of information is available, but in Latin America and the Caribbean the data is incomplete.

To address this, Carrillo-Larco et al. reviewed around 200 previous studies from across Latin America and the Caribbean. This revealed that, since 2005, low HDL cholesterol has been the most common type of dyslipidaemia in this region, followed by elevated triglycerides, and third, high LDL cholesterol. These patterns have changed little over the years.

In many parts of the world, public health guidelines for dyslipidaemia focus on treatment specifically for high LDL cholesterol. But this new data suggests that guidelines should also include recommendations for HDL cholesterol, in particular in Latin America and the Caribbean. And, with a clearer understanding of the current pattern of blood fat imbalances in this region, researchers now have a baseline against which to measure the success of any new health policies. In the future, a multi-country study to measure blood fats in the general population could provide even more detail. But, until then, this work provides a starting point for customised health interventions.

Introduction

There is a growing body of evidence about levels, patterns and trends of body mass index, (NCD Risk Factor Collaboration (NCD-RisC), 2019; NCD Risk Factor Collaboration (NCD-RisC), 2017a) diabetes, (NCD Risk Factor Collaboration (NCD-RisC), 2016) blood pressure and hypertension, (NCD Risk Factor Collaboration (NCD-RisC), 2017b; Geldsetzer et al., 2019) yet much less has been reported about dyslipidaemias and cholesterol (Farzadfar et al., 2011; NCD Risk Factor Collaboration (NCD-RisC), 2020a). Unlike Latin America and the Caribbean (LAC), other world regions have multi-country studies or systematic reviews that have informed public health officers and practitioners about the burden of unhealthy lipid profiles (Noubiap et al., 2018). Moreover, available evidence already suggests there are non-trivial differences in lipid levels with other regions that deserve further scrutiny (Farzadfar et al., 2011; Ponte-Negretti et al., 2017a; Ponte-Negretti et al., 2017b). These facts show that regional evidence on lipid profiles and trends is limited in LAC, hampering the formulation of health policies and practice guidelines to prevent, treat and control dyslipidaemias with a regional focus.

This dearth of evidence has relevant implications for public health, clinical medicine and research in LAC. It is unknown whether surveillance systems are urgently needed to monitor dyslipidaemias, because the current cholesterol levels and whether they have increased or decreased have not been quantified in LAC. In this line, if public health authorities should secure access to lipid-lowering medications in the current struggle to extend universal health coverage, (Atun et al., 2015) is also unknown because we have not quantified, which dyslipidaemia is the most prevalent in LAC. Finally, research cannot efficiently advance if LAC does not know what evidence is already available; thereby, resources can be targeted to where information is scarce or null.

Therefore, we aimed to provide robust evidence about trends of mean levels of total cholesterol and lipid fractions, as well as trends of dyslipidaemias prevalence in LAC. This evidence will guide policies and interventions so that they can focus on the most pressing issues. Also, public health officers can use this information as a starting point for disease surveillance and to monitor progress of interventions or to track targets.

Results

Selection process

The search yielded 6699 titles and abstracts; of these, 1123 were studied in detail and finally 197 studies met the inclusion criteria (Figure 1—figure supplement 1).

General characteristics of selected studies

Brazil, with 61 studies, and Chile with 21 studies, contributed with the greatest number of studies to the systematic review (Figure 1 - Figure 1—figure supplement 1 and Supplementary file 1, table 1). There were more studies conducted since 2010 (Figure 1—figure supplement 1). Across studies, the mean proportion of men in the study population was 43%, and the mean age was 48 years (Supplementary file 1, table 1).

Figure 1 with 1 supplement see all
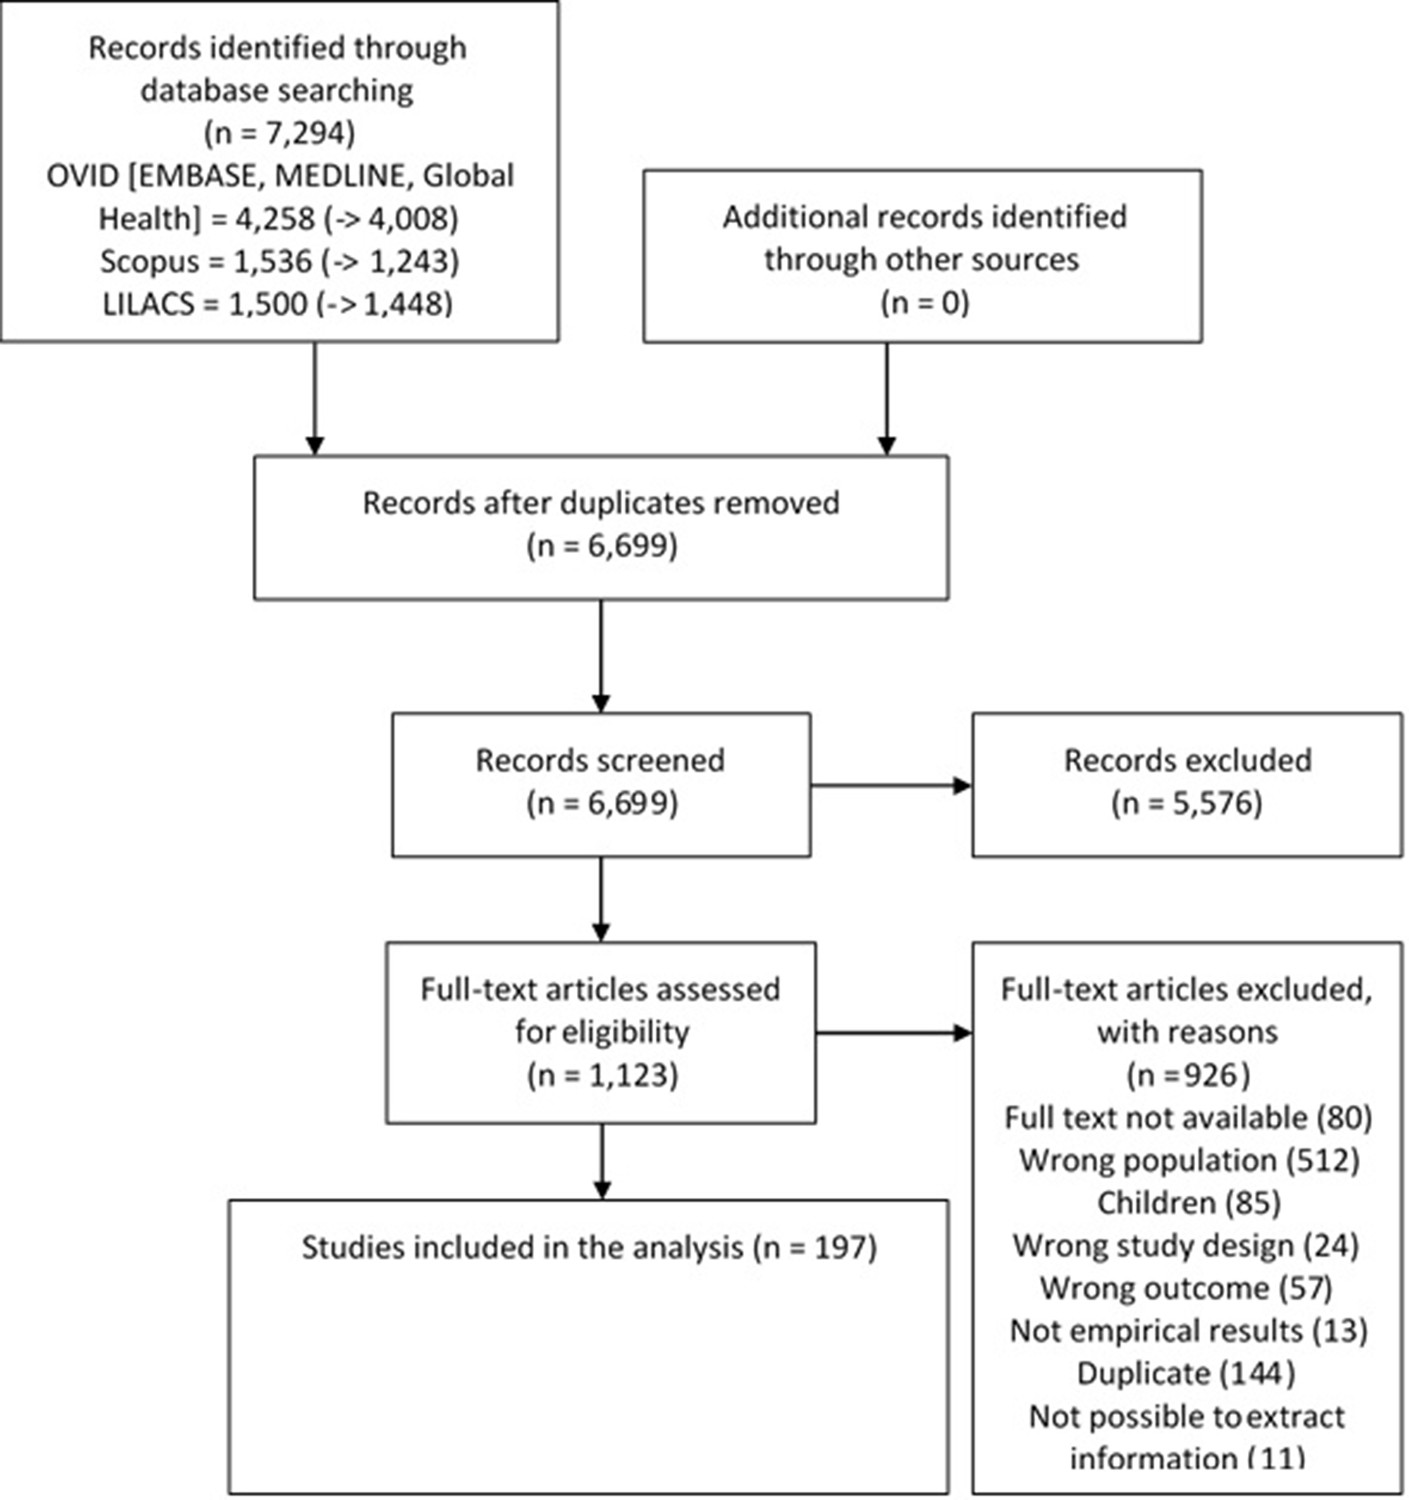
Study selection process.

Total cholesterol

Evidence from 86 studies (168,553 individuals) informed the overall estimates on mean total cholesterol. The random-effects meta-analysis revealed a pooled mean total cholesterol of 193 mg/dl since 2005 (Table 1). During the last years, there seemed to be a negative yet weak correlation with time, signalling a small decrease in mean total cholesterol (Figure 2). National studies tended to report lower mean levels than community and sub-national studies (Figure 2). Southern and Tropical Latin America appeared to have higher levels than the other sub-regions (Figure 2).

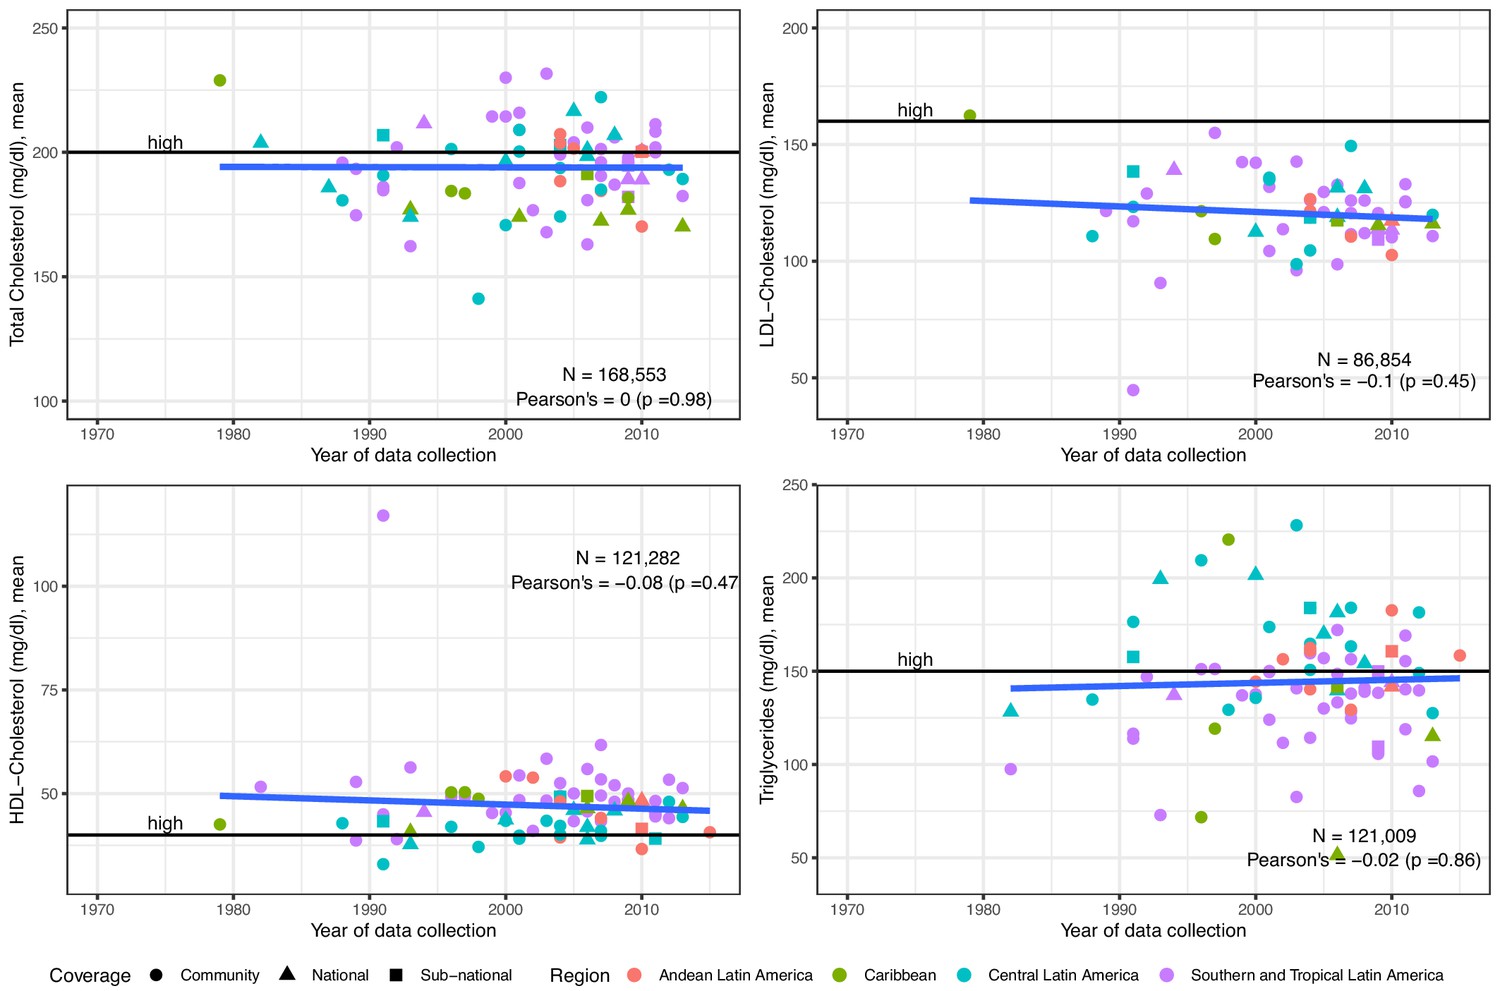
Trends in mean total cholesterol, LDL-Cholesterol, HDL-Cholesterol and triglycerides in Latin America and the Caribbean.

The solid blue line represents a linear regression trend. Year in the x-axis refers to data collection year. Countries within sub-regions are shown in Supplementary file 1, Table 5. Individual estimates are shown in Supplementary file 1, Table 2.

Table 1
Pooled mean and pooled prevalence estimates since 2005, random-effects meta-analysis.
Mean (mg/dl)Lower 95% confidence intervalUpper 95% confidence interval
Total cholesterol (37 studies)193.39189.10197.68
LDL-Cholesterol (30 studies)119.98116.08123.88
HDL-Cholesterol (42 studies)46.5544.9948.12
Triglycerides (39 studies)139.27130.57147.98
Prevalence (%)Lower 95% confidence intervalUpper 95% confidence interval
High total cholesterol - ≥ 200 mg/dl (six studies)34.0419.0449.04
High total cholesterol - ≥ 240 mg/dl (five studies)20.9713.5128.43
High LDL-Cholesterol - ≥ 130 mg/dl (two studies)40.4129.0551.78
High LDL-Cholesterol - ≥ 160 mg/dl (five studies)19.7311.5727.89
Low HDL-Cholesterol ≤ 40(men) and ≤50(women) (nine studies)48.2736.3160.22
High Triglycerides ≥ 150 mg/dl (12 studies)43.1235.4050.85
High Triglycerides ≥ 200 mg/dl (four studies)20.4816.2824.69

The total cholesterol prevalence estimates were informed by 68 studies (129,123 individuals) overall. The pooled prevalence since 2005 was 21% for total cholesterol ≥240 mg/dl and 34% for total cholesterol ≥200 mg/dl (Table 1). There was a positive trend with time, signalling an increase yet weak evidence supported this observation (Figure 3). National studies were evenly distributed; Southern and Tropical Latin America seemed to have higher estimates (Figure 3).

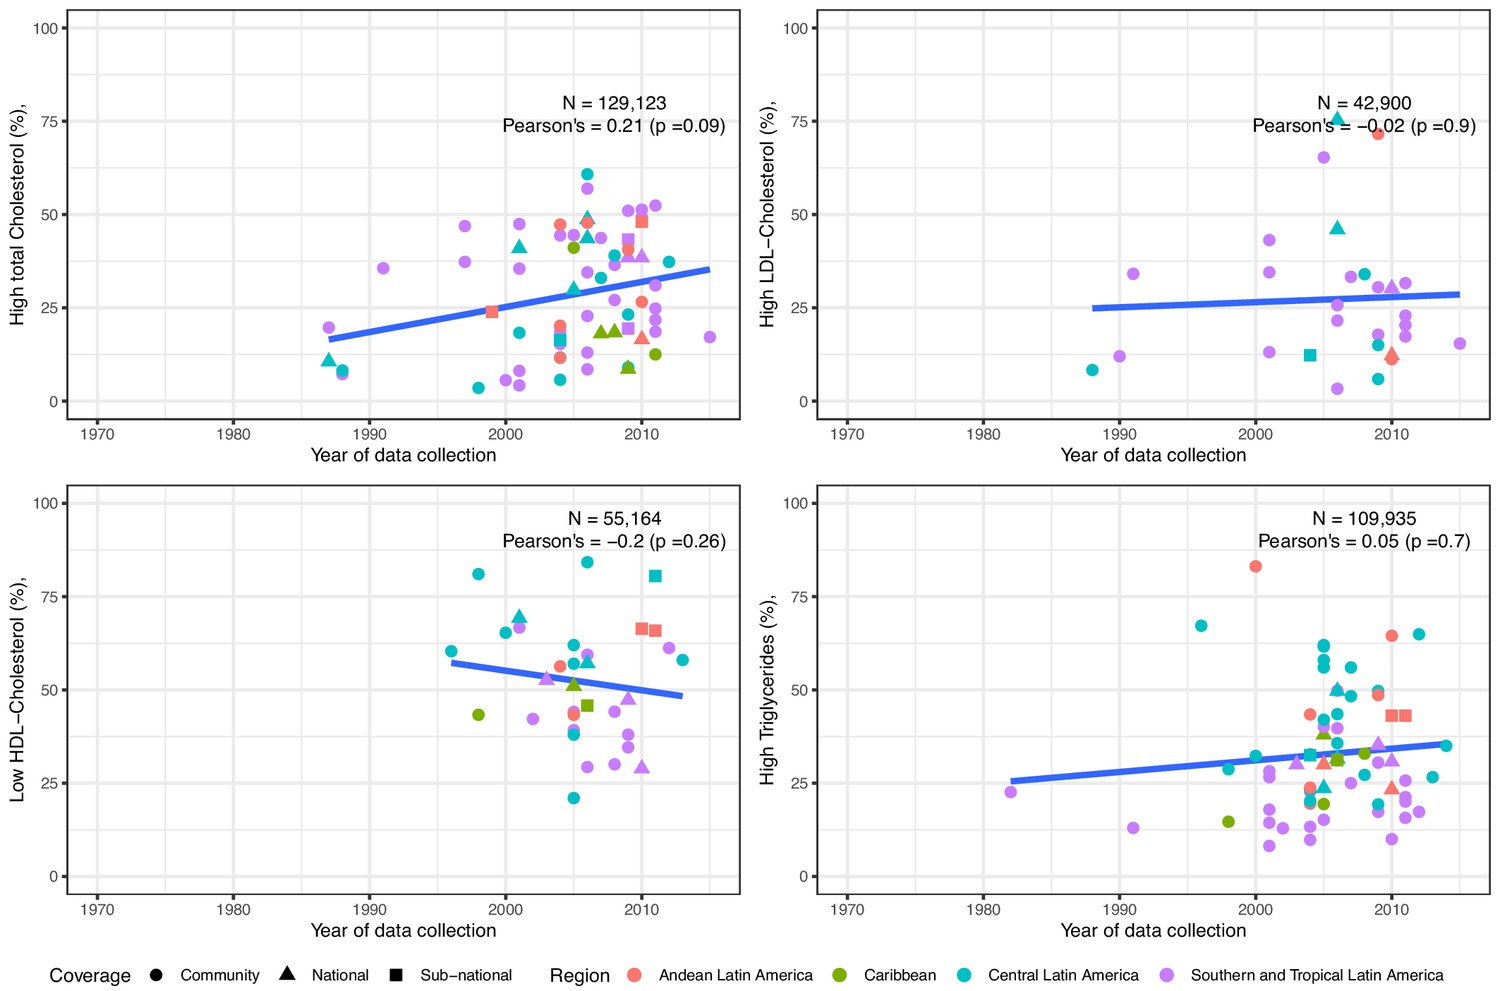
Trends in prevalence of high total cholesterol, high LDL-Cholesterol, low HDL-Cholesterol and high triglycerides in Latin America and the Caribbean. The solid blue line represents a linear regression trend.

Year in the x-axis refers to data collection year. Countries within sub-regions are shown in Supplementary file 1, Table 5. Studies included in this graphics are those with standard clinically relevant definitions. I.e., total cholesterol ≥150 mg/dl,≥200 mg/dl, or ≥240 mg/dl; LDL-Cholesterol ≥100 mg/dl,≥130 mg/dl, or ≥160 mg/dl; HDL-Cholesterol ≤40 mg/dl in men and ≤50 mg/dl in women; triglycerides ≥ 100 mg/dl,≥130 mg/dl,≥150 mg/dl, or ≥200 mg/dl. That is, prevalence estimates based on other definitions were excluded. Individual estimates are shown in Supplementary file 1, Table 3.

LDL-Cholesterol

The overall sample for LDL-Cholesterol was 61 studies (86,854 subjects). Since 2005, the pooled mean was 120 mg/dl (Table 1). There was a non-significant decreasing trend (Figure 2). National studies seemed to report lower means, and there was not a clear geographic distribution (Figure 2).

Overall, LDL-Cholesterol prevalence estimates were informed by 29 studies (42,900 individuals). The pooled prevalence of high LDL-cholesterol since 2005 was 21% for LDL-Cholesterol ≥160 mg/dl and 40% for LDL-Cholesterol ≥130 mg/dl (Table 1), and such estimates have slightly increased (Figure 3). National studies were evenly distributed along the other studies (Figure 3). Southern and Tropical Latin America appeared to have higher estimates (Figure 3).

HDL-Cholesterol

The HDL-Cholesterol mean estimates benefited from 84 studies (121,282 subjects). The pooled mean since 2005 was 47 mg/dl (Table 1). The time trend of mean HDL-Cholesterol was negative yet non-significant (Figure 2). National studies were evenly distributed; Southern and Tropical Latin America seemed to show higher means (Figure 2).

The HDL-Cholesterol prevalence estimates were based on 34 studies (55,164 individuals) overall. The pooled prevalence since 2005 was 48% for HDL-Cholesterol ≤40 mg/dl in men and ≤50 mg/dl in women (Table 1). The prevalence of low HDL-Cholesterol had a negative trend, yet not strong evidence supported this finding (Figure 3). National studies were evenly distributed; Central Latin America seemed to have higher rates of low HDL-Cholesterol (Figure 3).

Triglycerides

There were 84 studies (121,009 people) included in the mean triglycerides analysis. The pooled mean was 139 mg/dl since 2005 (Table 1). The mean levels of triglycerides have slightly increased (Figure 2). Estimates from national studies did not show a strong pattern (Figure 2). Estimates from Andean and Central Latin America appeared to be higher than those from Southern and Tropical Latin America (Figure 2).

Data from 70 studies (109,935 people) informed the triglycerides prevalence estimates overall. The pooled prevalence of high triglycerides was 21% for triglycerides ≥ 200 mg/dl and 43% for triglycerides ≥ 150 mg/dl (Table 1). The prevalence of high triglycerides has increased (Figure 3), yet weak evidence supported this finding. National studies did not show any patterns (Figure 3). As it was the case in mean triglycerides, Andean and Central Latin America seemed to have higher rates of high triglycerides (Figure 3).

Risk of bias

Given the overall selection criteria (population-based studies with blood samples to measure lipid biomarkers), studies had moderate risk of bias. For details about the assessment tool and our grading rationale, please refer to Supplementary file 1 pp. 08–09.

Discussion

We summarized trends in total cholesterol, HDL-Cholesterol, LDL-Cholesterol and triglycerides; in addition, we also reported on trends of dyslipidaemias with clinical relevance: high total cholesterol, high LDL-Cholesterol, low HDL-Cholesterol and high triglycerides. This work, along with other global estimates, (NCD Risk Factor Collaboration (NCD-RisC), 2020a) can be used for surveillance of lipid levels in LAC. We have pooled recent mean and prevalence estimates, which can serve as a starting point to monitor changes during the next years. This work can also inform policies and interventions so that they can target the dyslipidaemia with the highest prevalence. Moreover, this work can inform regional practice guidelines to include local evidence and address regional needs.

Although there has been a marginal decrease in the mean of the four lipid biomarkers over time, the results do not support there have been a substantial change. A substantial change was not observed for prevalence estimates either. These findings are consistent with those from a recent global analysis, in which they found little change in total cholesterol and non-HDL Cholesterol in LAC, a decrease in several areas of North America, Europe, and Oceania, while an increase in East and South East Asia (NCD Risk Factor Collaboration (NCD-RisC), 2020a). These remarks may suggest that there have been few policies or interventions to improve these lipid profiles in LAC; alternatively, this could suggest that available interventions were not effective. In either case, the results may show a natural progression or variation, rather than the influence of any interventions to improve lipid profiles in LAC. Nonetheless, a potential explanation could be that effective policies were in place and these prevented an increase. A pending task in LAC is a comprehensive and quantitative evaluation of policies to decrease the burden of cardio-metabolic risk factors.

Overall, the global work by Taddei and colleagues suggested that lipid levels have decreased in several countries in North America, Europe and Oceania, yet lipid levels have increased in East and South East Asia; as we have discussed before, their findings for LAC agrees with ours showing little change over time (NCD Risk Factor Collaboration (NCD-RisC), 2020a). These patterns largely mirrors trends in cardiovascular disease mortality: death rates per 100,000 people in Eastern and Western Europe have decreased, death rates have increased in East and South Asia, while changes are modest in LAC (IHME, GHDx, Viz Hub, 2020). Lipid biomarkers are key cardio-metabolic risk factors, thus successful improvement in these at the patient and population level could bring gains in terms of cardiovascular outcomes reduction.

Hypercholesterolemia awareness and control may be low in LAC, as it has been exemplified in some cities (Silva et al., 2010; Hernández-Alcaraz et al., 2020; Lotufo et al., 2016); we do not have any strong evidence to assume this profile has improved since then. Because awareness, treatment and control for hypertension are still insufficient, (Geldsetzer et al., 2019) despite the fact that antihypertension drugs may have better availability than lipid-lowering medications, we hypothesize poor treatment rates for dyslipidaemias in LAC. Therefore, this potential poor awareness, treatment and control rates for dyslipidaemias may have translated into the unremarkable trends herein reported for LAC. A recent global analysis also found that lipid levels have changed little in LAC, while in many high-income countries these levels have improved (NCD Risk Factor Collaboration (NCD-RisC), 2020a); this could be a consequence of better awareness and access to treatment in the latter countries.

In comparison to other world regions, a recent work located High−income English−speaking countries, Europe and High−income Asia−Pacific with larger mean levels of total cholesterol and HDL-Cholesterol than LAC (NCD Risk Factor Collaboration (NCD-RisC), 2020a). Diet and physical activity profiles, along with unequal access to primary prevention strategies, could be behind this difference. For non-HDL-Cholesterol, their findings revealed fewer regions above LAC, (NCD Risk Factor Collaboration (NCD-RisC), 2020a) which could indicate low prescription of lipid-lowering drugs (e.g., statins) in LAC. Time trends reported by the NCD-RisC largely agrees with our results, depicting LAC sub-regions with a marginal decrease since 1980 with regards to mean total cholesterol, HDL-cholesterol and non-HDL-Cholesterol (NCD Risk Factor Collaboration (NCD-RisC), 2020a). Other world regions have experienced a marked decrease or increase; this may support our hypothesis that little attention have been paid to lipid levels in LAC, resulting in unremarkable time changes.

The meta-analysis showed that the most frequent dyslipidaemia in LAC since 2005 was low HDL-Cholesterol. This could have relevant implications for clinical practice guidelines. Major international guidelines (Grundy et al., 2019) as well as guidelines from LAC (refer to Supplementary file 1, Table 4 for a summary of guidelines from selected countries in LAC) have solid algorithms and recommendations on when to start pharmacological treatment. Nonetheless, statins would reduce LDL-Cholesterol with little impact on HDL-Cholesterol. Consequently, based on our results, it would be advisable to strengthen clinical guidelines with further evidence, recommendations and algorithms to improve HDL-Cholesterol; these should include strong primary prevention strategies (e.g., life-styles modification). This does not imply that lowering LDL-Cholesterol should not be important in LAC; on the other hand, this suggests that raising HDL-Cholesterol should also be addressed by guidelines and practitioners.

Our findings suggest that low HDL Cholesterol is the most common dyslipidaemia trait in LAC since 2005. Reasons behind this finding can relate to other cardio-metabolic risk factors. While raised body mass index (e.g., obesity) and diabetes have a negative correlation with HDL-Cholesterol, exercise has a positive effect on this lipid fraction (Rashid and Genest, 2007). The proportion of the population with obesity and diabetes has raised substantially throughout LAC, (NCD Risk Factor Collaboration (NCD-RisC), 2019; NCD Risk Factor Collaboration (NCD-RisC), 2017a; NCD Risk Factor Collaboration (NCD-RisC), 2016; NCD Risk Factor Collaboration (NCD-RisC), 2020b) which also happens to be the region with one of the largest frequencies of physical inactivity (Guthold et al., 2018). Even if clinical guidelines incorporate thorough recommendations to improve HDL-Cholesterol, this may not be achieved without policies or population-based interventions addressing the underlying (concomitant) cardio-metabolic risk factors. To successfully increase HDL-Cholesterol in LAC, reducing obesity and diabetes, while providing opportunities to do physical activity, are also needed.

This is a comprehensive systematic review conducted in five major search engines. However, limitations should be acknowledged. First, we did not search in grey literature sources; although in these sources we could have found some reports based on national surveys (e.g., WHO STEPS results), we argue that the results are sufficiently robust to have been largely influenced or driven by research published in grey literature. Second, although we selected only population-based studies to report on the scenario at the general population level, we did not apply other criteria to avoid potential health or clinical bias. For example, we did include a report if it had excluded people on lipid lowering medications. These studies could provide slightly higher estimates, than if they had included both people with and without lipid-lowering drugs. To the best of our knowledge, there has not been a systematic assessment of lipid-lowering medication uptake across LAC, yet we argue that these drugs are still not widely prescribed. Because there is evidence suggesting limitations in accessing hypertension and diabetes medication, (Attaei et al., 2017; Chow et al., 2018) we believe that these restrictions would be even greater for lipid-lowering drugs. In this context, we argue that this limitation may have had little impact on our estimates. Third, there were some years for which we did not retrieve any data. This limitation would not have affected the most recent trends and meta-analysis. In this line, we also did not present results for every country in LAC, limiting the extrapolation of our findings to these nations. Future studies with other analytical approaches could improve these limitations and provide information for all years and countries, or even for sub-regions within LAC (Farzadfar et al., 2011; NCD Risk Factor Collaboration (NCD-RisC), 2020a). Fourth, although we only studied adult populations, the age range of the study participants may have not been the same across all selected studies. This could have biased our estimates if, the mean levels or prevalence estimates of the herein studied lipid biomarkers were significantly larger in some age ranges. Extracting published data to verify this hypothesis would considerably reduce the number of observations because not all studies reported their findings by (consistent) age groups. This would also be the case for sex, as studies would not always stratify findings by sex. Fifth, extraction of other characteristics of the studies could have provided relevant information to interpret the results and to draw the scenario of lipid research in LAC; among others, relevant features could include whether point-of-care devices were used or blood samples were analysed in laboratories, and whether these followed an international standard. Sixth, LDL-cholesterol could be measured directly or estimated (e.g., Friedewald formula), though this information was not extracted to further characterize the results. The Friedewald formula is frequently used, and it may underestimate the real value (Meeusen et al., 2014). If so, our estimates for LDL-cholesterol need to be interpreted cautiously; further research is needed to understand the magnitude of this potential underestimation and, if needed, to develop a more accurate formula for populations in LAC. In this line, a recent global work reported slightly larger mean levels of non-HDL Cholesterol in comparison to our LDL-cholesterol levels (NCD Risk Factor Collaboration (NCD-RisC), 2020a). Although these are not identical metrics, the agreement between these is typically good. Speculatively, we could hypothesize that some of surveys herein summarized used the Friedewald formula, and the LDL-cholesterol levels were underestimated. This could potentially explain the different results (NCD Risk Factor Collaboration (NCD-RisC), 2020a).

Some studies only reported the mean or the prevalence estimate. Although the prevalence estimates are relevant, from a public health perspective the mean and the shape of the distribution are also important and should be reported whenever possible. This calls for authors and reporting guidelines to provide both metrics. Similarly, studies did not report their results by sex or (consistent) age groups, precluding us to make estimates by gender and age.

A global endeavour reported on levels of total cholesterol for each country in the world until 2010 (Farzadfar et al., 2011; these work has been recently updated (NCD Risk Factor Collaboration (NCD-RisC), 2020a). The evidence from LAC was limited in comparison to our work, which also expands the evidence to include prevalence estimates. Beyond the CARMELA study which comprised seven cities in LAC, (Pramparo et al., 2011) and the CESCAS study which included cities in three countries, (Rubinstein et al., 2011) there is a dearth of multi-country studies addressing lipid profiles and other cardio-metabolic risk factors in LAC. These studies and other local research suggested that low HDL-Cholesterol was the most common dyslipidaemia. Our work confirms this observation and strengthens the evidence so that it can inform policies, interventions and guidelines.

Recently, an international work updated the 2010 global total cholesterol estimates (Farzadfar et al., 2011) and provided results for HDL-Cholesterol and non-HDL-Cholesterol (NCD Risk Factor Collaboration (NCD-RisC), 2020a). Our work complements this evidence by providing mean levels for other lipid fractions and prevalence estimates of clinically relevant dyslipidaemias in LAC. Their total cholesterol mean estimates for LAC are largely consistent with our findings, and so are the mean levels for HDL-Cholesterol; however, their non-HDL-Cholesterol means are larger than our LDL-cholesterol means. The reasons could be different methodology and analytical approach (please, refer to the limitations section).

Our findings, as those by the NCD-RisC, (NCD Risk Factor Collaboration (NCD-RisC), 2020a) suggested that mean levels of lipid biomarkers are not the same across LAC countries. Although LAC hosts mostly middle-income countries, there are large within countries inequalities; this is also seen in the Caribbean, where some islands may be high-income countries, but inequalities still exist. Different levels of poverty, access to healthy foods, opportunities for physical activity, and a still fragile primary health system, may explain the differences between sub-regions and countries in LAC.

A seminal work in Africa followed a similar methodology and reported, for the general population, a prevalence of 23% for high total cholesterol (our estimates were seven percentage points higher); 41% for low HDL-Cholesterol (our estimates were seven percentage points higher); 25% for elevated LDL-Cholesterol (our estimates were 15 percentage points higher); for triglycerides their prevalence was 16% (our results were 23 percentage points higher) (Noubiap et al., 2018). They also reported estimates for other populations (e.g., people with diabetes) (Noubiap et al., 2018). The higher -worse- estimates we reported for LAC could suggest LAC is ahead in the epidemiological and nutritional transition, in comparison with Africa.

An interesting finding, which deserves in-depth scrutiny, is that we found a marginal decrease in mean total cholesterol, yet also a marginal increase in the prevalence of high total cholesterol. We propose two hypotheses. First, aging of the population. Older people may have larger prevalence of dyslipidaemias. As populations are aging and living longer, we could expect larger prevalence estimates, while mean levels get ‘diluted’ or do not necessarily change. Second, and closely related, is that we do not know the drivers of these changes, i.e., we still need to answer whether the mean or the tails of the distribution are changing and driving the trends. For blood pressure, it has been suggested that the mean is the main driver of trends in raised blood pressure prevalence (NCD Risk Factor Collaboration (NCD-RisC), 2018); whether this is the case for lipid biomarkers and dyslipidaemias is still unknown. A third option could be the uptake of lipids-lowering drugs. As more people take these drugs, the population mean would decrease while the prevalence would not change (or even increase). However, as we have argued before, lipids-lowering medication coverage may still be limited in LAC.

Improving prevention, care and management for diabetes and hypertension is a clear priority globally and in LAC (González-Villalpando et al., 1999; Hall Martínez et al., 2005; Hernández-Hernández et al., 2017). Nonetheless, lipid profiles are relevant for public health and clinical practice as well (Grundy et al., 2019; NICE, 2014). In fact, they are a major risk factor for cardiovascular events including ischemic heart disease and stroke (Lewington et al., 2007; Di Angelantonio et al., 2009). Also, lipid biomarkers are predictors in several cardiovascular risk scores used to guide treatment allocation for primary cardiovascular prevention (Goff et al., 2014; WHO CVD Risk Chart Working Group, 2019; Hajifathalian et al., 2015). This work provides timely regional evidence to start a research and policy agenda to improve lipid profiles in LAC.

Our work has compiled the largest number of data sources across years and countries in LAC. Consequently, it is uniquely positioned to inform local and regional authorities about recent trends in lipids distribution and prevalence estimates. The results could have multiple pragmatic applications. First, they could be used as a baseline upon which build surveillance systems to monitor future trends of lipid biomarkers. Second, our comprehensive search strongly suggests that there is a lack of evidence from several countries, particularly in Central America and the Caribbean. Local and regional authorities should conduct epidemiological studies or population-wide surveys (e.g. STEPS approach); alternatively, when these have already been conducted, data could be open access for research purposes. Ideally, where data are available, these should meet the FAIR acronym: findable, accessible, interoperable, and reusable. Unfortunately, the first two elements of the acronym are perhaps the least frequent, yet the most important for scientific use of available data. Third, our results could inform prevention strategies and policies. Because we have reported on different lipid fractions, medication (e.g., statins) could be prioritized where LDL-cholesterol is higher, while diet or healthy lifestyles could be a priority where HDL seems to be the most important issue.

Levels and prevalence estimates of unhealthy total cholesterol, LDL-Cholesterol, HDL-Cholesterol and triglycerides seemed not to have substantially changed over the last years in LAC. Since 2005 across LAC, the most common dyslipidaemia was low HDL-Cholesterol. These results should inform policies so that they can start or strengthen strategies to improve lipid profiles, thus reducing the burden of cardiovascular events which are strongly associated with unhealthy lipid levels.

Materials and methods

Protocol

Request a detailed protocol

This is a systematic review of the literature (PROSPERO CRD42019120491; PRISMA Checklist available in Supplementary file 1). We aimed to identify trends in total cholesterol and cholesterol fractions in LAC general population; also, to ascertain which dyslipidaemia (e.g. low HDL-cholesterol) is the most prevalent in LAC.

Eligibility criteria

Request a detailed protocol

Research reports were analysed if they targeted adult men and women of the general population. We focused on LAC populations, thus studies with LAC populations in countries outside the LAC region, and studies with only foreign populations in LAC nations, were excluded. Population-based studies were defined as those which followed a random sampling of the general population. Conversely, studies addressing specific populations (e.g., shanty towns), those with patients (e.g., stroke survivors), or people with risk factors (e.g., smokers), were excluded.

The outcomes of interest were lipid biomarkers levels and dyslipidaemia prevalence. We focused on clinically and public health relevant lipid biomarkers: total cholesterol, HDL-Cholesterol, LDL-cholesterol and triglycerides. Only studies in which lipid biomarkers were measured with valid methods (e.g. laboratory or point-of-care devices) were included; that is, studies which results relied only on self-reported information were excluded.

Information sources

Request a detailed protocol

The search was conducted on December 21st, 2018. We used Scopus, LILACS, Embase, Medline and Global Health; the last three through Ovid. In all of these, the search was conducted without time or language restriction. The search terms are available in Supplementary file 1 pp. 06–07.

Study selection

Request a detailed protocol

Results from each search engine were downloaded and saved in EndNote where duplicates were dropped. A second search for duplicates was conducted with Rayyan, an online tool for systematic reviews (Ouzzani et al., 2016). Titles and abstracts were independently reviewed by two researchers (RMC-L and NP-B; CA-R and CJB-M; LA-F and DS-V), and discrepancies were solved by consensus or a third party (AB-O). After this screening phase, selected reports were downloaded and independently studied in detail by two researchers (RMC-L and NP-B; CA-R and CJB-M; LA-F and DS-V); discrepancies were solved by consensus or by a third party (AB-O). Finally, selected studies were scrutinized again to check for data duplication, i.e. different reports that used the same data (e.g., a national survey). In this case, the paper which presented more information (e.g., all four lipid biomarkers), or the one with the largest sample size, was included in the systematic review and meta-analysis. In other words, we aimed to include each study or survey once. The unit of analysis is a study.

Data collation

Request a detailed protocol

An extraction form was developed by the authors and tested with a random sample of selected studies; the form was not modified after data collation started. This form included study’s characteristics: mean age, proportion of men, year of data collection, and if it was a nationally representative sample. The extraction form also collated the mean and prevalence estimate as well as a dispersion measurement (e.g. standard deviation or confidence interval) of the available lipid biomarkers.

Risk of bias of individual studies

Request a detailed protocol

We used the risk of bias tool developed by Hoy and colleagues (Hoy et al., 2012). Notably, this tool was also used by a systematic review on a similar topic (Noubiap et al., 2018). These criteria were implemented in an Excel spreadsheet and evaluated independently by two reviewers (RMC-L and NP-B; CA-R and CJB-M; LA-F and DS-V); discrepancies were solved by consensus or a third party (AB-O).

Summary measures

Request a detailed protocol

We present both a narrative and quantitative summary. The narrative summary described the study’s characteristics, while the quantitative summary explored the trends of the lipid biomarkers means as well as prevalence estimates. In addition, following a random-effects meta-analysis and using data from 2005 onwards, we computed the pooled mean and the pooled prevalence estimate for each lipid biomarker and dyslipidaemia trait. We only used the most recent data (i.e., from 2005) to report on the current -or most recent- levels in LAC, rather than summarizing all available information with no clear time frame. Because the selected studies had different sample size and scope (e.g., national surveys versus community studies), we conducted the random-effects meta-analysis. Unlike a fixed-effect meta-analysis, in a random-effects meta-analysis large studies would not drive or bias the pooled estimates.

Ethical considerations

Request a detailed protocol

This is a systematic review of published scientific evidence and open information. Human subjects did not participate in this work directly and there was no intervention. Approval from an IRB/ethics committee was not requested.

Role of the funder

Request a detailed protocol

The funder had no role in the research question, data collation, analysis or reporting of the results. All the authors collectively are responsible for data accuracy and they all have approved the submitted work.

Data availability

This is a systematic review and meta-analysis of scientific literature. Data used came from scientific manuscripts which can be accessed online through libraries and scientific repositories. All relevant information is included within the manuscript.

References

    1. Hall Martínez J
    2. Hall Reyes J
    3. Alvarenga Thiebaud M
    4. Gómez O
    (2005)
    Prevalencia de hipertensión arterial en adultos de El Progreso
    Rev Med Hondur 73:60–64.
    1. Ponte-Negretti CI
    2. Isea-Pérez J
    3. Lanas F
    (2017a)
    Atherogenic dyslipidemia in Latin America: prevalence, causes and treatment consensus
    Revista Mexicana De Cardiología 28:57–85.
    1. Pramparo P
    2. Boissonnet C
    3. Schargrodsky H
    (2011)
    Evaluación del riesgo cardiovascular en siete ciudades de latinoamérica: las principales conclusiones del estudio CARMELA y de los subestudios
    Revista Argentina De Cardiología 79:377–382.

Decision letter

  1. Matthias Barton
    Senior Editor; University of Zurich, Switzerland
  2. Edward D Janus
    Reviewing Editor; University of Melbourne, Australia
  3. Edward D Janus
    Reviewer; University of Melbourne, Australia
  4. Brian Tomlinson
    Reviewer
  5. Ian Hambleton
    Reviewer

In the interests of transparency, eLife publishes the most substantive revision requests and the accompanying author responses.

Acceptance summary:

While cholesterol levels have been decreasing in Europe, North America and Australasia and increasing in many parts of Asia with corresponding changes in cardiovascular mortality cholesterol levels in South America and the Carribean have changed very little. The authors comprehensively review the available data from South America and the Carribean and point out the need for action.

Decision letter after peer review:

Thank you for submitting your article "A systematic review of population-based studies on Lipid profiles in Latin America and the Caribbean" for consideration by eLife. Your article has been reviewed by three peer reviewers, including Edward D Janus as the Reviewing Editor and Reviewer #1, and the evaluation has been overseen by Matthias Barton as the Senior Editor. The following individuals involved in review of your submission have agreed to reveal their identity: Brian Tomlinson (Reviewer #2); Ian Hambleton (Reviewer #3).

The reviewers have discussed the reviews with one another and the Reviewing Editor has drafted this decision to help you prepare a revised submission.

We would like to draw your attention to changes in our revision policy that we have made in response to COVID-19 (https://elifesciences.org/articles/57162). Specifically, we are asking editors to accept without delay manuscripts, like yours, that they judge can stand as eLife papers without additional data, even if they feel that they would make the manuscript stronger. Thus the revisions requested below only address clarity and presentation.

You will see that we see this as a very good piece of work and have gone over it in considerable detail and have raised these points to assist you in providing clarity. We appreciate that you may not be able to readily address them all.

Please use this title: "A systematic review of population-based studies on Lipid profiles in Latin America and the Caribbean".

Summary:

The authors have conducted a very thorough systematic review of the historical and current evidence on lipid profiles in Latin America and the Caribbean. It has included a very large number of studies and subjects and it provides an important synthesis of the available literature, from a region that is a little under-represented in the peer-reviewed literature, and that sometimes has evidence in less accessible journals. The analysis has been performed appropriately and the manuscript is well written. It is worthy of publication, once several substantive and minor comments have been adequately addressed. A really nice piece of work!

Essential revisions:

1) The Abstract could be improved by indicating the number of studies/subjects reviewed and the time period of the studies involved.

2) Subsection “Eligibility criteria.

"Adult men and women included". How were studies with differential age ranges incorporated into the meta-analysis? And see points (14) and (16) below.

3) Search strategy.

The search strategy is very nicely laid out in the Supplementary file. The absence of grey literature for national survey work (Discussion section) may be more influential than the authors imagine. Many national surveys from the Caribbean (for example) are not published in peer reviewed literature. This is not a deal-breaker – it is reasonable to not include a grey literature search, but this missing block of (steps) surveys should be recognised. This also links to where the authors note that more surveys are needed (Discussion section). Might be good to refer to the fair data principles. Often, data are available, but not easily findable or accessible.

National vs regional data and policy could be mentioned.

4) The number of subjects in each study is not given in Supplementary file 1—table 1 nor are dot sizes in Figure 1 showing this. Also, it is unclear if Figure 2 and Figure 3 show the year of the survey or of the publication – these may well differ. You have this in the supplementary table but not in the legends for Figure 2 and Figure 3. You should also if possible, have a column for Point of care/Laboratory/Accredited reference laboratory and show this for each study in your supplementary table. It would be useful to comment if any of the studies compared subjects living in rural and urban areas.

5) Males and females are not reported separately Usually they differ especially for HDL-cholesterol and triglycerides. If possible, please provide this.

6) Methodology for LDL-cholesterol is not noted. Was it the Friedewald calculation or direct measurement? Please show in your Supplementary Table if possible.

7) For TG prevalence is provided from 127,718 observations but it is stated that there were only 77,435 individuals used to calculate the means. Why is this? Similarly, the numbers used to derive means and prevalence are unclear for HDL-cholesterol and LDL-cholesterol.

8) In pooling for means did this give appropriate weight to the study size e.g. the average when combining a small (A) and a large (B) study is not the average of the mean from study A and study B but closer to the mean of study B. This is not clear in the manuscript. Similar issues arise with prevalence. This needs to be very clear for the reader.

9) HDL-cholesterol is decreased by both overweight/obesity and by the presence of type 2 diabetes which have increased in populations worldwide. This should come into the discussion. Alcohol increases HDL and exercise also increases it so they should also be mentioned.

Given that you main interesting finding is low HDL and you think there should be intervention/ management of this discussion is critical.

10) It would be useful to provide further comment on how these lipid levels compare with other parts of the world. Although they are not ideal, they are probably not as bad as many other countries. You could also discuss briefly trends over time in Europe, Australia, New Zealand and North America where lipid levels have decreased – markedly in some countries e.g. Finland – since the 1960s while in Asia there have increases over the same time frame e.g. Japan, Korea. Your lack of data from the period 1960-1980 is a limitation in this respect and this can be noted as such.

11) There is some comment about different lipid levels in different countries or different regions. It may be interesting to expand that if possible.

12) Unit of Analysis.

– Usually, in this type of systematic review, the unit-of-analysis is the survey. We would (commonly) link multiple articles to a single survey and draw on all available evidence to build a picture of each survey. On a number of occasions in this report, the authors flip between talking about "studies" and about "articles" – and this leads to lack of clarity on the unit-of-analysis used. More is needed in the Materials and methods section on this. E.g. – the authors seem to select a single article as representative of a survey. But I could not work out which article represented each survey.

– And in subsection “Selection process” – "281 papers (305 studies) met the inclusion criteria". Again, this confuses me a bit with respect to unit-of-analysis. I would usually expect to see more articles than surveys. Perhaps we are saying that some articles reported on multiple surveys? We need a bit of clarity on this – some extra text, perhaps offered in the Supplement.

– The Supplementary file 1—table 1 seems to list multiple articles from a single survey (Barbados is a good example – 2 articles from the same survey). I would strongly advise including a subsection – "Unit of Analysis" – and clearing up any uncertainty about this throughout the text. And it would be great (in the Supplementary file 1—table 1) to link papers to studies. That would be a really useful part of creating more clarity around the unit-of-analysis.

– Subsection “General characteristics of selected reports” is another example. Brazil (e.g.) has 66 data sources. But the real importance here is not the number of articles found, but the number of studies that contribute to the analysis from Brazil…

– And subsection “Total cholesterol”. "158,947 individuals informed the estimates". We should be able to read the number of studies as well – remembering to *always* report the unit-of-analysis metrics. Same in subsection “LDL-Cholesterol”, etc.

13) Risk of Bias (RoB).

– RoB for observational work remains a developing methodological area – so it is tricky! Nonetheless, I would like to hear some more from the authors on this. The tool is not easy to find (a reference in a reference) – so could be included as a supplement. In discussing, the authors should consider the common dilemma between rating scales, and the more qualitative assessment favoured (e.g.) by the Cochrane Collaboration these days. Recognise as well, the importance of assessing study-quality rather than assessing article quality. And sometimes (regularly in fact) an article does not give us enough information to make a RoB determination.

– In subsection “Risk of Bias”. Risk of bias was deemed to be low for all studies. This jumps out as being overly optimistic. Recognising that I could not access the Risk of Bias tool used. It would be very unusual (indeed) for a large systematic review of observational evidence to find only low-bias surveys. Considerations such as confounder adjustment, level of missing data and so on should be playing an important role in bias linked to observational evidence. And regularly, RoB cannot be ascertained due to lack of article information.

14) Meta-analysis vs Meta-regression.

This meta-analysis I think includes at least one covariate (e.g. time) and perhaps others (e.g. sub-region?). I would suggest that the analysis might be better termed a "random-effects meta-regression". A more complete description would be useful in the Materials and methods section.

15) Data synthesis presentation.

The scatterplot visuals are fine – but do not allow a reader to identify individual studies. I strongly suggest that the authors include a Forest plot for each outcome. Can be in Supplement, and (crucially for a systematic review) allows the reader to also interpret work at the unit-of-analysis level – i.e. for each survey.

16) Summary-level vs individual participant data (IPD) analyses.

In subsection “General characteristics”, the authors note "Men in study population was 26%. Men age was 47 years". I have assumed that the meta-regression was at the summary-data level (in other words, study-level means, or prevalence rates were the regression inputs). If I have that right, how did the authors cope with studies having different age-range inclusions and studies that may or may not have used statistical weighting / adjustments to present their summary data? The only other method would be an IPD analysis – but I don't think the authors had access to individual-level survey data? I could be wrong – I can find no mention of IPD?

17) Discussion section – surveillance approach.

The authors note "This work used a surveillance approach". It’s not too clear to me what this means, within a systematic review context?

18) Discussion around the finding of little lipid change over time.

Authors conclude that either (A) few policies/interventions exist to reduce lipids or (B) interventions were ineffective. There is a third possibilities. That the policies and interventions have been pretty good, and without them the lipid profiles would have increased.

19) Discussion section – guidelines.

There were no guidelines from Caribbean listed in this supplement. If none, this might warrant mention? But… I believe there are national and regional Caribbean examples. E.g. www.paho.org/hq/index.php?option=com_content&view=article&id=1423:2009-managing-hypertension-primary-care-caribbean&Itemid=1353&lang=en

HEARTS international movement also can be mentioned (World Health Organization).

[Editors' note: further revisions were suggested prior to acceptance, as described below.]

Thank you for resubmitting your work entitled "A systematic review of population-based studies on Lipid profiles in Latin America and the Caribbean" for further consideration by eLife. Your revised article has been evaluated by a Reviewing Editor and a Senior Editor.

We thank you for the comprehensive responses and revision of the manuscript which adequately address the reviewers comments. While the manuscript has been much improved there is still one issue that need to be addressed before it can be accepted for publication.

Please take note of the recent publication by Taddei et al.et al., (2020) The study by Taddei et al.et al., includes analyses on Latin America and the Caribbean and thus should be cited and discussed in the context of the findings presented in your revised manuscript.

https://doi.org/10.7554/eLife.57980.sa1

Author response

Summary:

The authors have conducted a very thorough systematic review of the historical and current evidence on lipid profiles in Latin America and the Caribbean. It has included a very large number of studies and subjects and it provides an important synthesis of the available literature, from a region that is a little under-represented in the peer-reviewed literature, and that sometimes has evidence in less accessible journals. The analysis has been performed appropriately and the manuscript is well written. It is worthy of publication, once several substantive and minor comments have been adequately addressed. A really nice piece of work!

We appreciate the positive feedback and fully agree with the statement that Latin America and the Caribbean (LAC) is “a little under-represented in the peer-reviewed literature”. We are focusing our work to improve this situation. Working with editors and reviewers like you, makes this task gratifying. Thank you very much indeed.

Essential revisions:

1) The Abstract could be improved by indicating the number of studies/subjects reviewed and the time period of the studies involved.

We have included the analysed number of studies and the underlying sample size for each lipid fraction; we have also included the time period. To avoid taking too much space in the abstract, the sample size has been reported along with the abbreviations. The modified Abstract reads: “… lipid (total cholesterol [TC; 86 studies with 168,553 people], HDL-Cholesterol [HDL-C; 84 studies with 121,282 people], LDL-Cholesterol [LDL-C; 61 studies with 86,854 people], and triglycerides [TG; 84 studies with 121,009 people]) levels and prevalences were laboratory-based. We used Scopus, LILACS, Embase, Medline and Global Health; summarized studies were from 1964 to 2016.”

2) Subsection “Eligibility criteria.

"Adult men and women included". How were studies with differential age ranges incorporated into the meta-analysis? And see points (14) and (16) below.

This is very interesting caveat, which we did not account for. We have further discussed this issue in the Discussion section. “Fourth, although we only studied adult populations, the age range of the study participants may have not been the same across all selected studies. […] Extracting published data to verify this hypothesis would considerably reduce the number of observations, because not all studies reported their findings by (consistent) age groups.”

3) Search strategy.

The search strategy is very nicely laid out in the Supplementary file 1. The absence of grey literature for national survey work (Discussion section) may be more influential than the authors imagine. Many national surveys from the Caribbean (for example) are not published in peer reviewed literature. This is not a deal-breaker – it is reasonable to not include a grey literature search, but this missing block of (steps) surveys should be recognised. This also links to where the authors note that more surveys are needed (Discussion section). Might be good to refer to the fair data principles. Often, data are available, but not easily findable or accessible.

National vs regional data and policy could be mentioned.

We believe the reviewers made a remarkable point about STEPS surveys and grey literature. We have toned down the Discussion section; the new text reads: “First, we did not search in grey literature sources; although in these sources we could have found some reports based on national surveys (e.g., WHO STEPS results), we argue that the results are sufficiently robust to have been largely influenced or driven by research published in grey literature.”

We have further discussed about the FAIR acronym; this read: “Ideally, where data are available, these should meet the FAIR acronym: findable, accessible, interoperable, and reusable. Unfortunately, the first two elements of the acronym are perhaps the least frequent, yet the most important for scientific use of available data.”

4) The number of subjects in each study is not given in Supplementary file 1—table 1 nor are dot sizes in Figure 1 showing this. Also, it is unclear if Figure 2 and Figure 3 show the year of the survey or of the publication – these may well differ. You have this in the supplementary table but not in the legends for Figure 2 and Figure 3. You should also if possible, have a column for Point of care/Laboratory/Accredited reference laboratory and show this for each study in your supplementary table. It would be useful to comment if any of the studies compared subjects living in rural and urban areas.

The sample size has been included in the Supplementary file. Also, in the footnotes for Figure 2 and Figure 3 we have specified: Year in the x-axis refers to data collection year. The figures have been updated to also include this information in the x-axis label.

Unfortunately, we did not extract any information on whether POC devices were used, or whether samples were processed in laboratories. We did not collate any information on rural/urban location either; most studies did not report their results stratified by age, sex or urban/rural location. We have discussed this potential limitation: “Fifth, extraction of other characteristics of the original studies could have provided relevant information to interpret the results and to draw the scenario of lipid research in LAC; among others, relevant features could include whether point-of-care devices were used or blood samples were analysed in laboratories, and whether these followed an international standard.”

5) Males and females are not reported separately Usually they differ especially for HDL-cholesterol and triglycerides. If possible, please provide this.

We agree with the fact that potential sex difference matters. However, we did not extract this information. As we discussed about age groups, most reports did not have results by sex. This has been discussed: “This would also be the case for sex, as studies would not always stratify findings by sex.”

6) Methodology for LDL-Cholesterol is not noted. Was it the Friedewald calculation or direct measurement? Please show in your Supplementary Table if possible.

Unfortunately, this information was not extracted, though discussed in the Discussion section: “Sixth, LDL-cholesterol could be measured directly or estimated (e.g., Friedewald formula), though this information was not extracted to further characterize the results. […] This could potentially explain the different results.”

7) For TG prevalence is provided from 127,718 observations but it is stated that there were only 77,435 individuals used to calculate the means. Why is this? Similarly, the numbers used to derive means and prevalence are unclear for HDL-cholesterol and LDL-cholesterol.

This is because we did not conduct an individual-level meta-analysis; in other words, we extracted summary information from published reports. These reports were more likely to present prevalence estimates rather than numeric results (e.g., means). This is the reason why the sample size for means and prevalences are not the same. We had discussed this: “Some studies only reported the mean or the prevalence estimate. Although the prevalence estimates are relevant, from a public health perspective the mean and the shape of the distribution are also important and should be reported whenever possible…”

8) In pooling for means did this give appropriate weight to the study size e.g. the average when combining a small (A) and a large (B) study is not the average of the mean from study A and study B but closer to the mean of study B. This is not clear in the manuscript. Similar issues arise with prevalence. This needs to be very clear for the reader.

Not particularly, however, this was one of the reasons why we did a random-effects meta-analysis (rather than fixed-effect). In a random-effects meta-analysis, we expected that each study will contribute to the pooled estimates proportional to its sample size, without biasing the results towards those studies with larger influence. We have complemented this information in the subsection “Summary measures”: “Because the selected studies had different sample size and scope (e.g., national surveys versus community studies), we conducted the random-effects meta-analysis. Unlike a fixed-effect meta-analysis, in a random-effects meta-analysis large studies would not drive or bias the pooled estimates.”

9) HDL-cholesterol is decreased by both overweight/obesity and by the presence of type 2 diabetes which have increased in populations world wide. This should come into the discussion. Alcohol increases HDL and exercise also increases it so they should also be mentioned.

Given that you main interesting finding is low HDL and you think there should be intervention/ management of this discussion is critical.

We have incorporated a new paragraph in the Discussion section to address these topics: Our findings suggest that low HDL-cholesterol is the most common dyslipidaemia trait in LAC since 2005. Reasons behind this finding can relate to other cardio-metabolic risk factors. While raised body mass index (e.g., obesity) and diabetes have a negative correlation with HDL-cholesterol, exercise has a positive effect on this lipid fraction (Rashid and Genest, 2007). The proportion of the population with obesity and diabetes has raised substantially throughout LAC (NCD Risk Factor Collaboration (NCD-RisC), 2019; NCD Risk Factor Collaboration (NCD-RisC), 2017; NCD Risk Factor Collaboration (NCD-RisC), 2016; NCD Risk Factor Collaboration (NCD-RisC), 2020), which also happens to be the region with one of the largest frequencies of physical inactivity. (Guthold et al., 2018). Even if clinical guidelines incorporate thorough recommendations to improve HDL-cholesterol, this may not be achieved without policies or population-based interventions addressing the underlying (concomitant) cardio-metabolic risk factors. To successfully increase HDL-cholesterol in LAC, reducing obesity and diabetes, while providing opportunities to do physical activity, are also needed.

10) It would be useful to provide further comment on how these lipid levels compare with other parts of the world. Although they are not ideal, they are probably not as bad as many other countries. You could also discuss briefly trends over time in Europe, Australia, New Zealand and North America where lipid levels have decreased – markedly in some countries e.g. Finland – since the 1960s while in Asia there have increases over the same time frame e.g. Japan, Korea. Your lack of data from the period 1960-1980 is a limitation in this respect and this can be noted as such.

We have incorporated two paragraphs in the Discussion section.

“Recently, an international work updated the 2010 global total cholesterol estimates (Farzadfar et al., 2011) and provided results for HDL-cholesterol and non-HDL-cholesterol (NCD Risk Factor Collaboration (NCD-RisC), 2020). […] The reasons could be different methodology and analytical approach (please, refer to the limitations section).”

“In comparison to other world regions, a recent work located High−income English−speaking countries, Europe and High-income Asia-Pacific with larger mean levels of total cholesterol and HDL-cholesterol than LAC. […] Other world regions have experienced a marked decrease; this may support our hypothesis that little attention have been paid to lipid levels in LAC, resulting in unremarkable time changes.”

11) There is some comment about different lipid levels in different countries or different regions. It may be interesting to expand that if possible.

These comments were in the Results section. We have further elaborated on these in the Discussion section: “Our findings, as those by the NCD-RisC (NCD Risk Factor Collaboration (NCD-RisC), 2020), suggested that mean levels of lipid biomarkers are not the same across LAC countries. […] Different levels of poverty, access to healthy foods, opportunities for physical activity, and a still fragile primary health system, may explain the differences between sub-regions and countries in LAC.”

12) Usually, in this type of systematic review, the unit-of-analysis is the survey… We would (commonly) link multiple articles to a single survey and draw on all available evidence to build a picture of each survey. On a number of occasions in this report, the authors flip between talking about "studies" and about "articles" – and this leads to lack of clarity on the unit-of-analysis used. More is needed in the Materials and methods section on this. E.g. – the authors seem to select a single article as representative of a survey. But I could not work out which article represented each survey.

The unit of analysis is a study. When multiple reports analysed the same study, then we chose the report (or paper) with the most information or the largest sample size. Throughout the manuscript we have changed the terms to “study”. Also, we have included the following in the Materials and methods section: “That is, we aimed to include each study or survey once. The unit of analysis is a study.”

– And in subsection “Selection process” – "281 papers (305 studies) met the inclusion criteria". Again, this confuses me a bit with respect to unit-of-analysis. I would usually expect to see more articles than surveys. Perhaps we are saying that some articles reported on multiple surveys? We need a bit of clarity on this – some extra text, perhaps offered in the Supplement.

Apologies for the lack of clarity. As explained above, we have changed the term to “study” throughout the manuscript. Figure 1—figure supplement 1 has been updated as well.

– The Supplementary file 1—table 1 seems to list multiple articles from a single survey (Barbados is a good example – 2 articles from the same survey). I would strongly advise including a subsection "Unit of Analysis" – and clearing up any uncertainty about this throughout the text. And it would be great (in the Supplementary file 1) to link papers to studies. That would be a really useful part of creating more clarity around the unit-of-analysis.

This was an error we have corrected. As we explained in the methods and above (please refer to point 12, we aimed to include each survey (e.g., STEPS) or study just once. We have verified again all studies included and eliminated duplicate surveys/studies. The total sample size of studies included in this work is now 197. The manuscript has been updated accordingly without significant changes in the results, interpretation and conclusions.

– Subsection “General characteristics of selected reports” is another example. Brazil (e.g.) has 66 data sources. But the real importance here is not the number of articles found, but the number of studies that contribute to the analysis from Brazil…

We have changed as suggested, to show the number of studies these countries contributed to the review. This read: “Brazil, with 61 studies, and Chile with 21 studies, contributed with the greatest number of studies to the systematic review…”

– And subsection “Total cholesterol”. "158,947 individuals informed the estimates". We should be able to read the number of studies as well – remembering to *always* report the unit-of-analysis metrics. Same in subsection “LDL-Cholesterol”, etc.

In these lines, we have included the number studies too. If the reviewers and editors allow, we would like to keep the sample size (along with the number of studies as requested), these has been reported in parenthesis next to the number of studies.

13) Risk of Bias (RoB).

– RoB for observational work remains a developing methodological area – so it is tricky! Nonetheless, I would like to hear some more from the authors on this. The tool is not easy to find (a reference in a reference) – so could be included as a supplement. In discussing, the authors should consider the common dilemma between rating scales, and the more qualitative assessment favoured (e.g.) by the Cochrane Collaboration these days. Recognise as well the importance of assessing study-quality rather than assessing article quality. And sometimes (regularly in fact) an article does not give us enough information to make a RoB determination.

We included the reference to the RoB tool (as well as a reference to another similar review), but probably this was not clear enough. Thus, we have reorganized that paragraph to make the RoB tool reference much more evident: “We used the risk of bias tool developed by Hoy and colleagues (Hoy et al., 2012). Notably, this tool was also used by a systematic review on a similar topic (Noubiap et al., 2018).” Please, see the next answer for further explanations and arguments regarding the other proposed issues.

– In subsection “Risk of Bias”. Risk of bias was deemed to be low for all studies. This jumps out as being overly optimistic. Recognising that I could not access the Risk of Bias tool used. It would be very unusual (indeed) for a large systematic review of observational evidence to find only low-bias surveys. Considerations such as confounder adjustment, level of missing data and so on should be playing an important role in bias linked to observational evidence. And regularly, RoB cannot be ascertained due to lack of article information.

We are happy to change our overall opinion to “moderate risk of bias”; in fact, we have changed Results section to reflect this.

Below, we explain our rationale for each of the ten items of the RoB assessment tool we followed. Also, we elaborated on our overall final judgment. Finally, we discussed that the evaluation of one report by study, in contrast to, for example, the original protocol, may be a limitation. A similar version of the following lines has been included in the Supplementary file and referred where relevant in the main text.

“The first item in the risk of bias (RoB) tool is: Was the study’s target population a close representation of the national population in relation to relevant variables, e.g. age, sex, occupation? We considered this “low” risk of bias because we only included population-based studies with random sampling of the general population, and we excluded studies with one population group alone (e.g., smokers). Whether a community study is a close representation of the country, is of course arguable. However, that study would still be “more representative” than one with a selected or convenience sample. For this item the possible outcomes were “low risk of bias” and “high risk of bias”. We considered our selected studies as “low risk of bias” because even when they were not full national surveys, they may still be representative of the general population. […]

A limitation of our methodology is that we assessed RoB based on the information available in each selected report (or paper), which may not contain all details to make a comprehensive assessment of the original study. Ideally, we would have needed to investigate the original protocol, but certainly this does not happen often in any systematic review. Moreover, because of our original selection criteria, we strongly consider that the selected reports do not provide biased information to affect our results.”

14) Meta-analysis vs Meta-regression.

This meta-analysis I think includes at least one covariate (e.g. time) and perhaps others (e.g. sub-region?). I would suggest that the analysis might be better termed a "random-effects meta-regression". A more complete description would be useful in the Materials and methods section.

Apologies for the confusion. We titled our work as “Meta-Analysis” because of the results in Table 1, where we present the pooled mean and prevalence estimates (following a random-effects meta-analysis). We did not conduct any meta-regression. When the reviewers refer to time, I believe they may be wondering about the results in Figure 2 and Figure 3, where we plotted the means and prevalences by year of data collection. For these plots we did not conduct a meta-regression based on time, and neither did we include other covariates (e.g., sub-region). Conversely, Figure 2 and Figure 3 are as simple as a scatter plot of the mean and prevalence estimates on the y-axis, and year of the data collection on the x-axis. In addition to this graphical representation (Figure 2 and Figure 3), we calculated the correlation, for those most interested in a “strong” number rather than visual inspection of time trends.

In summary, Figure 2 and Figure 3 are a graphical representation of how means and prevalences have changed over time, with a correlation coefficient; that is, these do not represent a meta-regression analysis. We considered our work as a meta-analysis because of the pooled estimates in Table 1.

15) Data synthesis presentation.

The scatterplot visuals are fine – but do not allow a reader to identify individual studies. I strongly suggest that the authors include a Forest plot for each outcome. Can be in Supplement, and (crucially for a systematic review) allows the reader to also interpret work at the unit-of-analysis level – i.e. for each survey.

We understand that the issue in hand is transparency and facilitating the readers to see the information at the unit of analysis level (the study). We have included in supplementary materials two tables showing this information, i.e., all estimates at the study level. These tables have been referenced in the footnotes of the main figures; these are Supplementary file 1—table 2 and Supplementary file 1—table 3. If the editors and reviewers allow, we would prefer not to present forest plots, which are basic figures in meta-analyses. We consider our work tells the story of lipid levels and prevalences, and for that we took advantage of an established methodology (systematic review and meta-analysis); however, this work is not a “standard” systematic review with meta-analysis.

16) Summary-level vs individual participant data (IPD) analyses.

In subsection “General characteristics”, the authors note "Men in study population was 26%. Men age was 47 years". I have assumed that the meta-regression was at the summary-data level (in other words, study-level means, or prevalence rates were the regression inputs). If I have that right, how did the authors cope with studies having different age-range inclusions and studies that may or may not have used statistical weighting / adjustments to present their summary data? The only other method would be an IPD analysis – but I don't think the authors had access to individual-level survey data? I could be wrong – I can find no mention of IPD?

The summary estimates extracted from the original reports were indeed at the study/summary-level. The overall mean age and mean male proportion, was a summary of summaries; i.e., the mean of the extracted means. We did not conduct a meta-regression analysis. Summaries extracted from the original reports were plotted by year of data collection (Figure 2 and Figure 3). The meta-analysis refers to the pooled estimates presented in Table 1. Given our overall methodology, and because we did not anticipate conducting a meta-regression analysis, we did not account for the different age ranges in the original selected studies. We have included this in the Discussion section; please, refer to our answer to question number 2 for further details.

17) Discussion section – surveillance approach.

The authors note "This work used a surveillance approach". It’s not too clear to me what this means, within a systematic review context?

We have further elaborated on this idea: “…We have pooled recent mean and prevalence estimates, which can serve as a starting point to monitor changes during the next years.”

18) Discussion around the finding of little lipid change over time.

Authors conclude that either (A) few policies/interventions exist to reduce lipids or (B) interventions were ineffective. There is a third possibilities. That the policies and interventions have been pretty good, and without them the lipid profiles would have increased.

We have incorporated this suggestion. This now reads: “Nonetheless, a potential explanation could be that effective policies were in place and these prevented an increase. A pending task in LAC is a comprehensive and quantitative evaluation of policies to decrease the burden of cardio-metabolic risk factors.”

19) Discussion section – Guidelines.

There were no guidelines from Caribbean listed in this supplement. If none, this might warrant mention? But… I believe there are national and regional Caribbean examples. E.g. www.paho.org/hq/index.php?option=com_content&view=article&id=1423:2009-managing-hypertension-primary-care-caribbean&Itemid=1353&lang=en

HEARTS international movement also can be mentioned (World Health Organization).

As also acknowledged in the manuscript, we chose a few selected guidelines. We did not aim to summarize all guidelines, neither to search for the guidelines or equivalent documents in all countries and territories in LAC. We believe this is beyond the scope of this work, and those we used served as examples. If the reviewers and editors feel this is not correct, we are happy to remove these lines and the Supplementary table. This would not affect the overall spirit of the work.

[Editors' note: further revisions were suggested prior to acceptance, as described below.]

Please take note of the recent publication by Taddei et al., (2020) The study by Taddei.et al., includes analyses on Latin America and the Caribbean and thus should be cited and discussed in the context of the findings presented in your revised manuscript.

According to the Editors, the authors need to address specifically the fact that – while lipid levels in South America and the Caribbean have changed little over time – mean cholesterol levels in North America, Europe, Australia and New Zealand have decreased over time while in most of Asia – East and South East – and also in the Pacific they have increased with corresponding impact on cardiovascular disease prevalence, especially in younger and middle aged individuals. The authors should expand on this and discuss this issue in their own words in the revised manuscript.

In our previous response, i.e., in the version we submitted after incorporating the reviewers’ comments, we included and discussed the cited work (Taddei et al., 2020). The work by Taddei and colleagues was published while we were working on the revisions. However, in this version we further elaborated on the specific points raised by the Editors.

First, we used this reference to strengthen an argument we made in the second paragraph of the Discussion section: “Although there has been a marginal decrease in the mean of the four lipid biomarkers over time, the results do not support there have been a substantial change. A substantial change was not observed for prevalence estimates either. These findings are consistent with those from a recent global analysis, in which they found little change in total cholesterol and non-HDL-cholesterol in LAC, a decrease in several areas of North America, Europe, and Oceania, while an increase in East and South East Asia (NCD Risk Factor Collaboration (NCD-RisC), 2020).”

Immediately after this we have introduced a new paragraph to specifically address the Editors’ request: “Overall, the global work by Taddei and colleagues suggested that lipid levels have decreased in several countries in North America, Europe and Oceania, yet lipid levels have increased in East and South East Asia; as we have discussed before, their findings for LAC agrees with ours showing little change over time (NCD Risk Factor Collaboration (NCD-RisC), 2020). […] Lipid biomarkers are key cardio-metabolic risk factors, thus successful improvement in these at the patient and population level could bring gains in terms of cardiovascular outcomes reduction.”

Second, we also used this reference and the idea suggested by the Editors to complement the arguments in the third paragraph of the Discussion section (now fourth after the inclusion the paragraph described above): “Therefore, this potential poor awareness, treatment and control rates for dyslipidaemias may have translated into the unremarkable trends herein reported for LAC. A recent global analysis also found that lipid levels have changed little in LAC, while in many high-income countries these levels have improved (NCD Risk Factor Collaboration (NCD-RisC), 2020); this could be a consequence of better awareness and access to treatment in the latter countries.”

https://doi.org/10.7554/eLife.57980.sa2

Article and author information

Author details

  1. Rodrigo M Carrillo-Larco

    1. Department of Epidemiology and Biostatistics, School of Public Health, Imperial College London, London, United Kingdom
    2. CRONICAS Centre of Excellence in Chronic Diseases, Universidad Peruana Cayetano Heredia, Lima, Peru
    3. Universidad Católica Los Ángeles de Chimbote, Instituto de Investigación, Chimbote, Peru
    Contribution
    Conceptualization, Formal analysis, Investigation, Writing - original draft, Writing - review and editing
    For correspondence
    rcarrill@ic.ac.uk
    Competing interests
    No competing interests declared
    ORCID icon "This ORCID iD identifies the author of this article:" 0000-0002-2090-1856
  2. C Joel Benites-Moya

    CRONICAS Centre of Excellence in Chronic Diseases, Universidad Peruana Cayetano Heredia, Lima, Peru
    Contribution
    Investigation, Writing - review and editing
    Competing interests
    No competing interests declared
  3. Cecilia Anza-Ramirez

    CRONICAS Centre of Excellence in Chronic Diseases, Universidad Peruana Cayetano Heredia, Lima, Peru
    Contribution
    Investigation, Writing - review and editing
    Competing interests
    No competing interests declared
    ORCID icon "This ORCID iD identifies the author of this article:" 0000-0001-7364-8252
  4. Leonardo Albitres-Flores

    1. CRONICAS Centre of Excellence in Chronic Diseases, Universidad Peruana Cayetano Heredia, Lima, Peru
    2. Facultad de Medicina de la Universidad Nacional de Trujillo, Trujillo, Peru
    3. Sociedad Científica de Estudiantes de Medicina de la Universidad Nacional de Trujillo-SOCEMUNT, Trujillo, Peru
    Contribution
    Investigation, Writing - review and editing
    Competing interests
    No competing interests declared
    ORCID icon "This ORCID iD identifies the author of this article:" 0000-0002-0077-3615
  5. Diana Sánchez-Velazco

    CRONICAS Centre of Excellence in Chronic Diseases, Universidad Peruana Cayetano Heredia, Lima, Peru
    Contribution
    Investigation, Writing - review and editing
    Competing interests
    No competing interests declared
  6. Niels Pacheco-Barrios

    CRONICAS Centre of Excellence in Chronic Diseases, Universidad Peruana Cayetano Heredia, Lima, Peru
    Contribution
    Investigation, Writing - review and editing
    Competing interests
    No competing interests declared
  7. Antonio Bernabe-Ortiz

    1. CRONICAS Centre of Excellence in Chronic Diseases, Universidad Peruana Cayetano Heredia, Lima, Peru
    2. Universidad Científica del Sur, Lima, Peru
    Contribution
    Conceptualization, Investigation, Writing - review and editing
    Competing interests
    No competing interests declared
    ORCID icon "This ORCID iD identifies the author of this article:" 0000-0002-6834-1376

Funding

Wellcome Trust (214185/Z/18/Z)

  • Rodrigo M Carrillo-Larco

The funders had no role in study design, data collection and interpretation, or the decision to submit the work for publication.

Senior Editor

  1. Matthias Barton, University of Zurich, Switzerland

Reviewing Editor

  1. Edward D Janus, University of Melbourne, Australia

Reviewers

  1. Edward D Janus, University of Melbourne, Australia
  2. Brian Tomlinson
  3. Ian Hambleton

Publication history

  1. Received: April 17, 2020
  2. Accepted: July 13, 2020
  3. Version of Record published: August 18, 2020 (version 1)

Copyright

© 2020, Carrillo-Larco et al.

This article is distributed under the terms of the Creative Commons Attribution License, which permits unrestricted use and redistribution provided that the original author and source are credited.

Metrics

  • 2,075
    Page views
  • 209
    Downloads
  • 7
    Citations

Article citation count generated by polling the highest count across the following sources: Crossref, PubMed Central, Scopus.

Download links

A two-part list of links to download the article, or parts of the article, in various formats.

Downloads (link to download the article as PDF)

Open citations (links to open the citations from this article in various online reference manager services)

Cite this article (links to download the citations from this article in formats compatible with various reference manager tools)

  1. Rodrigo M Carrillo-Larco
  2. C Joel Benites-Moya
  3. Cecilia Anza-Ramirez
  4. Leonardo Albitres-Flores
  5. Diana Sánchez-Velazco
  6. Niels Pacheco-Barrios
  7. Antonio Bernabe-Ortiz
(2020)
A systematic review of population-based studies on lipid profiles in Latin America and the Caribbean
eLife 9:e57980.
https://doi.org/10.7554/eLife.57980

Further reading

    1. Epidemiology and Global Health
    Susan L Parker, Ashish A Deshmukh ... Jane R Montealegre
    Research Article

    Background: Home-based self-sampling for human papillomavirus (HPV) testing may be an alternative for women not attending clinic-based cervical cancer screening.

    Methods: We assessed barriers to care and motivators to use at-home HPV self-sampling kits during the COVID-19 pandemic as part of a randomized controlled trial evaluating kit effectiveness. Participants were women aged 30-65 and under-screened for cervical cancer in a safety-net healthcare system. We conducted telephone surveys in English/Spanish among a subgroup of trial participants, assessed differences between groups, and determined statistical significance at p<0.05.

    Results: Over half of 233 survey participants reported that clinic-based screening (Pap) is uncomfortable (67.8%), embarrassing (52.4%), and discomfort seeing male providers (63.1%). The last two factors were significantly more prevalent among Spanish versus English speakers (66.4% vs. 30% (p=0.000) and 69.9 vs. 52.2% (p=0.006), respectively). Most women who completed the kit found Pap more embarrassing (69.3%), stressful (55.6%), and less convenient (55.6%) than the kit. The first factor was more prevalent among Spanish versus English speakers (79.6% vs. 53.38%, p=0.001) and among patients with elementary education or below.

    Conclusions: The COVID-19 pandemic influenced most (59.5%) to participate in the trial due to fear of COVID, difficulty making appointments, and ease of using kits. HPV self-sampling kits may reduce barriers among under-screened women in a safety-net system.

    Funding: This study is supported by a grant from the National Institute for Minority Health and Health Disparities (NIMHD, R01MD013715, PI: JR Montealegre).

    Clinical trial number: NCT03898167.

    1. Epidemiology and Global Health
    Irene Man, Damien Georges ... Iacopo Baussano
    Research Article

    Local cervical cancer epidemiological data essential to project the context-specific impact of cervical cancer preventive measures are often missing. We developed a framework, hereafter named Footprinting, to approximate missing data on sexual behaviour, human papillomavirus (HPV) prevalence, or cervical cancer incidence, and applied it to an Indian case study. With our framework, we (1) identified clusters of Indian states with similar cervical cancer incidence patterns, (2) classified states without incidence data to the identified clusters based on similarity in sexual behaviour, (3) approximated missing cervical cancer incidence and HPV prevalence data based on available data within each cluster. Two main patterns of cervical cancer incidence, characterized by high and low incidence, were identified. Based on the patterns in the sexual behaviour data, all Indian states with missing data on cervical cancer incidence were classified to the low-incidence cluster. Finally, missing data on cervical cancer incidence and HPV prevalence were approximated based on the mean of the available data within each cluster. With the Footprinting framework, we approximated missing cervical cancer epidemiological data and made context-specific impact projections for cervical cancer preventive measures, to assist public health decisions on cervical cancer prevention in India and other countries.