A cross-kingdom conserved ER-phagy receptor maintains endoplasmic reticulum homeostasis during stress
- Gregor Mendel Institute (GMI), Austrian Academy of Sciences, Vienna BioCenter (VBC), Austria
- Research Institute of Molecular Pathology (IMP), Vienna BioCenter (VBC), Austria
- School of Life Sciences, Centre for Cell and Developmental Biology and State Key Laboratory of Agrobiotechnology, The Chinese University of Hong Kong, School of Life Sciences, New Territories, China
- Department of Molecular Signal Processing, Leibniz Institute of Plant Biochemistry, Germany
- Department of Plant Genetics, Breeding and Biotechnology, Warsaw University of Life Sciences-SGGW, Poland
- Department of Biochemistry and Cell Biology, Max Perutz Labs, University of Vienna, Vienna BioCenter (VBC), Austria
- BOKU Core Facility Biomolecular & Cellular Analysis, University of Natural Resources and Life Sciences, Austria
- Department of Molecular and Cellular Biology, Medical Institute of Bioregulation, Kyushu University, Japan
- Institute of Molecular Biotechnology of the Austrian Academy of Sciences (IMBA), Vienna BioCenter (VBC), Austria
- Medical University of Vienna, Austria
Figures
Figure 1 with 4 supplements
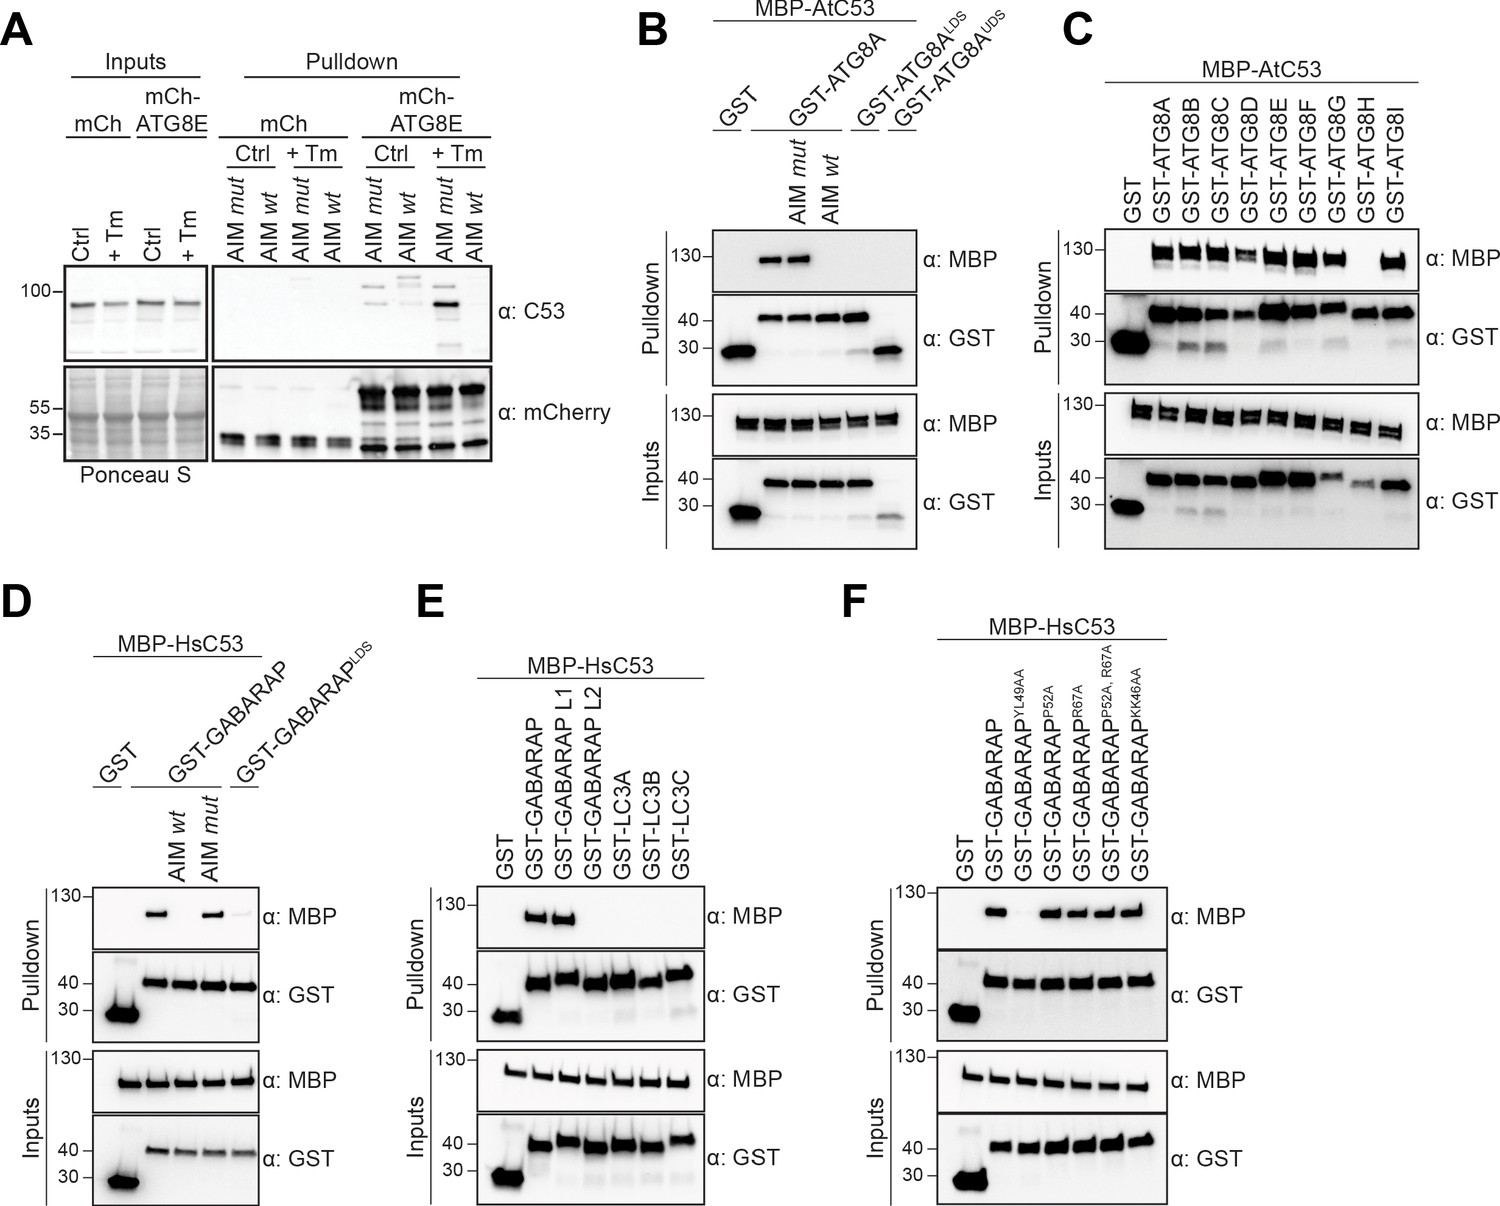
C53 binds ATG8 in an AIM dependent manner via the LIR Docking Site (LDS).
(A) Peptide competition coupled in vivo pull-down revealed C53 as an AIM dependent ATG8 interactor. In vivo co-immunoprecipitation of extracts of Arabidopsis seedlings expressing mCherry alone or mCherry-ATG8E incubated in Control or 10 µg/ml tunicamycin (Tm) containing media. The peptides AIM wt and AIM mut were added to a final concentration of 200 µM. Input and bound proteins were visualized by immunoblotting with anti-mCherry and anti-C53 antibodies. (B) AtC53 interact with ATG8A in an AIM-dependent manner. Bacterial lysates containing recombinant protein were mixed and pulled down with glutathione magnetic agarose beads. The peptides AIM wt and AIM mut were added to a final concentration of 200 µM. (C) AtC53 interacts with AtATG8 in an isoform specific manner. In vitro pull down with all ATG8 isoforms of Arabidopsis thaliana (At) shows that AtC53 can interact with eight out of nine ATG8 isoforms. (D) HsC53 interact with GABARAP in an AIM-dependent manner. Bacterial lysates containing recombinant protein were mixed and pulled down with glutathione magnetic agarose beads. The peptides AIM wt and AIM mut were added to a final concentration of 200 µM. (E) HsC53 interacts with GABARAP and GABARAP L1. Bacterial lysates containing recombinant protein were mixed and pulled down with glutathione magnetic agarose beads. (F) HsC53 interacts with GABARAP via the LIR Docking Site (LDS). Mutating the W site to a YL49AA mutation (LDS) (Marshall et al., 2019) prevents binding of GABARAP to C53. However, mutating the L position to P52A or R67A (Marshall et al., 2019), or mutating KK64AA (which mediates the interaction with the atypical LIR motif found in UBA5 [Huber et al., 2019]) did not prevent C53 binding. Bacterial lysates containing recombinant protein were mixed and pulled down with glutathione magnetic agarose beads. Input and bound proteins were visualized by immunoblotting with anti-GST and anti-MBP antibodies. LDS = LIR Docking-Site mutant (Marshall et al., 2019; UDS = Ubiquitin Docking Site mutant Marshall et al., 2019).
Figure 1—figure supplement 1

Identification of high affinity AIM peptides for peptide competition coupled immunoprecipitation mass spectrometry and in vitro pull-down experiments.
(A) Qualitative analysis of peptide array results. A library of ATG8-interacting motif peptides (See Supplementary file 1), were spotted onto an array and incubated with GST or GST-ATG8A. (B) Quantification of peptide array results for selected AIM peptides. The AIM peptide (AIM wt) (EEEDFDWEIVLEEEM) showed the highest fluorescence intensity. (C) Isothermal titration calorimetry (ITC) experiments showing binding of AIM wt to ATG8A and GABARAP. Upper left and right panels show heat generated upon titration of AIM wt (600 µM) to ATG8A or GABARAP (both 40 μM). Lower left and right panels show integrated heat data (■) and the fit (solid line) to a one-set-of-sites binding model using PEAQ-ITC analysis software. Representative values of KD, N, ΔH, -TΔS and ΔG from three independent ITC experiments are reported in Supplementary file 6. (D) Isothermal titration calorimetry (ITC) experiments showing that the AIM mutant peptide (AIM mut) (EEEDFDAEIALEEEM) cannot bind to ATG8A or GABARAP. Upper left and right panels show heat generated upon titration of AIM mut (600 µM) to ATG8A or GABARAP (both 40 μM). Lower left and right panels show integrated heat data (■) from PEAQ-ITC analysis software.
Figure 1—figure supplement 2
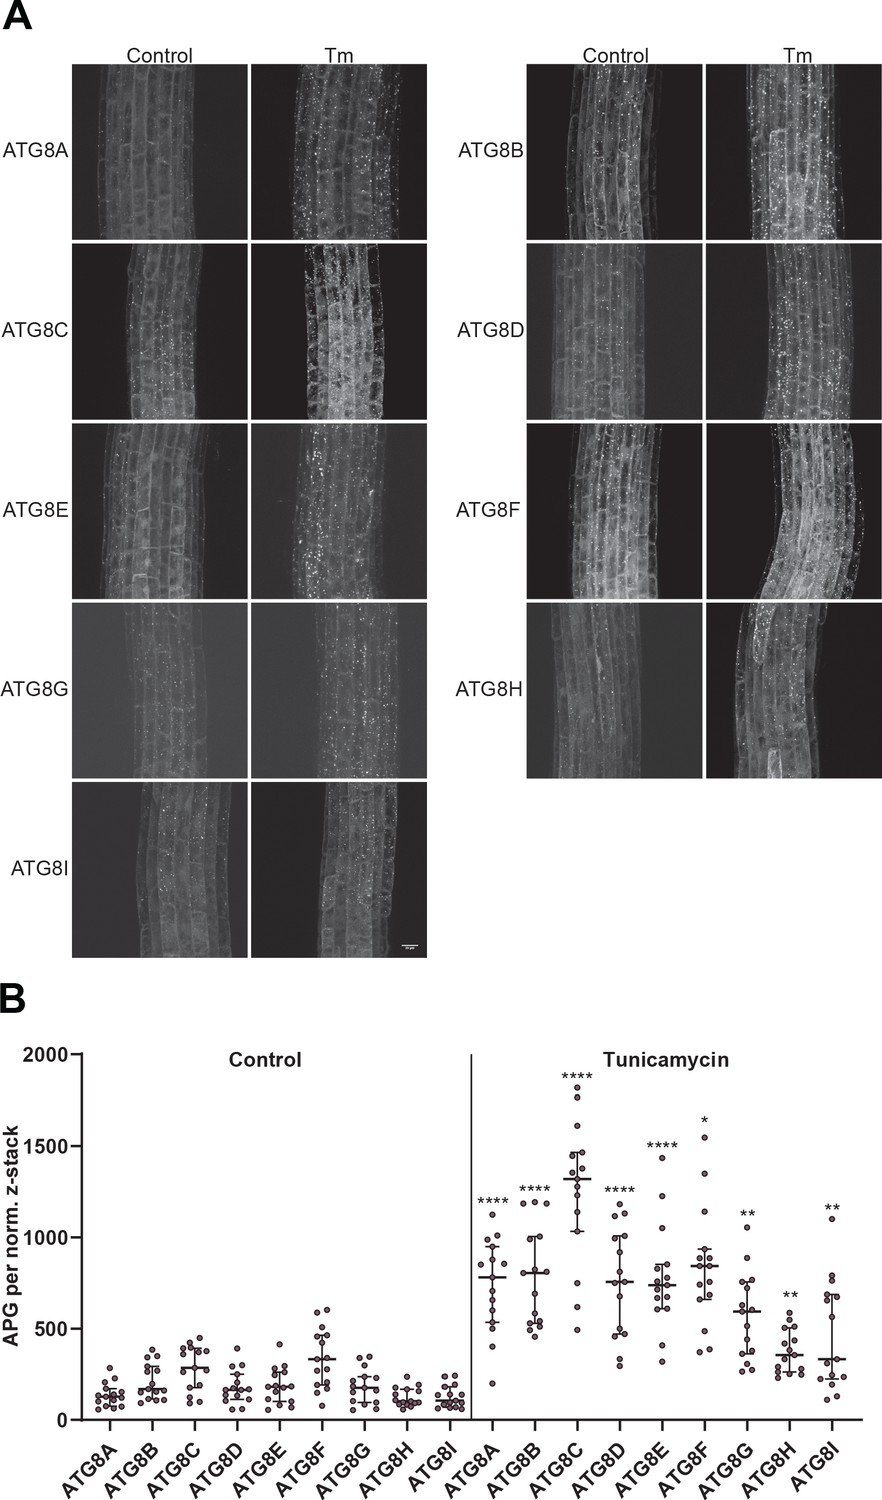
All Arabidopsis ATG8 isoforms are induced by tunicamycin-triggered ER stress.
(A) Representative confocal images of transgenic Arabidopsis seedlings expressing GFP-ATG8A to I in Col-0 background. Six-day-old seedlings were incubated in either control or tunicamycin (10 µg/ml) containing media. (B) Quantification of the autophagosomes (APG) per normalized Z-stack. Bars represent the mean (± SD) of at least 10 biological replicates. Significant differences between control and tunicamycin-treated samples are indicated with * when p value ≤ 0.05, ** when p value ≤ 0.01, and *** when p value ≤ 0.001.
Figure 1—figure supplement 3
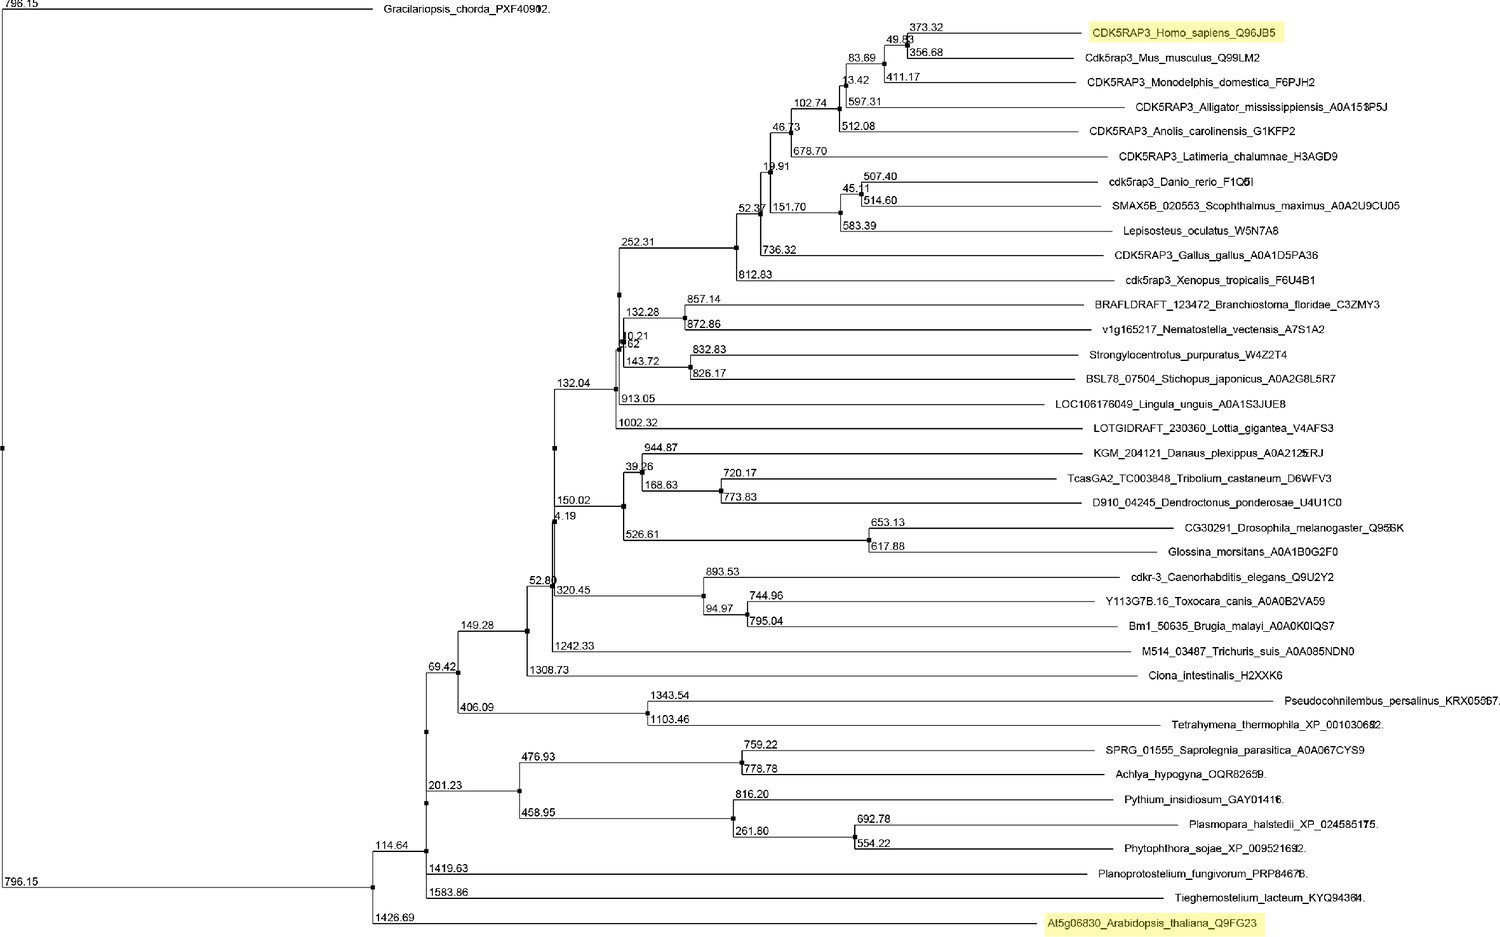
Unrooted maximum likelihood phylogenetic tree of C53 homologs.
The tree was generated from protein sequence alignments of C53 homologs from 38 species. The bootstrap support for each node is indicated. The tree was calculated with Jalview 2.11.0 from distance matrices determined from aggregate BLOSUM 62 scores using Average Distance (UPGMA) algorithm.
Figure 1—figure supplement 4
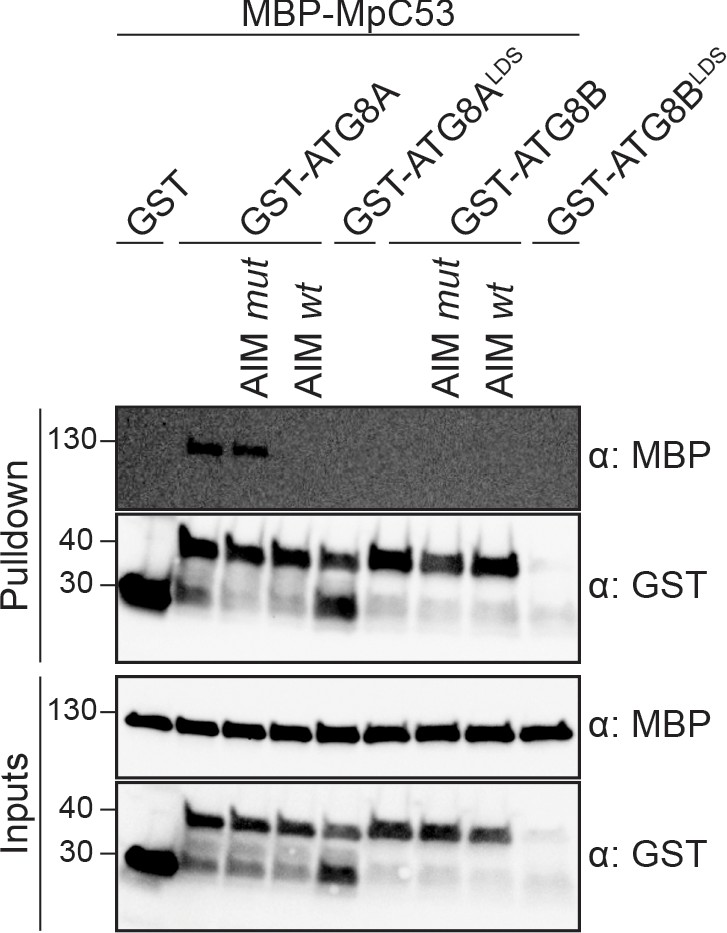
MpC53 interacts with MpATG8 isoforms in a specific manner.
In vitro pull down with both ATG8 isoforms of Marchantia polymorpha (Mp) shows that MpC53 can interact with one out of two ATG8 isoforms. Bacterial lysates containing recombinant protein were mixed and pulled down with glutathione magnetic agarose beads. Before MpC53 pull down, peptides AIM wt and AIM mut were added to a final concentration of 200 µM. Input and bound proteins were visualized by immunoblotting with anti-GST and anti-MBP antibodies.
Figure 2 with 3 supplements
C53 is recruited to autophagosomes during ER-stress and undergoes ER-stress specific autophagic degradation.
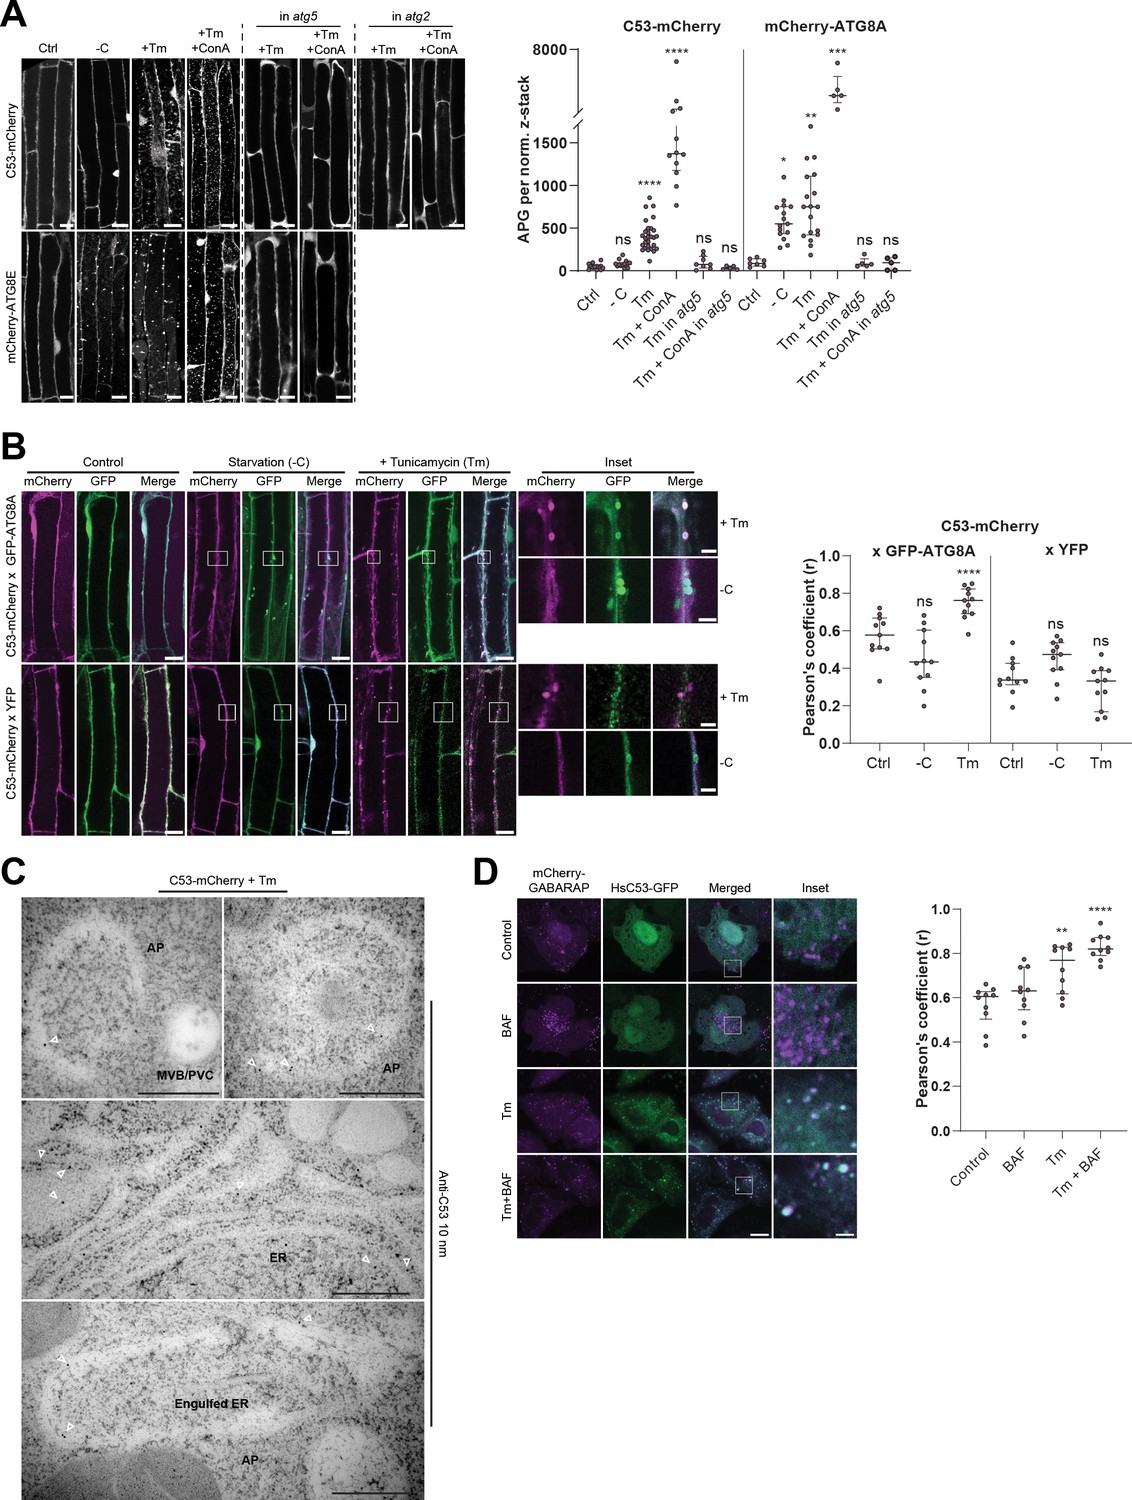
(A) AtC53 is specifically recruited to puncta upon ER stress and this depends on ATG5 and ATG2. Left Panel, representative confocal images of transgenic Arabidopsis seedlings expressing C53-mCherry and mCherry-ATG8E in Col-0 wild type, atg5 and atg2 mutant backgrounds. Six-day-old seedlings were incubated in either control, sucrose (-C)-deficient, tunicamycin (10 µg/ml), or tunicamycin (Tm, 10 µg/ml) + Concanamycin (ConA, 1 µM) containing media. Scale bars, 10 µm. Right Panel, Quantification of the autophagosomes (APG) per normalized Z-stacks. Bars represent the mean (± SD) of at least 10 biological replicates. (B) AtC53 puncta colocalize with GFP-ATG8A-labeled autophagosomes during ER stress. Left Panel, Co-localization analyses of single plane confocal images obtained from transgenic Arabidopsis roots co-expressing C53-mCherry (magenta) with GFP-ATG8A or YFP alone (green). Four-day-old seedlings were incubated in either control, sucrose deficient (-C), or tunicamycin containing media. Scale bars, 20 µm. Inset scale bars, 2 µm. Right Panel, Pearson’s Coefficient (r) analysis of the colocalization of C53-mCherry with GFP-ATG8A or YFP alone. Bars represent the mean (± SD) of at least five biological replicates. (C) Electron micrographs showing that C53 localizes to the ER and autophagosomes during ER stress. Immunogold labeling of high-pressure frozen, 5-day-old Arabidopsis roots treated with 300 ng/ml tunicamycin for 6 hr. Arrowheads indicate 10 nm gold particles. Scale bars, 500 nm. ER = Endoplasmic reticulum, AP = autophagosome, MVB/PVC = multivesicular body. (D) HsC53 puncta colocalize with mCherry-GABARAP labelled autophagosomes during ER stress. Left Panel, Confocal images of PFA fixed HeLa cells transiently expressing C53-GFP (green) and mCherry-GABARAP (magenta). Cells were either untreated (Control) or treated with tunicamycin (Tm) or Tm + Bafilomycin (BAF). Scale bar, 20 µm. Inset scale bar, 2 µm. Right Panel, Pearson’s Coefficient analysis of the colocalization of HsC53-GFP with mCherry-GABARAP under control and Tm-treated conditions. Bars represent the mean (± SD) of at least five biological replicates. Significant differences are indicated with * when p value ≤ 0.05, ** when p value ≤ 0.01, and *** when p value ≤ 0.001.
Figure 2—figure supplement 1
Analysis of AtC53 puncta under various stress conditions revealed induction of C53 puncta upon ER stress.
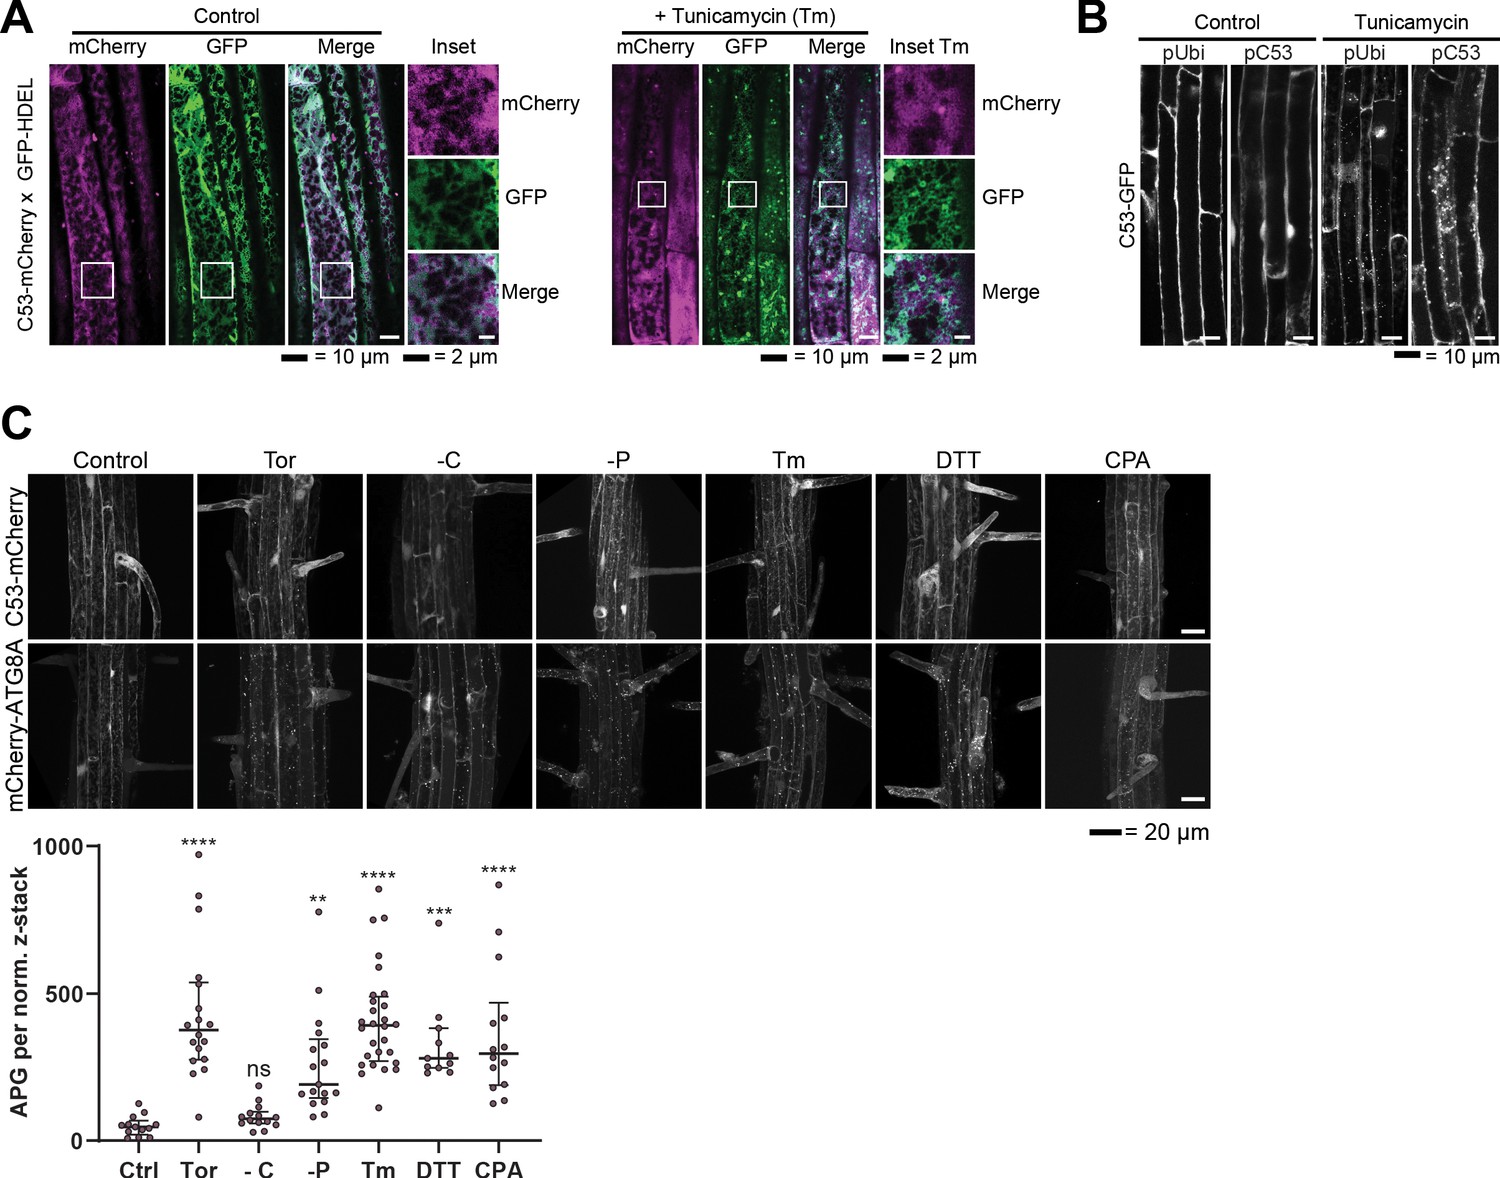
(A) AtC53 partially colocalize with HDEL-GFP under control conditions, but do not colocalize with HDEL-GFP puncta upon ER-stress treatment. Colocalization analysis from confocal micrographs of C53-mCherry (magenta) transgenic lines crossed with luminal ER-Marker GFP-HDEL (green, upper panels). Transgenic 5-day-old seedling roots were incubated in either control or tunicamycin (10 μg/ml) containing media. Representative confocal images of single cytoplasmic layer of both conditions are shown to demonstrate the ER network structure of the substrate. Scale bars, 20 µm. Inset scale bars, 2 µm. (B) Native promoter and Ubiquitin 10 driven C53 lines form comparable levels of puncta upon ER stress. Confocal micrographs of autophagic flux of transgenic seedlings expressing pUbi::AtC53-GFP and pC53::AtC53-GFP in wild-type Col-0 background. Seedlings were incubated in either control media or media containing 10 µg/ml tunicamycin (Tm). Representative confocal images in single plane at similar laser powers are shown. Scale bars, 10 µm. (C) AtC53 form puncta under various ER stress inducing conditions. Upper Panel, representative confocal images of transgenic Arabidopsis seedlings expressing C53-mCherry and mCherry-ATG8A in Col-0 background. Six-day-old seedlings were incubated in either control (Ctrl), sucrose deficient (-C), or phosphate deficient (-P) media, or media containing 9 µm Torin1 (Tor), 10 µg/ml tunicamycin (Tm), 15 µM CPA, or 2.5 mM DTT. The TOR kinase inhibitor Torin and ER stress inducing conditions -P, DTT, Tm, and CPA-triggered formation of both C53 and ATG8 puncta, whereas carbon starvation only triggered ATG8 puncta. Scale bars, 20 µm. Lower Panel, Quantification of autophagosomes (APG) per normalized Z-stack. Bars represent the mean (± SD) of at least 10 biological replicates. Significant differences compared to control treatment (Ctrl) are indicated with * when p value ≤ 0.05, ** when p value ≤ 0.01, and *** when p value ≤ 0.00. ns = not significant.
Figure 2—figure supplement 2

C53 binds selective autophagy adaptor ATG11.
(A) C53 puncta partially colocalize with ATG11-GFP during ER stress Upper Panel, Co-localization analyses of single plane confocal images obtained from transgenic Arabidopsis roots co-expressing C53-mCherry (magenta) with ATG11-GFP (green). 4 day old seedlings were incubated in either control, sucrose deficient (-C), or 10 µg/ml tunicamycin (Tm) containing media. Scale bars, 20 µm. Lower Left Panel, Inset Scale bar, 2 µm. Lower Right Panel, Pearson’s Coefficient (r) analysis of the colocalization of C53-mCherry with ATG11-GFP. C53 only colocalized with ATG11 under ER stress treatments. Bars represent the mean (± SD) of at least five biological replicates. Significant differences are indicated with * when p value ≤ 0.05, ** when p value ≤ 0.01, and *** when p value ≤ 0.001. ns = not significant (B) AtC53 and HsC53 directly interact with mammalian ATG11 homolog FIP200. GSH beads were coated with GST or GST-FIP200. Excess GST or GST-FIP200 was washed off, and beads were incubated with 2, 5 or 10 µM of recombinant GFP (negative control), GFP-p62 (positive control), AtC53-GFP, or HsC53-GFP. Beads were equilibrated for 1 hr and imaged using a confocal microscope. Right Panel, Quantification of C53 binding to FIP200. The graphs on the right show the average GFP intensity of beads n ≥ 15, normalized to the signal of GFP-p62.
Figure 2—figure supplement 3
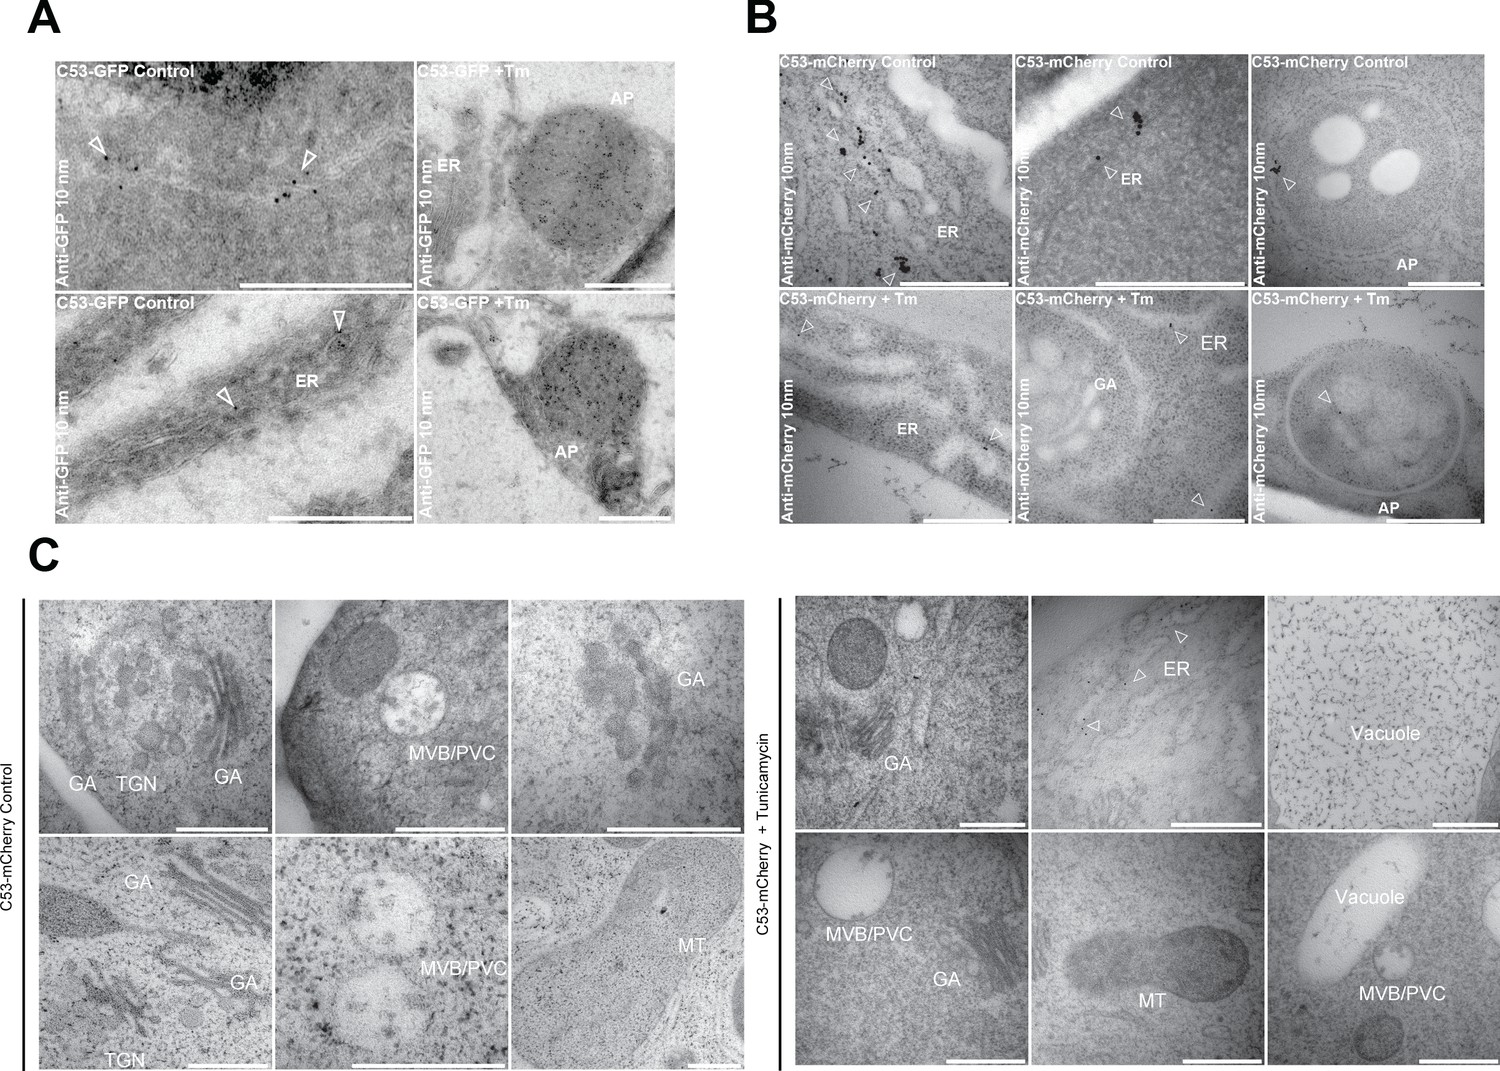
Electron micrographs showing that C53 localizes to the ER and autophagosomes during ER stress.
(A-C) Immunogold labeling of high-pressure frozen, 5-day-old Arabidopsis roots treated with (Tm) or without (control) 10 µg/ml tunicamycin for 6 hr. Arrowheads indicate 10 nm gold particles. Scale bars, 500 nm. (A) C53-GFP transgenic roots were prepared for immunogold electron microscopy analysis using GFP antibody. (B) C53-mCherry transgenic roots were prepared for immunogold electron microscopy analysis using RFP antibody. ER = Endoplasmic reticulum, AP = autophagosome. (C) Subcellular localization analyses of C53 under control and stress conditions. Arrow heads indicate 10 nm gold particles. Scale bars, 500 nm. ER = Endoplasmic reticulum, MVB/PVC = multivesicular body, GA = Golgi Apparatus, TGN = Trans Golgi-Network, MT = Mitochondria.
Figure 3

Autophagic flux analysis of AtC53 and HsC53 show that C53 autophagic flux is induced during ER stress.
(A–C) AtC53 flux is induced by Torin and tunicamycin treatment. (A) Autophagic flux analysis of transgenic pUbi::AtC53-GFP (right panel) and pUbi::GFP-ATG8A (left panel) seedlings. (B) Autophagic flux analysis of endogenous AtC53 and ATG8, using AtC53 and ATG8 antibodies, respectively. (C) Autophagic flux analysis of transgenic pAtC53::AtC53-GFP seedlings. Col-0 or transgenic seedlings were incubated in control media or media containing 9 µM Torin1 (Tor) or 10 µg/ml tunicamycin (Tm). In addition, each treatment was supplied with 1 µm concanamycin A (conA) to visualize vacuolar degradation. Representative Western blots are displayed. Full-length and free GFP-bands from the same blot were separated due to different exposure times. In (C), * and ** correspond to short and long exposures of the same blot, respectively. Quantification of the relative intensities (Rel. Int.) of the protein bands were normalized for the total protein level of the lysate (Ponceau S). Average C53 levels and SD for n = 3 are shown. (D-E) AtC53 flux is specifically induced upon phosphate starvation. (D) Autophagic flux analysis of transgenic pUbi::AtC53-GFP (right panel) and pUbi::GFP-ATG8A (left panel) seedlings under carbon, nitrogen, and phosphate starvation conditions. (E) Autophagic flux analysis of endogenous AtC53 and ATG8, using AtC53 and ATG8 antibodies, respectively. Col-0 or transgenic seedlings were incubated in control media or media depleted with sucrose (-C), nitrogen (-N) or phosphate (-P). In addition, each treatment was supplied with 1 µm concanamycin A (conA) to visualize vacuolar degradation. Representative western blots are displayed. Full-length and free GFP-bands from the same blot were separated due to different exposure times. Quantification of the relative intensities (Rel. Int.) of the protein bands were normalized for the total protein level of the lysate (Ponceau S). Average C53 levels and SD for n = 3 are shown. (F) AtC53 autophagic flux is induced by various ER stress inducing conditions. Western blot analysis of Arabidopsis transgenic seedlings expressing AtC53-GFP incubated in either control (Ctrl), sucrose -deficient medium (-C), 10 µg/ml tunicamycin (Tm), 3 hr at 37°C (Heat), 2.5 µM Thapsigargin (Tg), or 50 µM Kifunensine (Kif). In addition, each treatment was supplied with 1 µm concanamycin A (conA) to visualize vacuolar degradation. (G) HsC53 flux is induced by Torin and tunicamycin treatment. Western blot analysis of HeLa whole cell lysates. Cells were either left untreated or treated for 16 hr with 2.5 µg/ml tunicamycin (Tm) or 1.5 µM Torin (Tor) and subsequently given a recovery period of 2 hr in presence or absence of 100 nM Bafilomycin A1 (BAF). C53 and BIP3 blots were run on 4–20% gradient gels and transferred to nitrocellulose membranes, LC3B blots were run on 15% gels and transferred to PVDF membranes. (* or ** indicate corresponding membranes). Quantification of the relative intensities (Rel. Int.) of the protein bands were normalized for the total protein level of the lysate (Vinculin). Average C53 levels and SD for n = 3 are shown.
Figure 4 with 3 supplements
C53 interacts with ATG8 via the Intrinsically Disordered Region.
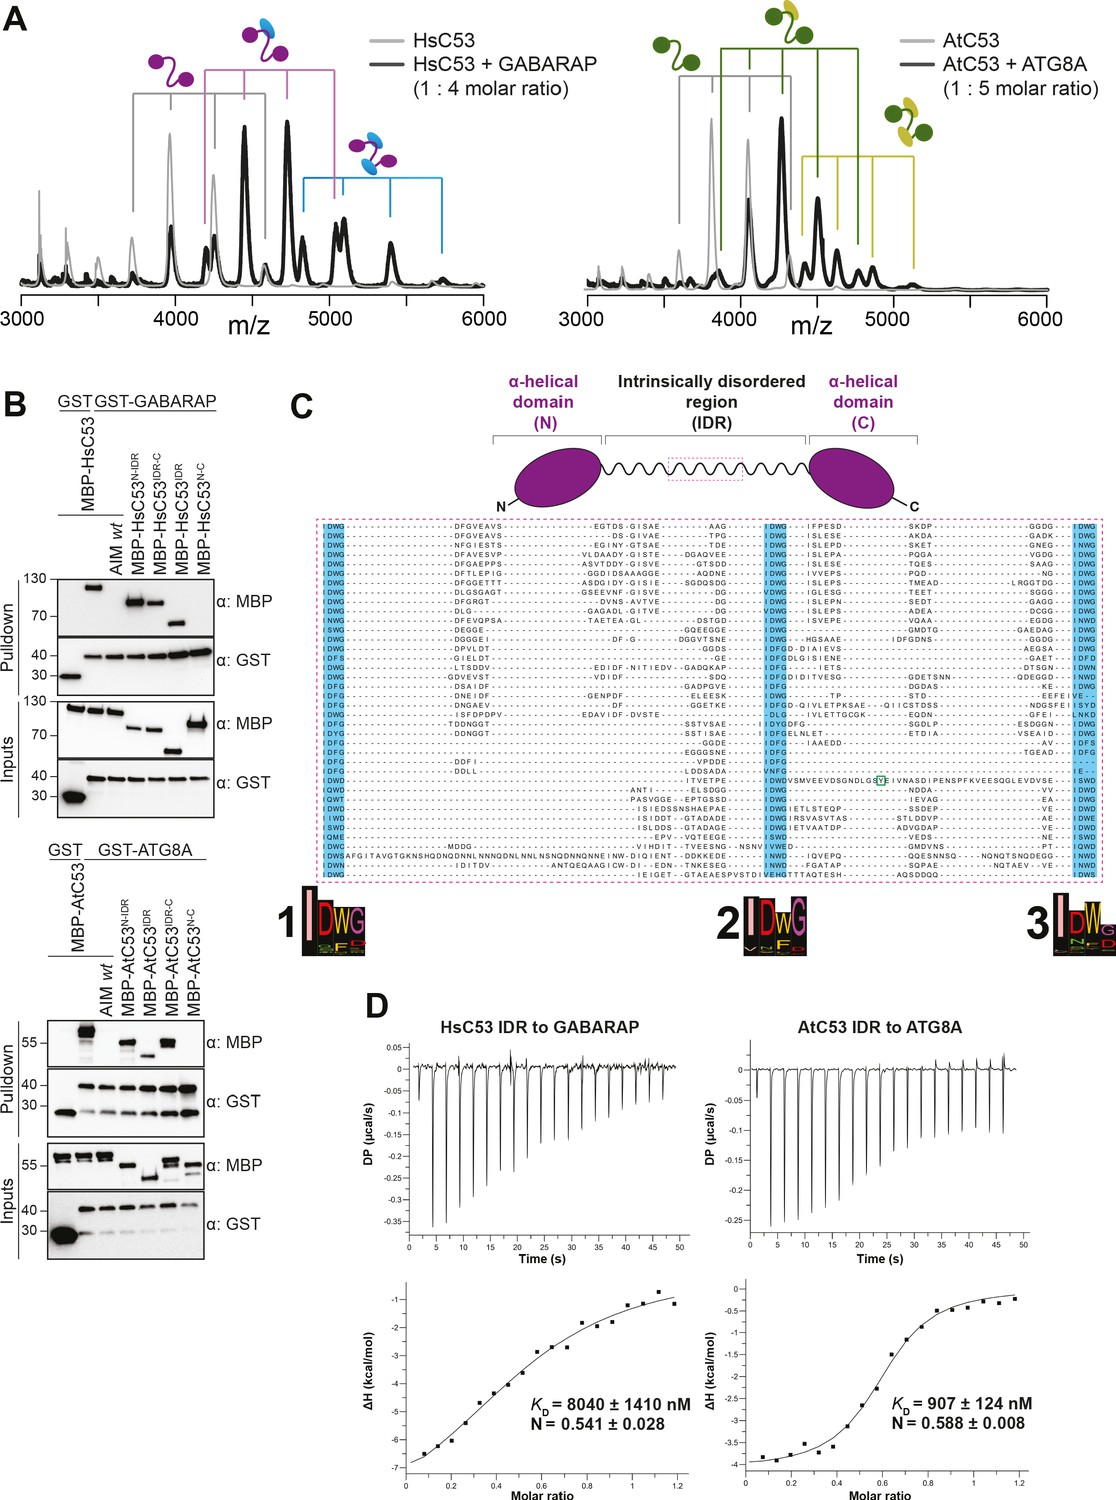
(A) Native mass spectrometry (nMS) analysis showing HsC53 and AtC53 form 1:1 and 1:2 complexes with GABARAP and ATG8A, respectively. Left; nMS of HsC53 (grey) and HsC53 plus GABARAP in a 1:4 molar ratio (black). Peaks corresponding to unbound HsC53, the 1:1 complex and 1:2 complex are indicated with grey, magenta and blue, respectively. Right; nMS of AtC53 (grey) and AtC53 plus ATG8A in a 1:5 molar ratio (black). Peaks corresponding to unbound AtC53, the 1:1 complex and 1:2 complex are indicated with grey, green and yellow, respectively. Full spectra are shown in Figure 4—figure supplement 1. (B) Upper Panel, HsC53 intrinsically disordered region (IDR) is necessary and sufficient to mediate the interaction with GABARAP. Lower Panel, AtC53 IDR is necessary and sufficient to mediate the interaction with ATG8A. Bacterial lysates containing recombinant protein were mixed and pulled down with glutathione magnetic agarose beads. The AIM wt peptide was added at a final concentration of 200 µM. Input and bound proteins were visualized by immunoblotting with anti-GST and anti-MBP antibodies. N: N-terminal truncation; M: IDR; C: C-terminal truncation. (C) C53 IDR has three highly conserved regions. Protein sequence alignment of the predicted IDR amino acid sequences showed three highly conserved regions with a consensus sequence of IDWG (highlighted in blue). Y304 is highlighted in the green rectangle. The species names and the full protein sequence alignment is presented in Figure S10. (D) Isothermal titration calorimetry (ITC) experiments showing binding of AtC53 and HsC53 IDRs to ATG8A and GABARAP, respectively. Upper left and right panels show heat generated upon titration of AtC53 IDR (250 µM) or HsC53 IDR (250 μM) to ATG8A or GABARAP (both 40 μM). Lower left and right panels show integrated heat data (■) and the fit (solid line) to a one-set-of-sites binding model using PEAQ-ITC analysis software. Representative values of KD, N, ΔH, -TΔS, and ΔG from three independent ITC experiments are reported in Supplementary file 6.
Figure 4—figure supplement 1
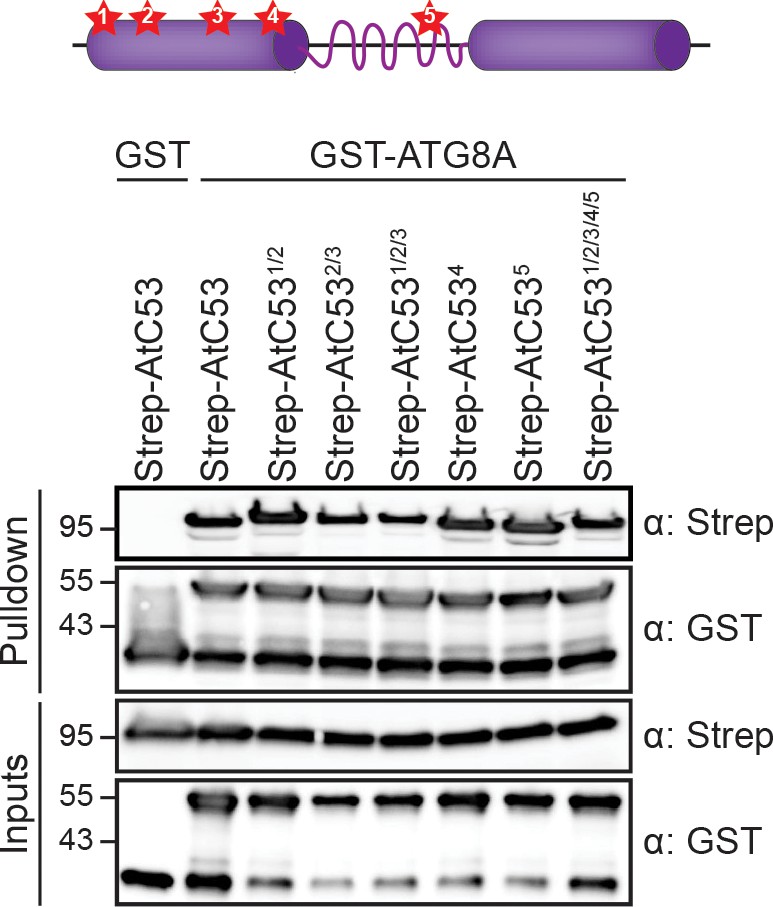
AtC53-ATG8 interaction is not mediated by canonical ATG8 interaction motifs.
Upper panel, schematic of secondary structure of C53 with high-scoring canonical AIMs displayed as stars 1 to 5. Lower panel, In vitro pull down of mutated AIM motifs in AtC53-Strep with GST-ATG8A. Single and up to 5-tuple mutants were used as designated. Bacterial lysates containing recombinant protein were mixed and pulled down with glutathione magnetic agarose beads. Input and bound proteins were visualized by immunoblotting with anti-GST and anti-Strep antibodies.
Figure 4—figure supplement 2

Native mass spectrometry analyses of HsC53-GABARAP and AtC53-ATG8A interactions.
(A) Native mass spectrometry (nMS) of (1) HsC53 (5 µM), (2) HsC53 (5 µM) + GABARAP (20 µM), and (3) HsC53 (5 µM) + GABARAP (10 µM) + AIM wt peptide (10 µM). (1) HsC53 is a monomeric protein, which presents in charge states 13+ to 53+. The trimodal shape of the charge state distribution is diagnostic of a protein that exists in compact and extended conformations (Beveridge et al., 2014). (2) Binding of HsC53 to GABAPRAP is observed in 1:0, 1:1 and 1:2 ratios. (3) All GABARAP is now present in a 1:1 complex with the AIM peptide, which prevents it from binding to HsC53. HsC53 is present in the unbound state. (B) nMS of (1) HsC53-IDR (2.5 µM), (2) GABARAP (5 µM), and (3) HsC53-IDR (2.5 µM) + GABARAP (12.5 µM). Binding of HsC53-IDR to GABARAP is observed in 1:1 and 1:2 ratios. (C) nMS of (1) AtC53 (1 µM), (2) AtC53 (1 µM) + AtG8A (5 µM), and (3) AtC53sAIM (1 µM) + AtG8A (5 µM). (1) AtC53 is a monomeric protein, which presents in charge states 14+ to 57+. The trimodal shape of the charge state distribution is diagnostic of a protein that exists in compact and extended conformations (Beveridge et al., 2014). (2) Binding of AtC53 to AtG8A is observed in 1:1 and 1:2 ratios. (3) AtC53sAIM is mainly present in the unbound state, with small amounts of 1:1 complex formed with AtG8A. (D) nMS of (1) AtC53-IDR (2.5 µM), (2) AtG8A (10 µM), (3) AtC53-IDR (2.5 µM) + AtG8A (10 µM), and (4) AtC53-IDR (2.5 µM) + AtG8A (20 µM). Binding of AtC53-IDR to ATG8A is observed in 1:1 and 1:2 ratios, with a small amount of 1:3 binding at 1:8 molar excess of ATG8A.
Figure 4—figure supplement 3
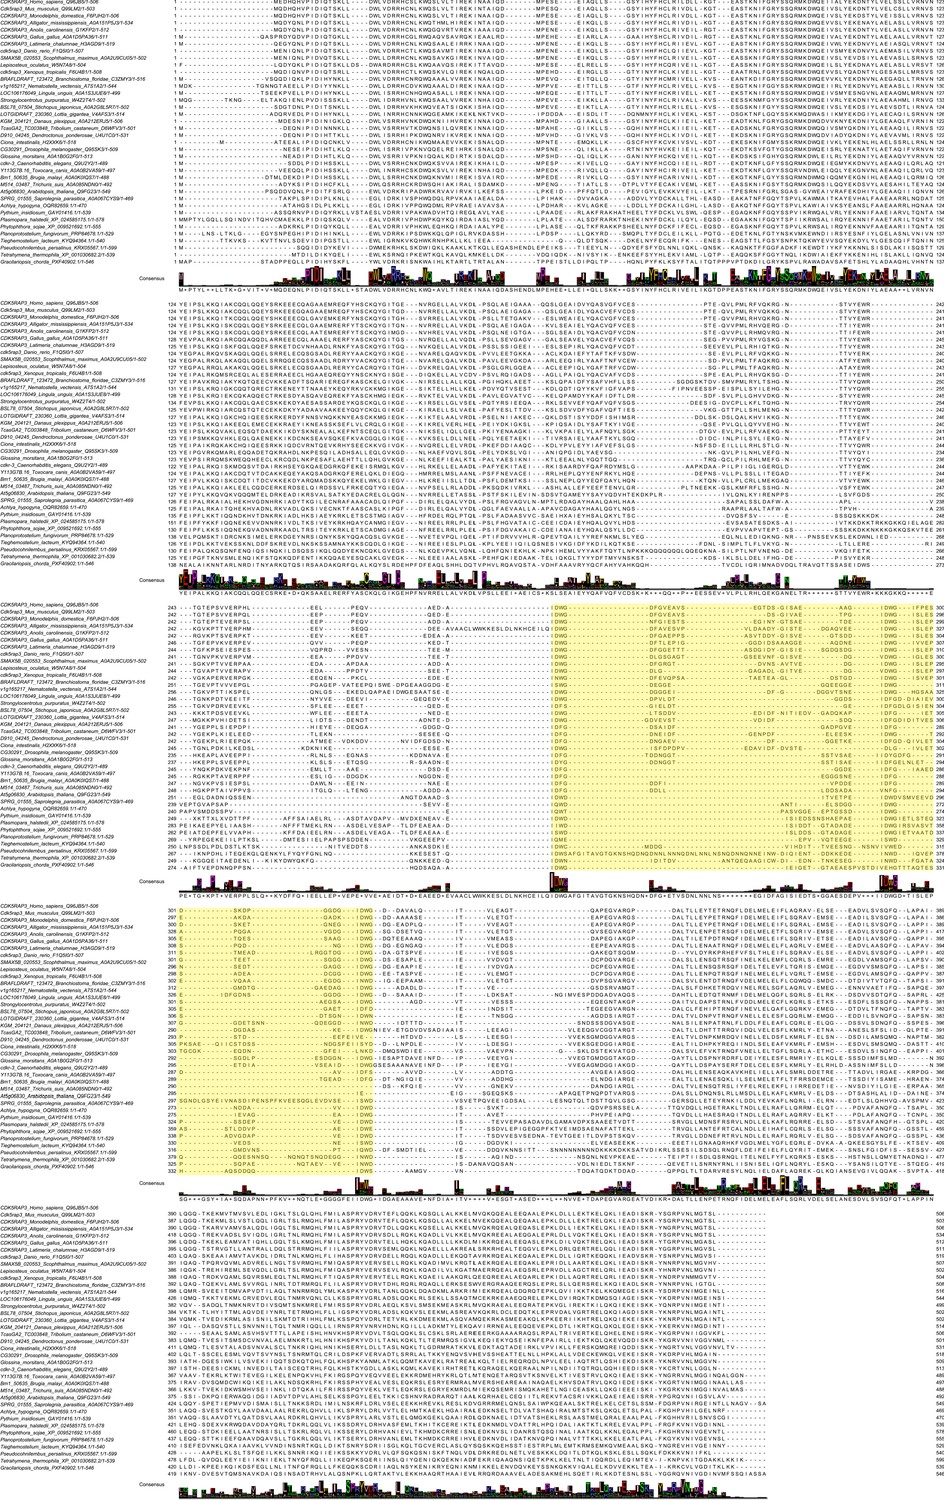
Multiple sequence alignment of C53 homologs.
Protein sequences of C53 homologs from selected multicellular eukaryotic species were aligned using Clustal Omega server (Madeira et al., 2019) and processed with Jalview. Residue numbers are labeled according to the HsC53 sequence. The multiple sequence alignment used in Figure 4C is highlighted in yellow.
Figure 5 with 1 supplement

C53 interacts with ATG8 via shuffled ATG8 interacting motifs (sAIMs).
(A) Upper Panel, the three conserved IDWG motifs (sAIMs) in HsC53 IDR mediate interaction with GABARAP. Pull downs were performed as described in (b). 1A: W269A; 2A: W294A; 3A: W312A. Lower Panel, AtC53 quadruple mutant cannot interact with ATG8A. In addition to the sAIM motifs, a canonical AIM (304-YEIV) also contributes to ATG8 binding. Bacterial lysates containing recombinant protein were mixed and pulled down with glutathione magnetic agarose beads. The AIM wt peptide was added at a final concentration of 200 µM. Input and bound proteins were visualized by immunoblotting with anti-GST and anti-MBP antibodies. 1A: W276A; 2A: W287A; 3A: W335A. (B, C) Surface plasmon resonance (SPR) analyses of C53-ATG8 binding. GST-GABARAP or GST-ATG8A fusion proteins were captured on the surface of the active cell (500 RU) and GST alone was captured on the surface of the reference cell (300 RU). Upper Left Panels: Increasing concentrations of the AIM wt peptide were premixed with 10 µM C53 and injected onto the sensor surface. Binding curves were obtained by subtracting the reference cell signal from the active cell signal. Lower left Panels: Binding affinities were determined by plotting the maximum response units versus the respective concentration of the AIM wt peptide and the data were fitted using the Biacore T200 Evaluation software 3.1 (GE Healthcare). Upper Right Panels: C53 was premixed with buffer or 3600 nM of AIM mut peptide and injected onto the sensor surface. Lower Right Panels: C53sAIM was premixed with buffer or 3600 nM of AIM wt peptide and injected onto the sensor surface. A representative sensorgram from three independent experiments is shown. (D) AtC53 quadruple mutant (sAIM) does not form puncta upon ER-stress. Left Panel, representative confocal images of transgenic Arabidopsis seedlings expressing AtC53-GFP or AtC53sAIM-GFP in Col-0 wild type and c53 mutant backgrounds. Four-day-old seedlings were incubated in either control or tunicamycin (10 µg/ml) containing media. Scale bars, 10 µm. Right Panel, Quantification of autophagosomes (APG) per normalized Z-stacks. Bars represent the mean (± SD) of at least 10 biological replicates. (E) HsC53 sAIM mutant does not form puncta upon ER-stress. Left Panel, Confocal images of PFA fixed C53 knockdown HeLa cells transiently expressing HsC53-GFP or HsC53sAIM-GFP (green) and mCherry-GABARAP (magenta). Cells were treated for 16 hr with 2.5 µg/ml tunicamycin (Tm). Scale bar, 10 µm. Inset scale bar, 2 µm. Representative images are shown. Right Panel, Quantification of autophagosomes (APG) per normalized cell. Bars represent the mean (± SD) of at least 10 biological replicates. Significant differences are indicated with * when p value ≤ 0.05, ** when p value ≤ 0.01, and *** when p value ≤ 0.001.
Figure 5—figure supplement 1

Biophysical characterization of sAIM mediated C53-ATG8 interaction.
(A) Isothermal titration calorimetry (ITC) experiments showing binding of At-sAIM and Hs-sAIM peptides to ATG8A and GABARAP, respectively Upper left and right panels show heat generated upon titration of At-sAIM (EPLDFDIDWDLEEEM) (600 µM) or Hs-sAIMC53 (EPLDFDIDWGLEEEM) (600 μM) to ATG8A or GABARAP (both 40 μM). Lower left and right panels show integrated heat data (■) and the fit (solid line) to a one-set-of-sites binding model using PEAQ-ITC analysis software. Representative values of KD, N, ΔH, -TΔS and ΔG from three independent ITC experiments are reported in Supplementary file 6. (B) AtC53 and HsC53 sAIM mutants do not interact with ATG8A or GABARAP, respectively. Upper Panels, GST-ATG8A or Lower Panels, GST-GABARAP were captured on the surface of the active cell (500 RU) and GST was captured on the surface of the reference cell (300 RU). The two flow cells were exposed to the ligands Upper left AtC53, Upper right AtC53sAIM, Lower Left, HsC53 and Lower right, HsC53sAIM with four sets of double consecutive injections (1st set: 10 µM ligand, running buffer; 2nd set: 10 µM ligand, 10 µM ligand; 3rd set: 10 µM ligand, 10 µM ligand + 6.4 µM AIM wt peptide; 4th set: 10 µM protein, 10 µM protein + 6.4 µM AIM mut peptide). Binding curves were obtained by subtracting the reference cell from the active cell. A representative sensorgram from two independent experiments is shown. (C) AtC53sAIM and HsC53sAIM mutants have similar secondary structure compared to AtC53 and HsC53, respectively. Upper Panel, Far-UV circular dichroism (CD) spectra of AtC53 wt (black line) and its variant AtC53sAIM (grey dashed line). Lower Panel, Far-UV circular dichroism (CD) spectra of HsC53 wt (black line) and its variant HsC53sAIM (grey dashed line). (D) Quantification of the binding affinity of AIM wt to GABARAP. GST-GABARAP fusion protein was captured on the surface of the active cell (500 RU) and GST was captured on the surface of the reference cell (300 RU). Representative sensorgrams from at least three independent experiments are shown. Left Panel, Multi-cycle kinetics experiment with increasing concentrations of the AIM wt peptide. Binding curves were obtained by double referencing (i.e. reference cell signal subtracted from active cell signal; subtraction of buffer injection). 400 nM*=Internal replicate. Center Panel, Injection of running buffer (grey) and 3600 nM AIM mut peptide (black). Right Panel, Plot of steady-state response units versus the respective concentration of the AIM wt peptide, which was used to determine the dissociation constant KD. (E) Quantification of the binding affinity of AIM wt to ATG8A. GST-ATG8A fusion protein was captured on the surface of the active cell (500 RU) and GST was captured on the surface of the reference cell (300 RU). Representative sensorgrams from at least three independent measurements are shown. Left Panel, Multi-cycle kinetics experiment with increasing concentrations of the AIM wt peptide. Binding curves were obtained by double referencing (i.e. reference cell signal subtracted from active cell signal; subtraction of buffer injection). 400 nM*=Internal replicate. Center Panel, Injection of running buffer (grey) and 3600 nM AIM mut peptide (black). Right Panel, Plot of steady-state response units versus the respective concentration of the AIM wt peptide which was used to determine the dissociation constant KD.
Figure 6
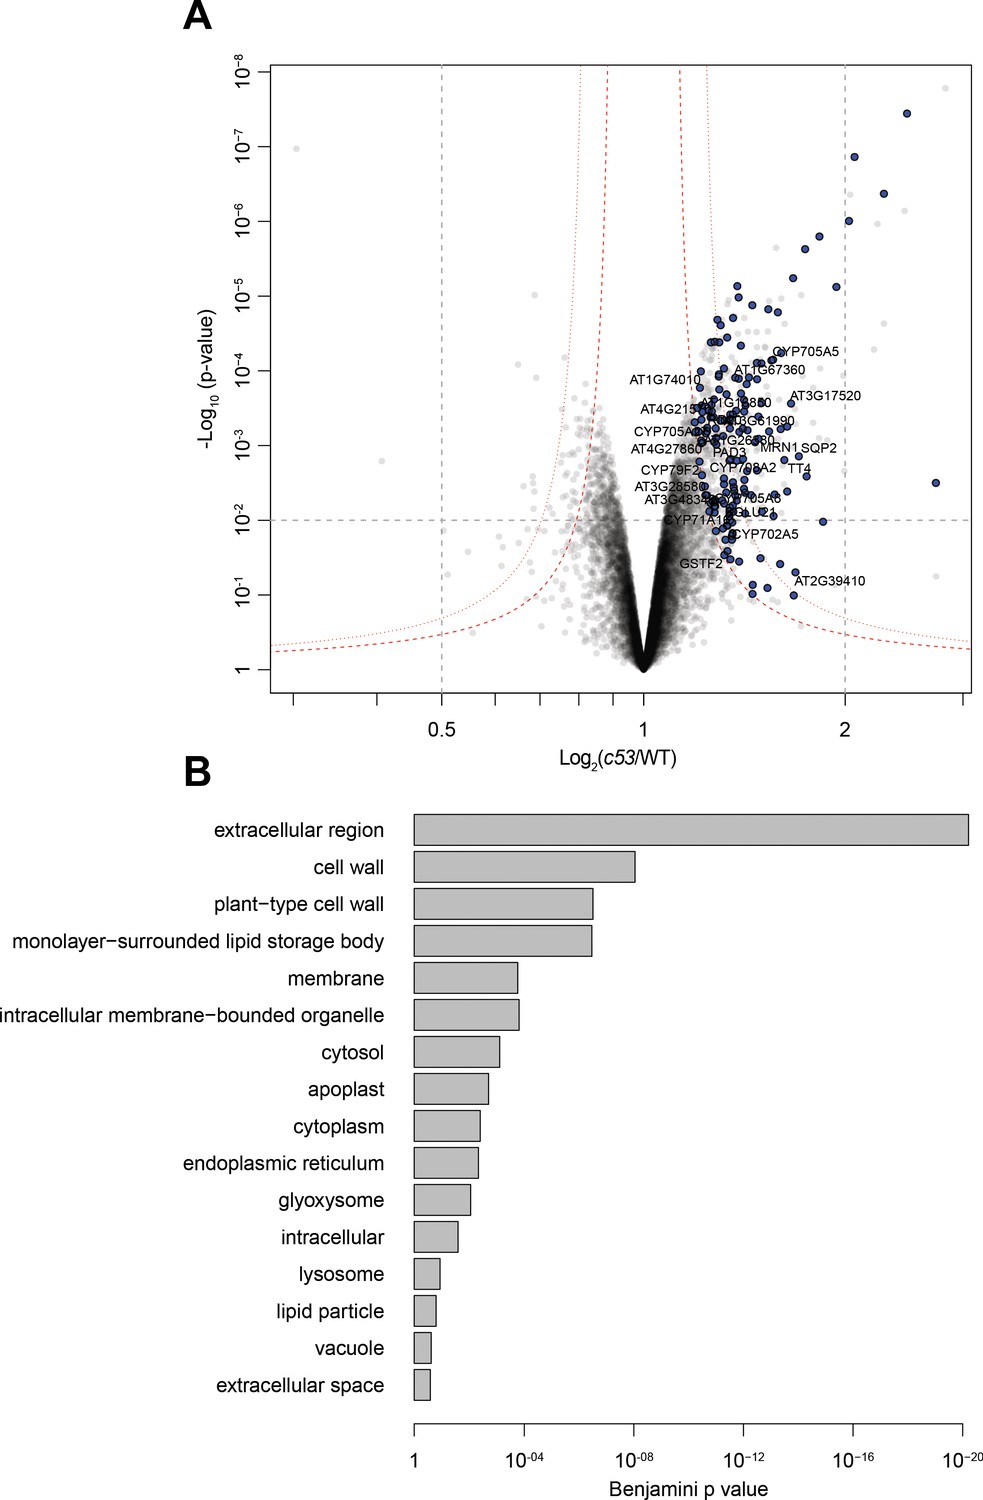
Quantitative proteomics analyses of AtC53 mediated degradation.
(A) Volcano plot showing proteins that are accumulating in Atc53 mutants Names of ER resident proteins are shown. Proteins that are labeled with blue either reside or mature at the ER. (B) GO analysis of proteins accumulating in Atc53. See Supplementary file 3 and 4 for details.
Figure 7 with 2 supplements

C53 is not activated by associating with UPR sensors.
(A) Cartoon depicting the four scenarios we tested to understand the mechanism of activation of C53. (B) AtC53 flux is enhanced in Arabidopsis UPR sensor mutants. Upper Panel, representative western blot image of autophagic flux analysis of C53 in Col-0 wild type, ire1a/b, and bzip17/28 double mutants. Seedlings were incubated in either control (Ctrl) or 1 µM concanamycin A (ConA) containing medium for 16 hr. Proteins extracted from whole seedlings were analysed by immunoblotting with anti-C53 antibody. Total proteins were analysed by Ponceau S staining. Lower Panel, Quantification of the intensities of the C53 bands normalized to the total protein level of the lysate (Ponceau S). Average C53 levels and SD for n = 6 are shown. Significant differences are indicated with * when p value ≤ 0.05, ** when p value ≤ 0.01, and *** when p value ≤ 0.001. (C) AtC53 still form puncta upon ER stress in ire1a/b and bzip28/60 double mutants. Left Panel, Confocal micrographs of autophagic flux of transgenic seedlings expressing C53-mCherry in Col-0 wild type, the ire1a/b and bzip28/60 double mutant. Seedlings were incubated in either control media or media containing 10 µg/ml tunicamycin (Tm). Representative confocal images in single plane are shown. Scale bars, 10 µm. Right Panel, Quantification of autophagosomes (APG) per normalized Z-stack. Bars represent the mean (± SD) of at least 10 biological replicates (D) AtC53 does not colocalize with IRE1-YFP during ER stress. Left Panel, Co-localization analyses of single plane confocal images obtained from transgenic Arabidopsis roots co-expressing AtC53-mCherry (magenta) and IRE1-YFP (green) in wild type Col-0 background. Four-day-old seedlings were incubated in either control or 10 µg/ml tunicamycin containing media. Scale bars, 20 µm. Inset scale bars, 2 µm. Right Panel, Pearson’s Coefficient (r) analysis of the colocalization of AtC53-mCherry and IRE1-YFP. Bars represent the mean (± SD) of at least five biological replicates (E) Chemical inhibition of IRE1 activity enhances HsC53 autophagic flux in HeLa cells. Confocal micrographs of PFA fixed HeLa cells transiently expressing HsC53-GFP. Cells were either left untreated (Control) or treated for 1 hr with 5 µM 4µ8C (IRE1 RNase activity inhibitor) or 1 µM KIRA6 (IRE1 kinase activity inhibitor). Inhibitor treatments led to the depletion of HsC53 from the nucleus and puncta formation. Scale Bar, 20 µm. Representative images are shown.
Figure 7—figure supplement 1
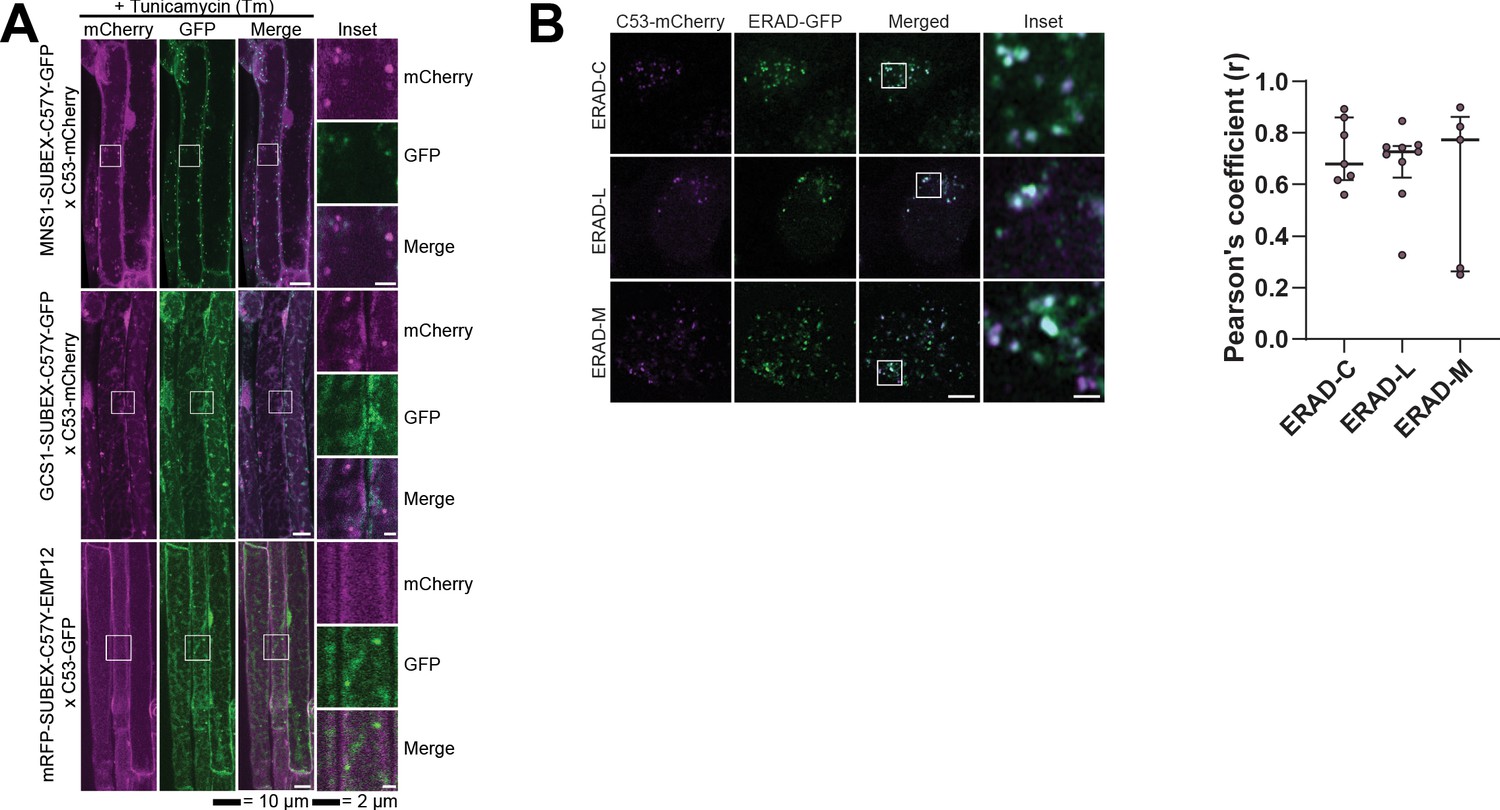
C53 is not activated by model ERAD substrates.
(A) AtC53 does not co-localize with ERAD substrates. Left Upper Panel, Colocalization analysis from confocal micrographs of C53-mCherry or C53-GFP (magenta/green) transgenic lines crossed with MNS1-SUBEX-C57Y-GFP (green), GCS1-SUBEX-C57Y-GFP (green), or mRFP-SUBEX-C57Y-EMP12 (magenta). Transgenic seedlings were incubated in either control or tunicamycin (10 µg/ml) containing media. Representative confocal images of control conditions are shown as maximum projection images to demonstrate the ER localization of the substrates. Images of tunicamycin treatments are shown in single plane. Scale bar, 10 µm. Inset scale bar, 2 µm. (B) HsC53 partially co-localizes with ERAD substrates. Left Panel, Confocal images of PFA fixed HeLa cells transiently co-expressing C53-mCherry with GFP-CFTRΔF508 (ERAD-C), A1ATNHK-GFP (ERAD-L), and INSIG1-GFP (ERAD-M). Scale Bar, 20 µm. Right Panel, Pearson’s Coefficient analysis of the co-localization.
Figure 7—figure supplement 2
C53 is activated upon ribosome stalling during co-translational protein translocation.
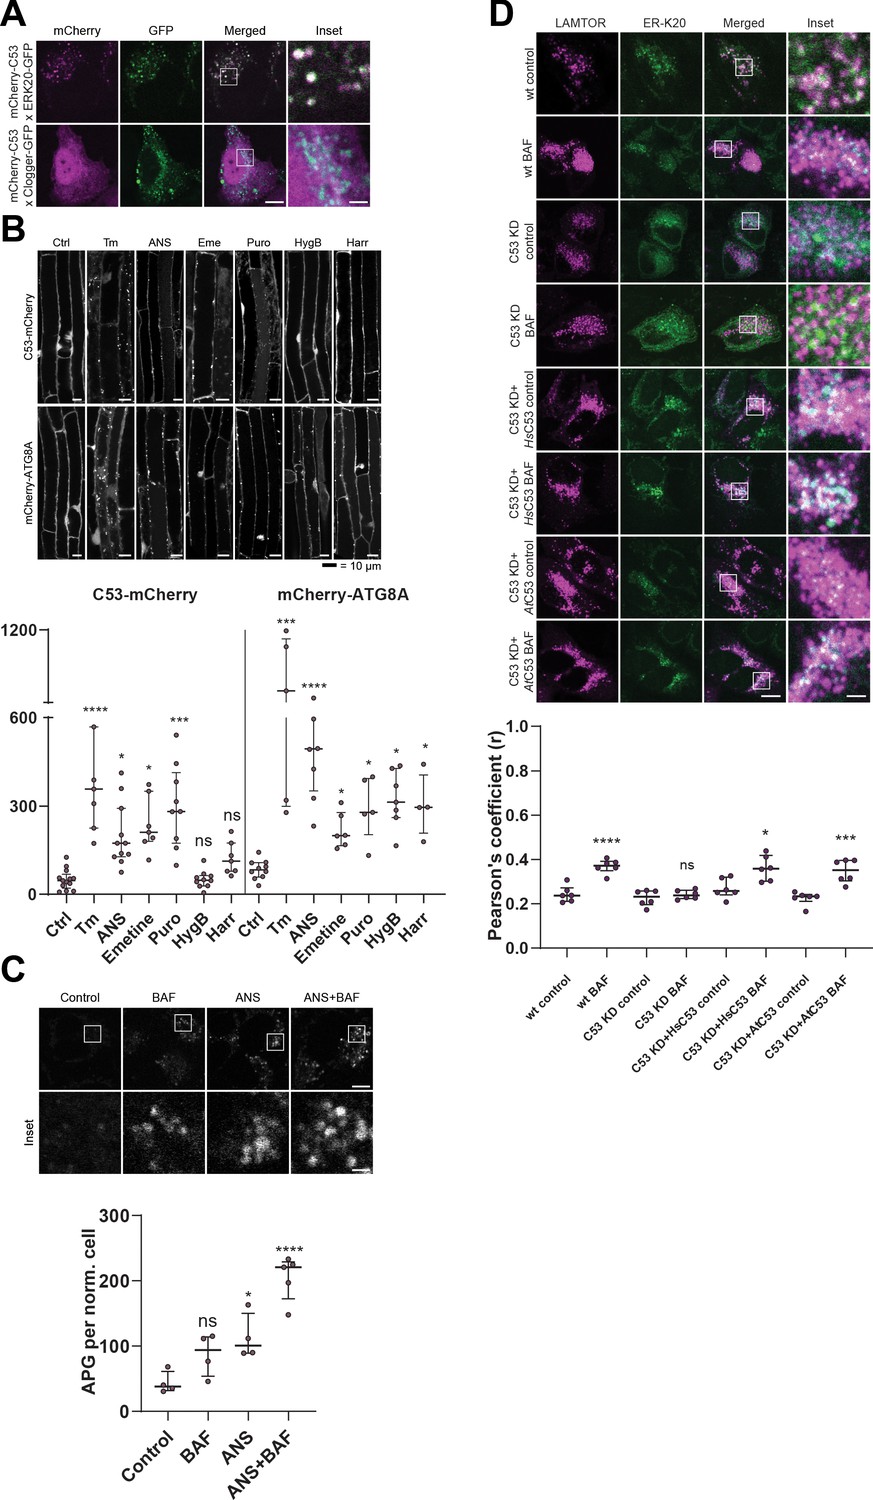
(A) HsC53 colocalize with ribosome stalling construct ER-K20. Confocal images of PFA fixed HeLa cells co-expressing ER-K20-GFP or the clogger construct with mCherry-HsC53. (B) AtC53 is specifically induced by translation elongation inhibitors. Upper Panel, Confocal micrographs of autophagic flux of transgenic seedlings expressing AtC53-mCherry and mCherry-ATG8A in Col-0 wild type. Seedlings were incubated in either control media or media containing 10 µg/ml tunicamycin (Tm), 150 µM Anisomycin (ANS), 50 µM Emetine (Eme), 50 µg/ml Puromycin (Puro), 70 µg/ml Hygromycin B (HygB) or 10 µg/ml Harringtonine (Harr). Representative confocal images in single plane are shown. Scale bars, 10 µm. Lower Panel, Quantification of autophagosomes (APG) per normalized Z-stack. Bars represent the mean (± SD) of at least 10 biological replicates. (C) HsC53 puncta are induced by anisomycin treatment. Upper Panel, Confocal images of PFA fixed HeLa cells transiently expressing C53-GFP. Cells were either left untreated or treated for 15 min with 200 nM anisomycin (ANS) and subsequently given a recovery period of 2 hr in the presence or absence of 100 nM bafilomycin A1 (BAF). Scale Bar, 20 µm. Lower Panel, Quantification of C53 puncta. (D) HsC53 mediates degradation of the ribosome stalling construct ER-K20. Upper Panel, Confocal images of PFA fixed HeLa cells transiently expressing ER_K20-GFP (green) and miRFP-LAMTOR1 (magenta). HsC53 knock down (KD) cells were complemented with HsC53 or AtC53. Cells were either left untreated or treated for 2 hr with 100 nM bafilomycin A1 (BAF). Scale Bar, 20 µm. Representative images are shown. Lower Panel: Quantification of the colocalization of Lamtor1 with ER-K20 in knock down and complemented cells.
Figure 8 with 2 supplements

C53 forms a heteromeric receptor complex with UFL1 and DDRGK1.
(A) AtUFL1 interacts with AtC53 and AtDDRGK1. Bacterial lysates containing recombinant protein were mixed and pulled down with glutathione magnetic agarose beads. Input and bound proteins were visualized by immunoblotting with anti-GST and anti-Strep antibodies. Red asterisks indicate endogenous E. coli biotinylated proteins. (B) AtC53 associates with AtUFL1 and AtDDRGK1. In vivo co-immunoprecipitation of UFL1-GFP or DDRGK1-GFP expressing Arabidopsis seedlings incubated in either control (Ctrl) or 10 µg/ml tunicamycin (Tm) containing media. (C) AtDDRGK1 and AtUFL1 colocalize with AtC53 puncta upon ER stress induction. Upper Panel, Co-localization analyses of confocal micrographs of wild type Col-0 roots co-expressing AtC53-mCherry (magenta) with DDRGK1-GFP, UFL1-GFP, or GFP-HDEL (green). Transgenic seedlings were incubated in either control or tunicamycin (10 µg/ml) containing media. Representative confocal images of control conditions are shown in maximum projection to emphasize ER association. Images of tunicamycin treatments are shown in single plane. Scale bars, 10 µm. Inset scale bars, 2 µm. Lower Panel, Pearson’s Coefficient colocalization analysis per normalized Z-scan. Bars represent the mean (± SD) of 5 biological replicates. (D) DDRGK1 and UFL1 undergo vacuolar degradation upon ER stress induction. Quantification of confocal micrographs of autophagic flux of UFL1-GFP and DDRGK1-GFP. Seedlings were incubated in either control, 10 µg/ml tunicamycin (Tm), or 10 µg/ml tunicamycin with 1 µM Concanamycin A (Tm+ConA) media. Quantification of autophagosomes (APG) per normalized Z-stacks of UFL1-GFP and DDRGK1-GFP. Bars represent the mean (± SD) of at least 10 biological replicates. (E) AtC53 vacuolar degradation requires DDRGK1 and UFL1. Quantification of confocal images of wild type (Col-0), ufl1, and ddrgk1 Arabidopsis seedlings expressing AtC53-mCherry. Six-day-old seedlings were incubated in either control (Ctrl) or 10 µg/ml tunicamycin (Tm) containing media. Scale bars, 20 µm. Quantification of autophagosomes (APG) per normalized Z-stacks. Bars represent the mean (± SD) of at least 10 biological replicates. Significant differences compared to control treatment (Ctrl) are indicated with * when p value ≤ 0.05, ** when p value ≤ 0.01, and *** when p value ≤ 0.001.
Figure 8—figure supplement 1

C53, DDRGK1, and UFL1 form a heteromeric receptor complex.
(A) HsUFL1 interacts with HsC53 and HsDDRGK1. Bacterial lysates containing recombinant protein were mixed and pulled down with glutathione magnetic agarose beads. Input and bound proteins were visualized by immunoblotting with anti-GST and anti-MBP antibodies. (B) Pairwise yeast two hybrid analysis of Arabidopsis thaliana UFL1, C53, DDRGK1, and ATG8A. Combinations of pGADT7 (prey vector) and pGBKT7 (bait vector) vectors carrying the indicated genes were transformed in yeast. After mating, yeast was selected for growth on (SD)-Leu /- Trp, (SD)-Leu /- Trp /- His and (SD)-Leu /- Trp /- His/-Ade plates (displayed). Split GFP was used as a positive control. (C, D) DDRGK1 and UFL1 undergo vacuolar degradation upon ER stress. (C) Confocal micrographs of transgenic seeds expressing UFL1-GFP and DDRGK1-GFP. Seedlings were incubated in either control, 10 µg/ml tunicamycin (Tm) or 10 µg/ml tunicamycin and 1 µM concanamycin A (Tm+ConA). Representative confocal images in single plane are shown. Scale bars, 10 µm. Inset scale bars, 2 µm. (D) Representative western blots of UFL1-GFP and DDRGK1-GFP upon ER stress treatments. Seedlings were incubated in either control, 10 µg/ml tunicamycin (Tm) or 10 µg/ml tunicamycin with 1 µM concanamycin A (Tm+ConA). Protein extracts from whole seedlings were analysed by immunoblotting with anti-GFP. Total proteins were analyzed by Ponceau S staining. (E) AtC53 puncta formation requires UFL1 and DDRGK1. Representative confocal images of wildtype (Col-0), ufl1, and ddrgk1 Arabidopsis seedlings. Six-day-old seedlings were incubated in either control (Ctrl) or 10 µg/ml tunicamycin (Tm) containing media. In contrast to wild type, AtC53 did not form puncta in DDRGK1 and UFL1 mutants. For quantification, see Figure 8E. (F) C53 flux requires a functional ufmylation machinery. Autophagic flux analysis of endogenous AtC53 using AtC53 antibody. Wild type (Col-0) or mutant seedlings were incubated in control media or media containing 10 µg/ml tunicamycin (Tm). Representative Western blots are displayed. (G) Validation of UFM1 antibody used in 3 g. S1 and S2 correspond to ufmylated RPL26 bands.
Figure 8—figure supplement 2
AtC53 mediates autophagic degradation of DDRGK1.
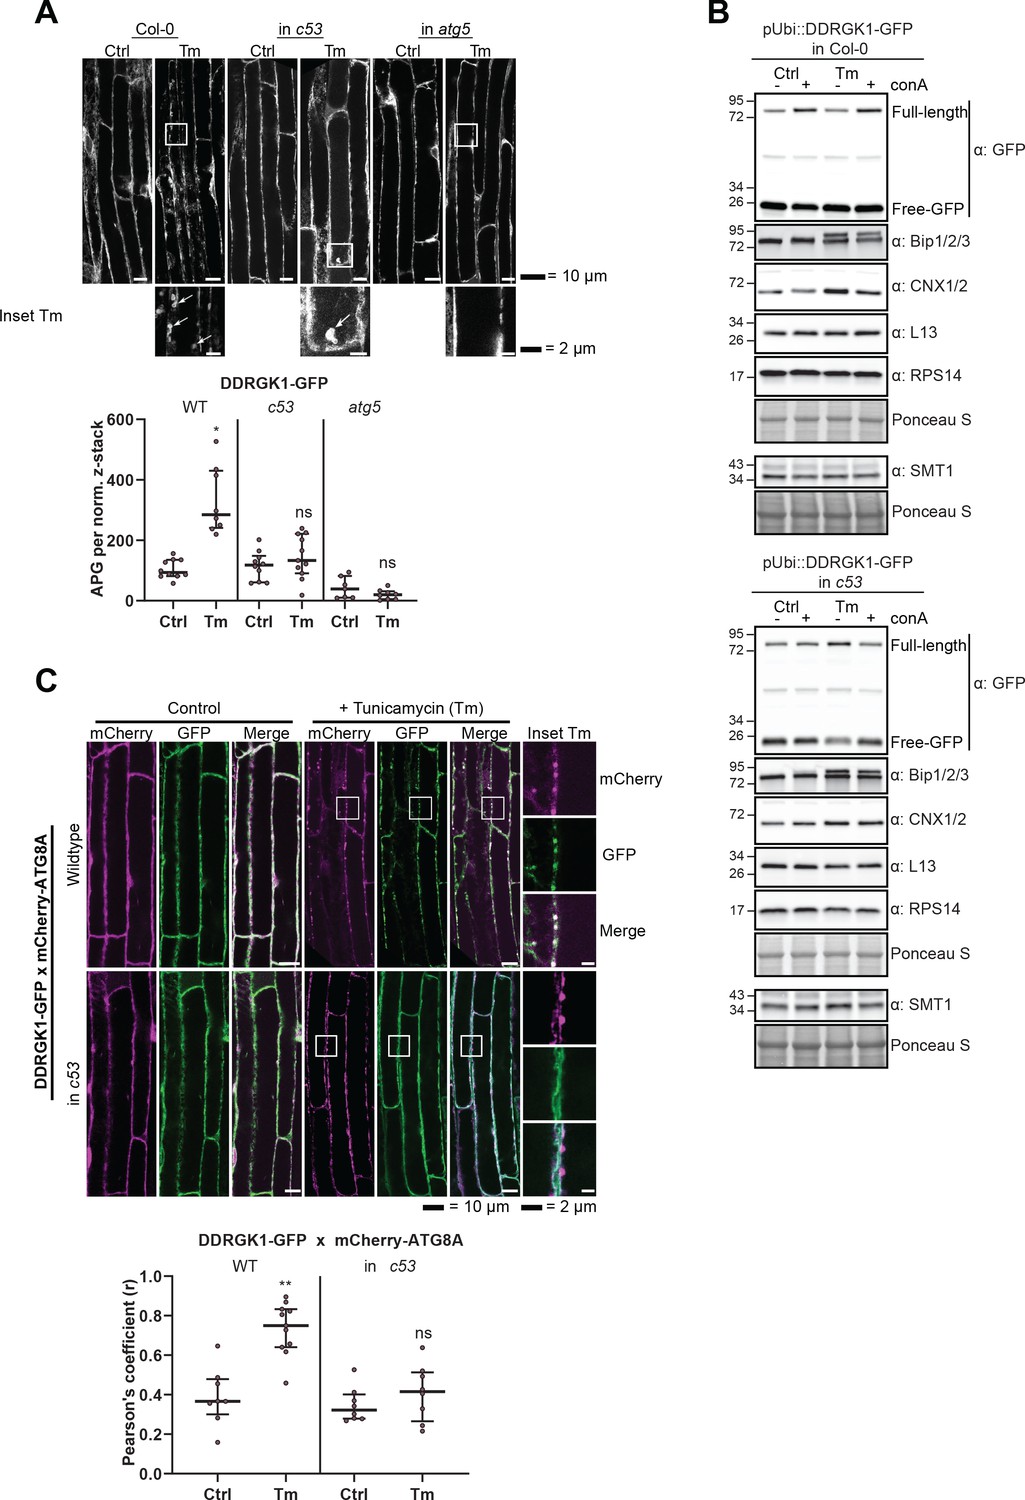
(A) AtDDRGK1-GFP forms autophagic puncta upon ER stress, and this depends on C53 and ATG5. Upper Panel, representative confocal images of transgenic Arabidopsis seedling root cells expressing AtDDRGK1-GFP in Col-0 wild type, c53 and atg5 mutant backgrounds. Five-day-old seedlings were incubated in either control or tunicamycin (10 µg/ml) containing media. Representative confocal images in single plane are shown Scale bars, 10 µm. Lower Panel, Quantification of the autophagosomes (APG) per normalized Z-stacks. Bars represent the mean (± SD) of at least seven biological replicates. (B) AtC53 mediates autophagic degradation of AtDDRGK1, but not ER localized enzyme SMT1, ribosomal subunits or ER localized chaperones. Autophagic flux analysis of transgenic pUbi::AtDDRGK1-GFP wild type (upper panel) and pUbi::AtDDRGK-GFP in c53 mutant background (lower panel) seedlings. Transgenic seedlings were incubated in control media or 10 µg/ml tunicamycin (Tm). In addition, each treatment was supplied with 1 µm concanamycin A (conA) to visualize vacuolar degradation. Autophagic flux analysis of endogenous ER-chaperones Calnexin 1/2 (CNX) and Bip1/2/3, using Bip1/2/3 and CNX1/2, respectively. Ribosomal proteins 60S (L13) and 40S (RPS14) and ER-transmembrane protein Sterol Methyltransferase 1 (SMT1) were detected with same samples. (C) AtDDRGK1-GFP co-localize with mCherry-ATG8A labelled autophagosomes during ER stress in an AtC53 dependent manner. Upper Panel, Co-localization analyses of single plane confocal images obtained from transgenic Arabidopsis roots co-expressing AtDDRGK1-GFP (green) with mCherry-ATG8A (magenta) in wild type Col-0 or c53 mutant background. Four-day-old seedlings were incubated in either control or 10 µg/ml tunicamycin containing media. Scale bars, 20 µm. Inset scale bars, 2 µm. Lower Panel, Pearson’s Coefficient (r) analysis of the colocalization of AtDDRGK1-GFP with mCherry-ATG8A. Bars represent the mean (± SD) of at least five biological replicates.
Figure 9
C53 autophagic flux is activated by depletion of UFM1 during ER stress.
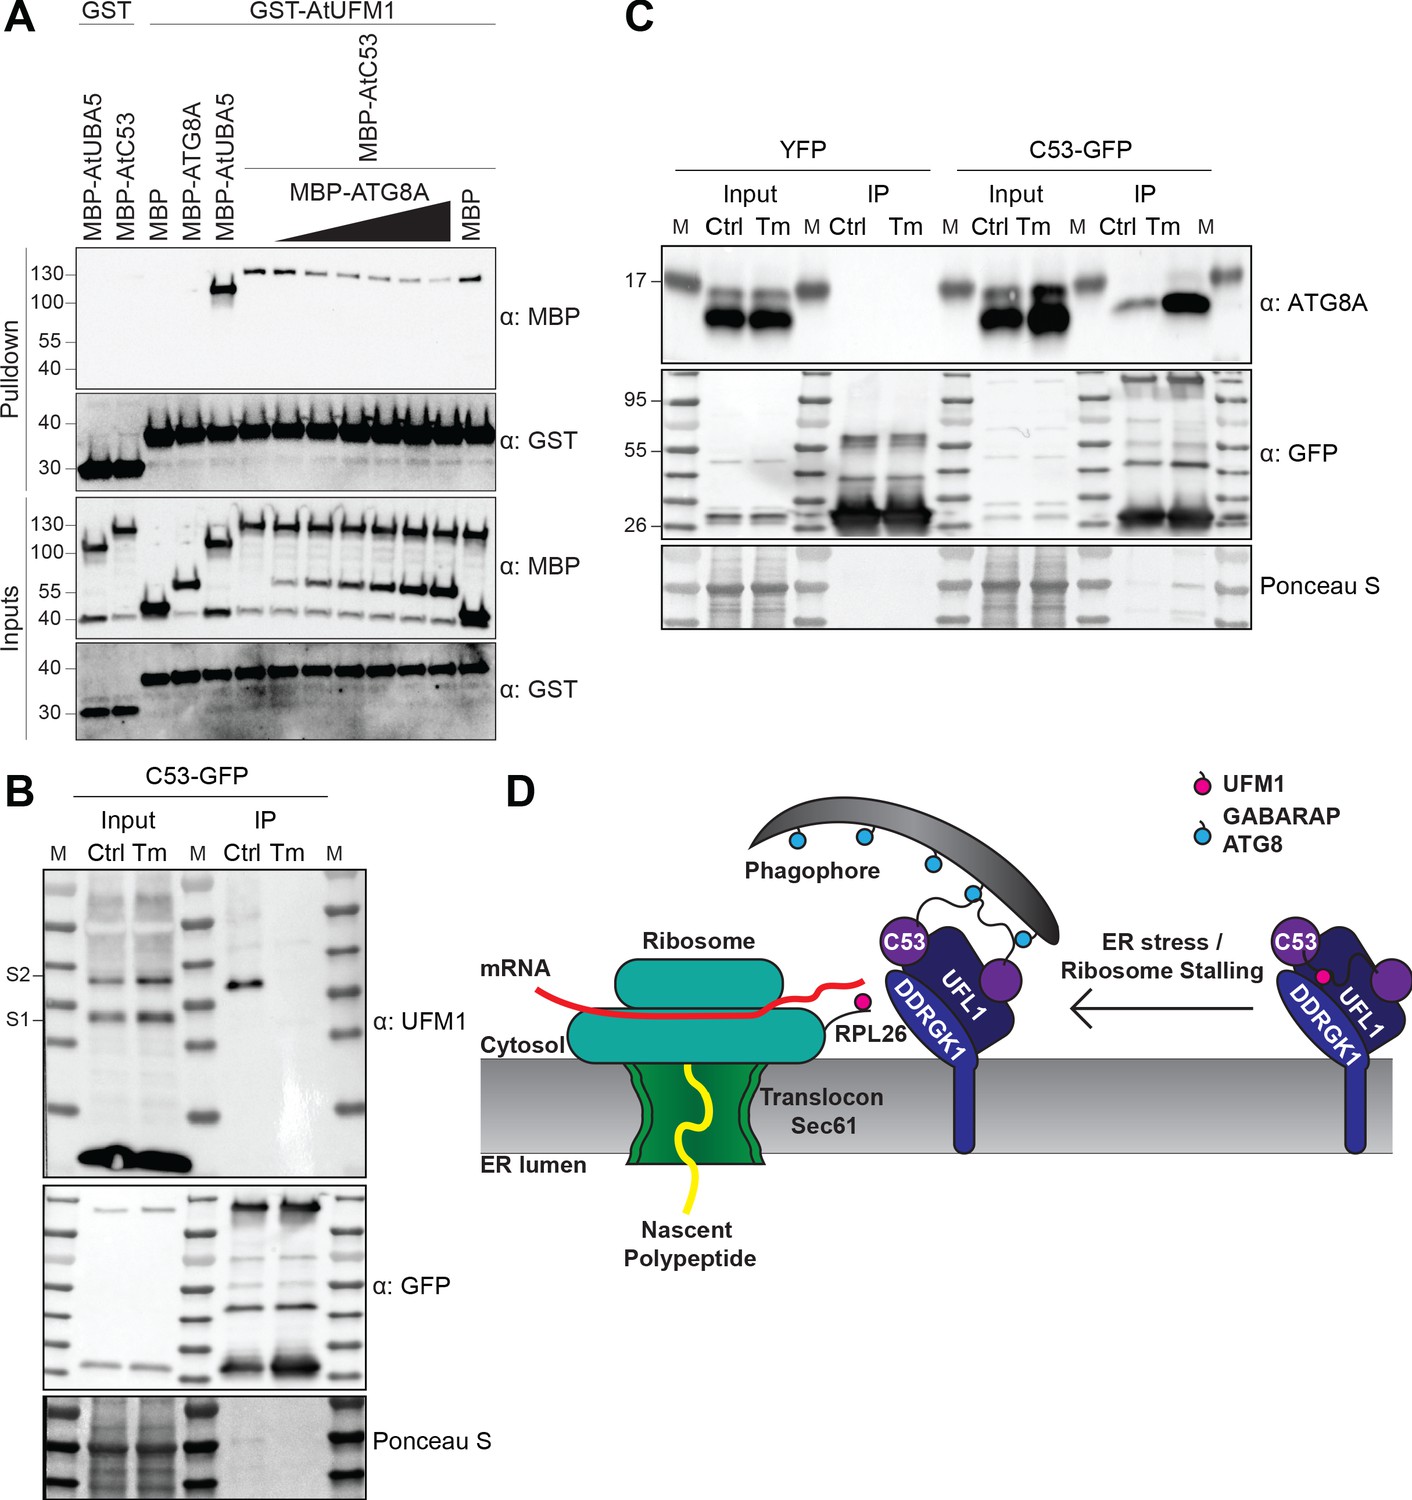
(A) AtC53 directly interacts with UFM1 and this interaction becomes weaker upon increasing concentrations of ATG8A. Bacterial lysates containing recombinant protein were mixed and pulled down with glutathione magnetic agarose beads. Input and bound proteins were visualized by immunoblotting with anti-GST and anti-MBP antibodies. The red asterisk indicates MBP-ATG8A. (B) AtC53-ATG8 association becomes stronger upon ER stress induction triggered by tunicamycin. In vivo co-immunoprecipitation of extracts of Arabidopsis seedlings expressing AtC53-GFP incubated in either control (Ctrl) or 10 µg/ml tunicamycin (Tm) containing media. (C) AtC53-UFM1 association becomes weaker upon ER stress induction triggered by tunicamycin. In vivo pull downs of extracts of Arabidopsis seedlings expressing C53-GFP incubated in either control (Ctrl) or 10 µg/ml tunicamycin (Tm) containing media. Input and bound proteins were visualized by immunoblotting with the indicated antibodies. (D) Current working model of the C53 receptor complex. Upon ribosome stalling, UFM1 is transferred from the C53 receptor complex to the tail of RPL26, exposing the sAIMs on C53 for ATG8 binding and subsequent recruitment to the autophagosomes.
Figure 10 with 1 supplement
C53 is crucial for ER stress tolerance.
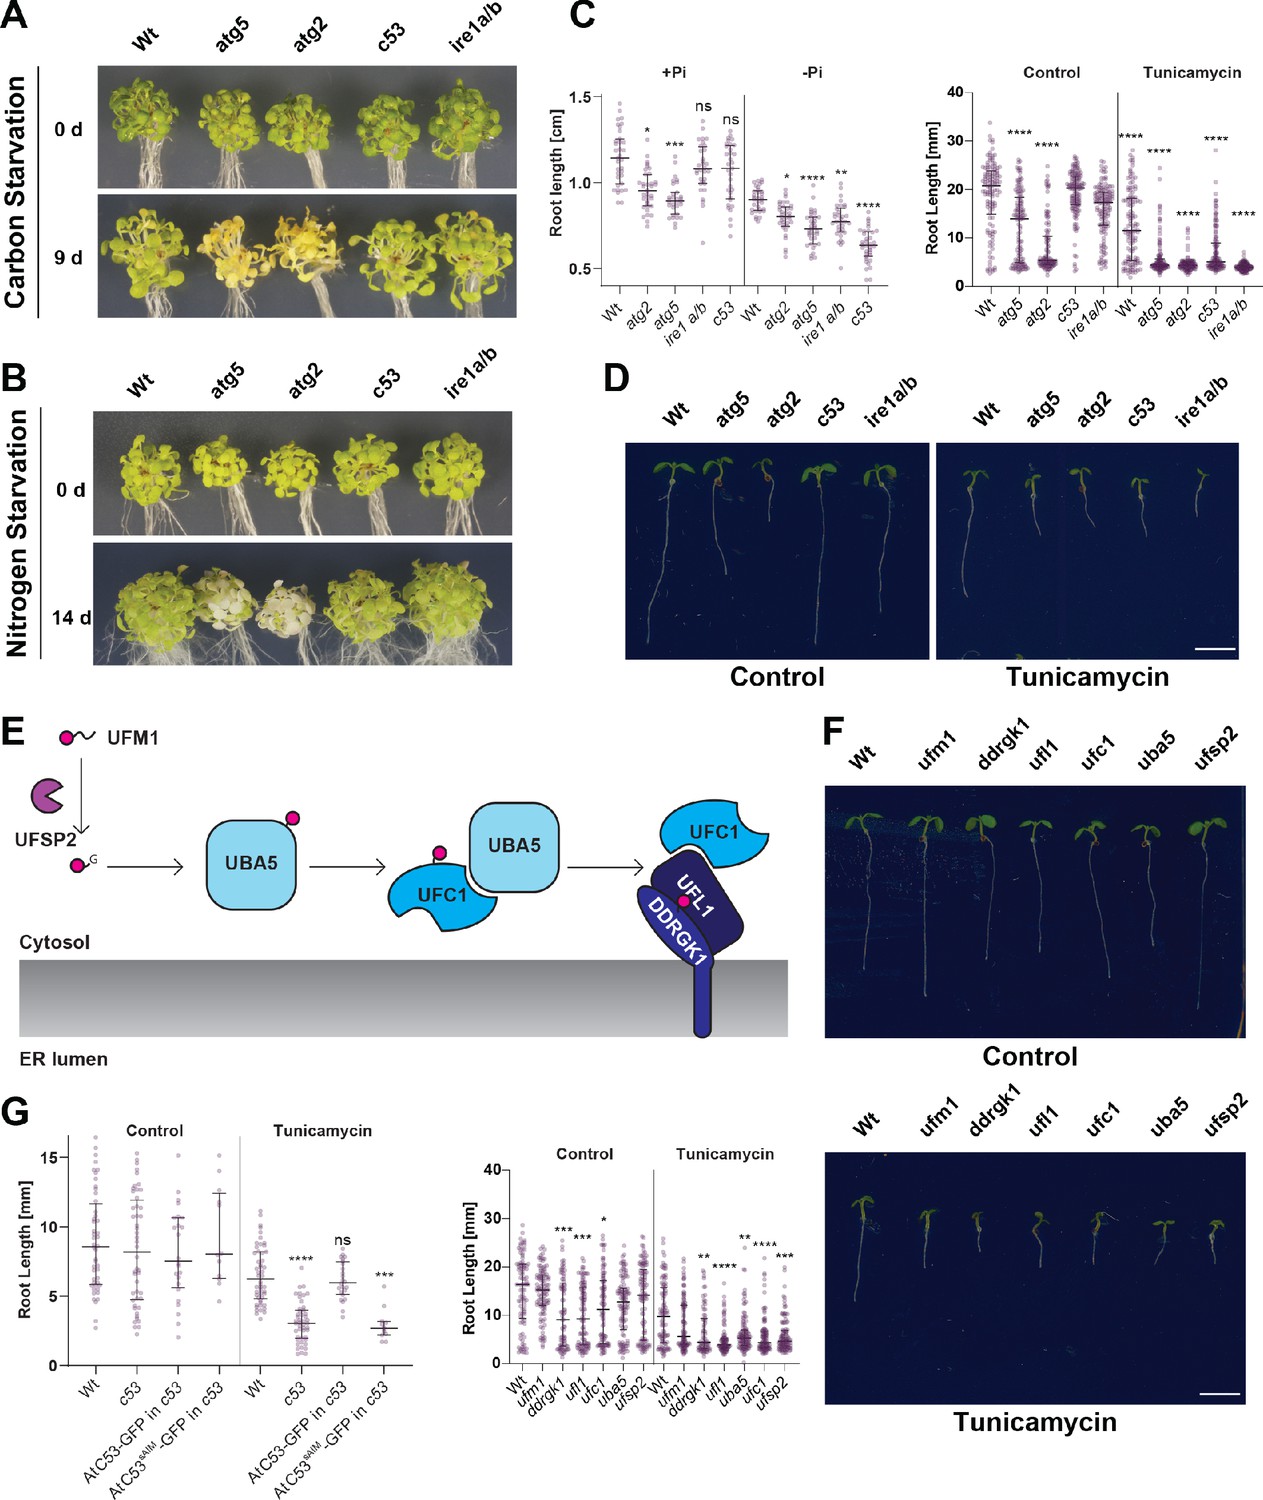
(A) Atc53 mutant is insensitive to carbon starvation. Phenotypes before (0 d) and after 9 days carbon starvation (9 d) of 7-day-old seedlings, n ≥ 20 seedlings per genotype. (B) Atc53 mutant is insensitive to nitrogen starvation. Phenotypes before (0 d) and after 14 days nitrogen starvation (14 d) of 7-day-old seedlings, n ≥ 20 seedlings per genotype. (C) Atc53 mutant is sensitive to phosphate starvation. Root-length quantification of seven-day-old seedlings which were transferred to media with or without Pi supplement (+Pi, -Pi), and imaged after 2 days. (D) Atc53 mutants are sensitive to ER stress induced by tunicamycin. Root-length quantification of 7-day-old seedlings grown on half strength MS media without sucrose treated with 100 ng/mL tunicamycin (Tm). Bottom Panel, Root-length quantification of 7-day-old seedlings. n≈125 seedlings per genotype and treatment. Left Panel, Example of 7-day-old seedlings grown in described conditions. Scale bars = 5 mm. Left, non-treated seedlings. Right, seedlings grown at 100 ng/mL Tm. Right Panel, Root length of each genotype was compared pairwise with the wild type (Col-0) for each specific treatment condition. (E) Main molecular players in the ufmylation pathway. UFSP2: UFM1-specific protease two that matures UFM1, exposing the terminal glycine residue. UBA5: the E1 activating enzyme, UFC1: E2 conjugating enzyme, UFL1: E3 ligase (F) Ufmylation pathway mutants are sensitive to ER stress triggered by tunicamycin. Root length quantification of 7-day-old seedlings grown on half strength MS media without sucrose treated with 100 ng/mL tunicamycin (Tm). Left panel, Root length quantification of 7-day-old seedlings. n≈100 seedlings per genotype and treatment. Right Panel, Representative images of 7-day-old seedlings grown in described conditions. Scale bars, 5 mm. To the left are non-treated seedlings, to the right are seedlings grown at 100 ng/mL Tm. (G) AtC53sAIM mutant does not complement tunicamycin sensitivity phenotype. Root length quantification of indicated 7-day-old seedlings grown on half strength MS media without sucrose in control conditions (Ctrl) or treated with 100 ng/mL tunicamycin (Tm). T1 transgenic lines were used. n = 12 seedlings per genotype and treatment. Data represent the median with its interquartile range. Root length of each genotype was compared pairwise with the wild type (Col-0) for each treatment condition. Significant differences compared to control treatment (Ctrl) are indicated with * when p value ≤ 0.05, ** when p value ≤ 0.01, and *** when p value ≤ 0.001.
Figure 10—figure supplement 1
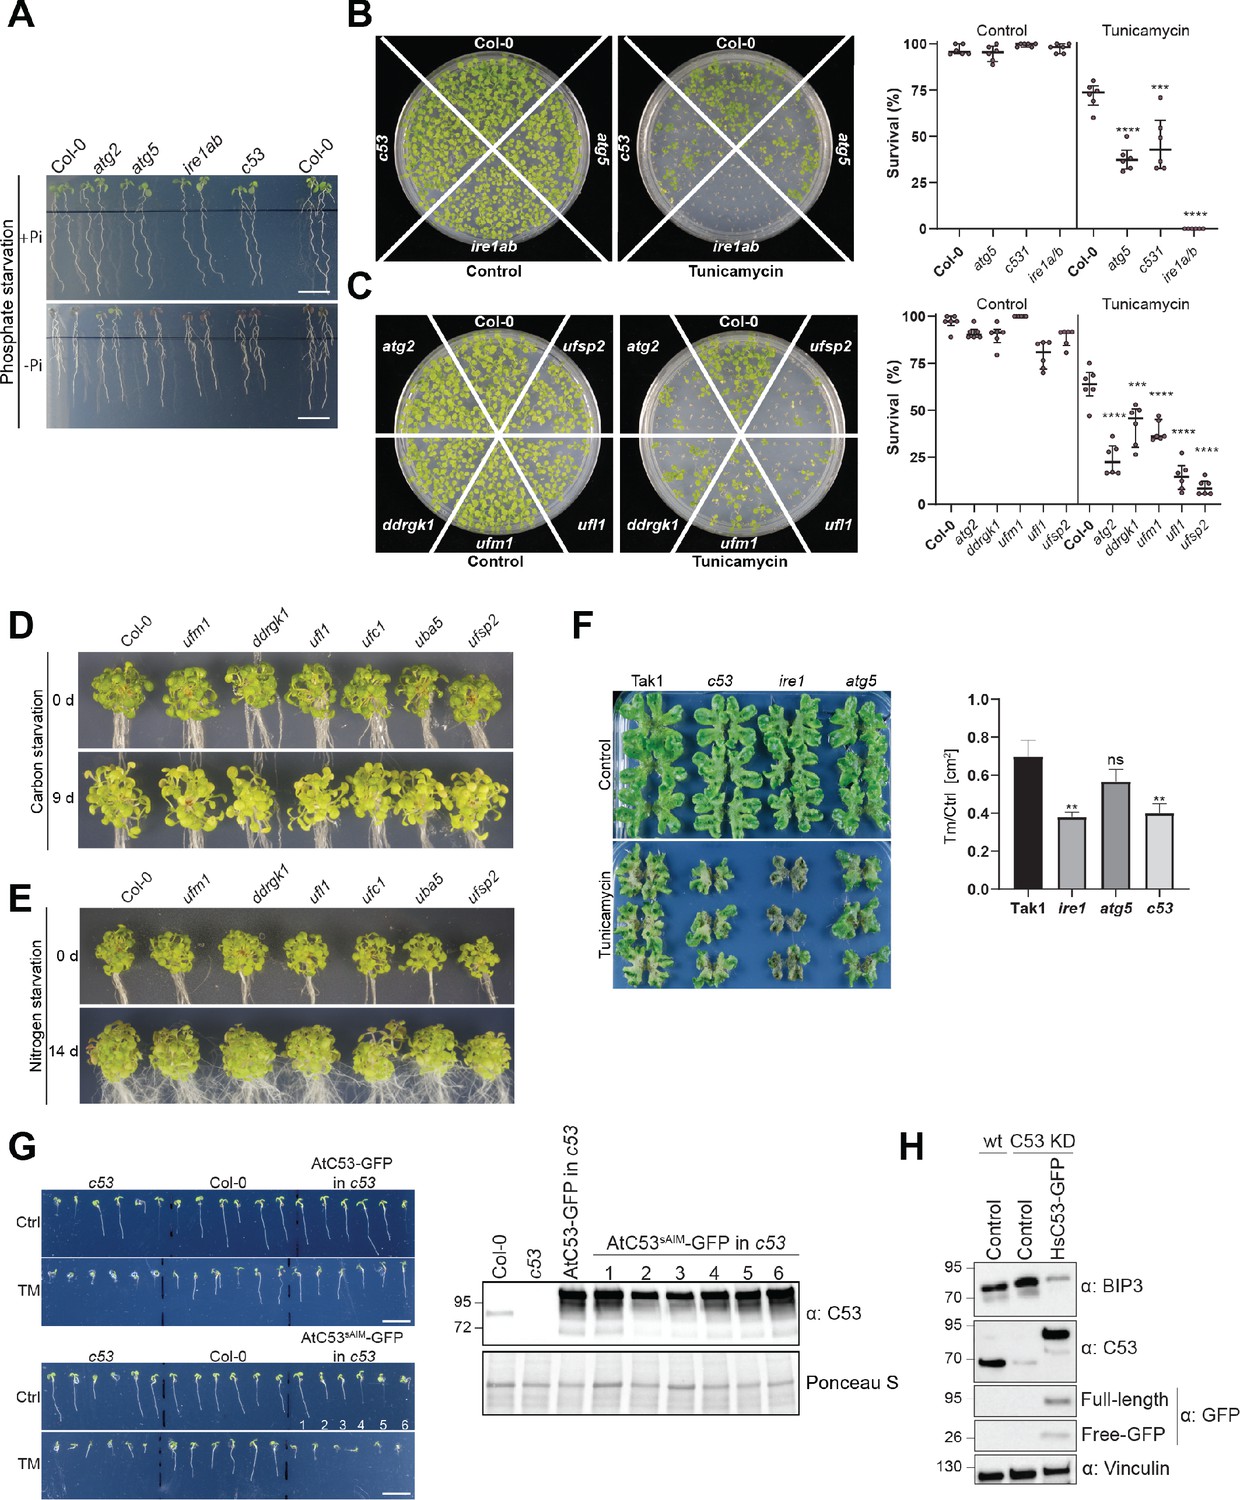
C53 and the UFMylation machinery are essential for ER stress tolerance.
(A) Atc53 mutant is sensitive to phosphate starvation. Seedlings were germinated for 5 days on +Pi media prior to transfer for 2 days to medium supplemented with or without Pi (-Pi, +Pi) and imaged after 2 days (Naumann et al., 2019). See Figure 10c for quantification. Scale bars, 1 cm. (B, C) Atc53 and UFMylation pathway mutants display lower survival on tunicamycin-containing plates. Seedlings were grown on control or 150 ng/mL tunicamycin containing half-strength MS media for two weeks and were evaluated for survival. Left Panel shows an example of the plates. Right Panel, Quantification of living and dead seedlings. Data represents six plates with 4 × 36 seedlings (n = 216). Survival percentage was compared pairwise to the survival of the wildtype (Col-0). Data represent the median with its interquartile range. (D, E) Ufmylation mutants are insensitive to carbon and nitrogen starvation. (D) Phenotypes before (0 d) and after 9 days carbon starvation (9 d). n ≥ 25. Seven-day-old seedlings per genotype were used. (E) Phenotypes before (0 d) and after 14 days nitrogen starvation (14 d). n ≥ 25. Seven-day-old seedlings per genotype were used. (F) Marchantia polymorpha c53 mutants are sensitive to tunicamycin. 14-day-old plants were transferred to control or 2 µg/ml tunicamycin containing agar plates. Right Panel, Quantification of the plant area 21 days after transfer. Data shown as mean ± SD. (G) The AtC53sAIM mutant does not complement tunicamycin sensitivity phenotype. Left Panel, Representative images of 7-day-old seedlings grown on half strength MS media without sucrose in control conditions (Ctrl) or treated with 100 ng/mL tunicamycin (Tm). At least 10 independent T1 transgenic lines were analyzed to measure the root lengths. See Figure 10g for quantification. Significant differences compared to control treatment (Ctrl) are indicated with * when p value ≤ 0.05, ** when p value ≤ 0.01, and *** when p value ≤ 0.001. Right Panel, western blot analyses of AtC53 complementation lines showing expression of the tested constructs used in Figure 10G. (H) Knockdown of C53 leads to increased BiP3 chaperone levels. Knock down and complementation assays showing C53 function is important for ER stress tolerance in HeLa cells.
Tables
Appendix 1—key resources table
| Reagent type (species) or resource | Designation | Source or reference | Identifiers | Additional information |
|---|---|---|---|---|
| Genetic reagent (Arabidopsis thaliana) | Col-0 | |||
| Genetic reagent (Marchantia Polymorpha) | Tak-1 | |||
| Cell line (Homo sapiens) | HeLa-Kyoto | Fumiyo Ikeda | See Affiliations | |
| Cell line (Homo sapiens) | HEK293T | Fumiyo Ikeda | See Affiliations | |
| Genetic reagent (Arabidopsis thaliana) | c53 | this study | At5g06830 | See Methods, CRISPR/Cas9 construct design. Available on request to the corresponding authors. |
| Genetic reagent (Arabidopsis thaliana) | ddrgk1 | this study | At4g27120 | See Methods, CRISPR/Cas9 construct design. Available on request to the corresponding authors. |
| Genetic reagent (Arabidopsis thaliana) | ufm1 | this study | At1g77710 | See Methods, CRISPR/Cas9 construct design. Available on request to the corresponding authors. |
| Genetic reagent (Arabidopsis thaliana) | atg2 | Morten Peterson Wang et al. Plant Journal (2011) | At3g19190 | EMS-mutant (Gln803stop) |
| Genetic reagent (Arabidopsis thaliana) | atg5 | NASC (N39993) Scholl et al. Plant Phys. (2000) | At5g17290 | SAIL_129B07 |
| Genetic reagent (Arabidopsis thaliana) | ufl1 | NASC (N685434) et al. Plant Phys. (2000) | At3g46220 | SALK_022517C |
| Genetic reagent (Arabidopsis thaliana) | uba5 | NASC (N634012) Scholl et al. Plant Phys. (2000) | At1g05350 | SALK_134012 |
| Genetic reagent (Arabidopsis thaliana) | ufsp2 | NASC (N826004) Scholl et al. Plant Phys. (2000) | At3g48380 | SAIL_607_G10 |
| Genetic reagent (Arabidopsis thaliana) | ufc1 | NASC (N678973) Scholl et al. Plant Phys. (2000) | At1g27530 | SALK_112532 |
| Genetic reagent (Arabidopsis thaliana) | ire1a/b | Karolina Pajerowska-Mukhtar McCormack et al. Front. in plant sci. (2015) | At2G17520/ At5G24360 | SALK_018112/SAIL_238_F07 |
| Genetic reagent (Arabidopsis thaliana) | bzip 17/28 | Kazuo Shinozaki Kim et al. Plant Phys. (2018) | At2g40950/At3 g10800 | SALK_104326/SALK_132285 |
| Genetic reagent (Arabidopsis thaliana) | bzip28/60 | Kazuo Shinozaki Kim et al. Plant Phys. (2018) | At3g10800/At1 g42990 | SALK_132285/SALK_050203 |
| Genetic reagent (Arabidopsis thaliana) | pUbi::mCherry-ATG8A | This study | See Methods, Plant materials and Growth conditions. Available on request to the corresponding authors. | |
| Genetic reagent (Arabidopsis thaliana) | pUbi::mCherry-ATG8E | Liwen Jiang Hu et al. J. Integr. Plant Biol. (2020) | ||
| Genetic reagent (Arabidopsis thaliana) | pUbi::mCherry-ATG8E x atg5 | this study | See Methods, Plant materials and Growth conditions. Available on request to the corresponding authors. | |
| Genetic reagent (Arabidopsis thaliana) | pUbi::GFP-ATG8A | this study | See Methods, Plant materials and Growth conditions. Available on request to the corresponding authors. | |
| Genetic reagent (Arabidopsis thaliana) | pUbi::GFP-ATG8B | this study | See Methods, Plant materials and Growth conditions. Available on request to the corresponding authors. | |
| Genetic reagent (Arabidopsis thaliana) | pUbi::GFP-ATG8C | this study | See Methods, Plant materials and Growth conditions. Available on request to the corresponding authors. | |
| Genetic reagent (Arabidopsis thaliana) | pUbi::GFP-ATG8D | this study | See Methods, Plant materials and Growth conditions. Available on request to the corresponding authors. | |
| Genetic reagent (Arabidopsis thaliana) | pUbi::GFP-ATG8E | this study | See Methods, Plant materials and Growth conditions. Available on request to the corresponding authors. | |
| Genetic reagent (Arabidopsis thaliana) | pUbi::GFP-ATG8F | this study | See Methods, Plant materials and Growth conditions. Available on request to the corresponding authors. | |
| Genetic reagent (Arabidopsis thaliana) | pUbi::GFP-ATG8G | this study | See Methods, Plant materials and Growth conditions. Available on request to the corresponding authors. | |
| Genetic reagent (Arabidopsis thaliana) | pUbi::GFP-ATG8H | this study | See Methods, Plant materials and Growth conditions. Available on request to the corresponding authors. | |
| Genetic reagent (Arabidopsis thaliana) | pUbi::GFP-ATG8I | this study | See Methods, Plant materials and Growth conditions. Available on request to the corresponding authors. | |
| Genetic reagent (Arabidopsis thaliana) | pUbi::C53-mCherry | this study | See Methods, Plant materials and Growth conditions. Available on request to the corresponding authors. | |
| Genetic reagent (Arabidopsis thaliana) | pUbi::C53-mCherry x atg2 | this study | See Methods, Plant materials and Growth conditions. Available on request to the corresponding authors. | |
| Genetic reagent (Arabidopsis thaliana) | pUbi::C53-mCherry x atg5 | this study | See Methods, Plant materials and Growth conditions. Available on request to the corresponding authors. | |
| Genetic reagent (Arabidopsis thaliana) | pUbi::C53-mCherry x ufl1 | this study | See Methods, Plant materials and Growth conditions. Available on request to the corresponding authors. | |
| Genetic reagent (Arabidopsis thaliana) | pUbi::C53-mCherry x ddrgk1 | this study | See Methods, Plant materials and Growth conditions. Available on request to the corresponding authors. | |
| Genetic reagent (Arabidopsis thaliana) | pUbi::C53-mCherry x ire1a/b | this study | See Methods, Plant materials and Growth conditions. Available on request to the corresponding authors. | |
| Genetic reagent (Arabidopsis thaliana) | pUbi::C53-mCherry x bzip28/60 | this study | See Methods, Plant materials and Growth conditions. Available on request to the corresponding authors. | |
| Genetic reagent (Arabidopsis thaliana) | pUbi::C53-mCherry x pUbi::GFP-ATG8A | this study | See Methods, Plant materials and Growth conditions. Available on request to the corresponding authors. | |
| Genetic reagent (Arabidopsis thaliana) | pUbi::C53-mCherry x wave-YFP | this study | See Methods, Plant materials and Growth conditions. Available on request to the corresponding authors. | |
| Genetic reagent (Arabidopsis thaliana) | pUbi::C53-mCherry x p35S::GFP-HDEL | this study | See Methods, Plant materials and Growth conditions. Available on request to the corresponding authors. | |
| Genetic reagent (Arabidopsis thaliana) | pUbi::C53-mCherry x p35S::GFP-ATG11 | this study | See Methods, Plant materials and Growth conditions. Available on request to the corresponding authors. | |
| Genetic reagent (Arabidopsis thaliana) | pUbi::C53-mCherry x p35S::GFP-ATG11 | this study | See Methods, Plant materials and Growth conditions. Available on request to the corresponding authors. | |
| Genetic reagent (Arabidopsis thaliana) | pUbi::C53-mCherry x pUbi::UFL1-GFP | this study | See Methods, Plant materials and Growth conditions. Available on request to the corresponding authors. | |
| Genetic reagent (Arabidopsis thaliana) | pUbi::C53-mCherry x pUbi::DDRGK1-GFP | this study | See Methods, Plant materials and Growth conditions. Available on request to the corresponding authors. | |
| Genetic reagent (Arabidopsis thaliana) | pUbi::C53-mCherry x GCSI-SUBEX-C57Y-GFP | this study/Richard Strasser Shin et al., 2018 | See Methods, Plant materials and Growth conditions. Available on request to the corresponding authors. | |
| Genetic reagent (Arabidopsis thaliana) | pUbi::C53-mCherry x MNS1-SUBEX-GFP | this study/Richard Strasser Shin et al., 2018 | See Methods, Plant materials and Growth conditions. Available on request to the corresponding authors. | |
| Genetic reagent (Arabidopsis thaliana) | pUbi::C53-GFP | this study | See Methods, Plant materials and Growth conditions. Available on request to the corresponding authors. | |
| Genetic reagent (Arabidopsis thaliana) | pUbi::C53-GFP x c53 | this study | See Methods, Plant materials and Growth conditions. Available on request to the corresponding authors. | |
| Genetic reagent (Arabidopsis thaliana) | pUbi::C53sAIM(W276A,W287A,Y304A,W335A) -GFP x c53 | this study | See Methods, Plant materials and Growth conditions. Available on request to the corresponding authors. | |
| Genetic reagent (Arabidopsis thaliana) | pUbi::C53-GFP x SP-mRFP-SUBEX-C57Y-EMP12 | this study/Richard Strasser Shin et al., 2018 | See Methods, Plant materials and Growth conditions. Available on request to the corresponding authors. | |
| Genetic reagent (Arabidopsis thaliana) | pC53::C53-GFP | this study | See Methods, Plant materials and Growth conditions. Available on request to the corresponding authors. | |
| Genetic reagent (Arabidopsis thaliana) | pUbi::UFL1-GFP | this study | See Methods, Plant materials and Growth conditions. Available on request to the corresponding authors. | |
| Genetic reagent (Arabidopsis thaliana) | pUbi::DDRGK1-GFP | this study | See Methods, Plant materials and Growth conditions. Available on request to the corresponding authors. | |
| Genetic reagent (Arabidopsis thaliana) | pUbi::DDRGK1-GFPx pUbi::mCherryATG8A | this study | See Methods, Plant materials and Growth conditions. Available on request to the corresponding authors. | |
| Genetic reagent (Arabidopsis thaliana) | pUbi::DDRGK1-GFPx pUbi::mCherryATG8A x c53 | this study | See Methods, Plant materials and Growth conditions. Available on request to the corresponding authors. | |
| Genetic reagent (Arabidopsis thaliana) | pUbi::DDRGK1-GFP x atg5 | this study | See Methods, Plant materials and Growth conditions. Available on request to the corresponding authors. | |
| Genetic reagent (Arabidopsis thaliana) | pUbi::DDRGK1-GFP x c53 | this study | See Methods, Plant materials and Growth conditions. Available on request to the corresponding authors. | |
| Genetic reagent (Arabidopsis thaliana) | pUbi::IRE1B-YFP x pRPS5a::C53-tagRFP | this study | See Methods, Plant materials and Growth conditions. Available on request to the corresponding authors. | |
| Genetic reagent (Arabidopsis thaliana) | p35S::GFP-HDEL (ER-gk) | NASC (N16251) | ||
| Genetic reagent (Arabidopsis thaliana) | wave-YFP (pNIGEL07 pUbi::myc-YFP) | Niko Geldner Geldner et al. The Plant Journal (2009) | ||
| Genetic reagent (Arabidopsis thaliana) | Wave-mCherry (pNIGEL17 pUbi::mCherry) | Niko Geldner Geldner et al. The Plant Journal (2009) | ||
| Sequence-based reagent | AtC53_BsF | this study | ATATATGGTCTCGATTGATATCACCTTCTCTCGTCTGTT | |
| Sequence-based reagent | AtC53_F0 | this study | TGATATCACCTTCTCTCGTCTGTTTTAGAGCTAGAAATAGC | |
| Sequence-based reagent | AtC53_R0 | this study | AACCAAGGCCTTGGCTTTCTTCCAATCTCTTAGTCGACTCTAC | |
| Sequence-based reagent | AtC53_BsR | this study | ATTATTGGTCTCGAAACCAAGGCCTTGGCTTTCTTCCAA | |
| Sequence-based reagent | AtDDRGK1_BsF | this study | ATATATGGTCTCGATTGAGAGATGCTAGATCACGGGGTT | |
| Sequence-based reagent | AtDDRGK1_F0 | this study | TGAGAGATGCTAGATCACGGGGTTTTAGAGCTAGAAATAGC | |
| Sequence-based reagent | AtDDRGK1_BsR | this study | AACTGCACTTCCTCTGTAGTACCAATCTCTTAGTCGACTCTAC | |
| Sequence-based reagent | AtDDRGK1_R0 | this study | ATTATTGGTCTCGAAACTGCACTTCCTCTGTAGTACCAA | |
| Sequence-based reagent | AtUFM1_BsF | this study | ATATATGGTCTCGATTGGAGGAGATTCAGATTAGCA GTT | |
| Sequence-based reagent | AtUFM1_F0 | this study | TGGAGGAGATTCAGATTAGCA GTTTTAGAGCTAGAAATAGC | |
| Sequence-based reagent | AtUFM1_R0 | this study | AACGAAGGAGCTCCGTTCACGGCAATCTCTTAGTCGACTCTAC | |
| Sequence-based reagent | AtUFM1_BsR | this study | ATTATTGGTCTCGAAACGAAGGAGCTCCGTTCACGGCAA | |
| Sequence-based reagent | MpC53- sgRNA1- FWD | this study | CTCGTCAATCGGAAGAGACAGAGC | |
| Sequence-based reagent | MpC53- sgRNA1-REV | this study | AAACGCTCTGTCTCTTCCGATTGA | |
| Sequence-based reagent | MpC53- sgRNA2- FWD | this study | CTCGAAAGTTCTGCCCTGATGT | |
| Sequence-based reagent | MpC53- sgRNA2-REV | this study | AAACACATCAGGGCAGAACTTT | |
| Sequence-based reagent | MpIRE1- sgRNA1- FWD | this study | CTCGTACGTTAAAGGCGAATATGG | |
| Sequence-based reagent | MpIRE1- sgRNA1-REV | this study | AAACCCATATTCGCCTTTAACGTA | |
| Sequence-based reagent | MpIRE1- sgRNA2- FWD | this study | CTCGCATCAAAGGACCACCAGGGC | |
| Sequence-based reagent | MpIRE1- sgRNA2-REV | this study | AAACGCCCTGGTGGTCCTTTGATG | |
| Antibody | Anti-Rabbit IgG HRP-Conjugate (goat polyclonal) | Biorad | 1706515 | 1:10000 |
| Antibody | Anti-Mouse IgG-HRP Conjugate (goat polyclonal) | Biorad | 1706516 | 1:10000 |
| Antibody | mCherry (rabbit polyclonal) | Abcam | ab167453 | 1:5000 |
| Antibody | HIS6 (mouse monoclonal) | Sigma Aldrich | H1029 | 1:5000 |
| Antibody | GST HRP Conjugate (goat polyclonal) | GE Healthcare | RPN1236 | 1:1000 |
| Antibody | GFP (rabbit polyclonal) | Invitrogen | A11122 | 1:3000 |
| Antibody | GFP (mouse monoclonal) | Roche | 11814460001 | 1:3000 |
| Antibody | MBP (mouse monoclonal) | Sigma Aldrich | M1321-200UL | 1:3000 |
| Antibody | HsC53 (mouse monoclonal) | SCBT | sc271671 | 1:1000 |
| Antibody | LC3B (mouse monoclonal) | nanoTools | 0260–100/LC3-2G6 | 1:100 |
| Antibody | BIP3 (rabbit polyclonal) | CST | 3177 | 1:1000 |
| Antibody | Vinculin (mouse monoclonal) | Sigma Aldrich | V9131 | 1:1000 |
| Antibody | HsUFM1 (rabbit monoclonal) | Abcam | ab108062 | 1:2000 |
| Antibody | ATG8A (rabbit polyclonal) | Agrisera | AS14 2811 | 1:1000 |
| Antibody | AtC53 (rabbit polyclonal) | this study | - | 1:5000 See Methods, Chemical and Antibodies. |
| Antibody | 60S (L13) (rabbit polyclonal) | Agrisera | AS13 2650 | 1:1000 |
| Antibody | 40S (RPS14) (rabbit polyclonal) | Agrisera | AS12 2111 | 1:1000 |
| Antibody | SMT1 (rabbit polyclonal) | Agrisera | AS07 266 | 1:500 |
| Antibody | CNX1/2 (rabbit polyclonal) | Agrisera | AS12 2365 | 1:3000 |
| Antibody | BIP1/2/3 (rabbit polyclonal) | Agrisera | AS09 481 | 1:3000 |
| Recombinant DNA reagent | MBP-AtC53 | This study | See Methods, Cloning procedures. Available on request to the corresponding authors. | |
| Recombinant DNA reagent | GST-ATG8A | This study | See Methods, Cloning procedures. Available on request to the corresponding authors. | |
| Recombinant DNA reagent | GST-ATG8ALDS(YL50AA) | This study | See Methods, Cloning procedures. Available on request to the corresponding authors. | |
| Recombinant DNA reagent | GST-ATG8AUDS(IFV77AAA) | This study | See Methods, Cloning procedures. Available on request to the corresponding authors. | |
| Recombinant DNA reagent | GST-ATG8B | This study | See Methods, Cloning procedures. Available on request to the corresponding authors. | |
| Recombinant DNA reagent | GST-ATG8C | This study | See Methods, Cloning procedures. Available on request to the corresponding authors. | |
| Recombinant DNA reagent | GST-ATG8D | This study | See Methods, Cloning procedures. Available on request to the corresponding authors. | |
| Recombinant DNA reagent | GST-ATG8E | This study | See Methods, Cloning procedures. Available on request to the corresponding authors. | |
| Recombinant DNA reagent | GST-ATG8F | This study | See Methods, Cloning procedures. Available on request to the corresponding authors. | |
| Recombinant DNA reagent | GST-ATG8G | This study | See Methods, Cloning procedures. Available on request to the corresponding authors. | |
| Recombinant DNA reagent | GST-ATG8H | This study | See Methods, Cloning procedures. Available on request to the corresponding authors. | |
| Recombinant DNA reagent | GST-ATG8I | This study | See Methods, Cloning procedures. Available on request to the corresponding authors. | |
| Recombinant DNA reagent | GST-GABARAP | This study | See Methods, Cloning procedures. Available on request to the corresponding authors. | |
| Recombinant DNA reagent | GST-GABARAPL1 | This study | See Methods, Cloning procedures. Available on request to the corresponding authors. | |
| Recombinant DNA reagent | GST-GABARAPL2 | This study | See Methods, Cloning procedures. Available on request to the corresponding authors. | |
| Recombinant DNA reagent | GST-LC3A | This study | See Methods, Cloning procedures. Available on request to the corresponding authors. | |
| Recombinant DNA reagent | GST-LC3B | This study | See Methods, Cloning procedures. Available on request to the corresponding authors. | |
| Recombinant DNA reagent | GST-LC3C | This study | See Methods, Cloning procedures. Available on request to the corresponding authors. | |
| Recombinant DNA reagent | GST-GABARAPLDS(YL49AA) | This study | See Methods, Cloning procedures. Available on request to the corresponding authors. | |
| Recombinant DNA reagent | GST-GABARAP(P52A) | This study | See Methods, Cloning procedures. Available on request to the corresponding authors. | |
| Recombinant DNA reagent | GST-GABARAP(R67A) | This study | See Methods, Cloning procedures. Available on request to the corresponding authors. | |
| Recombinant DNA reagent | GST-GABARAP(P52A, R67A) | This study | See Methods, Cloning procedures. Available on request to the corresponding authors. | |
| Recombinant DNA reagent | GST-GABARAP(KK64AA) | This study | See Methods, Cloning procedures. Available on request to the corresponding authors. | |
| Recombinant DNA reagent | GST-MpATG8A | This study | See Methods, Cloning procedures. Available on request to the corresponding authors. | |
| Recombinant DNA reagent | GST-MpATG8ALDS(YL50AA) | This study | See Methods, Cloning procedures. Available on request to the corresponding authors. | |
| Recombinant DNA reagent | GST-MpATG8B | This study | See Methods, Cloning procedures. Available on request to the corresponding authors. | |
| Recombinant DNA reagent | GST-MpATG8BLDS(YL50AA) | This study | See Methods, Cloning procedures. Available on request to the corresponding authors. | |
| Recombinant DNA reagent | MBP-MpC53 | This study | See Methods, Cloning procedures. Available on request to the corresponding authors. | |
| Recombinant DNA reagent | MBP-AtC53 | This study | See Methods, Cloning procedures. Available on request to the corresponding authors. | |
| Recombinant DNA reagent | MBP-AtC53N-IDR(1-372) | This study | See Methods, Cloning procedures. Available on request to the corresponding authors. | |
| Recombinant DNA reagent | MBP-AtC53C-IDR(239-549) | This study | See Methods, Cloning procedures. Available on request to the corresponding authors. | |
| Recombinant DNA reagent | MBP-AtC53IDR(239-372) | This study | See Methods, Cloning procedures. Available on request to the corresponding authors. | |
| Recombinant DNA reagent | MBP-AtC53N-C(1-239,(KGSGSTSGSG)2,373-549) | This study | See Methods, Cloning procedures. Available on request to the corresponding authors. | |
| Recombinant DNA reagent | MBP-HsC53 | This study | See Methods, Cloning procedures. Available on request to the corresponding authors. | |
| Recombinant DNA reagent | MBP-HsC53N-IDR(1-316) | This study | See Methods, Cloning procedures. Available on request to the corresponding authors. | |
| Recombinant DNA reagent | MBP-HsC53C-IDR(263-506) | This study | See Methods, Cloning procedures. Available on request to the corresponding authors. | |
| Recombinant DNA reagent | MBP-HsC53IDR(263-316) | This study | See Methods, Cloning procedures. Available on request to the corresponding authors. | |
| Recombinant DNA reagent | MBP-HsC53N-C(1-262, (KGSGSTSGSG),317-506) | This study | See Methods, Cloning procedures. Available on request to the corresponding authors. | |
| Recombinant DNA reagent | MBP-AtC53Y304A | This study | See Methods, Cloning procedures. Available on request to the corresponding authors. | |
| Recombinant DNA reagent | MBP-AtC53Y304A, 1A (W276A) | This study | See Methods, Cloning procedures. Available on request to the corresponding authors. | |
| Recombinant DNA reagent | MBP-AtC53Y304A, 2A (W287A) | This study | See Methods, Cloning procedures. Available on request to the corresponding authors. | |
| Recombinant DNA reagent | MBP-AtC53Y304A, 3A (W335A) | This study | See Methods, Cloning procedures. Available on request to the corresponding authors. | |
| Recombinant DNA reagent | MBP-AtC53Y304A, 12A (W276A, W287A) | This study | See Methods, Cloning procedures. Available on request to the corresponding authors. | |
| Recombinant DNA reagent | MBP-AtC53Y304A, 13A (W276A, W335A) | This study | See Methods, Cloning procedures. Available on request to the corresponding authors. | |
| Recombinant DNA reagent | MBP-AtC53Y304A, 23A (W287A, W335A) | This study | See Methods, Cloning procedures. Available on request to the corresponding authors. | |
| Recombinant DNA reagent | MBP-AtC53Y304A, 123A (W276A, W287A, W335A) | This study | See Methods, Cloning procedures. Available on request to the corresponding authors. | |
| Recombinant DNA reagent | MBP-HsC531A(W269A) | This study | See Methods, Cloning procedures. Available on request to the corresponding authors. | |
| Recombinant DNA reagent | MBP-HsC532A(W294A) | This study | See Methods, Cloning procedures. Available on request to the corresponding authors. | |
| Recombinant DNA reagent | MBP-HsC533A(W312A) | This study | See Methods, Cloning procedures. Available on request to the corresponding authors. | |
| Recombinant DNA reagent | MBP-HsC5312A(W269A, W294A) | This study | See Methods, Cloning procedures. Available on request to the corresponding authors. | |
| Recombinant DNA reagent | MBP-HsC5313A(W269A, W312A) | This study | See Methods, Cloning procedures. Available on request to the corresponding authors. | |
| Recombinant DNA reagent | MBP-HsC5323A(W294A, W312A) | This study | See Methods, Cloning procedures. Available on request to the corresponding authors. | |
| Recombinant DNA reagent | MBP-HsC53123A(W269A, W294A, W312A) | This study | See Methods, Cloning procedures. Available on request to the corresponding authors. | |
| Recombinant DNA reagent | MBP-AtC53IDR sAIM (Y304A, W276A, W287A, W335A) | This study | See Methods, Cloning procedures. Available on request to the corresponding authors. | |
| Recombinant DNA reagent | MBP-HsC53IDR sAIM(W269A, W294A, W312A) | This study | See Methods, Cloning procedures. Available on request to the corresponding authors. | |
| Recombinant DNA reagent | MBP-HsUFL1 | This study | See Methods, Cloning procedures. Available on request to the corresponding authors. | |
| Recombinant DNA reagent | MBP-HsDDRGK1 | This study | See Methods, Cloning procedures. Available on request to the corresponding authors. | |
| Recombinant DNA reagent | GST-AtUFL1 | This study | See Methods, Cloning procedures. Available on request to the corresponding authors. | |
| Recombinant DNA reagent | GST-AtC53 | This study | See Methods, Cloning procedures. Available on request to the corresponding authors. | |
| Recombinant DNA reagent | MBP | This study | See Methods, Cloning procedures. Available on request to the corresponding authors. | |
| Recombinant DNA reagent | Ts-ATG8A | This study | See Methods, Cloning procedures. Available on request to the corresponding authors. | |
| Recombinant DNA reagent | Ts-AtDDRGK1(24-298) | This study | See Methods, Cloning procedures. Available on request to the corresponding authors. | |
| Recombinant DNA reagent | Ts-AtC53 | This study | See Methods, Cloning procedures. Available on request to the corresponding authors. | |
| Recombinant DNA reagent | HIS6-ATG8A | This study | See Methods, Cloning procedures. Available on request to the corresponding authors. | |
| Recombinant DNA reagent | HIS6-GABARAP | This study | See Methods, Cloning procedures. Available on request to the corresponding authors. | |
| Recombinant DNA reagent | HIS6-AtC53 | This study | See Methods, Cloning procedures. Available on request to the corresponding authors. | |
| Recombinant DNA reagent | HIS6-AtC53 sAIM (Y304A, W276A, W287A, W335A) | This study | See Methods, Cloning procedures. Available on request to the corresponding authors. | |
| Recombinant DNA reagent | HIS6-HsC53 | This study | See Methods, Cloning procedures. Available on request to the corresponding authors. | |
| Recombinant DNA reagent | HIS6-HsC53 sAIM(W269A, W294A, W312A) | This study | See Methods, Cloning procedures. Available on request to the corresponding authors. | |
| Recombinant DNA reagent | Strep-AtC53 | This study | See Methods, Cloning procedures. Available on request to the corresponding authors. | |
| Recombinant DNA reagent | Strep -AtC53AIM (F48A, Y69A) | This study | See Methods, Cloning procedures. Available on request to the corresponding authors. | |
| Recombinant DNA reagent | Strep -AtC53AIM (Y69A, Y76A) | This study | See Methods, Cloning procedures. Available on request to the corresponding authors. | |
| Recombinant DNA reagent | Strep -AtC53AIM (F48A, Y69A, Y76A) | This study | See Methods, Cloning procedures. Available on request to the corresponding authors. | |
| Recombinant DNA reagent | Strep -AtC53AIM (W100A) | This study | See Methods, Cloning procedures. Available on request to the corresponding authors. | |
| Recombinant DNA reagent | Strep -AtC53AIM (Y304A) | This study | See Methods, Cloning procedures. Available on request to the corresponding authors. | |
| Recombinant DNA reagent | Strep -AtC53AIM (F48A, Y69A, Y76A, W100A, Y304A) | This study | See Methods, Cloning procedures. Available on request to the corresponding authors. | |
| Recombinant DNA reagent | GST | This study | See Methods, Cloning procedures. Available on request to the corresponding authors. | |
| Transfected construct (Arabidopsis thaliana) | pUbi::C53-mCherry | this study | See Methods, Cloning procedures. Available on request to the corresponding authors. | |
| Transfected construct (Arabidopsis thaliana) | pUbi::C53-GFP | this study | See Methods, Cloning procedures. Available on request to the corresponding authors. | |
| Transfected construct (Arabidopsis thaliana) | pC53::C53-GFP | this study | See Methods, Cloning procedures. Available on request to the corresponding authors. | |
| Transfected construct (Arabidopsis thaliana) | pUbi::C53sAIM(W276A,W287A,Y304A,W335A) -GFP | this study | See Methods, Cloning procedures. Available on request to the corresponding authors. | |
| Transfected construct (Arabidopsis thaliana) | pUbi::UFL1-GFP | this study | See Methods, Cloning procedures. Available on request to the corresponding authors. | |
| Transfected construct (Arabidopsis thaliana) | pUbi::DDRGK1-GFP | this study | See Methods, Cloning procedures. Available on request to the corresponding authors. | |
| Transfected construct (Arabidopsis thaliana) | pUbi::C53-GFP | this study | See Methods, Cloning procedures. Available on request to the corresponding authors. | |
| Transfected construct (Arabidopsis thaliana) | pUbi::mCherry-ATG8A | this study | See Methods, Cloning procedures. Available on request to the corresponding authors. | |
| Transfected construct (Arabidopsis thaliana) | pUbi::GFP-ATG8A | this study | See Methods, Cloning procedures. Available on request to the corresponding authors. | |
| Transfected construct (Arabidopsis thaliana) | pUbi::GFP-ATG8B | this study | See Methods, Cloning procedures. Available on request to the corresponding authors. | |
| Transfected construct (Arabidopsis thaliana) | pUbi::GFP-ATG8C | this study | See Methods, Cloning procedures. Available on request to the corresponding authors. | |
| Transfected construct (Arabidopsis thaliana) | pUbi::GFP-ATG8D | this study | See Methods, Cloning procedures. Available on request to the corresponding authors. | |
| Transfected construct (Arabidopsis thaliana) | pUbi::GFP-ATG8E | this study | See Methods, Cloning procedures. Available on request to the corresponding authors. | |
| Transfected construct (Arabidopsis thaliana) | pUbi::GFP-ATG8F | this study | See Methods, Cloning procedures. Available on request to the corresponding authors. | |
| Transfected construct (Arabidopsis thaliana) | pUbi::GFP-ATG8G | this study | See Methods, Cloning procedures. Available on request to the corresponding authors. | |
| Transfected construct (Arabidopsis thaliana) | pUbi::GFP-ATG8H | this study | See Methods, Cloning procedures. Available on request to the corresponding authors. | |
| Transfected construct (Arabidopsis thaliana) | pUbi::GFP-ATG8I | this study | See Methods, Cloning procedures. Available on request to the corresponding authors. | |
| Transfected construct (Arabidopsis thaliana) | pUbi::IRE1B-YFP x pRPS5a::C53-tagRFP | this study | See Methods, Cloning procedures. Available on request to the corresponding authors. | |
| Transfected construct (Homo sapiens) | psPAX2 | Addgene | 12260 | Didier Trono |
| Transfected construct (Homo sapiens) | pMD2.G | Addgene | 12259 | Didier Trono |
| Transfected construct (Homo sapiens) | C53 shRNA in pLKO1 | Honglin Li Wu et al. Cell Res (2013). | ||
| Transfected construct (Homo sapiens) | peGFP(N2)-HsC53-GFP | This study | See Methods, Cloning procedures. Available on request to the corresponding authors. | |
| Transfected construct (Homo sapiens) | peGFP(N2)-AtC53-GFP | This study | See Methods, Cloning procedures. Available on request to the corresponding authors. | |
| Transfected construct (Homo sapiens) | peGFP(N2)-HsC53sAIM-GFP | This study | See Methods, Cloning procedures. Available on request to the corresponding authors. | |
| Transfected construct (Homo sapiens) | peGFP(N2)-AtC53 | This study | See Methods, Cloning procedures. Available on request to the corresponding authors. | |
| Transfected construct (Homo sapiens) | pmCherry(N2)-HsC53-mCherry | This study | See Methods, Cloning procedures. Available on request to the corresponding authors. | |
| Transfected construct (Homo sapiens) | pmCherry-GABARAP-mCherry | Fumiyo Ikeda | ||
| Transfected construct (Homo sapiens) | mRFP-LAMTOR1 | Sascha Martens | ||
| Transfected construct (Homo sapiens) | ER-K20 | Addgene Wang et al. Cell Res. (2020) | 133861 | |
| Transfected construct (Homo sapiens) | ERAD-C (pEGFP-GFP:CFTRΔF508 ) | Ron R. Kopito Leto et al. Mol. Cell (2019) | ||
| Transfected construct (Homo sapiens) | ERAD-L (pcDNA3-NHK-GFP) | Ron R. Kopito Leto et al. Mol. Cell (2019) | ||
| Transfected construct (Homo sapiens) | ERAD-M (pMCB497-pTRE-INSIG1-GFP) | Ron R. Kopito Leto et al. Mol. Cell (2019) | ||
| Transfected construct (Homo sapiens) | pcDNA3-Erdj3-GFP-3Gly | Maya Schuldiner Ast et al., 2016 | ||
| Chemical compound, drug | Tunicamycin | SCBT | sc-3506 | |
| Chemical compound, drug | Torin | SCBT | sc-396760 | |
| Chemical compound, drug | Bafilomycin A1 | Abcam | ab120497 | |
| Chemical compound, drug | 4μ8C | Sigma Aldrich | SML0949 | |
| Chemical compound, drug | KIRA6 | MedChemExpress | HY-19708 | |
| Chemical compound, drug | Anisomycin (ANS) | Sigma Aldrich | A5862-0.5ml | |
| Chemical compound, drug | DTT | Sigma Aldrich | 43815 | |
| Chemical compound, drug | Concanamycin-A (conA) | Santa Cruz | sc-202111A | |
| Chemical compound, drug | Cyclopiazonic acid (CPA) | Santa Cruz | sc-201510 | |
| Chemical compound, drug | Kifunensine (kif) | Santa Cruz | sc-201364A | |
| Chemical compound, drug | Thapsigargin (Tg) | Santa Cruz | sc-24017 | |
| Chemical compound, drug | CB-5083 | Selleckchem | # S8101 | |
| Chemical compound, drug | Harringtonine | Santa Cruz | sc-204771 | |
| Chemical compound, drug | Anisomycin | Sigma Aldrich | 176880–10 MG | |
| Chemical compound, drug | Puromycin | Sigma Aldrich | P8833-10MG | |
| Chemical compound, drug | Emetine | Sigma Aldrich | E2375-250MG | |
| Strain, strain background (E. coli) | DH5α | In-house facility | Vienna BioCenter | |
| Strain, strain background (E. coli) | BL21 (DE3) | In-house facility | Vienna BioCenter | |
| Strain, strain background (E. coli) | Rosetta2 (DE3) pLysS | In-house facility | Vienna BioCenter | |
| Strain, strain background (E. coli) | GV3101 (pSoup) | In-house facility | Vienna BioCenter | |
| Software, algorithm | CLC main work bench 7 | Qiagen | Cloning | |
| Software, algorithm | Zen Software | Carl Zeiss | Microscopy | |
| Software, algorithm | Image J (Fiji) | NIH | Image Quantification | |
| Software, algorithm | Prism 8 | Graph Pad | Statistics | |
| Software, algorithm | Image Lab | BioRad | Western Blot Analysis | |
| Software, algorithm | Adobe Illustrator 2020 | Adobe Inc | Graphics editing | |
| Software, algorithm | RStudio 1.2.5019 | RStudio, Inc | Graph plotting | |
| Other | GFP-Trap | Chromotek | Gta-20 | |
| Other | RFP-Trap | Chromotek | Rta-20 | |
| Other | Glutathion Sepharose 4 | GE Healthcare | 17-5132-01 | |
| Other | Pierce Glutathione Magnetic Agarose Beads | Thermo Scientific | 78601 | |
| Other | HisTrap FF 5 ml | GE Healthcare | 17525501 | |
| Other | HisTrap FF 1 ml | GE Healthcare | 17531901 | |
| Other | Resource Q 6 ml | GE Healthcare | 17117901 | |
| Other | Resource S 6 ml | GE Healthcare | 17118001 | |
| Other | HiPrep 26/10 Desalting | GE Healthcare | 17508701 | |
| Other | HiLoad 16/600 Superdex 75 pg | GE Healthcare | 28989333 | |
| Other | HiLoad 16/600 Superdex 200 pg | GE Healthcare | 28989335 | |
| Other | GSTrap FF | GE Healthcare | 17513101 | |
| Other | Streptavidin-HRP Conjugate | GE Healthcare | GERPN1231-100UL | 1:1000 |
Additional files
-
Supplementary file 1
Peptide array map.
- https://cdn.elifesciences.org/articles/58396/elife-58396-supp1-v4.xlsx
-
Supplementary file 2
IP/MS-analyses of mCherry, mCherry-ATG8A and mCherry-ATG8E.
- https://cdn.elifesciences.org/articles/58396/elife-58396-supp2-v4.xlsm
-
Supplementary file 3
Quantitative proteomics analyses of AtC53 mediated degradation (TMT).
- https://cdn.elifesciences.org/articles/58396/elife-58396-supp3-v4.xlsm
-
Supplementary file 4
Enriched GO categorization of quantitative proteomics analyses of AtC53 mediated degradation (TMT).
- https://cdn.elifesciences.org/articles/58396/elife-58396-supp4-v4.xlsx
-
Supplementary file 5
IP/MS analyses of YFP, C53-GFP, UFL1-GFP and DDRGK1-GFP.
- https://cdn.elifesciences.org/articles/58396/elife-58396-supp5-v4.xlsm
-
Supplementary file 6
Summary of thermodynamic parameters of the interactions studied in this paper.
- https://cdn.elifesciences.org/articles/58396/elife-58396-supp6-v4.docx
-
Transparent reporting form
- https://cdn.elifesciences.org/articles/58396/elife-58396-transrepform-v4.pdf
Download links
A two-part list of links to download the article, or parts of the article, in various formats.
Downloads (link to download the article as PDF)
Open citations (links to open the citations from this article in various online reference manager services)
Cite this article (links to download the citations from this article in formats compatible with various reference manager tools)
A cross-kingdom conserved ER-phagy receptor maintains endoplasmic reticulum homeostasis during stress
eLife 9:e58396.
https://doi.org/10.7554/eLife.58396


