Impact of COVID-19-related disruptions to measles, meningococcal A, and yellow fever vaccination in 10 countries
- MRC Centre for Global Infectious Disease Analysis, Abdul Latif Jameel Institute for Disease and Emergency Analytics (J-IDEA), School of Public Health, Imperial College London, United Kingdom
- Centre for Mathematical Modelling of Infectious Diseases, London School of Hygiene & Tropical Medicine, United Kingdom
- Department of Biological Sciences, University of Notre Dame, United States
- Department of Veterinary Medicine, University of Cambridge, United Kingdom
- Institute for Disease Modeling, Bill & Melinda Gates Foundation, United States
- Pennsylvania State University, United States
- Kaiser Permanante Washington, United States
- School of Public Health, University of Hong Kong, China
Figures
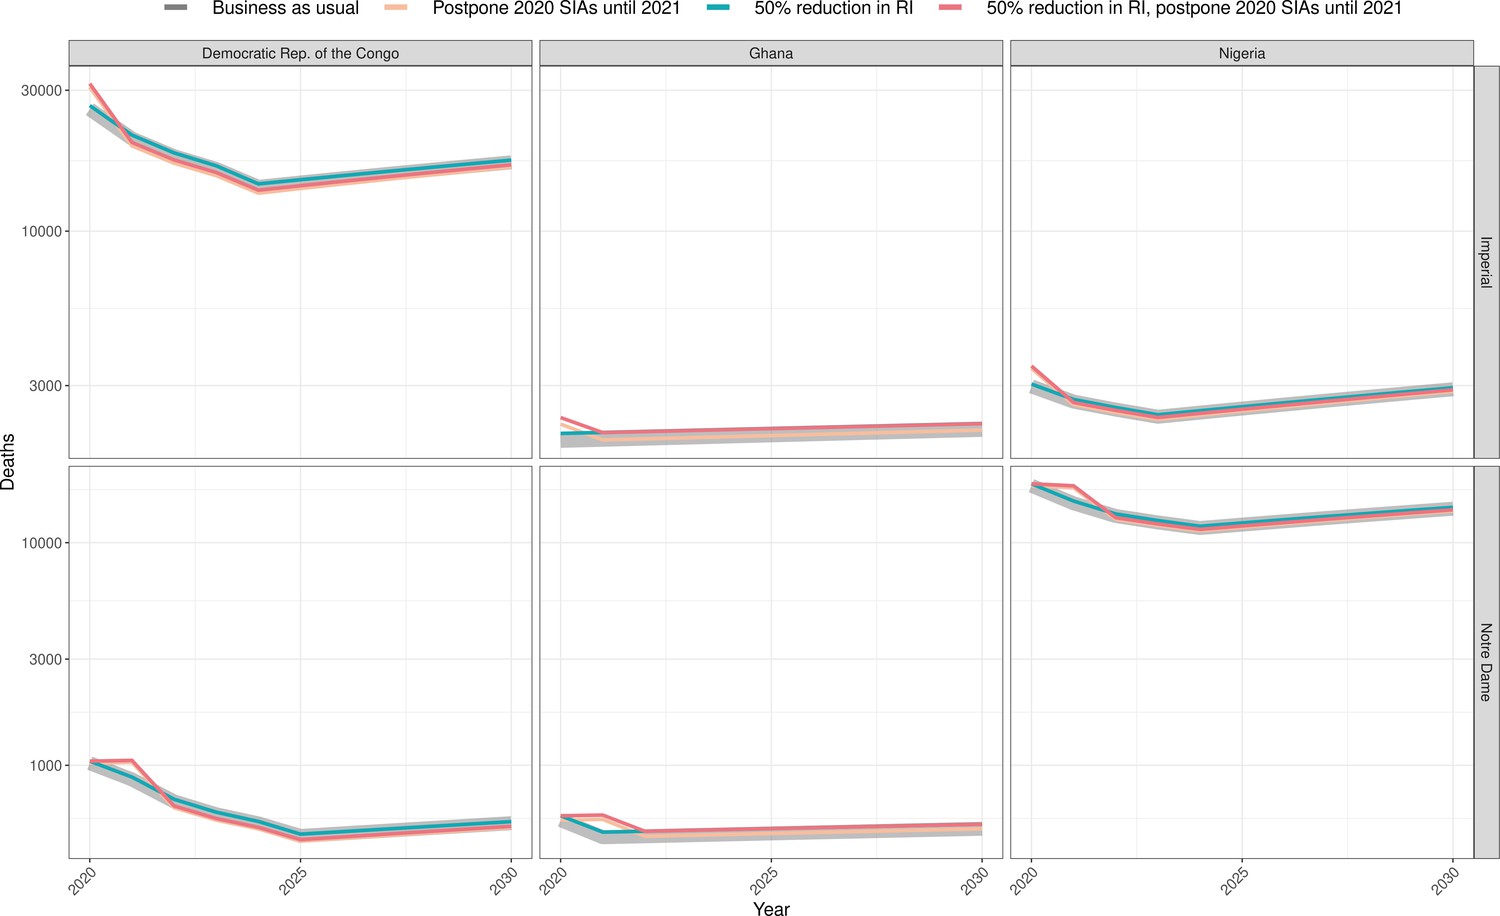
Figure 1
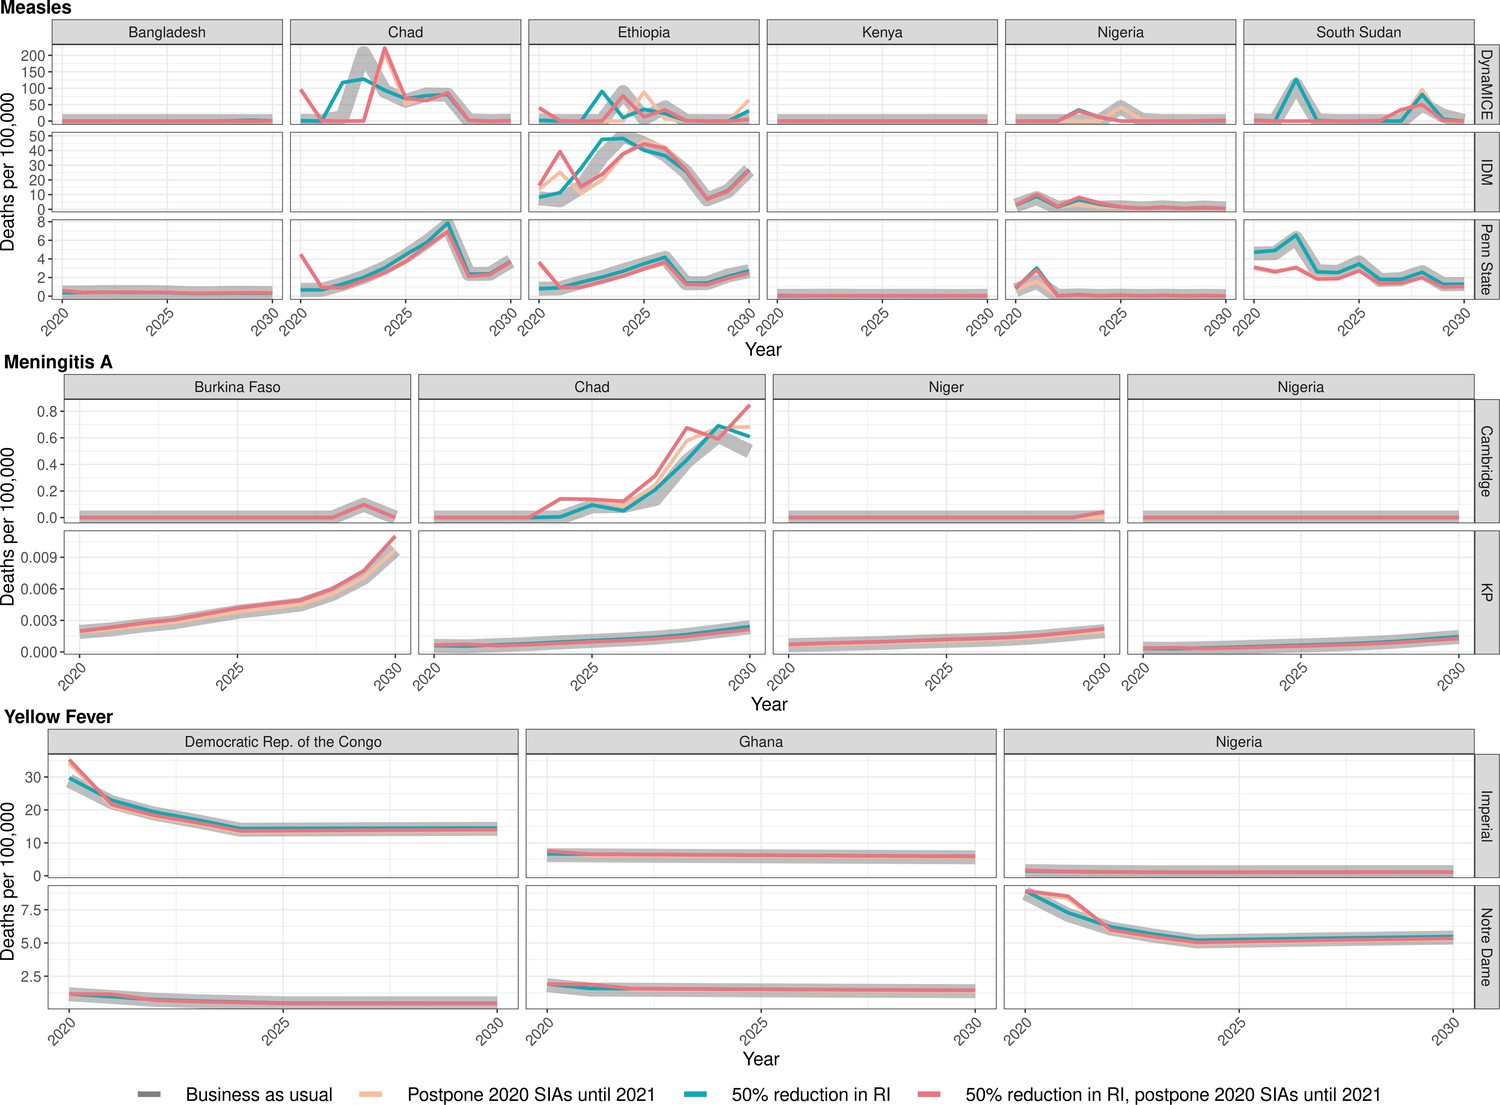
Health impact of predicted total deaths for immunisation disruption scenarios and no disruption scenario for measles, meningococcal A, and yellow fever.
Model-predicted total deaths per 100,000 population per year for routine immunisation (RI) and campaign immunisation (SIAs – supplementary immunisation activities) disruption scenarios and no disruption scenario (BAU – business-as-usual scenario) for measles, meningococcal A, and yellow fever during 2020–2030.
Figure 2
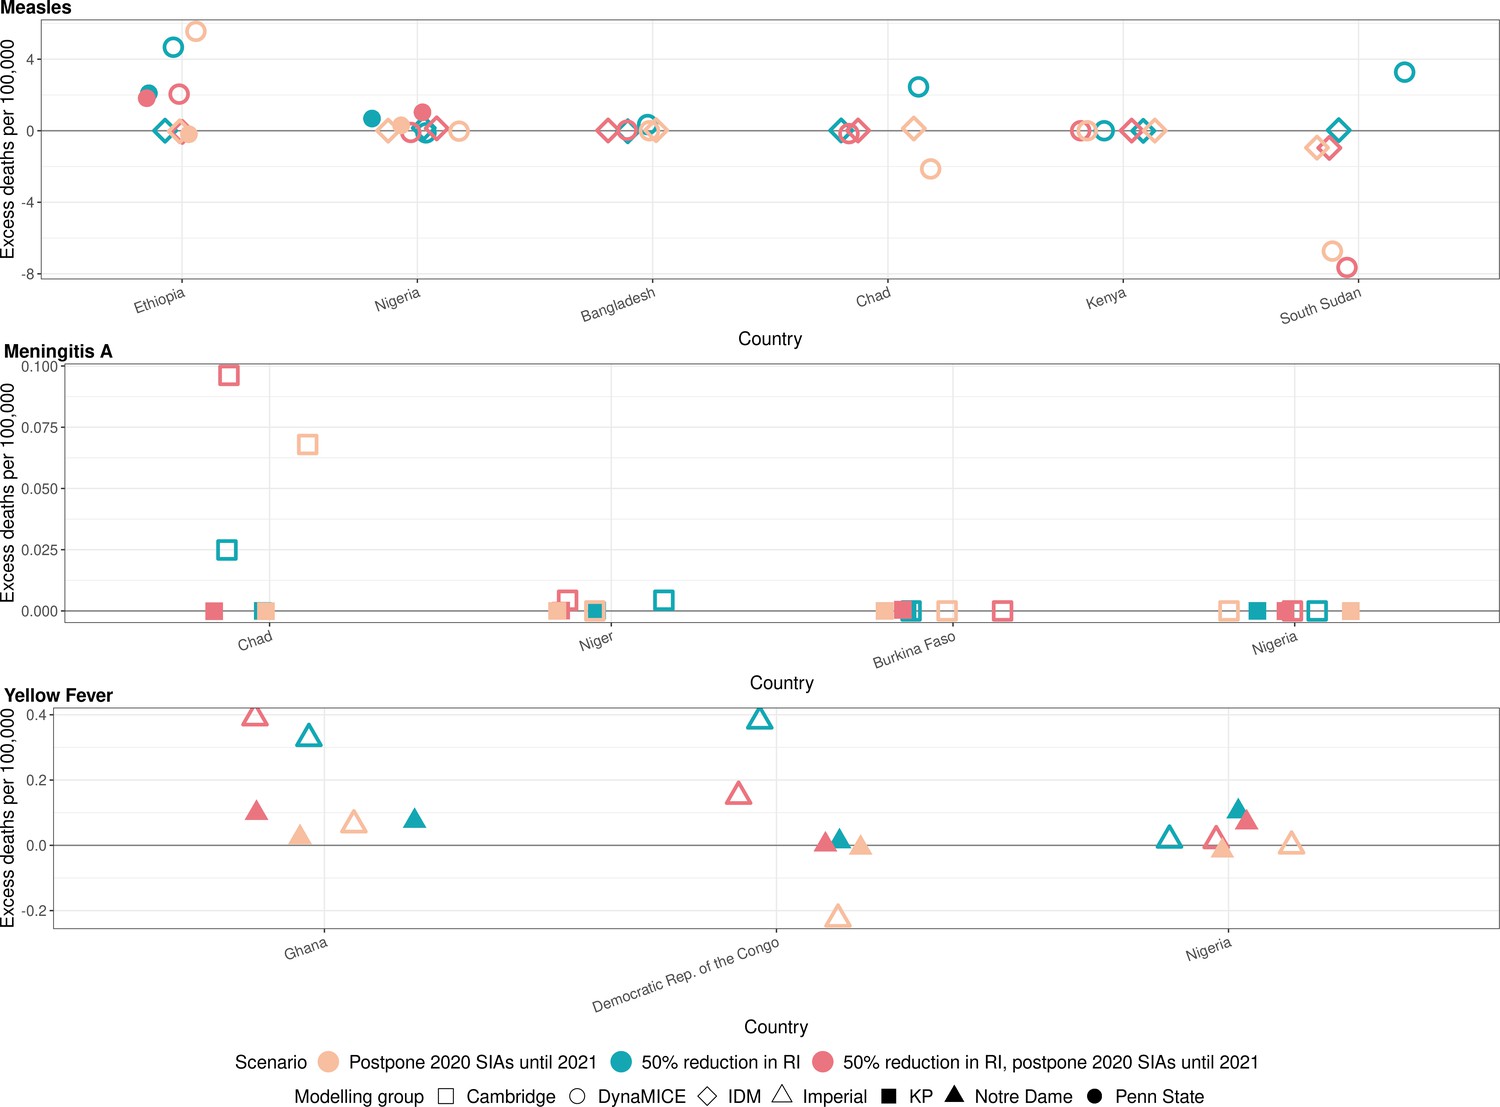
Health impact of excess deaths for immunisation disruption scenarios in comparison to no disruption scenario for measles, meningococcal A, and yellow fever.
Model-predicted excess deaths per 100,000 population per year for routine immunisation (RI) and campaign immunisation (SIAs – supplementary immunisation activities) disruption scenarios in comparison to no disruption scenario (BAU – business-as-usual scenario) for measles, meningococcal A, and yellow fever. Excess deaths are summed over 2020–2030.
Appendix 1—figure 1
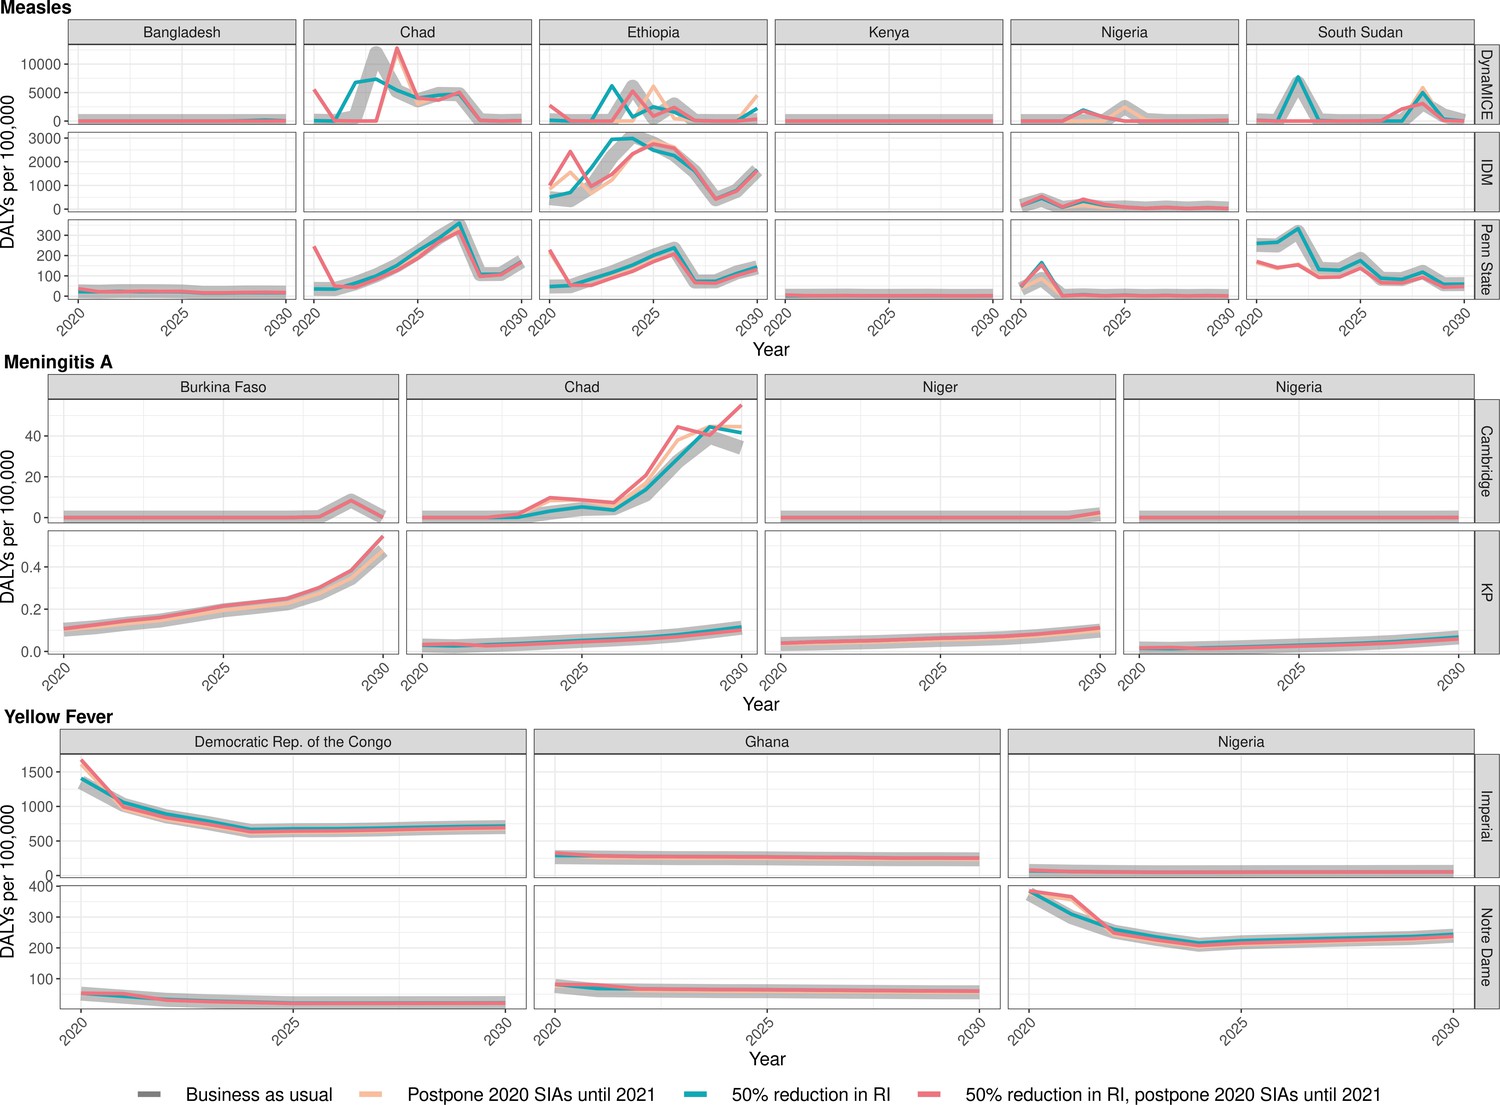
Health impact of predicted total disability-adjusted life years for immunisation disruption scenarios and no disruption scenario for measles, meningococcal A, and yellow fever.
Model-predicted total disability-adjusted life years (DALYs) per 100,000 population per year for routine immunisation (RI) and campaign immunisation (SIAs – supplementary immunisation activities) disruption scenarios and no disruption scenario (BAU – business-as-usual scenario) for measles, meningococcal A, and yellow fever during 2020–2030.
Appendix 1—figure 2
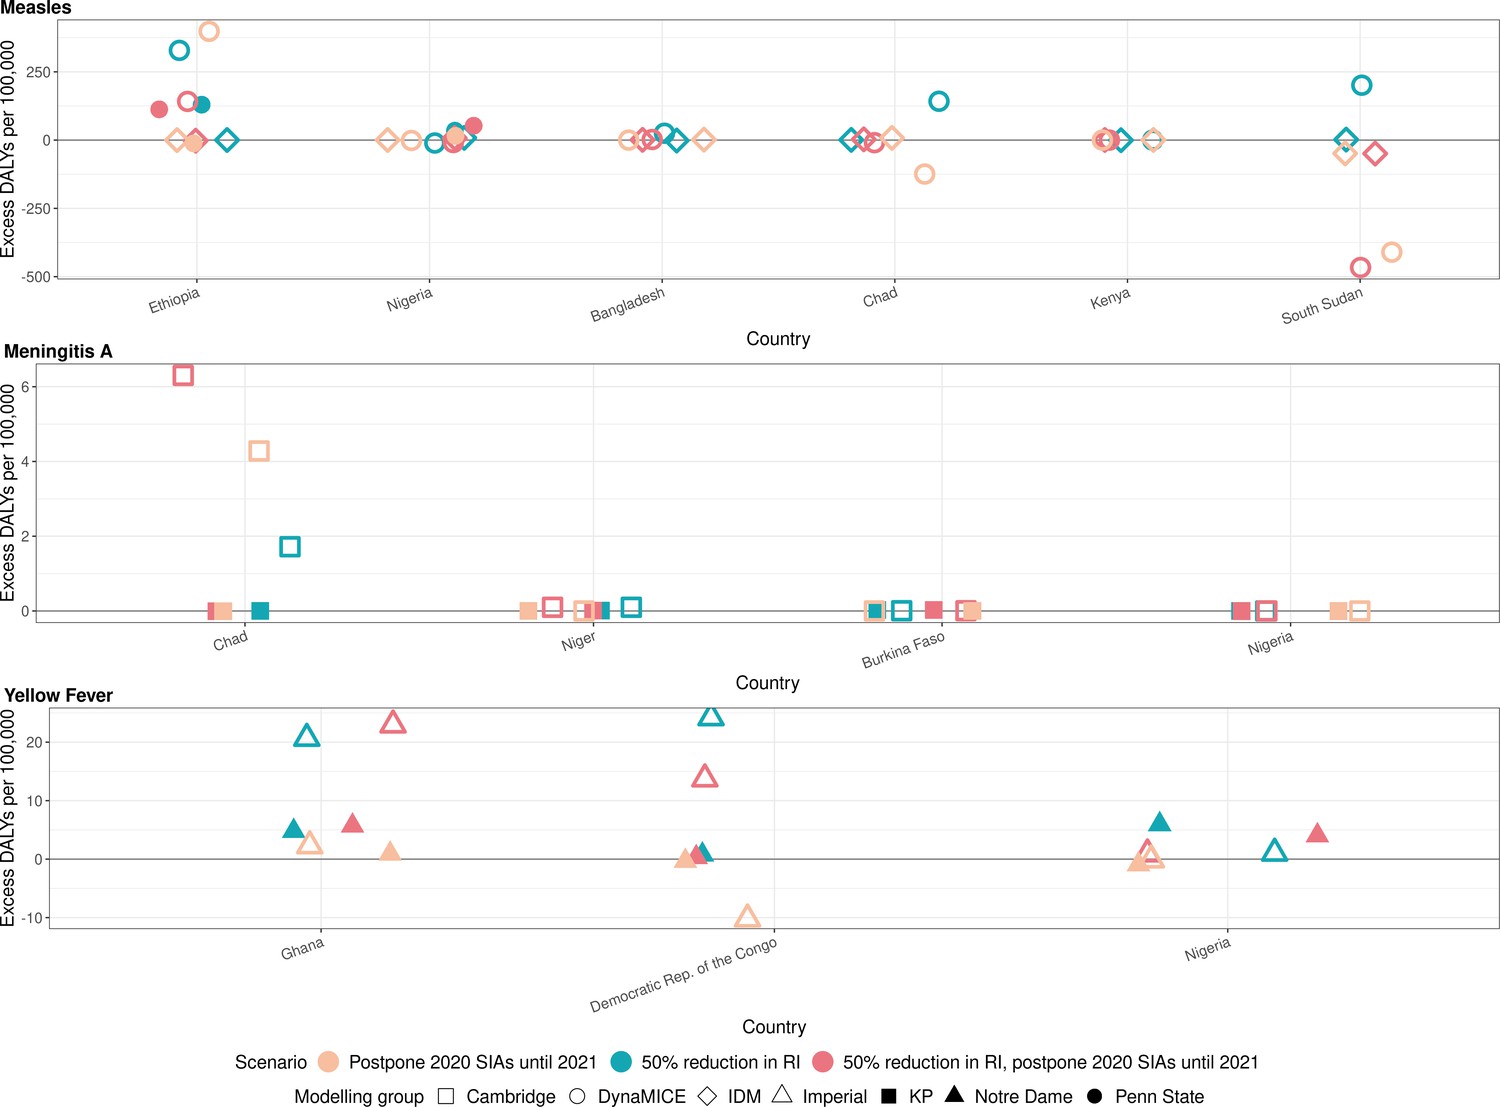
Health impact of excess disability-adjusted life years for immunisation disruption scenarios in comparison to no disruption scenario for measles, meningococcal A, and yellow fever.
Model-predicted excess disability-adjusted life years (DALYs) per 100,000 population per year for routine immunisation (RI) and campaign immunisation (SIAs – supplementary immunisation activities) disruption scenarios in comparison to no disruption scenario (BAU – business-as-usual scenario) for measles, meningococcal A, and yellow fever. Excess DALYs are summed over 2020–2030.
Appendix 1—figure 3
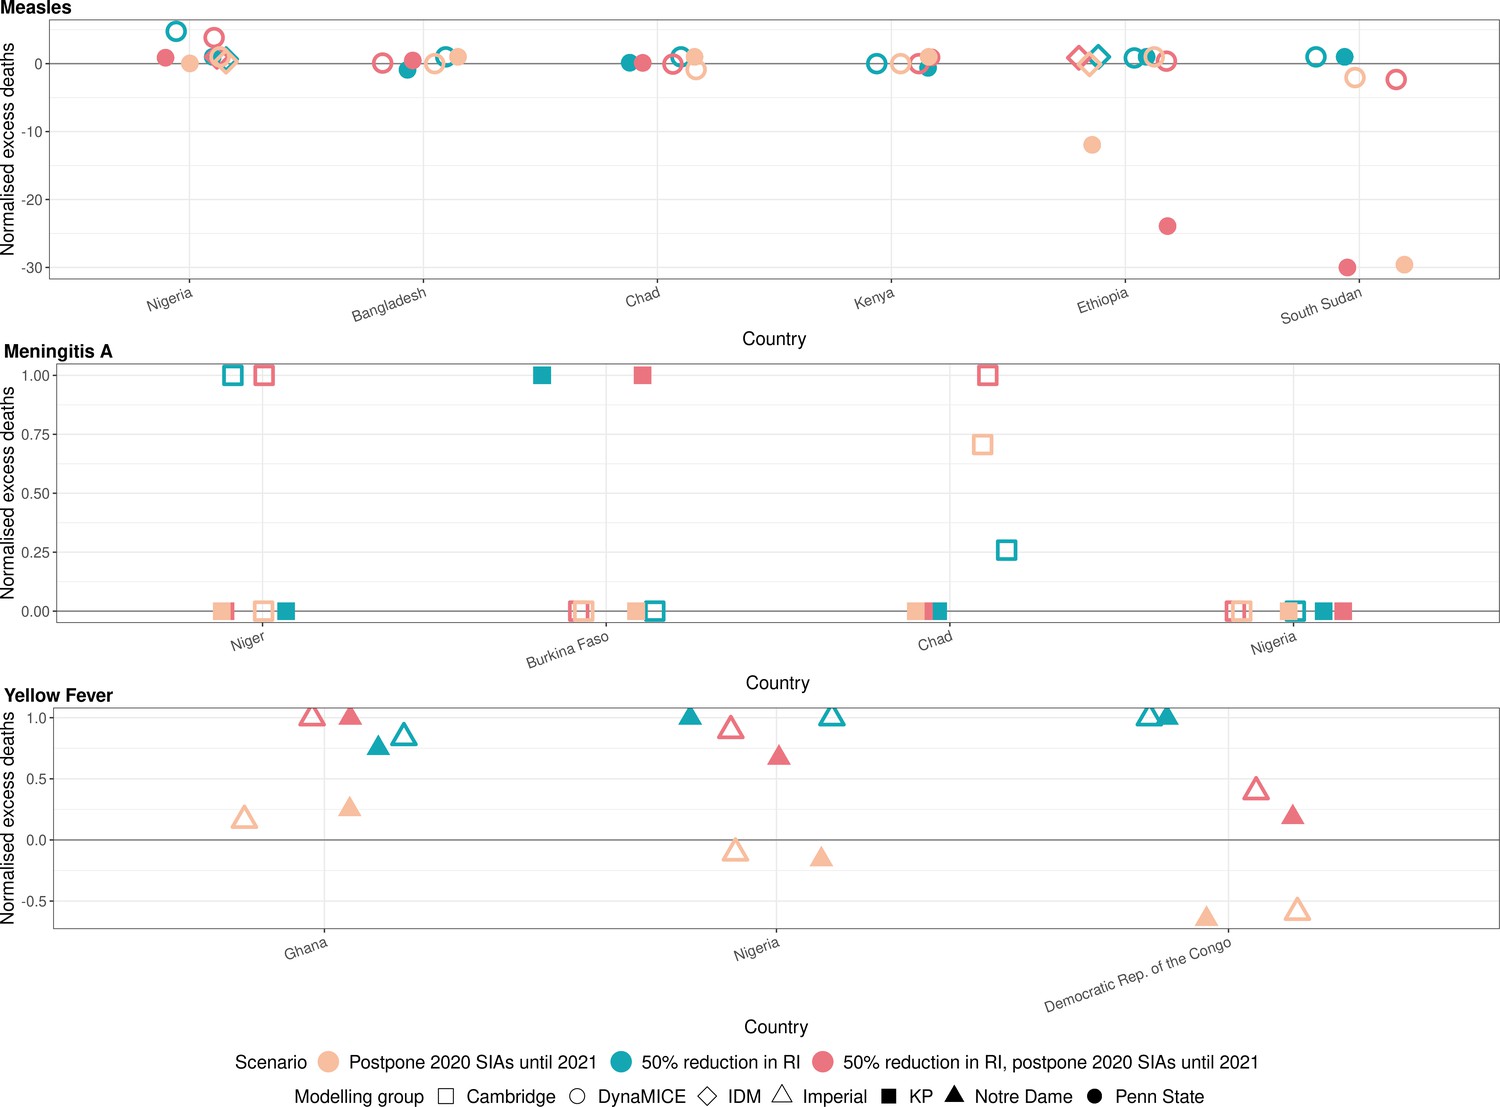
Health impact of normalised excess deaths for immunisation disruption scenarios in comparison to no disruption scenario for measles, meningococcal A, and yellow fever.
The normalised model-predicted excess deaths per year for routine immunisation (RI) and campaign immunisation (SIAs – supplementary immunisation activities) disruption scenarios in comparison to no disruption scenario (BAU – business-as-usual scenario) for measles, meningococcal A, and yellow fever. Excess deaths are summed over 2020–2030, and the excess deaths are normalised by setting the BAU to 0 and maximum to 1.
Appendix 1—figure 4
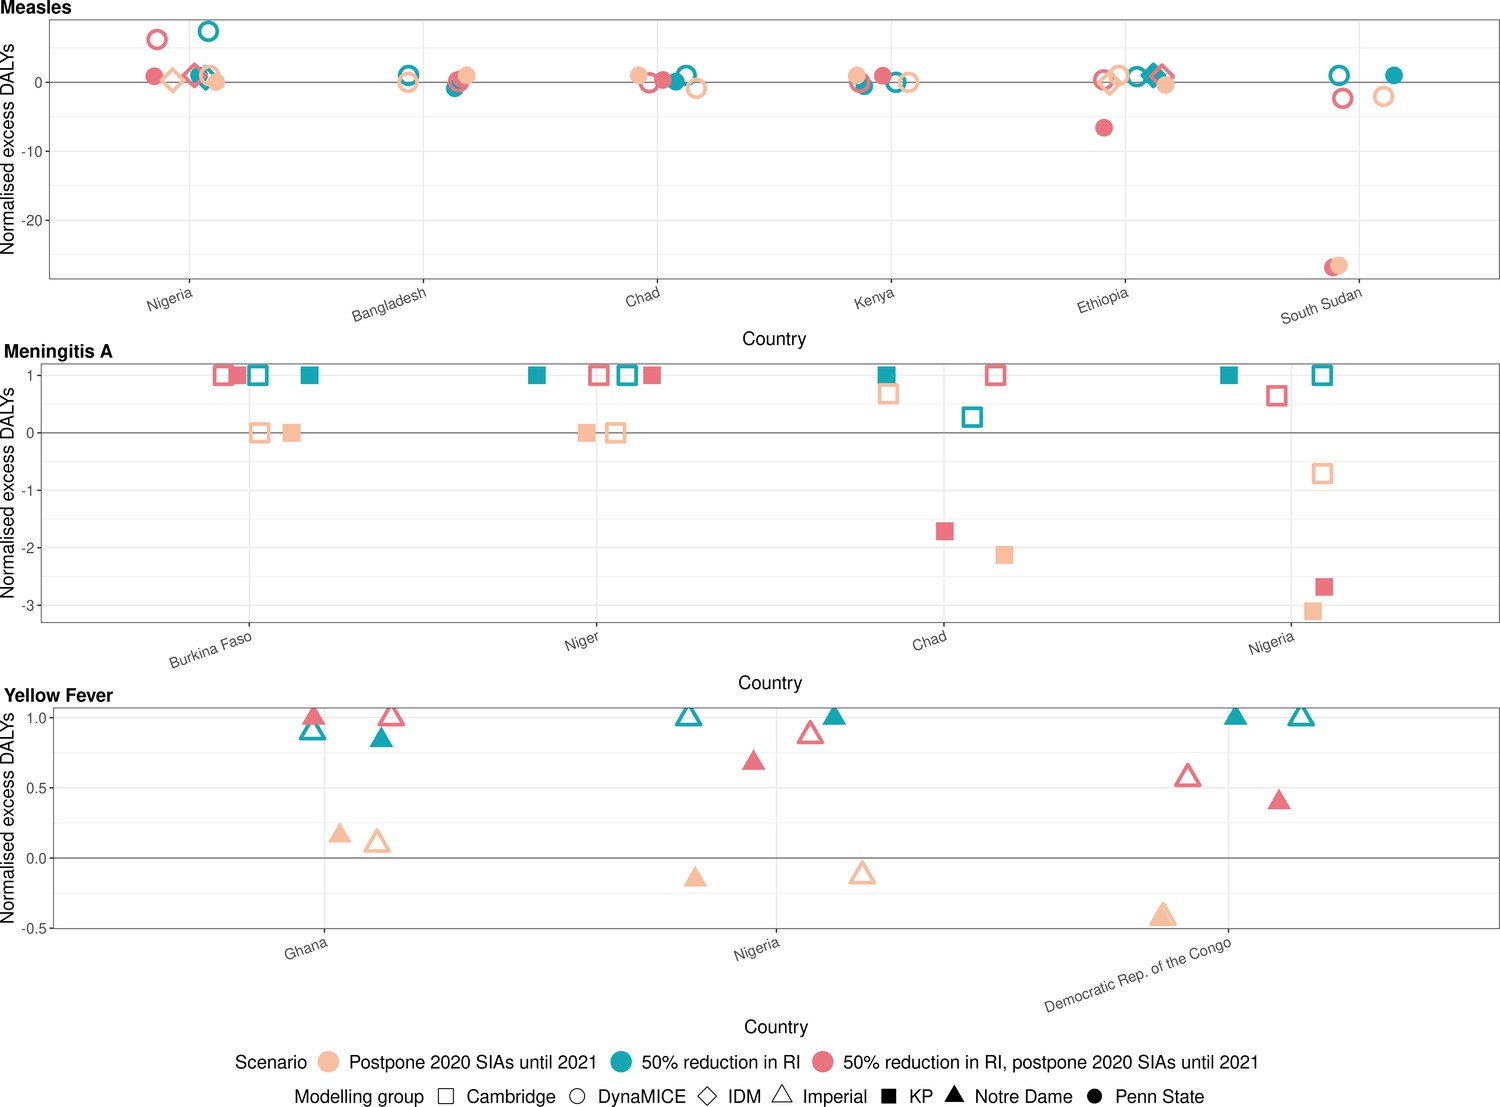
Health impact of normalised excess disability-adjusted life years for immunisation disruption scenarios in comparison to no disruption scenario for measles, meningococcal A, and yellow fever.
The normalised model-predicted excess disability-adjusted life years (DALYs) per year for routine immunisation (RI) and campaign immunisation (SIAs – supplementary immunisation activities) disruption scenarios in comparison to no disruption scenario (BAU – business-as-usual scenario) for measles, meningococcal A, and yellow fever. Excess DALYs are summed over 2020–2030, and the excess DALYs are normalised by setting the BAU to 0 and maximum to 1.
Appendix 1—figure 5
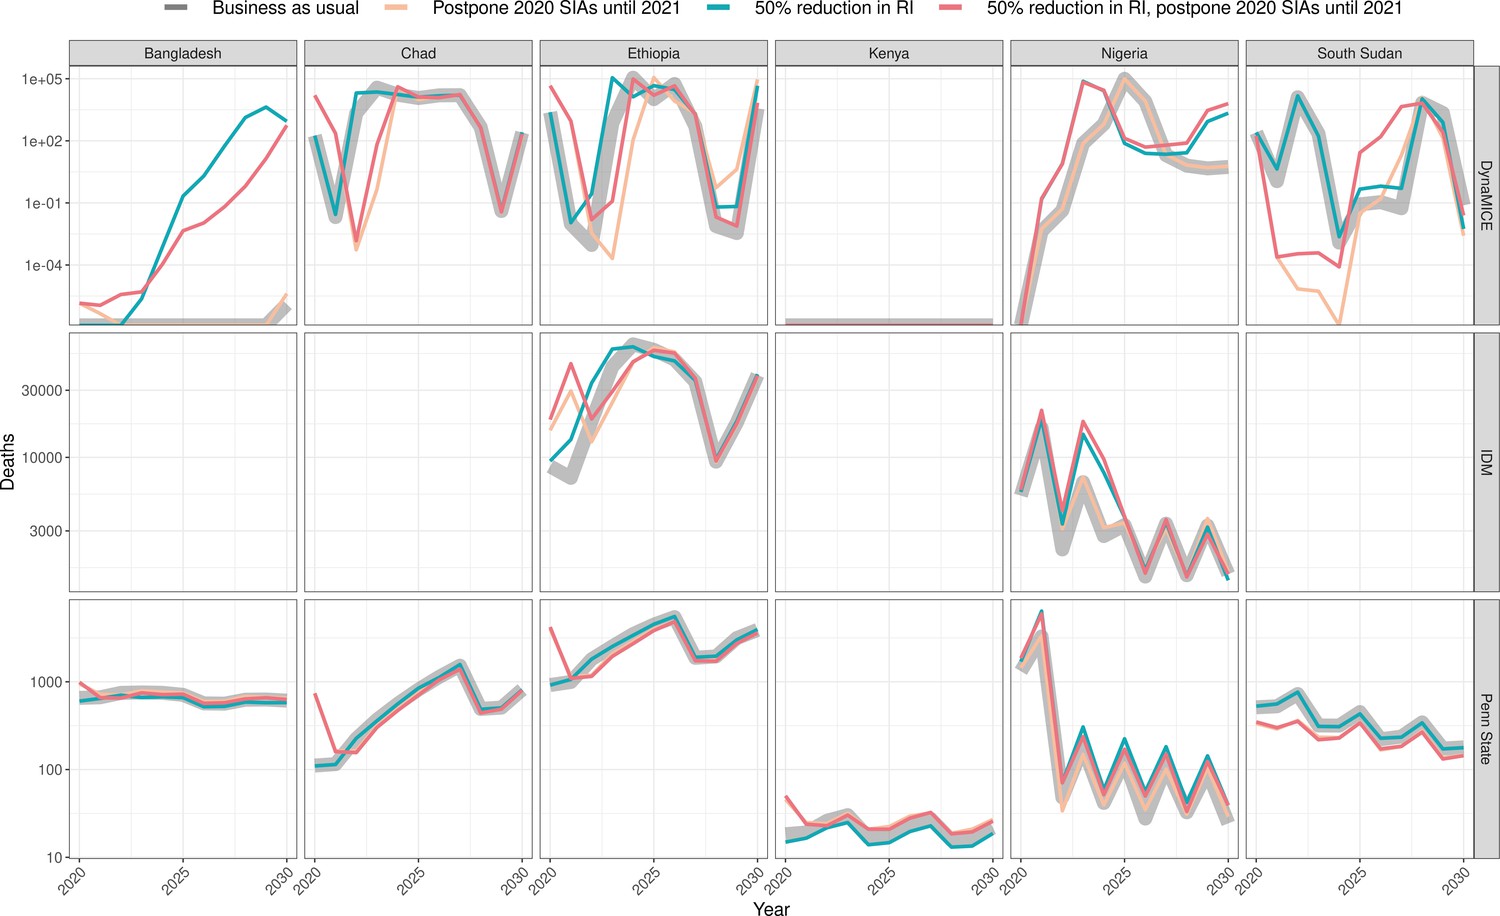
Health impact of predicted total deaths for immunisation disruption scenarios and no disruption scenario for measles.
Model-predicted total deaths per year for routine immunisation (RI) and campaign immunisation (SIAs – supplementary immunisation activities) disruption scenarios and no disruption scenario (BAU – business-as-usual scenario) for measles during 2020–2030 per modelling group.
Appendix 1—figure 6
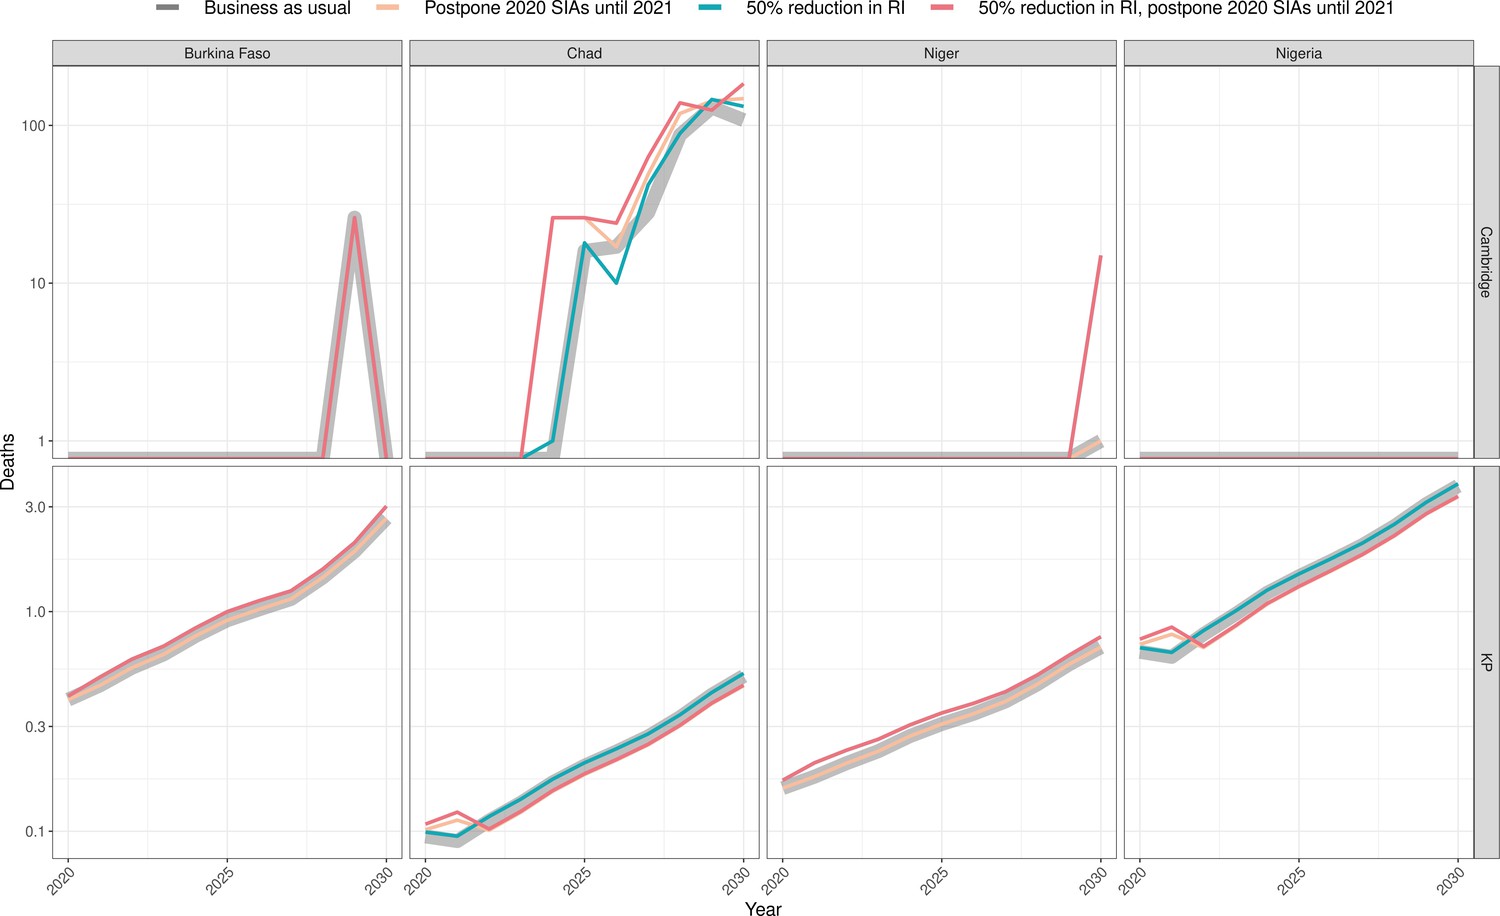
Health impact of predicted total deaths for immunisation disruption scenarios and no disruption scenario for meningococcal A.
Model-predicted total deaths per year for routine immunisation (RI) and campaign immunisation (SIAs – supplementary immunisation activities) disruption scenarios and no disruption scenario (BAU – business-as-usual scenario) for meningococcal A during 2020–2030 per modelling group.
Appendix 1—figure 7
Health impact of predicted total deaths for immunisation disruption scenarios and no disruption scenario for yellow fever.
Model-predicted total deaths per year for routine immunisation (RI) and campaign immunisation (SIAs – supplementary immunisation activities) disruption scenarios and no disruption scenario (BAU – business-as-usual scenario) for yellow fever during 2020–2030 per modelling group.
Tables
Table 1
a Vaccine impact models – Summary characteristics of the transmission dynamic vaccine impact models for measles (three models).
For IDM, separate information is shown for the models used for Ethiopia and Nigeria.
| Infection | Measles | Measles | Measles | Measles |
|---|---|---|---|---|
| Model name | DynaMICE | IDM (Ethiopia) | IDM (Nigeria) | Penn State |
| Reference | Verguet et al., 2015 | Thakkar et al., 2019 | Zimmermann et al., 2019 | Chen et al., 2012 |
| Structure | Compartmental | Compartmental | Agent-based | Semi-mechanistic |
| Randomness | Deterministic | Stochastic | Stochastic | Stochastic |
| Time step | Weekly | Semi-monthly | Daily | Annual |
| Age stratification | Yes | No | Yes | Yes |
| Model fitting | Not fitted; uses country-specific Ro (basic reproduction number) for measles from fitted models | Fitted to observed monthly WHO case data (2011–2019) | Fitted to time-series, age-distribution, and spatial correlation between districts in case-based surveillance data. | Fitted to observed annual WHO case data (1980–2017) |
| Validation | Validated through comparisons to the Penn State and/or IDM models in two previous model comparison exercises (Li et al., 2021; WHO, 2019a). Has also been reviewed by WHO’s Immunization and Vaccines Implementation Research Advisory Committee (IVIR-AC)(WHO, 2019b) | Validated primarily via forecasting tests in Pakistan and Nigeria. For example, see Figure S10 in Thakkar et al., 2019. | Calibrated to reproduce regional time series and age distributions of historical measles incidence as presented in Zimmermann et al., 2019. Validated through comparison to the DynaMICE and Penn State models in a previous model comparison exercise (WHO, 2019a) | Model and performance of parameter estimation was validated through simulation experiments as described in Eilertson et al., 2019. Validated through comparisons to the DynaMICE and/or IDM models in two previous model comparison exercises (Li et al., 2021; WHO, 2019a). Has also been reviewed by WHO’s Immunization and Vaccines Implementation Research Advisory Committee (IVIR-AC) in 2017 and 2019 (WHO, 2019b). |
| Case importations | None | None | Random | Random |
| Dose dependency (SIA: supplementary immunisation activities, MCV1: measles 1st dose, MCV2: measles 2nd dose) | SIA doses are weakly dependent of MCV1/2 based on Portnoy et al., 2018 | MCV2 given only to recipients of MCV1; SIA doses independent of MCV1/2 | MCV2 given only to recipients of MCV1; SIA doses independent of MCV1/2 | |
| Countries modelled | Bangladesh, Chad, Ethiopia, Kenya, Nigeria, South Sudan | Ethiopia | Nigeria | Bangladesh, Chad, Ethiopia, Kenya, Nigeria, South Sudan |
| b. Vaccine impact models – Summary characteristics of the transmission dynamic vaccine impact models for meningococcal A (two models). | ||
|---|---|---|
| Infection | MenA | MenA |
| Model name | Cambridge | KP |
| Reference | Karachaliou et al., 2015 | Jackson et al., 2018 |
| Structure | Compartmental | Compartmental |
| Randomness | Stochastic | Stochastic |
| Time step | Daily | Weekly |
| Age stratification | Yes | Yes |
| Model fitting | Not fitted; calibrated by comparing the predictions to evidence on carriage prevalence by age, disease incidence by age, total annual incidence, seasonality and periodicity | Fitted to carriage prevalence and disease incidence data for Burkina Faso; calibrated for other regions by comparing seasonality and incidence by age to disease surveillance data |
| Validation | Peer-review, including by IVIR-AC; two publications Karachaliou et al., 2015; Karachaliou Prasinou et al., 2021; calibration to observed data (although not formally fitted); | Peer-review of two publications Jackson et al., 2018; Tartof et al., 2013; out-of-sample validation on incidence after vaccine introduction in Burkina Faso |
| Case importations | None | Infectious people immigrate at a rate of 0.1–1 per million population per week |
| Dose dependency | Not applicable since 2020 campaigns are targeting population missed by the introductory campaign who are too old for routine immunisation | Campaigns preferentially target unvaccinated persons |
| Countries modelled | Burkina Faso, Chad, Niger, Nigeria | |
| c. Vaccine impact models – Summary characteristics of the transmission dynamic vaccine impact models for yellow fever (two models). | ||
|---|---|---|
| Infection | Yellow fever | Yellow fever |
| Model name | Imperial | Notre Dame |
| Reference | Gaythorpe et al., 2021b | Perkins et al., 2021 |
| Structure | Semi-mechanistic | Semi-mechanistic |
| Randomness | Deterministic | Deterministic |
| Time step | Annual | Annual |
| Age stratification | Yes | Yes |
| Model fitting | Bayesian framework fitted to occurrence and serology data | Bayesian framework fitted to incidence and serology data |
| Validation | Peer-review (two publications Garske et al.; Gaythorpe et al. and EYE strategy); calibration to serological survey data and outbreak occurrence data within Bayesian framework. Compared model structures. | Calibration to serological and case data. Cross-validation of multiple alternative models used to inform the construction of a single ensemble prediction via stacked generalization. |
| Case importations | None | None |
| Dose dependency | Random | Random |
| Countries modelled | Democratic Republic of the Congo, Ghana, Nigeria | |
Table 2
Immunisation scenarios.
Scenarios for disruption of routine immunisation and delay of mass vaccination campaigns due to the COVID-19 pandemic for measles vaccination in six countries, meningococcal A vaccination in four countries, and yellow fever vaccination in three countries. The counterfactual comparative scenario (BAU – business as usual) is no disruption to routine or campaign immunisation.
| Immunisation scenario | Routine immunisation (RI) | Campaign immunisation/ Supplementary immunisation activities (SIAs) |
|---|---|---|
| BAU | No disruption | No disruption |
| Postpone 2020 SIAs - > 2021 | No disruption | Postpone 2020 SIAs to 2021 |
| 50% RI | 50% reduction on RI for 2020 | No disruption |
| 50% RI, postpone 2020 SIAs - > 2021 | 50% reduction on RI for 2020 | Postpone 2020 SIAs to 2021 |
Table 3
Excess deaths per 100,000 between 2020 and 2030 per scenario, infection and modelling group.
Scenarios for disruption of routine immunisation and delay of mass vaccination campaigns due to the COVID-19 pandemic for measles vaccination in six countries, meningococcal A vaccination in four countries, and yellow fever vaccination in three countries. The counterfactual comparative scenario (BAU – business as usual) is no disruption to routine immunisation (RI) or campaign immunisation (SIAs – supplementary immunisation activities). The total of pathogen averages is the sum of the average excess deaths per 100,000 between 2020 and 2030 for each pathogen.
| Scenario | Measles, DynaMICE | Measles, IDM | Measles, Penn State | Men A, Cambridge | Men A, KP | Yellow fever, Imperial | Yellow fever, Notre Dame | Total of pathogen averages |
|---|---|---|---|---|---|---|---|---|
| 50% RI | 1.1569 | 1.1873 | 0.0501 | 0.0020 | 0.0001 | 0.1474 | 0.0755 | 0.9105 |
| Postpone 2020 SIAs - > 2021 | 0.9428 | 0.1248 | −0.0104 | 0.0042 | −0.0001 | −0.0584 | −0.0103 | 0.3202 |
| 50% RI, postpone 2020 SIAs - > 2021 | 0.2401 | 1.3134 | 0.0222 | 0.0064 | 0.0000 | 0.0876 | 0.0536 | 0.5990 |
Appendix 1—table 1
Excess disability-adjusted life years (DALYs) per 100,000 between 2020 and 2030 per scenario, infection and modelling group.
Scenarios for disruption of routine immunisation (RI) and delay of mass vaccination campaigns (SIAs – supplementary immunisation activities) due to the COVID-19 pandemic for measles vaccination in six countries, meningococcal A vaccination in four countries, and yellow fever vaccination in three countries. The counterfactual comparative scenario (BAU – business as usual) is no disruption to routine or campaign immunisation.
| Scenario | Measles, DynaMICE | Measles, IDM | Measles, Penn State | Men A, Cambridge | Men A, KP | Yellow fever, Imperial | Yellow fever, Notre Dame |
|---|---|---|---|---|---|---|---|
| 50% RI | 79.2110 | 68.5537 | 2.7503 | 0.1175 | 0.0037 | 9.3283 | 4.3831 |
| Postpone 2020 SIAs - > 2021 | 69.9709 | 5.7308 | −0.0990 | 0.2650 | −0.0027 | −2.7355 | −0.5797 |
| 50% RI, postpone 2020 SIAs - > 2021 | 17.0570 | 74.0683 | 1.6898 | 0.4017 | 0.0004 | 6.5284 | 3.1370 |
Appendix 1—table 2
Excess measles deaths per 100,000 between 2020 and 2030 per scenario, country and modelling group.
The counterfactual comparative scenario (BAU – business as usual) is no disruption to routine immunisation (RI) or campaign immunisation (SIAs – supplementary immunisation activities). Countries shown are Bangladesh (BGD), Ethiopia (ETH), Kenya (KEN), Nigeria (NGA), South Sudan (SSD), and Chad (TCD).
| Country | 50% RI, DynaMICE | 50% RI, IDM | 50% RI, Penn State | Postpone 2020 SIAs - > 2021, DynaMICE | Postpone 2020 SIAs - > 2021, IDM | Postpone 2020 SIAs - > 2021, Penn State | 50% RI, postpone 2020 SIAs - > 2021, DynaMICE | 50% RI, postpone 2020 SIAs - > 2021, IDM | 50% RI, postpone 2020 SIAs - > 2021, Penn State |
|---|---|---|---|---|---|---|---|---|---|
| BGD | 0.35 | NA | −0.03 | 0 | NA | 0.03 | 0.03 | NA | 0.01 |
| ETH | 4.67 | 2.1 | 0 | 5.56 | −0.19 | −0.03 | 2.05 | 1.82 | −0.07 |
| KEN | 0 | NA | −0.01 | 0 | NA | 0.01 | 0 | NA | 0.01 |
| NGA | −0.12 | 0.68 | 0.15 | −0.02 | 0.3 | 0.01 | −0.09 | 1.03 | 0.13 |
| SSD | 3.28 | NA | 0.03 | −6.73 | NA | −0.95 | −7.65 | NA | −0.96 |
| TCD | 2.45 | NA | 0.02 | −2.13 | NA | 0.12 | −0.16 | NA | 0.01 |
Appendix 1—table 3
Excess measles deaths between 2020 and 2030 per scenario, country and modelling group.
The counterfactual comparative scenario (BAU – business as usual) is no disruption to routine immunisation (RI) or campaign immunisation (SIAs – supplementary immunisation activities). Countries shown are Bangladesh (BGD), Ethiopia (ETH), Kenya (KEN), Nigeria (NGA), South Sudan (SSD), and Chad (TCD).
| Country | 50% RI, DynaMICE | 50% RI, IDM | 50% RI, Penn State | Postpone 2020 SIAs - > 2021, DynaMICE | Postpone 2020 SIAs - > 2021, IDM | Postpone 2020 SIAs - > 2021, Penn State | 50% RI, postpone 2020 SIAs - > 2021, DynaMICE | 50% RI, postpone 2020 SIAs - > 2021, IDM | 50% RI, postpone 2020 SIAs - > 2021, Penn State |
|---|---|---|---|---|---|---|---|---|---|
| BGD | 6552 | NA | −539 | 0 | NA | 593 | 578 | NA | 276 |
| ETH | 66678 | 29951 | 40 | 79384 | −2783 | −473 | 29241 | 25981 | −946 |
| KEN | 0 | NA | −40 | 0 | NA | 64 | 0 | NA | 59 |
| NGA | −3016 | 17545 | 3919 | −634 | 7777 | 137 | −2430 | 26559 | 3427 |
| SSD | 4493 | NA | 44 | −9229 | NA | −1298 | −10485 | NA | −1316 |
| TCD | 5125 | NA | 35 | −4460 | NA | 260 | −333 | NA | 29 |
Appendix 1—table 4
Excess meningococcal A deaths per 100,000 between 2020 and 2030 per scenario, country and modelling group.
The counterfactual comparative scenario (BAU – business as usual) is no disruption to routine immunisation (RI) or campaign immunisation (SIAs – supplementary immunisation activities). Countries shown are Burkina Faso (BFA), Niger (NER), Nigeria (NGA), and Chad (TCD).
| Country | 50% RI, Cambridge | 50% RI, KP | Postpone 2020 SIAs - > 2021, Cambridge | Postpone 2020 SIAs - > 2021, KP | 50% RI, postpone 2020 SIAs - > 2021, Cambridge | 50% RI, postpone 2020 SIAs - > 2021, KP |
|---|---|---|---|---|---|---|
| BFA | 0 | 0 | 0 | 0 | 0 | 0 |
| NER | 0 | 0 | 0 | 0 | 0 | 0 |
| NGA | 0 | 0 | 0 | 0 | 0 | 0 |
| TCD | 0.02 | 0 | 0.07 | 0 | 0.1 | 0 |
Appendix 1—table 5
Excess meningococcal A deaths between 2020 and 2030 per scenario, country and modelling group.
The counterfactual comparative scenario (BAU – business as usual) is no disruption to routine immunisation (RI) or campaign immunisation (SIAs – supplementary immunisation activities). Countries shown are Burkina Faso (BFA), Niger (NER), Nigeria (NGA), and Chad (TCD).
| Country | 50% RI, Cambridge | 50% RI, KP | Postpone 2020 SIAs - > 2021, Cambridge | Postpone 2020 SIAs - > 2021, KP | 50% RI, postpone 2020 SIAs - > 2021, Cambridge | 50% RI, postpone 2020 SIAs - > 2021, KP |
|---|---|---|---|---|---|---|
| BFA | 0 | 1 | 0 | 0 | 0 | 1 |
| NER | 14 | 0 | 0 | 0 | 14 | 0 |
| NGA | 0 | 0 | 0 | -2 | 0 | -1 |
| TCD | 52 | 0 | 142 | 0 | 201 | 0 |
Appendix 1—table 6
Excess yellow fever deaths per 100,000 between 2020 and 2030 per scenario, country and modelling group.
The counterfactual comparative scenario (BAU – business as usual) is no disruption to routine immunisation (RI) or campaign immunisation (SIAs – supplementary immunisation activities). Countries shown are the Democratic Republic of Congo (COD), Ghana (GHA) and Nigeria (NGA).
| Country | 50% RI, Imperial | 50% RI, Notre Dame | Postpone 2020 SIAs - > 2021, Imperial | Postpone 2020 SIAs - > 2021, Notre Dame | 50% RI, postpone 2020 SIAs - > 2021, Imperial | 50% RI, postpone 2020 SIAs - > 2021, Notre Dame |
|---|---|---|---|---|---|---|
| COD | 0.38 | 0.01 | −0.23 | −0.01 | 0.15 | 0 |
| GHA | 0.33 | 0.07 | 0.06 | 0.02 | 0.39 | 0.1 |
| NGA | 0.02 | 0.1 | 0 | −0.02 | 0.01 | 0.07 |
Appendix 1—table 7
Excess yellow fever deaths between 2020 and 2030 per scenario, country and modelling group.
The counterfactual comparative scenario (BAU – business as usual) is no disruption to routine immunisation (RI) or campaign immunisation (SIAs – supplementary immunisation activities). Countries shown are the Democratic Republic of Congo (COD), Ghana (GHA), and Nigeria (NGA).
| Country | 50% RI, Imperial | 50% RI, Notre Dame | Postpone 2020 SIAs - > 2021, Imperial | Postpone 2020 SIAs - > 2021, Notre Dame | 50% RI, postpone 2020 SIAs - > 2021, Imperial | 50% RI, postpone 2020 SIAs - > 2021, Notre Dame |
|---|---|---|---|---|---|---|
| COD | 4379 | 137 | −2590 | −88 | 1731 | 25 |
| GHA | 1241 | 281 | 239 | 94 | 1481 | 375 |
| NGA | 421 | 2675 | −45 | −426 | 377 | 1798 |
Appendix 1—table 8
Excess measles deaths per 100,000 per year between 2020 and 2030 per scenario, year and modelling group.
The counterfactual comparative scenario (BAU – business as usual) is no disruption to routine immunisation (RI) or campaign immunisation (SIAs – supplementary immunisation activities).
| Year | 50% RI, DynaMICE | 50% RI, IDM | 50% RI, Penn State | Postpone 2020 SIAs - > 2021, DynaMICE | Postpone 2020 SIAs - > 2021, IDM | Postpone 2020 SIAs - > 2021, Penn State | 50% RI, postpone 2020 SIAs - > 2021, DynaMICE | 50% RI, postpone 2020 SIAs - > 2021, IDM | 50% RI, postpone 2020 SIAs - > 2021, Penn State |
|---|---|---|---|---|---|---|---|---|---|
| 2020 | 0 | 0.34 | 0.06 | 10.46 | 2.32 | 0.7 | 10.46 | 3.25 | 0.82 |
| 2021 | 0 | 2.7 | 0.55 | 0.19 | 8.32 | 0.02 | 0.2 | 13.55 | 0.44 |
| 2022 | 3.44 | 4.98 | 0 | −2.52 | −1.27 | −0.19 | −2.52 | 0.77 | −0.2 |
| 2023 | 28.56 | 6.57 | 0 | −6.31 | −5.48 | −0.1 | 4.96 | −0.96 | −0.12 |
| 2024 | −11.77 | 0.72 | −0.03 | −14.68 | −4.5 | −0.12 | 5.96 | −2.48 | −0.16 |
| 2025 | −9.82 | −1.52 | 0.02 | 16.07 | 0.67 | −0.1 | −14.65 | 0.03 | −0.13 |
| 2026 | −5.38 | −0.26 | 0.01 | −7.57 | 1.83 | −0.1 | −3.38 | 1.51 | −0.11 |
| 2027 | 0.24 | 0.23 | 0.02 | 0.37 | 0.36 | −0.03 | 1.08 | 0.6 | −0.04 |
| 2028 | 0.79 | 0.08 | 0 | 0.88 | −0.02 | −0.03 | −0.02 | 0.01 | −0.05 |
| 2029 | 0.55 | 0.09 | −0.02 | −0.3 | −0.03 | −0.05 | 0.15 | −0.16 | −0.06 |
| 2030 | 6.55 | 0.09 | 0 | 12.95 | −0.26 | −0.04 | 1.45 | −0.1 | −0.05 |
Appendix 1—table 9
Excess meningococcal A deaths per 100,000 per year between 2020 and 2030 per scenario, year and modelling group.
The counterfactual comparative scenario (BAU – business as usual) is no disruption to routine immunisation (RI) or campaign immunisation (SIAs – supplementary immunisation activities).
| Year | 50% RI, Cambridge | 50% RI, KP | Postpone 2020 SIAs - > 2021, Cambridge | Postpone 2020 SIAs - > 2021, KP | 50% RI, postpone 2020 SIAs - > 2021, Cambridge | 50% RI, postpone 2020 SIAs - > 2021, KP |
|---|---|---|---|---|---|---|
| 2020 | 0 | 0 | 0 | 0 | 0 | |
| 2021 | 0 | 0 | 0 | 0 | 0 | 0 |
| 2022 | 0 | 0 | 0 | 0 | 0 | 0 |
| 2023 | 0 | 0 | 0 | 0 | 0 | 0 |
| 2024 | 0 | 0 | 0.01 | 0 | 0.01 | 0 |
| 2025 | 0 | 0 | 0 | 0 | 0 | 0 |
| 2026 | 0 | 0 | 0 | 0 | 0 | 0 |
| 2027 | 0 | 0 | 0.01 | 0 | 0.01 | 0 |
| 2028 | 0 | 0 | 0.01 | 0 | 0.02 | 0 |
| 2029 | 0 | 0 | 0 | 0 | 0 | 0 |
| 2030 | 0.01 | 0 | 0.01 | 0 | 0.03 | 0 |
Appendix 1—table 10
Excess yellow fever deaths per 100,000 per year between 2020 and 2030 per scenario, year and modelling group.
The counterfactual comparative scenario (BAU – business as usual) is no disruption to routine immunisation (RI) or campaign immunisation (SIAs – supplementary immunisation activities).
| Year | 50% RI, Imperial | 50% RI, Notre Dame | Postpone 2020 SIAs - > 2021, Imperial | Postpone 2020 SIAs - > 2021, Notre Dame | 50% RI, postpone 2020 SIAs - > 2021, Imperial | 50% RI, postpone 2020 SIAs - > 2021, Notre Dame |
|---|---|---|---|---|---|---|
| 2020 | 0.28 | 0.12 | 1.7 | 0 | 2.02 | 0.12 |
| 2021 | 0.22 | 0.12 | −0.36 | 0.86 | −0.15 | 0.98 |
| 2022 | 0.18 | 0.09 | −0.29 | −0.14 | −0.12 | −0.07 |
| 2023 | 0.16 | 0.08 | −0.25 | −0.12 | −0.1 | 0.05 |
| 2024 | 0.13 | 0.07 | −0.2 | −0.1 | −0.07 | 0.04 |
| 2025 | 0.13 | 0.07 | −0.19 | −0.09 | −0.07 | −0.04 |
| 2026 | 0.12 | 0.06 | −0.18 | −0.09 | −0.07 | −0.04 |
| 2027 | 0.12 | 0.06 | −0.18 | −0.09 | −0.06 | −0.04 |
| 2028 | 0.11 | 0.06 | −0.17 | −0.09 | −0.06 | −0.04 |
| 2029 | 0.11 | 0.06 | −0.16 | −0.08 | −0.06 | −0.04 |
| 2030 | 0.11 | 0.06 | −0.16 | −0.08 | −0.06 | −0.04 |
Appendix 1—table 11
Excess deaths between 2020 and 2030 per scenario, infection and modelling group.
Scenarios for disruption of routine immunisation and delay of mass vaccination campaigns due to the COVID-19 pandemic for measles vaccination in six countries, meningococcal A vaccination in four countries, and yellow fever vaccination in three countries. The counterfactual comparative scenario (BAU – business as usual) is no disruption to routine immunisation (RI) or campaign immunisation (SIAs – supplementary immunisation activities).
| Scenario | Measles, DynaMICE | Measles, IDM* | Measles, Penn State | Men A, Cambridge | Men A, KP | Yellow fever, Imperial | Yellow fever, Notre Dame | Total of pathogen averages# |
|---|---|---|---|---|---|---|---|---|
| 50% RI | 79832.13 | 47495.71 | 3459.278 | 66 | 2.174381 | 6042.15 | 3093.147 | 68265.66 |
| Postpone 2020 SIAs - > 2021 | 65061.76 | 4994.18 | −715.324 | 142 | −1.78694 | −2395.67 | −420.914 | 33689.78 |
| 50% RI, postpone 2020 SIAs - > 2021 | 16570.58 | 52540.42 | 1529.764 | 215 | 0.06521 | 3589.54 | 2197.85 | 37556.73 |
-
* Measles IDM covers only two countries.
# Total of pathogen averages exclude Measles IDM as this covers only two countries.
Appendix 1—table 12
Percentage differences in deaths from baseline between 2020 and 2030 per scenario.
Scenarios for disruption of routine immunisation and delay of mass vaccination campaigns due to the COVID-19 pandemic for measles vaccination in six countries, meningococcal A vaccination in four countries, and yellow fever vaccination in three countries. The counterfactual comparative scenario (BAU – business as usual) is no disruption to routine immunisation (RI) or campaign immunisation (SIAs – supplementary immunisation activities).
| Scenario | Percentage difference from baseline |
|---|---|
| 50% RI | 9.885481 |
| Postpone 2020 SIAs - > 2021 | 3.780423 |
| 50% RI, postpone 2020 SIAs - > 2021 | 4.802334 |
Appendix 1—table 13
Percentage differences in deaths from baseline between 2020 and 2030 per scenario, infection and modelling group.
Scenarios for disruption of routine immunisation and delay of mass vaccination campaigns due to the COVID-19 pandemic for measles vaccination in six countries, meningococcal A vaccination in four countries, and yellow fever vaccination in three countries. The counterfactual comparative scenario (BAU – business as usual) is no disruption to routine immunisation (RI) or campaign immunisation (SIAs – supplementary immunisation activities).
| Scenario | Measles, DynaMICE | Measles, IDM | Measles, Penn State | Men A, Cambridge | Men A, KP | Yellow fever, Imperial | Yellow fever, Notre Dame |
|---|---|---|---|---|---|---|---|
| 50% RI | 19.1957 | 11.9708 | 6.4030 | 15.9806 | 5.8875 | 2.5026 | 1.9177 |
| Postpone 2020 SIAs - > 2021 | 15.6442 | 1.2587 | −1.3240 | 34.3826 | −4.8384 | −0.9923 | −0.2610 |
| 50% RI, postpone 2020 SIAs - > 2021 | 3.9844 | 13.2423 | 2.8315 | 52.0581 | 0.1766 | 1.4868 | 1.3626 |
Appendix 1—table 14
Coverage assumptions for the counterfactual comparative scenario (BAU – business as usual), determined through consultation with disease and immunisation programme experts across partners at the global, regional, and national levels.
| Assumption | Measles MCV1: 1 st dose measles vaccine, MCV2: 2nd dose measles vaccine | Yellow fever (YF) | Meningococcal A (Men A) (For countries that have introduced routine) |
|---|---|---|---|
| Routine coverage 2020–2030 (historical coverage from WUENIC – WHO and UNICEF Estimates of National Immunization Coverage) | MCV1: Mean of 2015–2019 coverage MCV2: Highest coverage in 2015–2019 If no MCV2 coverage in 2015–19, assume 50% of MCV1 mean coverage for 2015–19 | YF: Mean of 2015–2019 coverage If no YF coverage in 2015–19, use MCV1 mean coverage for 2015–19 | MenA: Highest coverage in 2015–2019. If no coverage available (for 1 + full years), use MCV1 mean coverage for 2015–19 Exception: where Men A intro age is ≥ 15 m, use MCV2 highest coverage in 2015–19 |
| Vaccine introductions | Assume all countries introduce MCV2 in 2022 if they have not already | Assume all countries introduce YF in 2022 if they have not already | N/A |
| Campaign frequency | Use historic frequency: interval between last two prospectively planned national SIAs (supplementary immunisation activities) | 2019 and 2020 completed and planned campaigns (both planned and reactive) 2021–2030: Mass preventive campaigns as recommended by the WHO EYE strategy (2016), with updated sequencing; no reactive campaigns | 2019 and 2020 completed and planned campaigns 2021–2030: Assume no campaigns |
| Campaign coverage | Use coverage of last national SIA | Assume 85% coverage of the subnational target population for all future campaigns in 2020–2030 (and for 2019 campaigns if actual coverage unavailable). | 2019 and 2020 actual/forecast campaign coverage level |
Appendix 1—table 15
Glossary of terms.
| Term | Description |
|---|---|
| Country | BFA: Burkina Faso BGD: Bangladesh COD: Democratic Republic of the Congo (DRC) ETH: Ethiopia GHA: Ghana KEN: Kenya NER: Niger NGA: Nigeria SSD: South Sudan TCD: Chad |
| Vaccine | MCV1: 1 st dose measles vaccine, MCV2: 2nd dose measles vaccine, YF: yellow fever vaccine, MenA: meningococcal A vaccine |
| Year | Year of vaccination |
| Age from | Minimum age (in years) of the target population |
| Age to | Maximum age (in years) of the target population |
| Age range verbatim | Age of the target population, as provided by WHO or other coverage source |
| Coverage (national level) | Percentage of the target population vaccinated, specified at a national level. |
| Target (national level) | Number of people in the target age range, in the entire country. |
| Subnational campaign | Campaigns which took place sub-nationally, rather than across the whole country. |
| Number vaccinated | Number of individuals vaccinated in a campaign. Where necessary, a demographic cap was applied to constrain the number vaccinated to be no higher than UNWPP records of the total number in the target age group. (UNWPP: United Nations World Population Prospects, 2019 Revision). |
| Affected by COVID-19 | Values are shown for 2020 campaigns only. FALSE: 2020 campaigns unaffected by COVID-19, for example campaigns which took place in early 2020. These campaigns are retained in all disruption scenarios. |
Appendix 1—table 16
Routine coverage values used for the counterfactual comparative (business-as-usual) scenario, following the assumptions in Appendix 1—table 14.
Target population taken from United Nations World Population Prospects (UNWPP) 2019 revision. Countries: Burkina Faso (BFA), Bangladesh (BGD), Democratic Republic of the Congo (COD), Ethiopia (ETH), Ghana (GHA), Kenya (KEN), Niger (NER), Nigeria (NGA), South Sudan (SSD), Chad (TCD). Vaccines: 1st dose measles vaccine (MCV1), 2nd dose measles vaccine (MCV2), yellow fever vaccine (YF), meningococcal A vaccine (MenA).
| Country | Vaccine | Year | Age from | Age to | Coverage (national level) |
|---|---|---|---|---|---|
| BFA | MenA | 2020–2030 | 0 | 0 | 85% |
| BGD | MCV1 | 2020–2030 | 0 | 0 | 97% |
| MCV2 | 2020–2030 | 2 | 2 | 93% | |
| COD | YF | 2020–2030 | 0 | 0 | 74% |
| ETH | MCV1 | 2020–2030 | 0 | 0 | 64% |
| MCV2 | 2020–2030 | 2 | 2 | 31% | |
| GHA | YF | 2020–2030 | 0 | 0 | 89% |
| KEN | MCV1 | 2020–2030 | 0 | 0 | 92% |
| MCV2 | 2020–2030 | 2 | 2 | 45% | |
| NER | MenA | 2020–2030 | 0 | 0 | 96% |
| NGA | MCV1 | 2020–2030 | 0 | 0 | 61% |
| MCV2 | 2020–2030 | 2 | 2 | 19% | |
| MenA | 2020–2030 | 0 | 0 | 61% | |
| YF | 2020–2030 | 0 | 0 | 60% | |
| SSD | MCV1 | 2020–2030 | 0 | 0 | 51% |
| TCD | MCV1 | 2020–2030 | 0 | 0 | 39% |
| TCD | MenA | 2020–2030 | 0 | 0 | 70% |
Appendix 1—table 17
Campaign coverage values used for the counterfactual comparative (business-as-usual) scenario, following the assumptions in Appendix 1—table 14.
Countries: Bangladesh (BGD), Democratic Republic of the Congo (COD), Ethiopia (ETH), Ghana (GHA), Kenya (KEN), Nigeria (NGA), South Sudan (SSD), Chad (TCD).
| Country | Vaccine | Year | Age_ from | Age_ to | Age range verbatim | Coverage (national level) | Target (national level) | Subnational campaign | Number vaccinated | Affected by covid-19 |
|---|---|---|---|---|---|---|---|---|---|---|
| BGD | Measles | 2020 | 1 | 9 | 6M-9Y | 1% | 26,123,496 | yes | 292,437 | FALSE |
| BGD | Measles | 2020 | 1 | 9 | 9M-9Y | 100% | 26,123,496 | no | 26,123,496 | |
| BGD | Measles | 2026 | 1 | 4 | 93% | 10,972,070 | no | 10,204,025 | ||
| COD | YF | 2020 | 1 | 60 | 9M-60Y | 10% | 82,362,957 | yes | 8,468,874 | |
| COD | YF | 2020 | 1 | 60 | 9M-60Y | 8% | 82,362,957 | yes | 6,707,043 | |
| COD | YF | 2021 | 1 | 60 | 9M-60Y | 25% | 84,982,979 | yes | 21,179,612 | |
| COD | YF | 2022 | 1 | 60 | 9M-60Y | 17% | 87,641,611 | yes | 14,875,225 | |
| COD | YF | 2023 | 1 | 60 | 9M-60Y | 14% | 90,340,189 | yes | 12,357,393 | |
| COD | YF | 2024 | 1 | 60 | 9M-60Y | 18% | 93,082,143 | yes | 17,200,562 | |
| ETH | Measles | 2019 | 1 | 14 | 6 M-59M; 6M-14Y | 3% | 41,766,446 | yes | 1,230,934 | |
| ETH | Measles | 2020 | 1 | 4 | 6–59 M | 100% | 13,314,425 | no | 13,314,425 | |
| ETH | Measles | 2027 | 1 | 4 | 93% | 14,462,250 | no | 13,449,892 | ||
| GHA | YF | 2020 | 10 | 60 | 10-60Y | 22% | 21,527,602 | yes | 4,758,966 | |
| KEN | Measles | 2020 | 1 | 4 | 9–59 M | 100% | 5,625,900 | no | 5,625,900 | |
| KEN | Measles | 2024 | 1 | 4 | 95% | 5,839,639 | no | 5,547,657 | ||
| KEN | Measles | 2028 | 1 | 4 | 95% | 6,220,262 | no | 5,909,249 | ||
| NGA | Measles | 2019 | 1 | 9 | 6M-9Y | 1% | 55,695,418 | yes | 436,031 | |
| NGA | Measles | 2019 | 1 | 5 | 6 M-71M | 2% | 32,616,304 | yes | 718,665 | |
| NGA | Measles | 2019 | 1 | 4 | 9–59 M | 81% | 26,413,460 | yes | 21,352,326 | |
| NGA | MenA | 2019 | 1 | 7 | 55% | 44,499,793 | yes | 24,274,987 | ||
| NGA | YF | 2019 | 1 | 44 | 9M-44Y | 0.30% | 167,255,829 | yes | 525,691 | |
| NGA | YF | 2019 | 1 | 44 | 9M-44Y | 1% | 167,255,829 | yes | 1,392,489 | |
| NGA | YF | 2019 | 1 | 44 | 9M-44Y | 1% | 167,255,829 | yes | 1,766,338 | |
| NGA | YF | 2019 | 1 | 44 | 9M-44Y | 4% | 167,255,829 | yes | 6,755,396 | |
| NGA | Measles | 2020 | 1 | 4 | 6–59 M | 7% | 26,844,855 | yes | 1,988,885 | |
| NGA | MenA | 2020 | 7 | 10 | 7–8/9–10 years | 24% | 22,936,865 | yes | 5,618,292 | |
| NGA | MenA | 2020 | 1 | 7 | 1–7 Y | 15% | 45,289,678 | yes | 6,791,329 | |
| NGA | YF | 2020 | 1 | 44 | 9M-44Y | 5% | 171,465,804 | yes | 8,624,060 | FALSE |
| NGA | YF | 2020 | 1 | 44 | 9M-44Y | 3% | 171,465,804 | yes | 4,936,871 | |
| NGA | YF | 2020 | 1 | 44 | 9M-44Y | 16% | 171,465,804 | yes | 26,676,939 | |
| NGA | YF | 2021 | 1 | 44 | 9M-44Y | 20% | 175,731,488 | yes | 34,701,457 | |
| NGA | Measles | 2022 | 1 | 4 | 88% | 27,691,758 | no | 24,230,288 | ||
| NGA | YF | 2022 | 1 | 44 | 9M-44Y | 13% | 180,026,007 | yes | 23,699,548 | |
| NGA | YF | 2023 | 1 | 44 | 9M-44Y | 13% | 184,355,854 | yes | 23,699,548 | |
| NGA | Measles | 2024 | 1 | 4 | 88% | 28,580,680 | no | 25,008,095 | ||
| NGA | Measles | 2026 | 1 | 4 | 88% | 29,575,232 | no | 25,878,328 | ||
| NGA | Measles | 2028 | 1 | 4 | 88% | 30,532,880 | no | 26,716,270 | ||
| NGA | Measles | 2030 | 1 | 4 | 88% | 31,488,385 | no | 27,552,337 | ||
| SSD | Measles | 2020 | 1 | 4 | 6–59 M | 100% | 1,350,759 | no | 1,350,759 | FALSE |
| SSD | Measles | 2020 | 1 | 4 | 6–59 M | 49% | 1,350,759 | no | 659,330 | |
| SSD | Measles | 2023 | 1 | 4 | 92% | 1,396,213 | no | 1,284,516 | ||
| SSD | Measles | 2026 | 1 | 4 | 92% | 1,465,629 | no | 1,348,379 | ||
| SSD | Measles | 2029 | 1 | 4 | 92% | 1,513,497 | no | 1,392,417 | ||
| TCD | Measles | 2019 | 1 | 9 | 6M-9Y | 14% | 4,729,086 | yes | 653,511 | |
| TCD | Measles | 2019 | 1 | 9 | 6M-9Y | 4% | 4,729,086 | yes | 210,185 | |
| TCD | Measles | 2019 | 1 | 9 | 6M-9Y | 6% | 4,729,086 | yes | 298,738 | |
| TCD | Measles | 2019 | 1 | 4 | 6–59 M | 21% | 2,259,841 | yes | 467,456 | |
| TCD | Measles | 2020 | 1 | 4 | 6–59 M | 15% | 2,306,276 | yes | 340,046 | FALSE |
| TCD | Measles | 2020 | 1 | 4 | 6–59 M | 2% | 2,306,276 | yes | 43,233 | FALSE |
| TCD | Measles | 2020 | 1 | 4 | 6–59 M | 31% | 2,306,276 | yes | 712,746 | |
| TCD | Measles | 2020 | 1 | 4 | 9–59 M | 100% | 2,306,276 | no | 2,306,276 | |
| TCD | MenA | 2020 | 1 | 8 | 1-8Y | 15% | 4,352,395 | yes | 647,065 | |
| TCD | Measles | 2028 | 1 | 4 | 82% | 2,681,750 | no | 2,199,035 |
Additional files
Download links
A two-part list of links to download the article, or parts of the article, in various formats.
Downloads (link to download the article as PDF)
Open citations (links to open the citations from this article in various online reference manager services)
Cite this article (links to download the citations from this article in formats compatible with various reference manager tools)
Impact of COVID-19-related disruptions to measles, meningococcal A, and yellow fever vaccination in 10 countries
eLife 10:e67023.
https://doi.org/10.7554/eLife.67023


