Unbiased proteomic and forward genetic screens reveal that mechanosensitive ion channel MSL10 functions at ER–plasma membrane contact sites in Arabidopsis thaliana
- Department of Biology and the Center for Engineering Mechanobiology at Washington University in St. Louis, United States
Abstract
Mechanosensitive (MS) ion channels are an evolutionarily conserved way for cells to sense mechanical forces and transduce them into ionic signals. The channel properties of Arabidopsis thaliana MscS-Like (MSL)10 have been well studied, but how MSL10 signals remains largely unknown. To uncover signaling partners of MSL10, we employed a proteomic screen and a forward genetic screen; both unexpectedly implicated endoplasmic reticulum–plasma membrane contact sites (EPCSs) in MSL10 function. The proteomic screen revealed that MSL10 associates with multiple proteins associated with EPCSs. Of these, only VAMP-associated proteins (VAP)27-1 and VAP27-3 interacted directly with MSL10. The forward genetic screen, for suppressors of a gain-of-function MSL10 allele (msl10-3G, MSL10S640L), identified mutations in the synaptotagmin (SYT)5 and SYT7 genes. We also found that EPCSs were expanded in leaves of msl10-3G plants compared to the wild type. Taken together, these results indicate that MSL10 associates and functions with EPCS proteins, providing a new cell-level framework for understanding MSL10 signaling. In addition, placing a mechanosensory protein at EPCSs provides new insight into the function and regulation of this type of subcellular compartment.
Editor's evaluation
The work offers new avenues to investigate the role of mechanosensitive channels in plant development and specifically the mechanism underlying their signaling function. Congratulations on your contributions to this emerging and exciting area of research. The results reported here prepare the grounds to further work aiming to identify how these channels integrate with VAPs and SYTs, how MSL10 contribute to EPCS expansion, and how they function to determine plant growth and responses to the environment.
https://doi.org/10.7554/eLife.80501.sa0Introduction
Eukaryotic cells have evolved multiple mechanisms to coordinate responses between cellular compartments (Schrader et al., 2015; Mielecki et al., 2020; Sampaio et al., 2022). One such mechanism is the formation of membrane contact sites—subcellular locations where membranes of two organelles are held in close proximity by tethering proteins—which serve as sites of exchange, signaling, and organization in all eukaryotic cells (Scorrano et al., 2019; Prinz et al., 2020). One type of membrane contact site is the enfdoplasmic reticulum (ER)–plasma membrane (PM) contact site (EPCS). Mammalian EPCSs are important sites for the metabolism and transport of phospholipids and allow for the coordination of ion fluxes (Zaman et al., 2020; Li et al., 2021). In plants, EPCSs help maintain phospholipid homeostasis and cell integrity (Schapire et al., 2008; Ruiz-Lopez et al., 2021), are hubs of endocytosis (Stefano et al., 2018) and autophagy (Wang et al., 2019), and regulate cell–cell transport at plasmodesmata (Levy et al., 2015; Ishikawa et al., 2020).
Several components of plant EPCSs are conserved across eukaryotes. The integral ER proteins synaptotagmins (SYTs) and vesicle-associated membrane protein (VAMP)-associated protein (VAP)27s are homologous to tricalbins and Scs2/Scs22, respectively, in yeast, and to extended-synaptotagmins and VAPs, respectively, in mammals. In yeast, tricalbins and Scs2 and Scs22 additively contribute to tethering the ER and PM to each other (Manford et al., 2012), and it is likely that plant SYTs and VAP27s also have a cooperative tethering function. Plant VAP27s may serve as a scaffold as they are known to interact with a variety of proteins and link EPCSs to endocytic (Stefano et al., 2018) and autophagic (Wang et al., 2019) machinery as well as to the actin and microtubule cytoskeletons (Wang et al., 2014; Zang et al., 2021). Plant SYTs are required to maintain plasma membrane integrity in the face of stressors (Schapire et al., 2008; Yamazaki et al., 2008; Pérez-Sancho et al., 2015; Ruiz-Lopez et al., 2021), probably by transporting lipids between the ER and PM (Qian et al., 2022) like their yeast and mammalian counterparts (Saheki et al., 2016; Qian et al., 2021). Furthermore, Arabidopsis thaliana SYT1 changes localization and is required for cell integrity in response to mechanical pressure (Pérez-Sancho et al., 2015), implicating EPCSs in the perception of mechanical stimuli. However, how mechanical information might be transmitted to or from EPCSs is completely unknown.
Organisms have evolved a variety of strategies to sense and respond to mechanical stimuli. One kind of mechanosensory protein—the mechanosensitive (MS) ion channel—represents a particularly ancient strategy that most cells still use (Arnadóttir and Chalfie, 2010; Booth et al., 2015). Most MS ion channels open and conduct ions in response to lateral membrane tension, transducing mechanical stimuli like touch, vibration, swelling, or shearing into an electrochemical signal (Kefauver et al., 2020). There is some understanding of the stimuli that activate particular plant MS channels (cell swelling, cell shrinking, encountering a barrier) as well as the adaptive processes in which they participate (relieving cell swelling, enhancing salinity tolerance, root penetration, regulating organellar morphology) (Codjoe et al., 2022). What is less understood is how signals from MS channels are coordinated across cell compartments and transduced to trigger longer-term, plant-level adaptations.
Arabidopsis MscS-Like (MSL)10 is a member of a conserved family of MS channels found in plants, bacteria, archaea, and some fungi (Hamilton et al., 2015). MSL10 is a bona fide MS ion channel and its tension-sensitive channel properties are relatively well-characterized (Haswell et al., 2008; Maksaev and Haswell, 2012; Maksaev et al., 2018). MSL10 is plasma membrane-localized (Haswell et al., 2008; Veley et al., 2014), and genetic studies have implicated it in a range of physiological roles. In response to hypo-osmotic cell swelling, MSL10 promotes a cytosolic Ca2+ transient, the accumulation of reactive oxygen species, the induction of TOUCH gene expression, and programmed cell death (Basu and Haswell, 2020a). MSL10 also contributes to systemic electrical and Ca2+ signaling in response to wounding (Moe-Lange et al., 2021). MSL10 gain-of-function lines—including MSL10-GFP overexpressors (Veley et al., 2014) and the EMS-induced point mutant msl10-3G (Zou et al., 2016)—lead to constitutive growth inhibition and ectopic cell death (Basu et al., 2020b) through a pathway that requires the immune co-chaperone SGT1b/RAR1/HSP90 complex, although this is likely far downstream of MSL10 activation (Basu et al., 2022). Earlier events in signal transduction by MSL10 remain largely unknown.
MSL10 has primarily been studied at the protein level or at the whole plant level, but its function at the subcellular level has not been addressed. To understand how MSL10 transduces mechanical information into whole-plant phenotypes, we searched for potential signaling partners through proteomic and forward genetic screens. Here, we describe how both approaches, in combination with live-imaging assays, reveal that MSL10 functions at EPCSs.
Results
Immunoprecipitation–mass spectrometry to identify the MSL10 interactome
We first searched for signaling partners that physically interact with MSL10 using an unbiased proteomic approach. Here, GFP-tagged MSL10, which has the same electrophysiological and cell death signaling properties as untagged MSL10 (Maksaev and Haswell, 2012; Basu et al., 2020b), was used as bait for immunoprecipitation–mass spectrometry. Microsomes were isolated from seedlings expressing 35S:MSL10-GFP (Veley et al., 2014) and MSL10-GFP was immunoprecipitated from solubilized microsome extracts using GFP-Trap beads. Liquid chromatography-tandem mass spectrometry (LC-MS/MS) was performed on four replicate immunoprecipitations from 35S:MSL10-GFP seedlings as well as four mock immunoprecipitations from WT (Col-0) microsomes. In total, we identified 1904 peptides that mapped to 606 protein groups in the MSL10-GFP-enriched samples, 239 proteins of which had at least 8 peptide spectral matches (Figure 1—source data 1). As shown in the volcano plot reporting enrichment and significance (Figure 1A), a number of proteins were identified as significantly enriched in MSL10-GFP pull-downs. Most of the proteins identified were also pulled down with MSL107D-GFP, an inactive version of MSL10 wherein seven serines presumed to be phosphorylation sites were mutated to aspartate or glutamate (Veley et al., 2014; Basu et al., 2020b; Figure 1—figure supplement 1A), suggesting that the interactions were not dependent on MSL10 cell death-inducing activity. In fact, no detected proteins had significantly altered abundance (fold change > 4 and p-value<0.05) in the MSL10 compared to MSL107D proteomes (Figure 1—figure supplement 1B).
Figure 1 with 1 supplement see all
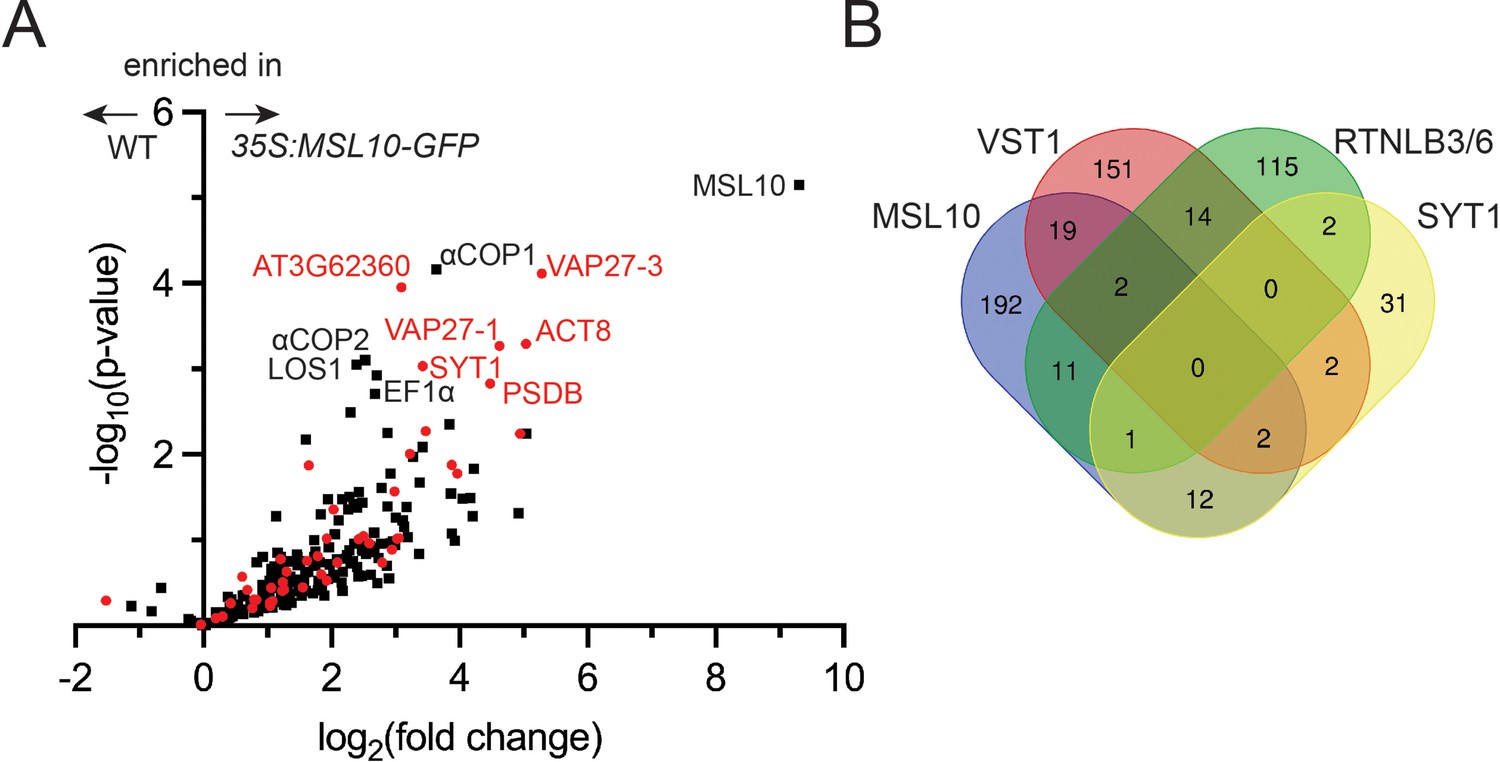
Co-immunoprecipitation–liquid chromatography-tandem mass spectrometry (LC-MS/MS) identifies the MSL10-GFP interactome, which shares similarities to previous endoplasmic reticulum–plasma membrane contact site (EPCS) interactomes.
(A) Volcano plot showing the abundance of proteins detected in immunoprecipitations of MSL10-GFP in 35S:MSL10-GFP seedlings (right) compared to those identified in mock immunoprecipitations using WT Col-0 seedlings (left). Proteins were identified by LC-MS/MS, and the average abundance of each was quantified from the MS1 precursor ion intensities. Only those proteins with at least eight peptide spectral matches are shown. Each protein is plotted based on its -log10(p-value) of significance based on four biological replicates relative to its log2(fold change) of abundance (35S:MSL10-GFP/ WT). Proteins also detected in immunoprecipitations with the EPCS proteins SYT1 (Ishikawa et al., 2020), VST1 (dataset filtered for proteins with >8 peptide-spectral matches [PSMs]; Ho et al., 2016), and VAP27-1/3 (Stefano et al., 2018) or plasmodesmata-associated RTNLB3/6 (Kriechbaumer et al., 2015) are represented as red circles; proteins unique to the MSL10 interactome are represented as black squares. The 11 most significantly enriched proteins are labeled (p-value<0.002). (B) The overlap of the indicated interactomes with that of MSL10. The VAP27-1/3 interactome (Stefano et al., 2018) was not included here because only eight selected interactors were reported.
-
Figure 1—source data 1
Peptide abundances from LC-MS/MS from mock, MSL10-GFP, and MSL10 7D-GFP immunoprecipitations.
- https://cdn.elifesciences.org/articles/80501/elife-80501-fig1-data1-v2.xlsx
Among the most enriched proteins in the MSL10-GFP pulldowns were VAP27-1, VAP27-3/PVA12, and SYT1/SYTA, each of which is a known component of plant EPCSs (Levy et al., 2015; Wang et al., 2014; Stefano et al., 2018). The peptides detected covered over 30% of the full-length protein sequence for MSL10, VAP27-1, and VAP27-3; and over 11% of the protein sequence for SYT1 (Figure 1—source data 1). The interactome list led us to perform a meta-analysis comparing the proteins that co-immunoprecipitated with MSL10 or MSL107D with three previously published interactomes generated with established EPCS components: SYT1 (Ishikawa et al., 2020), VAP-RELATED SUPPRESSOR OF TMM 1 (VST1) (Ho et al., 2016), and VAP27-1 and VAP27-3 (Stefano et al., 2018), as well as an interactome of reticulon-like proteins RTNLB3 and RTNLB6, ER-shaping proteins found at plasmodesmata that interact with SYT1 and VAP27s (Kriechbaumer et al., 2015). Twenty percent of the proteins that co-immunoprecipitated with MSL10-GFP were detected in at least one of these EPCS interactomes, strongly suggesting that MSL10 interacts with EPCSs (Figure 1A, shown in red). For example, of the 10 proteins most enriched in the MSL10-GFP pulldowns (other than MSL10, the bait), five were previously known to be associated with plant EPCSs: SYT1, VAP27-1, VAP27-3, actin 8 (ACT8), and AT3G62360 (a predicted protein with a carbohydrate binding-like fold). Although no single protein was detected in all interactomes compared, MSL10 shared 23 interacting proteins with VST1, 15 with SYT1, and 14 with RTNLB3/6 (Figure 1B). These interactomes may only partially overlap because they are incomplete, because protein complexes at EPCSs are large and difficult to fully survey, and/or because there are different EPCS complexes in different cell types or in different conditions. Nevertheless, these results indicat that MSL10 physically associates with protein complexes located at EPCSs.
MSL10 directly interacts with VAP27-1 and VAP27-3
We next asked whether MSL10 directly interacts with a subset of its proteome. We selected 14 of the 38 most highly enriched proteins from MSL10-GFP and/or MSL107D-GFP pulldowns (fold change > 4 and p-value<0.05), including the five previously associated with EPCSs, for further testing. These five proteins included At3g62360, which was enriched in the MSL10-GFP pulldowns compared to MSL107D-GFP, though at levels below the selected cutoff (Figure 1—figure supplement 1B). We first employed the yeast mating-based split-ubiquitin system (mbSUS) (Obrdlik et al., 2004; Figure 2A). MSL10 (the bait) and the candidate interactors (the prey) were tagged with the C- and N-terminal halves of ubiquitin, respectively, using orientations whereby each tag was predicted to face the cytosol. As previously reported, MSL10-Cub was able to interact with MSL10-NubG but did not interact with the potassium channel KAT1-NubG or untagged NubG (Basu et al., 2020b). Of the 14 tested yeast strains, only those expressing NubG-VAP27-1 and NubG-VAP27-3 survived on minimal media when mated to yeast expressing MSL10-Cub. Consistent with our proteomic results (Figure 1—figure supplement 1B), the interaction between MSL10 and VAP27s in the split-ubiquitin assay was not appreciably altered when the inactive MSL107D phosphovariant was used as bait (Figure 2—figure supplement 1A). The interaction was also maintained when using the overactive MSL107A (Veley et al., 2014; Basu et al., 2020b) or MSL10S640L (msl10-3G; Zou et al., 2016) variants, suggesting that the activation of MSL10 signaling does not alter its ability to interact with VAP27-1 and VAP27-3. Furthermore, the conserved major sperm protein domains of VAP27s were not required for interaction with MSL10 (Figure 2—figure supplement 1B). Along with the absence of known VAP27-binding motifs (James and Kehlenbach, 2021) in MSL10, these results indicate that MSL10 interacts with VAP27-1 and VAP27-3 in a non-canonical way.
Figure 2 with 1 supplement see all
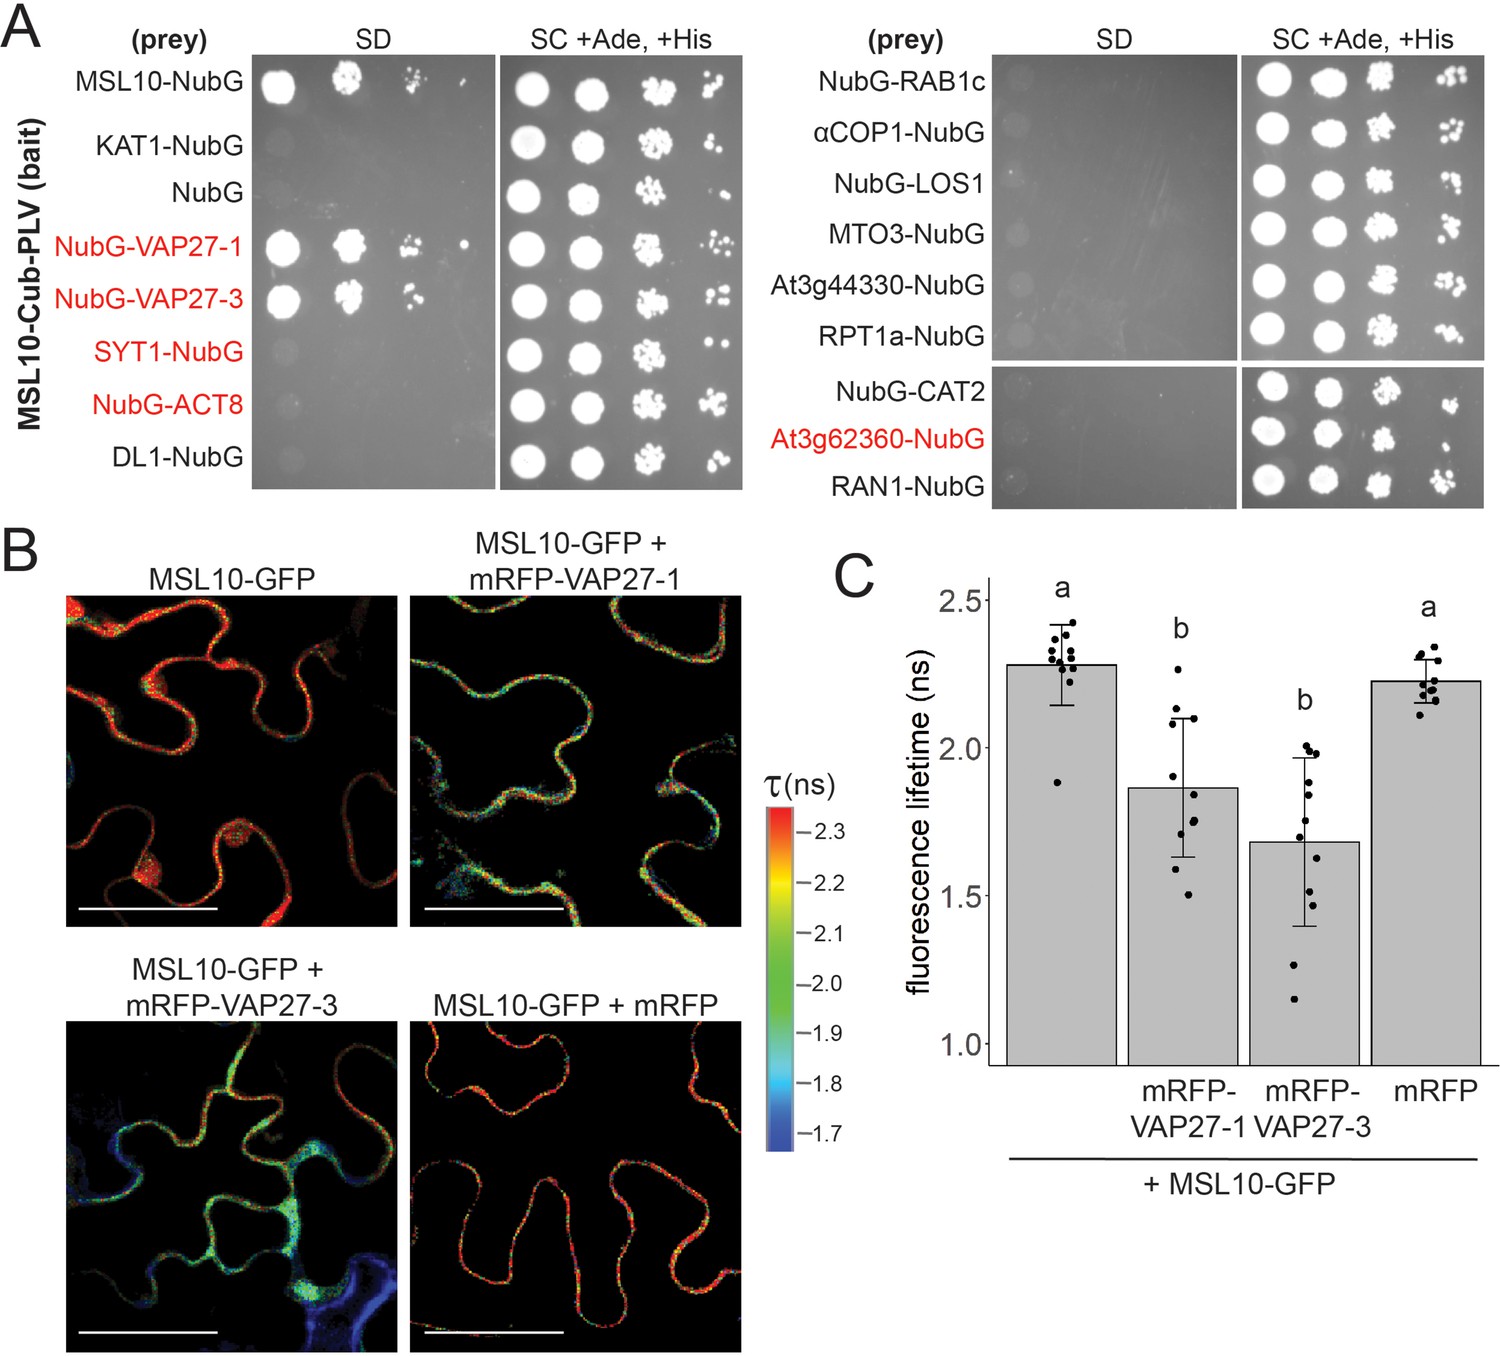
MSL10 interacts with VAP27-1 and VAP27-3.
(A) Mating-based split-ubiquitin (mbSUS) assay. VAMP-associated protein 27-1 (VAP27-1), VAP27-3, synaptotagmin 1 (SYT1), actin 8 (ACT8), dynamin-like (DL1), RAB GTPase homolog 1c (RAB1c), coatomer α1 subunit (αCOP1), LOW EXPRESSION OF OSMOTICALLY RESPONSIVE GENES 1 (LOS1), METHIONINE OVERACCULATOR 3 (MTO3), AT3G44330, regulatory particle triple-A 1A (RPT1a), catalase 2 (CAT2), AT3G62360, and Ras-related nuclear protein 1 (RAN1) were fused to NubG and tested for interaction with Cub-tagged MSL10. Proteins labeled in red were previously detected at endoplasmic reticulum–plasma membrane contact sites (EPCSs). The results in (A) are consistent with a second independent mbSUS assay using independent transformants. (B, C) In vivo Förster resonance energy transfer–fluorescence lifetime imaging microscopy (FRET-FLIM) on UBQ:MSL10-GFP and UBQ:mRFP-VAP27-1 or UBQ:mRFP-VAP27-3 transiently expressed in tobacco. (B) Representative heat maps of the fluorescence lifetime (τ) of GFP measured in tobacco abaxial epidermal cells 5 days post-infiltration. Scale = 50 µm. (C) Average GFP fluorescence lifetime. Each data point represents the value from one field of view (three fields of view per plant from four infiltrated plants for a total of n = 12 for each combination). Error bars, SD. Groups indicated by the same letter are not statistically different according to ANOVA with Tukey’s post-hoc test.
We employed Förster resonance energy transfer–fluorescence lifetime imaging microscopy (FRET-FLIM) to provide additional evidence that MSL10 directly interacts with VAP27-1 and VAP27-3 in plant cells. In FRET-FLIM, when proteins are close enough for energy transfer (<10 nm), the fluorescence lifetime of the FRET donor decreases (Sun et al., 2012). MSL10-GFP transiently expressed in tobacco leaves had a fluorescence lifetime of 2.3 ± 0.1 ns (Figure 2B and C). When co-expressed with mRFP-VAP27-1 or mRFP-VAP27-3, MSL10-GFP lifetimes were 1.8 ± 0.2 ns (a 22% decrease) and 1.6 ± 0.3 ns (a 30% decrease), respectively. Co-expressing MSL10-GFP and free mRFP did not alter the fluorescence lifetime of GFP. These fluorescence lifetimes with and without acceptors are in the same range as those previously reported for interactions between proteins expressed in tobacco (Wang et al., 2014; Wang et al., 2019).
A subpopulation of MSL10 co-localizes with a subpopulation of VAP27-1 and VAP27-3
To support our observation that MSL10 and VAP27s interact, we sought evidence in stable transgenic A. thaliana lines expressing MSL10-GFP and mRFP-VAP27-3 under the control of their respective promoters. We examined localization in leaf epidermal cells, where EPCSs are commonly studied and MSL10 and VAP27-3 are expressed (eFP Browser; Winter et al., 2007). As expected, MSL10-GFP displayed a punctate localization at the periphery of leaf epidermal cells (Figure 3A; Veley et al., 2014; Maksaev et al., 2018). In four independent MSL10p:MSL10-GFP+mRFP-VAP27-3g lines, mRFP signal was punctate at the cell periphery and only partially co-localized with GFP signal. On average, across the four lines, 33 ± 4% of MSL10-GFP signal co-localized with mRFP-VAP27-3 in equatorial images, while 32 ± 4% of mRFP-VAP27-3 co-localized with MSL10-GFP (Mander’s overlap coefficient M1 and M2, respectively, Figure 3B). Due to low endogenous expression of MSL10-GFP and cell wall autofluorescence, we could not obtain a cortical image of MSL10-GFP and mRFP-VAP27-3 co-localization in Arabidopsis. Instead, we examined co-localization in cortical and equatorial slices of tobacco leaf epidermal cells transiently overexpressing MSL10-GFP and mRFP-VAP27-3 or mRFP-VAP27-1 (Figure 3C and D). These images confirm what we observed in Arabidopsis—that only a subpopulation of MSL10 co-localized with VAP27s, and vice versa. This is similar to what has been observed with the PM-localized aquaporin ZmPIP2;5 and ZmVAP27-1 (Fox et al., 2020). Additionally, the majority of MSL10-GFP, even when overexpressed, trafficked to the plasma membrane, whereas mRFP-VAP27-1 and mRFP-VAP27-3 were found in the ER just below.
Figure 3
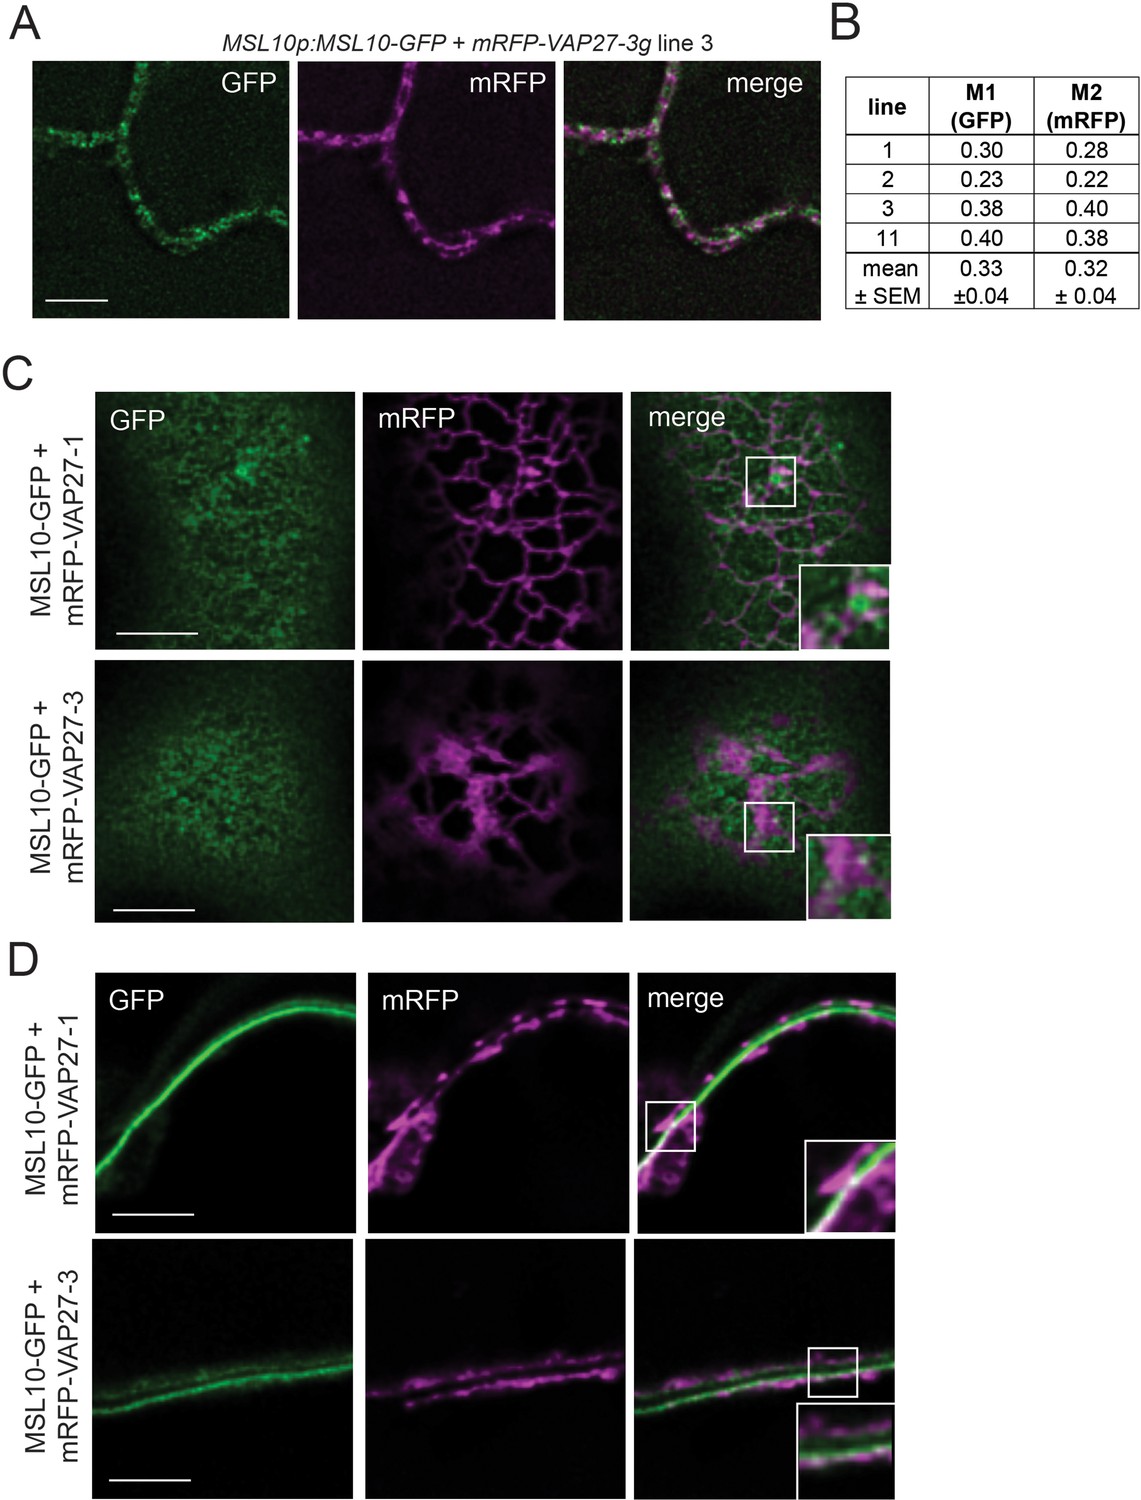
A subpopulation of MSL10 co-localizes with a subpopulation of VAP27-1 and VAP27-3.
(A) Equatorial deconvolved confocal laser scanning micrographs of leaf abaxial epidermal cells from stable Arabidopsis T1 lines co-expressing MSL10-GFP and mRFP-VAP27-3 driven by their endogenous promoters. Scale = 5 µm. (B) Mander’s overlap coefficients M1 and M2 calculated from images taken from four independent T1 lines. (C, D) Deconvolved confocal micrographs showing a Z-slice at the top (cortical, C) and the middle (equatorial, D) of tobacco epidermal cells transiently expressing UBQ:MSL10-GFP and UBQ:mRFP-VAP27-1 or UBQ:mRFP-VAP27-3. Images were taken 5 days after infiltration. Scale = 5 µm.
Taken together, the data shown in Figures 1—3 indicate that a subpopulation of MSL10 interacts directly with two VAP27s and indirectly with several other components of EPCSs. Because VAP27-1 and VAP27-3 are integral ER proteins (Saravanan et al., 2009; Wang et al., 2014) and MSL10 is found in the plasma membrane (Haswell et al., 2008; Veley et al., 2014), an interaction between the two would, by definition, create an EPCS.
MSL10 alters EPCS morphology by expanding SYT1 puncta
Given that EPCS patterning is stress-responsive (Pérez-Sancho et al., 2015; Lee et al., 2019; Lee et al., 2020; Ruiz-Lopez et al., 2021), we hypothesized that MSL10 might serve a regulatory function at EPCSs. We began to test this hypothesis by investigating the effect of MSL10 mutant alleles on the localization of a general EPCS marker, Membrane-Attached PeriPhERal (MAPPER)-GFP (Chang et al., 2013). We crossed a UBQ:MAPPER-GFP line (Lee et al., 2019) to loss-of-function (msl10-1; Haswell et al., 2008) and gain-of-function (msl10-3G; Zou et al., 2016; Basu et al., 2020b) mutant plant lines. In the F3 generation, we compared MAPPER-GFP localization in WT, msl10-1, or msl10-3G backgrounds. MAPPER-GFP puncta looked similar in segregated WT and msl10-1 plants (Figure 4A and B). In contrast, MAPPER-GFP puncta were expanded in adult msl10-3G plants (Figure 4A and C), taking up a larger proportion (13.1 ± 3.1%) of the cellular area in adult msl10-3G leaf epidermal cells compared to those in plants with the WT MSL10 allele (8.7 ± 2.9%).
Figure 4 with 1 supplement see all
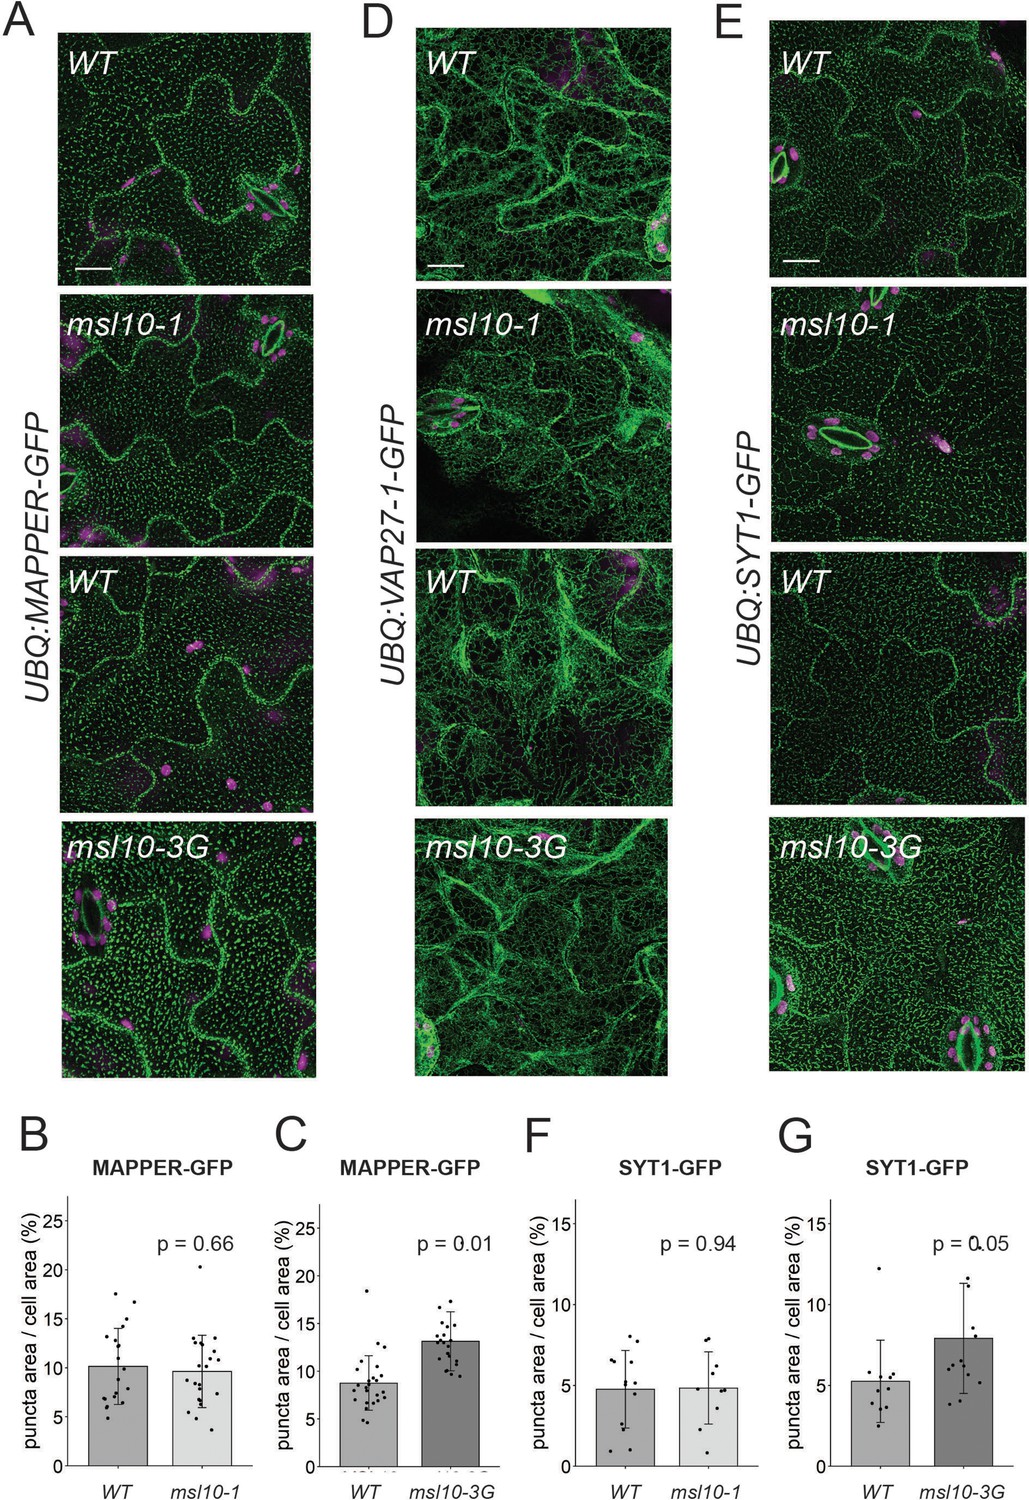
Some endoplasmic reticulum–plasma membrane contact sites (EPCSs) are expanded in msl10-3G plants.
Confocal Z-projections (maximum intensity projection of Z-slices from the top to the middle of cells) of GFP-tagged proteins in the indicated MSL10 backgrounds. MAPPER-GFP (A), VAP27-1-GFP (D), and SYT1-GFP (E) in 4-week-old abaxial leaf epidermal cells. Plants shown here are cousins (A, E) or siblings (D). Green, GFP; magenta, chlorophyll autofluorescence. Scale = 10 µm. Quantification of the percentage of the leaf epidermal cell volume taken up by MAPPER-GFP (B, C) or SYT1-GFP (F, G) puncta in plants in the msl10-1 or msl10-3G background compared to WT cousins. Each data point represents a biological replicate: the mean value of 20–50 epidermal cells from one plant, n = 10–25 plants per genotype from two or three separately grown flats. Error bars, SD. Means were compared by Student’s t-tests when data was normally distributed (B, F) or Mann–Whitney U-tests when it was not (C, G).
We next examined VAP27 and SYT1 localization. We generated lines stably expressing VAP27-1-GFP, VAP27-3-GFP, and SYT1-GFP under control of the UBQ10 promoter and crossed them to msl10-1 and msl10-3G plants. The genotypes of surviving F2 seedlings from some of these crosses indicated genetic interactions between MSL10 and the overexpression transgenes. For example, we were unable to isolate plants carrying the UBQ:VAP27-3-GFP transgene in either the msl10-1 or msl10-3G homozygous backgrounds when grown on soil, and fewer msl10-1; UBQ:SYT1-GFP plants were isolated than would be predicted by normal Mendelian segregation (Table 1).
Table 1
Segregation of MSL10 alleles in crosses to lines overexpressing GFP-labelled endoplasmic reticulum–plasma membrane contact sites (EPCS) proteins.
msl10-1 and msl10-3G plants were crossed to lines expressing GFP-labelled VAP27-1, VAP27-3, SYT1, SYT5, and SYT7 under the control of the UBQ10 promoter. F2 plants (or F3 offspring of heterozygous F2 plants) were selected based on Basta resistance driven by the UBQ:GFP transgenes, and resistant plants were genotyped for the indicated MSL10 alleles. Chi-squared tests were calculated based on a predicted 1:2:1 segregation ratio. Crosses that had significant deviations (Pp<0.05) from expected ratios are in bold.
| # Basta resistant offspring with indicated genotypes | ||||||
|---|---|---|---|---|---|---|
| Parental genotype | MSL10/MSL10 | MSL10/msl10-3G | msl10-3G/msl10-3G | X2 | P | |
| UBQ:VAP27-1-GFP/-; | MSL10/msl10-3G | 6/25 (24%) | 16/25 (64%) | 3/25 (12%) | 2.68 | 0.26 |
| UBQ:VAP27-3-GFP/-; | MSL10/msl10-3G | 12/33 (36%) | 21/33 (64%) | 0/33 (0%) | 11.18 | 0.004 |
| UBQ:SYT1-GFP/-; | MSL10/msl10-3G | 6/21 (29%) | 12/21 (57%) | 3/21 (14%) | 1.29 | 0.53 |
| UBQ:SYT5-GFP/-; | MSL10/msl10-3G | 5/21 (24%) | 7/21 (33%) | 9/21 (43%) | 3.86 | 0.15 |
| UBQ:SYT7-GFP/-; | MSL10/msl10-3G | 9/40 (23%) | 23/40 (57%) | 8/40 (20%) | 0.95 | 0.62 |
| MSL10/MSL10 | MSL10/msl10-1 | msl10-1/msl10-1 | ||||
| UBQ:VAP27-1-GFP/-; | MSL10/msl10-1 | 6/28 (21%) | 17/28 (61%) | 5/28 (18%) | 1.36 | 0.51 |
| UBQ:VAP27-3-GFP/-; | MSL10/msl10-1 | 7/36 (19%) | 29/36 (81%) | 0/36 (0%) | 16.17 | 0.0003 |
| UBQ:SYT1-GFP/-; | MSL10/msl10-1 | 24/74 (33%) | 46/74 (62%) | 4/74 (5%) | 15.19 | 0.0005 |
| UBQ:SYT5-GFP/-; | MSL10/msl10-1 | 7/23 (30%) | 8/23 (35%) | 8/23 (35%) | 2.22 | 0.33 |
| UBQ:SYT7-GFP/-; | MSL10/msl10-1 | 16/42 (38%) | 17/42 (41%) | 9/42 (21%) | 3.86 | 0.15 |
| Expected ratios | 25% | 50% | 25% | |||
VAP27-1-GFP is localized to the ER in Arabidopsis leaf epidermal cells, forming some puncta (although fewer than reported for VAP27-1 when transiently overexpressed in tobacco; Wang et al., 2014; Wang et al., 2016). We found that the VAP27-1 localization pattern was similar in msl10-1, msl10-3G, and their segregated WT MSL10 backgrounds (Figure 4D). As there were so few VAP27-1-GFP puncta, we did not quantify their area as for MAPPER-GFP. Due to the presumed synthetic lethality described above, we were unable to assess the effect of MSL10 on VAP27-3 EPCSs. SYT1-GFP displayed the expected punctate localization (Levy et al., 2015; Pérez-Sancho et al., 2015), and SYT1-GFP localization was unchanged in the msl10-1 background (Figure 4E and F). However, in the msl10-3G background, SYT1-GFP puncta were expanded in leaf epidermal cells compared to the WT, leading to a modest, but significant increase in SYT1-GFP area relative to cellular area (Figure 4E and G). This SYT1-GFP pattern closely resembled that observed with the MAPPER-GFP marker (compare Figure 4A and D).
MSL10 does not contribute to EPCS rearrangement in response to osmotic perturbations
SYT-EPCSs are sensitive to environmental conditions, quickly changing localization in response to mechanical pressure (Pérez-Sancho et al., 2015) and slowly remodeling in response to freezing and salinity stress and the presence of rare ions (Lee et al., 2019; Lee et al., 2020; Ruiz-Lopez et al., 2021). We tested whether MSL10 was required for some of these EPCS rearrangements. As previously reported (Lee et al., 2019), EPCSs marked by MAPPER-GFP in cotyledon epidermal cells expanded after a 16 hr exposure to 100 mM NaCl (Figure 4—figure supplement 1A). A similar MAPPER-GFP localization pattern was also observed in msl10-1 and msl10-3G seedlings treated with NaCl, indicating that MSL10 does not influence the expansion of EPCSs during salinity stress. Salinity-induced EPCS expansion is reversible when seedlings are moved to media lacking NaCl, triggering a hypo-osmotic shock (Lee et al., 2019). As MSL10 plays a role in the cellular response to hypo-osmotic cell swelling (Basu and Haswell, 2020a), we asked whether MSL10 was also responsible for EPCS shrinking under these conditions. We found that MAPPER-GFP signal decreased in cotyledon epidermal cells 24 hr after hypo-osmotic shock (Figure 4—figure supplement 1B) but that this phenomenon was unaffected by the msl10-1 or msl10-3G alleles. SYT1-GFP has been reported to move from a ‘beads on a string’ localization pattern to a punctate one when mechanical stress is applied (Pérez-Sancho et al., 2015). In our hands, SYT1-GFP localization always appeared punctate in cotyledon epidermal cells, and we did not see an appreciable change in this localization when pressure was added (Figure 4—figure supplement 1C).
A forward genetic screen provides evidence for functional interactions between MSL10 and SYT5 and SYT7
Above, we describe physical interactions between MSL10 and the EPCS components VAP27-1 and VAP27-3, and a functional interaction wherein SYT1 EPCSs were expanded in msl10-3G plants. Further evidence for functional interactions between MSL10 and EPCS components came from a genetic screen that was performed at the same time as the above experiments. We used the obvious growth defect of msl10-3G plants (Zou et al., 2016; Basu et al., 2020b) as the basis of a visual screen, as illustrated in Figure 5A. EMS-induced suppressor mutants, referred to as suppressed death from msl10-3G (sdm), were initially isolated based on increased height compared to parental msl10-3G plants in the M1 and M2 generations. As msl10-3G plants share some of the characteristics of lesionmimic-mutants (Basu et al., 2022), and intragenic mutations are particularly common in suppressor screens of lesionmimic mutants (van Wersch et al., 2016), we sequenced MSL10 exons in all 40 mutant lines. Indeed, 35 had a missense mutation in the MSL10 coding or splice-junction sequences (Figure 5—figure supplement 1A). The five remaining sdm mutants were presumed to have extragenic suppressor mutations. The mapping-by-sequencing strategy we employed (see below) successfully identified extragenic suppressor mutations for two of these , sdm26 and sdm34.
Figure 5 with 1 supplement see all
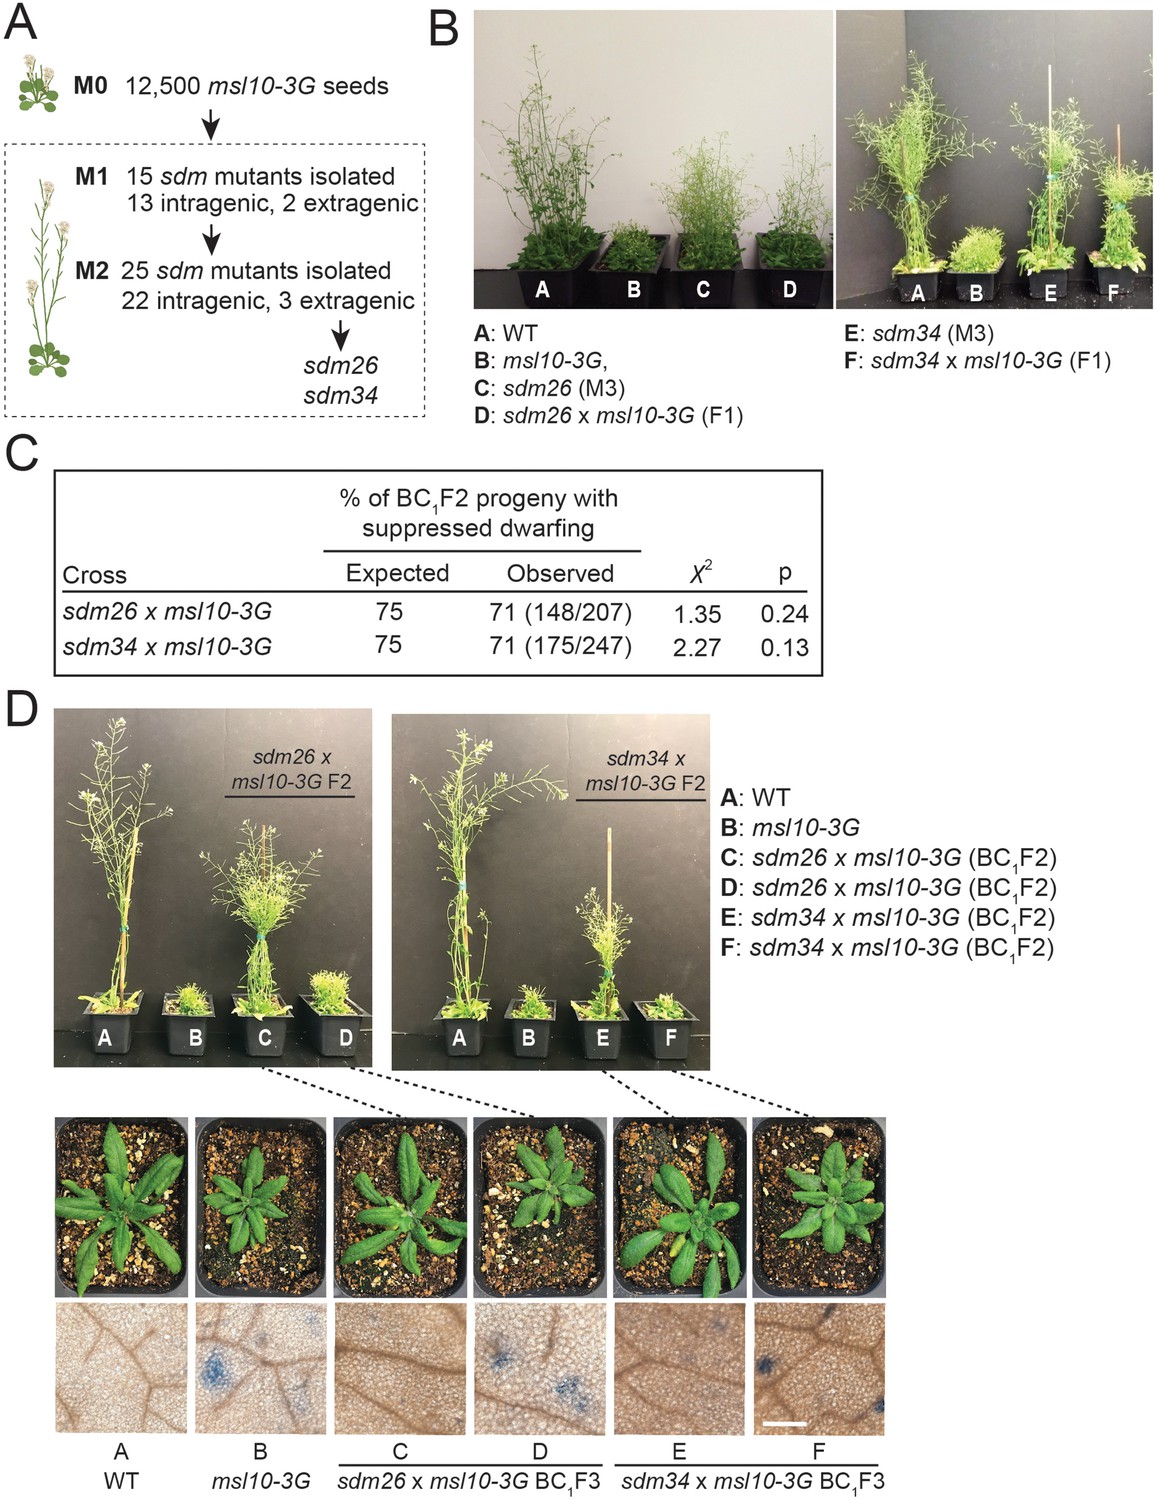
A forward genetic screen identified sdm26 and sdm34, dominant suppressors of msl10-3G height and ectopic cell death phenotypes.
(A) Schematic of the screen. (B) Images of the indicated plants after 4–5 weeks of growth. (C) Segregation of height phenotypes in the BC1F2 generation compared to the expected segregation ratio assuming the sdm alleles are dominant. (D) Siblings of backcrossed sdm26 and sdm34 mutants that were fixed for the sdm (suppressed dwarfing) or msl10-3G (dwarf) phenotypes. Top: 5-week-old BC1F2 plants of the indicated genotypes. Middle: 4-week-old BC1F3 progeny of plants at the top, as indicated with dashed lines. Bottom: leaves of 4-week-old BC1F3 plants stained with Trypan blue to assess cell death. These results are representative of at least five other plants for each genotype, in two separate experiments. Scale = 300 µm.
Notably, sdm26 and sdm34 mutant plants were taller than msl10-3G plants but not as tall as WT plants (Figure 5B). The offspring of both sdm26 and sdm34 backcrosses to msl10-3G (BC1F1 plants) were as tall as their sdm parents (Figure 5B). Furthermore, in the BC1F2 generation, plants with intermediate height (sdm phenotype) were present approximately 3:1 relative to those with the msl10-3G dwarf phenotype (Figure 5C), indicating that the sdm mutations are dominant in the msl10-3G background, at least for this phenotype. When sdm26 and sdm34 plants were outcrossed to the msl10-1 null allele, plants with the parental msl10-3G phenotype were recovered in the F2 generation (Figure 5—figure supplement 1B), confirming that the sdm26 and sdm34 lesions are extragenic alleles unlinked to MSL10. Another characteristic phenotype of msl10-3G plants, ectopic cell death, was also suppressed in sdm26 and sdm34 leaves compared to those of parental and segregating msl10-3G siblings, although the sdm mutants exhibited slightly more cell death than WT plants (Figure 5D).
The whole-genome sequencing strategy we used to identify the mutations responsible for sdm26 and sdm34 phenotypes consisted of separating BC1F2 plants by phenotype into pools of 50 plants each, extracting genomic DNA from pooled tissue, and sequencing at 80× coverage (Figure 6A). As sdm26 and sdm34 are dominant suppressor mutations, we searched for EMS-induced SNPs that (1) had an allele frequency of 0.66 in the pool of plants with the sdm phenotype and (2) were absent in the msl10-3G phenotype pool. Intervals of adjacent SNPs with such allele frequencies were found on chromosome 1 for sdm26 (Figure 6—figure supplement 1) and chromosome 3 for sdm34 (Figure 6—figure supplement 2). We failed to identify clear intervals of linked SNPs with the expected allele frequencies for the other three presumed extragenic mutants.
Figure 6 with 2 supplements see all
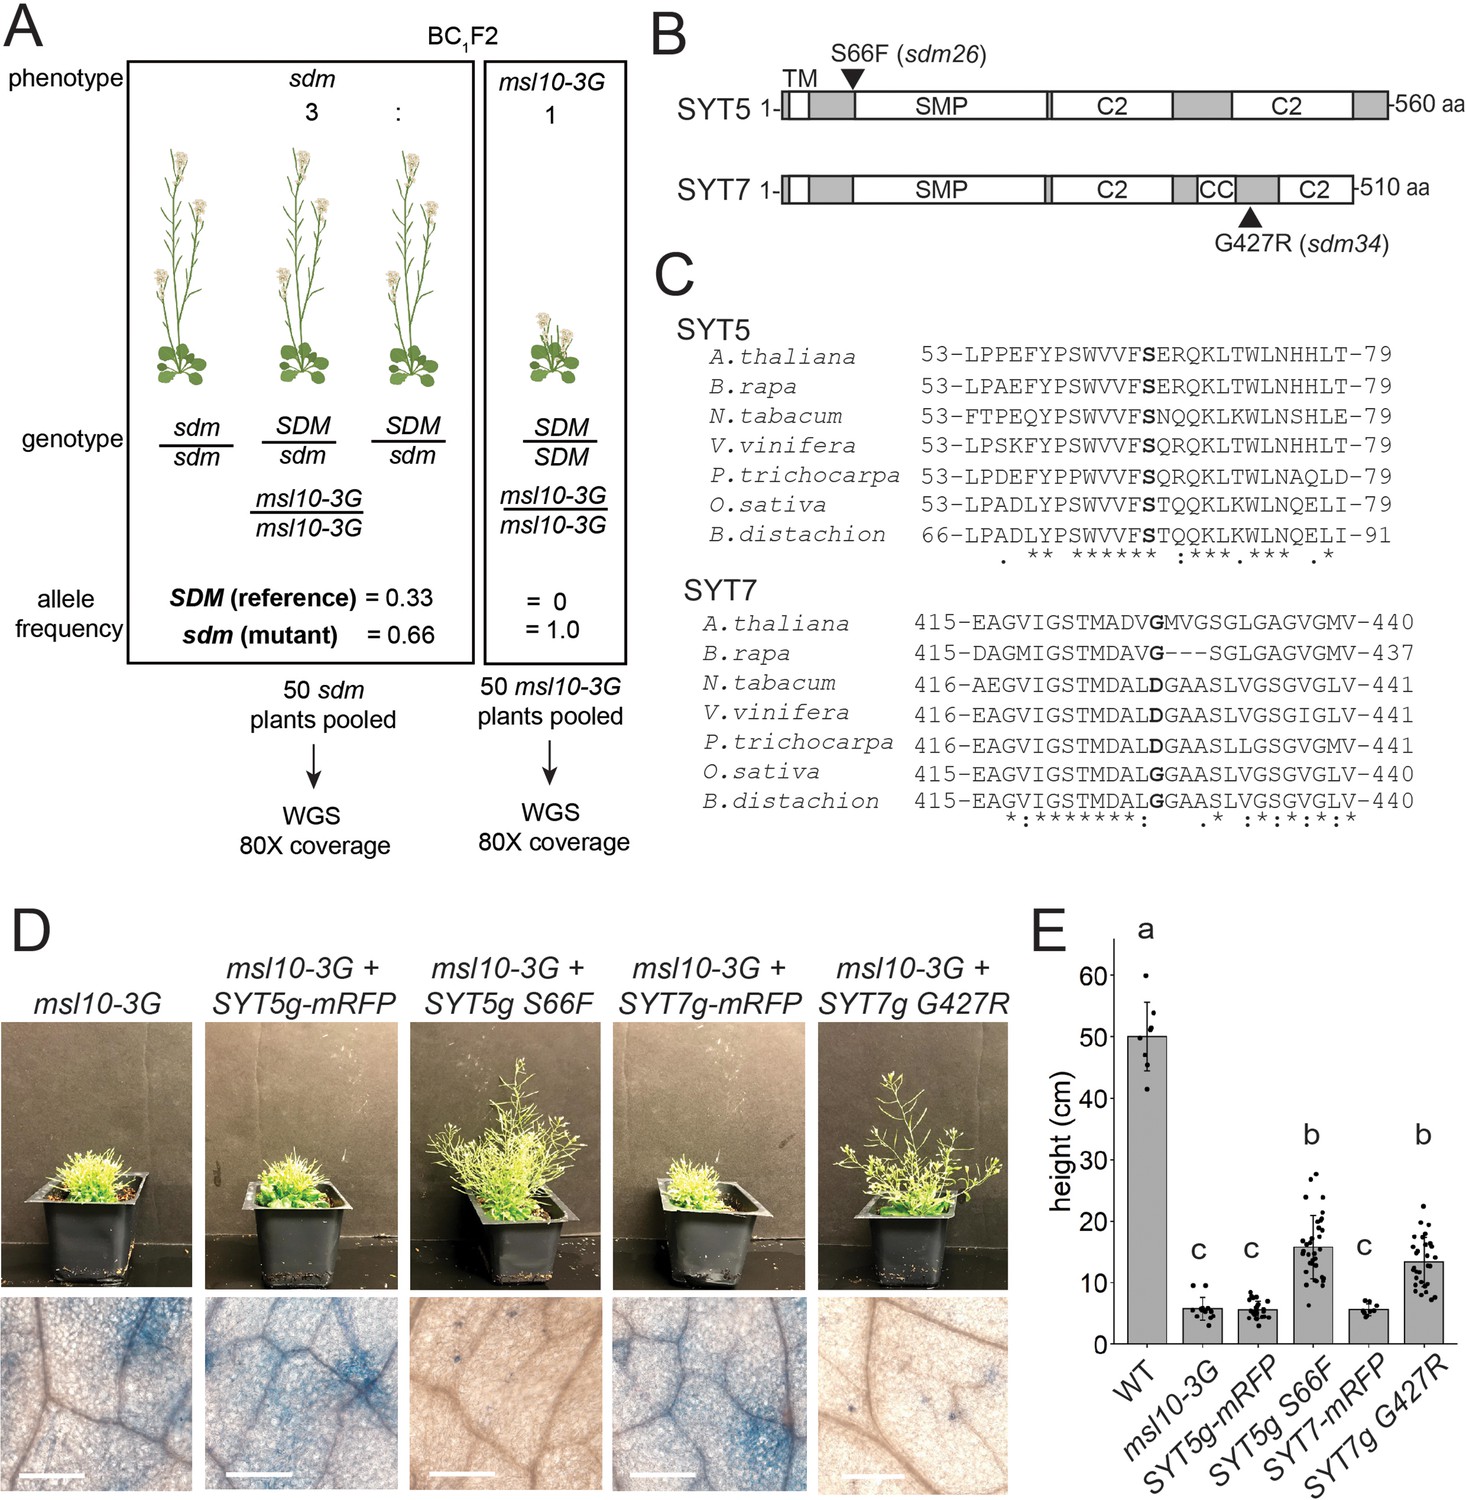
SYT5 S66F and SYT7 G427R are the causal mutations in sdm26 and sdm34, respectively.
(A) Overview of backcrossing and mapping-by-sequencing of sdm mutants. (B) Location of sdm26 and sdm34 missense mutations in the SYT5 and SYT7 proteins, respectively. UniProt was used to predict protein domains and their location. TM, transmembrane; SMP, synaptogamin-like mitochondrial-lipid-binding protein domain; CC, coiled coil; C2, Ca2+ binding. (C) Conservation of Ser66 and Gly427 residues in SYT5 and SYT7 homologs, respectively, in the predicted proteomes of selected angiosperms. (D, E) Phenotypes of msl10-3G plants expressing WT or sdm mutant SYT5 and SYT7 transgenes. (D) Top: images of representative T1 lines. Bottom: Trypan blue staining of a leaf from the same plants. Scale = 300 µm. (E) Mean and standard deviation of plant height of n = 9–32 T1 lines per construct, pooled from two similar experiments. Groups indicated with the same letters are not significantly different as assessed by ANOVA with Scheffe’s post-hoc test.
The intervals in sdm26 and sdm34 contained 8 and 13 genes, respectively. The sdm26 genome encoded a missense mutation (Ser66→Phe) in the synaptotagmin 5 (SYT5) gene and the sdm34 genome encoded a Gly427→Arg substitution in synaptotagmin 7 (SYT7, CBL1, NTMC2T4; Figure 6B). SYT5 and SYT7 are known to interact with each other and with SYT1 at EPCSs (Ishikawa et al., 2020; Lee et al., 2020). Given these results, and that MSL10 interacts with EPCS proteins (Figures 1 and 2), the SNPs in SYT5 and SYT7 were promising candidates for causing the suppression of the msl10-3G phenotypes in sdm26 and sdm34. However, it remained possible that lesions elsewhere in these intervals were instead responsible.
We therefore attempted to recreate the sdm phenotypes by expressing SYT5 S66F and SYT7 G427R from transgenes in unmutagenized msl10-3G plants. We expected to see sdm-like phenotypes in the T1 generation because the suppressor mutations in sdm26 and sdm34 plants were dominant. As anticipated, msl10-3G+SYT5g S66F and msl10-3+SYT7g G427R T1 plants were taller than untransformed msl10-3G plants (Figure 6D). The amount of ectopic cell death was also suppressed compared to msl10-3G leaves. WT SYT5g-mRFP or WT SYT7g-mRFP transgenes had no discernible effect on plant height or ectopic cell death in T1 plants in the msl10-3G background. These results provide strong evidence that SYT5 S66F and SYT7 G427R mutations caused suppression of msl10-3G phenotypes in the sdm26 and sdm34 mutants, respectively.
To address whether the sdm26 and sdm34 mutations might be dominant negative, we crossed msl10-3G plants to null syt5 and syt7 alleles (Ishikawa et al., 2020). Double syt5; msl10-3G and syt7; msl10-3G mutants resembled msl10-3G plants (Figure 7—figure supplement 1A and B). The inability of null syt5 and syt7 alleles to suppress msl10-3G phenotypes indicates that the sdm26 (SYT5 S66F) and sdm34 (SYT7 G427R) alleles do not cause suppression by impairing the function of WT SYT5 or SYT7. Additionally, the null syt1-2 allele (Ishikawa et al., 2020) had no effect on msl10-3G growth defects or ectopic death (Figure 7—figure supplement 1A).
sdm26 and sdm34 alleles do not alter SYT5 or SYT7 localization or MSL10 levels
The SYT5 S66F and SYT7 G427R point mutations occur in different parts of the synaptotagmin proteins and are not located in any of the predicted functional domains (Ishikawa et al., 2020; Lee et al., 2020; UniProt Consortium, 2021; Figure 6B). However, S66 is fully conserved in SYT5 homologs from monocots and dicots and G427 is partially conserved in SYT7 homologs from Brassicacae and monocots (Figure 6C), and thus may be important for structure or function. We first investigated whether the sdm point mutations change the localization of SYT5 and SYT7. When transiently expressed in tobacco, SYT5 S66F-mRFP and SYT7 G427R-mRFP had similar localization and dynamics to their WT counterparts, localizing to dynamic ER tubules and to puncta that persisted over time, as previously reported (Ishikawa et al., 2020; Lee et al., 2020; Figure 7—figure supplement 1C; Videos 1–4). Additionally, the sdm point mutations did not alter SYT5 or SYT7 transcript stability (Figure 7—figure supplement 1D). To rule out a trivial explanation for the suppression of msl10-3G phenotypes—that the sdm26 and sdm34 alleles decrease MSL10 expression and/or stability—we examined MSL10p:MSL10-GFP expression in those backgrounds. We found equivalent MSL10-GFP fluorescence and protein levels in sdm26 plants compared to their WT siblings, and in sdm34 plants compared to their WT siblings (Figure 7—figure supplement 1E and F). In summary, the sdm26 and sdm34 alleles do not affect MSL10 expression or protein stability, nor SYT5 or SYT7 localization, and must suppress MSL10 signaling in some other way.
Video 1
Time-lapse images of SYT5-mRFP in tobacco abaxial leaf epidermal cells.
Images were taken every 3 s for 2 min, 5 days post-infiltration.
Video 2
Time-lapse images of SYT5 S66F-mRFP in tobacco abaxial leaf epidermal cells.
Images were taken every 3 s for 2 min, 5 days post-infiltration.
Video 3
Time-lapse images of SYT7-mRFP in tobacco abaxial leaf epidermal cells.
Images were taken every 3 s for 2 min, 5 days post-infiltration.
Video 4
Time-lapse images of SYT7 G427R-mRFP in tobacco abaxial leaf epidermal cells.
Images were taken every 3 s for 2 min, 5 days post-infiltration.
EPCS expansion is not suppressed in sdm26 and sdm34 mutants
Given that SYT1-EPCSs were expanded in msl10-3G mutants, we wondered whether increased connections between the ER and PM in msl10-3G plants might be responsible for the growth inhibition and ectopic cell death associated with this allele. If this were the case, the enhanced EPCS area observed in msl10-3G plants would be suppressed by sdm26 or sdm34 alleles. To test this idea, we crossed UBQ:MAPPER-GFP plants to the sdm26 mutant. To our surprise, the larger EPCS area in msl10-3G plants (13.7 ± 4.2%) was not suppressed in sdm26 leaf epidermal cells (13.5 ± 3.7%) (Figure 7A and B). The same observation was made in plants derived from a UBQ:MAPPER-GFP x sdm34 cross (Figure 7C and D). Thus, differences in ER-PM connectivity, at least as marked by MAPPER-GFP, do not drive the phenotypic differences we observe between WT, msl10-3G, and sdm plants.
Figure 7 with 1 supplement see all
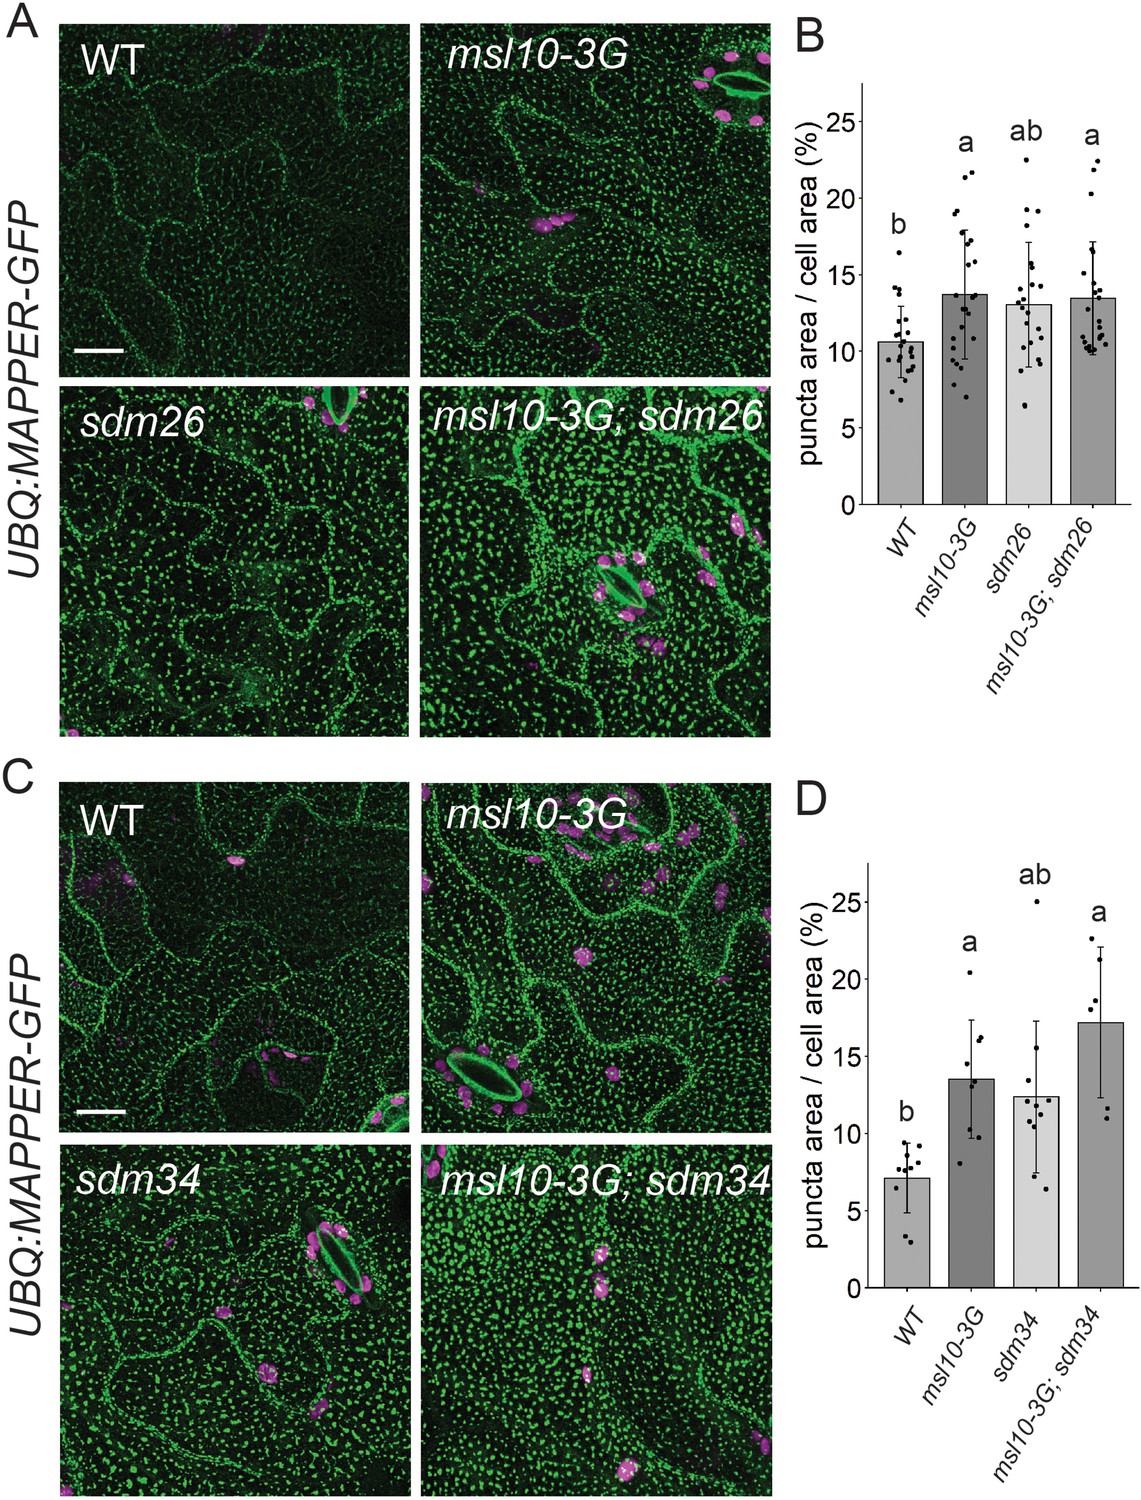
sdm26 and sdm34 alleles do not suppress expanded endoplasmic reticulum–plasma membrane contact sites (EPCSs) in msl10-3G leaves.
(A, C) Confocal Z-projections (maximum intensity projection of Z-slices from the top to the middle of cells) of MAPPER-GFP fluorescence in 4-week-old abaxial leaf epidermal cells of the indicated genotypes. Scale = 10 µm. (B, D) Quantification of the percentage of the leaf epidermal cell volume taken up by MAPPER-GFP puncta in plants of the indicated genotypes. Each data point represents a biological replicate (the mean value of 20–50 epidermal cells from one plant), n = 6–23 plants per genotype from three separately grown flats. Error bars, SD. Groups indicated with the same letters are not significantly different as assessed by Kruskal–Wallis with Dunn’s post-hoc test when measurements were not normally distributed (B) or ANOVA with Scheffe’s post-hoc test when they were (D).
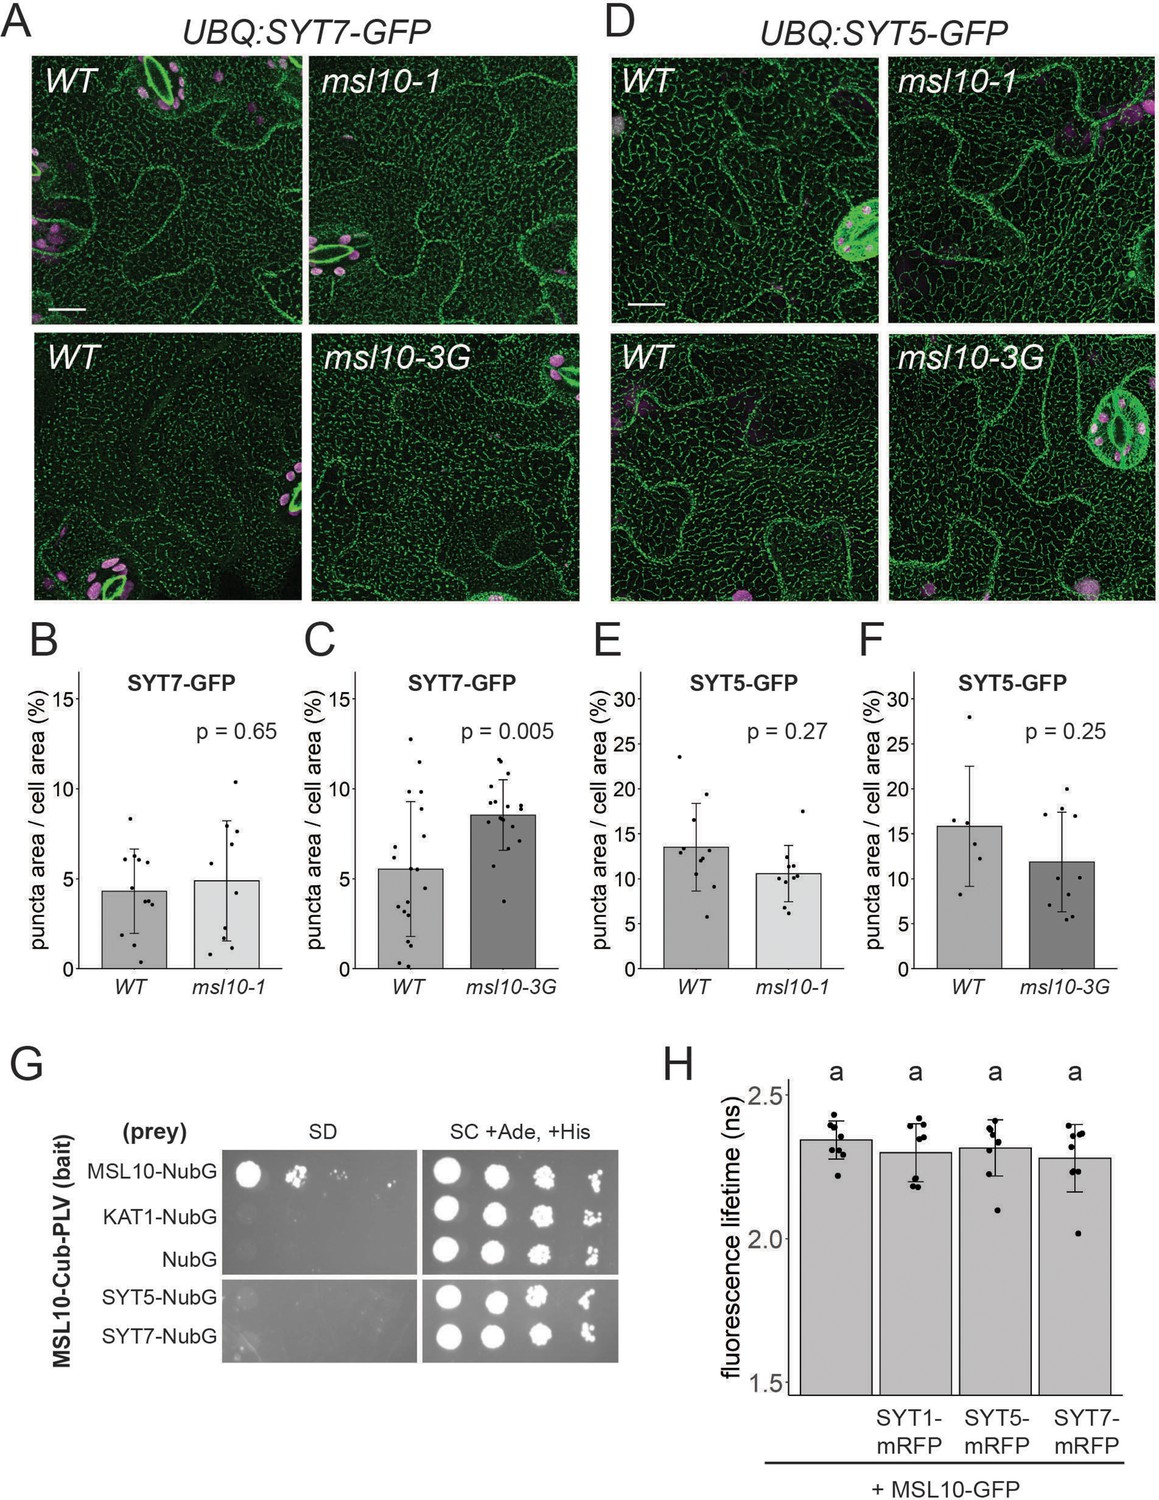
MSL10 does not interact with SYT5 or SYT7 or reliably influence their localization
As SYT1-EPCSs were expanded in msl10-3G leaf epidermal cells (Figure 4E and G), and SYT1 can interact with SYT5 and SYT7 (Ishikawa et al., 2020; Lee et al., 2020), we asked whether SYT5 and SYT7 localization were also altered in the msl10-3G background. We transformed WT Col-0 plants with GFP-tagged constructs under the control of the UBQ10 promoter and crossed these lines to msl10-1 and msl10-3G plants. Both SYT5-GFP and SYT7-GFP had a partially punctate, partially ER localization, as observed with mRFP-tagged versions expressed transiently in tobacco (Figure 8A and D, Figure 7—figure supplement 1). In some experiments, SYT7-GFP puncta were significantly larger in msl10-3G leaf epidermal cells (Figure 8C). However, this observation was not repeatable between experiments (Figure 8—figure supplement 1), suggesting that there are factors other than, or in addition to MSL10 that impact SYT7 EPCS structure. The size of SYT7 EPCSs was unaffected by the msl10-1 allele, and SYT5-GFP localization was similar in WT, msl10-3G, and msl10-1 leaves.
Figure 8 with 1 supplement see all
MSL10 does not interact with SYT5 or SYT7 nor reliably alter their localization.
(A, D) Confocal Z-projections (maximum intensity projection of Z-slices from the top to the middle of cells) of abaxial leaf epidermal cells from 4-week-old plants with the indicated MSL10 alleles. Scale = 15 µm. Quantification of the percentage of the leaf epidermal cell volume taken up by SYT7-GFP (B, C) or SYT5-GFP (E, F) puncta in plants in the msl10-1 or msl10-3G backgrounds compared to WT siblings (A–C) or cousins (D–F). Each data point represents a biological replicate (the mean value of 20–50 epidermal cells from one plant), n = 6–19 plants per genotype from 2 to 4 separately grown flats. Error bars, SD. Means were compared by Student’s t-tests. (G) Mating-based split-ubiquitin assay testing the interaction of MSL10 with SYT5 and SYT7, performed as in Figure 2A. (H) Fluorescence lifetime (τ) of GFP measured using Förster resonance energy transfer-fluorescence lifetime imaging microscopy (FRET-FLIM) when UBQ:MSL10-GFP was transiently expressed in tobacco leaves for 5 days, with or without UBQ:SYT-mRFP . Each data point represents the value from one field of view (three fields of view per plant from three infiltrated plants for a total of n = 9 for each combination). Error bars, SD. Groups indicated by the same letter are not statistically different according to ANOVA with Tukey’s post-hoc test.
We next asked whether MSL10 physically interacts with SYT5 or SYT7. Although SYT5 and SYT7 were not detected in the MSL10 interactome (Figure 1), those experiments were performed in seedlings, whereas the suppression of msl10-3G phenotypes by sdm26 and sdm34 alleles was observed in adult plants. In the mbSUS assay, yeast expressing SYT5 and SYT7 did not grow on minimal media when mated to yeast expressing MSL10 (Figure 8G). A FRET-FLIM assay also failed to provide evidence for a direct interaction between MSL10 and SYT proteins, as co-expression of mRFP-labeled SYT5, SYT7, and SYT1 did not shift the fluorescence lifetime of MSL10-GFP (Figure 8H). The lack of evidence for physical interactions between MSL10 and SYT1, SYT5, and SYT7 suggests that the observed suppression of the msl10-3G phenotype in sdm26 or sdm34 mutants is executed indirectly, perhaps through a complex or signaling intermediates.
In summary, in this study we identified three interactions between MSL10 and EPCSss: (1) a physical interaction between MSL10 and VAP27-1 and VAP27-3, (2) a functional interaction in which MSL10 promotes EPCS expansion, and (3) a genetic interaction in which mutations in SYT5 and SYT7 suppress MSL10’s signaling function.
Discussion
The MS ion channel MSL10 has been well studied using electrophysiological approaches (Haswell et al., 2008; Maksaev and Haswell, 2012; Maksaev et al., 2018). Genetic analyses have attributed a variety of roles to MSL10, like the induction of Ca2+ transients, reactive oxygen species accumulation, enhanced immune responses, and programmed cell death (Basu and Haswell, 2020a; Moe-Lange et al., 2021; Basu et al., 2022), but we lack a clear understanding of how MSL10 activation leads to these downstream signaling outcomes. Studies using multiple gain-of-function MSL10 alleles found that MSL10 signaling can trigger cell death independently of ion flux (Veley et al., 2014; Zou et al., 2016; Maksaev et al., 2018; Basu et al., 2020b), though it remains unknown how this occurs. To advance our understanding of the signaling function of MSL10, we used a combination of genetic, proteomic, and cell biological approaches in an attempt to identify MSL10’s signaling partners. We discovered previously unknown interactions between MSL10, which is localized to the plasma membrane, and proteins in the VAP27 and SYT families, which are integral ER membrane proteins. Figure 9 outlines these results and provides a framework for the discussion below. We propose a model wherein (1) a subpopulation of MSL10 directly interacts with VAP27s and creates EPCSs which (2) has implications for MSL10 function and (3) SYTs and MSL10 interact indirectly to modulate MSL10 signaling and SYT1 localization.
Figure 9
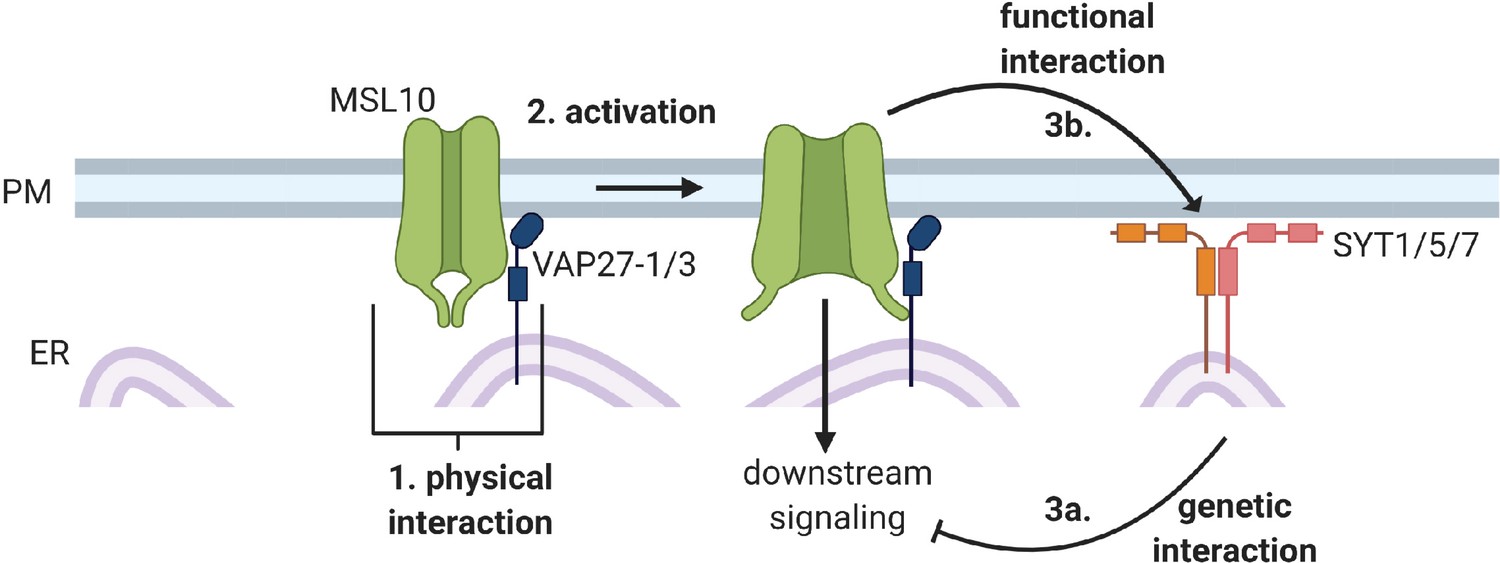
Conceptual model of interactions between MSL10 and EPCS proteins.
MSL10 physically associates with EPCS proteins
The first indication that MSL10 was part of a protein complex at EPCSs came from our search for proteins that co-immunoprecipitated with MSL10-GFP from seedling microsome extracts. VAP27-1, VAP27-3, and SYT1 were among the most enriched proteins in these pulldowns (Figure 1). Subsequent mbSUS and FRET-FLIM assays support a direct interaction between MSL10 and VAP27-1 and VAP27-3, but not SYT1 or 11 other proteins tested (Figure 2). SYT1, ACT8, and AT3G62360 have been detected in other EPCS proteomes (Ishikawa et al., 2020; Kriechbaumer et al., 2015), and were likely found in the MSL10 interactome because of their proximity to VAP27-1 and VAP27-3. Plant EPCSs typically contain either SYT1 or VAP27-1, but SYT1- and VAP27-1-EPCSs are often found adjacent to each other (Siao et al., 2016), suggesting a physical link between the two types of EPCSs. As MSL10 localizes to the PM (Figure 3; Haswell et al., 2008; Veley et al., 2014), and VAP27-1 and VAP27-3 localize to the ER (Figure 3; Saravanan et al., 2009; Wang et al., 2014), their interaction by definition creates EPCSs. While we cannot exclude the possibility that a small population of MSL10 in another endomembrane compartment interacts with VAP27s, the data presented here support a model wherein a subpopulation of the MSL10 present in the PM interacts with VAPs, thereby forming EPCSs.
Implications of VAP27-1/3 interaction for MSL10 cell death signaling
The only components of our proteome (among 14 tested proteins) that interacted directly with MSL10 were VAP27-1 and VAP27-3 (Figure 9, point 1). Broadly speaking, VAPs serve to recruit other proteins or protein complexes to the ER membrane. If the client protein is embedded in another organellar membrane, this interaction by definition leads to the formation of a membrane contact site (James and Kehlenbach, 2021). VAP27-1 interacts with SEIPIN2 and SEIPIN3 at ER-lipid droplet contact sites (Greer et al., 2020) and VAP27-3 recruits soluble oxysterol-binding protein-related protein ORP3a to the ER (Saravanan et al., 2009). At EPCSs, Arabidopsis VAP27-1 and VAP27-3 interact with clathrin and are required for normal rates of endocytosis, perhaps by recruiting clathrin to the PM (Stefano et al., 2018). Other VAP27-1 interactors include PM intrinsic protein (PIP)2;5, an aquaporin (Fox et al., 2020), AtEH1/Pan1, a protein that recruits endocytic proteins to autophagosomes that form at VAP27-1-containing EPCSs (Wang et al., 2019), and the actin-binding protein NETWORKED 3C (Wang et al., 2014). The cytosolic domains of VAP27-1 and VAP27-3 can interact with phospholipids (Stefano et al., 2018), raising the possibility that they may not need to interact with a protein in another membrane to create a membrane contact site.
Here, we add another VAP27 interactor, one that is associated with mechanical signaling. MSL10 signaling is hypothesized to be activated by membrane tension-induced conformational changes that lead to its dephosphorylation and the activation of its signaling function (Basu et al., 2020b). One could imagine that such post-translational modifications disrupt the ability of MSL10 to interact with VAP27-1 and VAP27-3, thereby activating downstream responses. However, the fact that phosphomimetic (MSL107D), phosphodead (MSL107A), and gain-of-function msl10-3G (MSL10 S640L) versions all interacted with VAP27-1 and VAP27-3 (Figure 2—figure supplement 1) implies that MSL10 signaling activation is independent of VAP binding. Rather, MSL10 and VAP27s are likely to interact constitutively, as they did so both in adult leaves, a tissue type in which MSL10-GFP overexpression promotes cell death signaling (Veley et al., 2014) and in seedlings, a stage where MSL10-GFP overexpression has no effect under normal conditions (Basu and Haswell, 2020a).
MSL10 channel and cell death signaling activities are separable (Veley et al., 2014; Maksaev et al., 2018), and VAP27-1 or VAP27-3 could influence either or both of these functions (Figure 9, point 2). In Zea mays, interaction with VAP27-1 increases the ability of the PM-localized aquaporin ZmPIP2;5 to transport water (Fox et al., 2020). Conversely, the mammalian Kv2.1 K+ channel forms non-conducting clusters when it interacts with the VAP27-1 homologs VAPA and VAPB (O’Connell et al., 2010; Fox et al., 2013; Fox et al., 2015; Johnson et al., 2018). It will be interesting to test whether association with VAP27-1 or VAP27-3 alters channel properties of MS such as tension sensitivity. Alternatively, interaction with VAP27s could bring ER-localized regulators of MSL10 signaling into proximity, as is the case for an ER-bound phosphatase and its PM receptor substrate (Haj et al., 2012).
Point mutations in SYT5 and SYT7 suppress MSL10 signaling
The msl10-3G suppressor screen produced two dominant extragenic sdm mutants that were successfully mapped to SYT5 and SYT7 genes (Figures 5 and 6). Plant synaptotagmins and homologous proteins in mammals (extended-synaptotagmins [E-SYTs]) and yeast (tricalbins) directly bridge the ER and PM via interaction between their C2 domains and PM phospholipids (Schulz and Creutz, 2004; Min et al., 2007; Giordano et al., 2013; Schapire et al., 2008; Pérez-Sancho et al., 2015; Ruiz-Lopez et al., 2021). E-SYTs and tricalbins non-selectively transport glycerolipids between membranes through their synaptotagmin-like mitochondrial lipid-binding (SMP) domains, and Arabidopsis SYT1 and SYT3 are hypothesized to transfer diacylglycerol from the PM to the ER during stress conditions (Ruiz-Lopez et al., 2021). The SYT5 S66F mutation (sdm26 allele) occurs just outside of the predicted SMP domain of SYT5, and the SYT7 G427R mutation (sdm34 allele) is found between two predicted C2 domains and near a coiled-coil domain (Figure 6). However, both sdm alleles were dominant, and both had the same effect of suppressing msl10-3G signaling (Figure 9, point 3a). Perhaps these lesions, both of which are in linker regions, influence the large-scale conformational changes that SYTs and E-SYTs are thought to undergo in the presence of Ca2+ and certain PM phosphatidylinositol phosphates (Bian et al., 2018; Benavente et al., 2021). This could affect the distance between the ER and PM and the transport of lipids between them, creating a novel lipid environment around MSL10 that might attenuate its ability to activate cell death signaling. Alternatively, the sdm mutations in SYT5 and SYT7 might alter the stoichiometry of other proteins at EPCSs, and in turn affect MSL10 function. To test these ideas, lipid transport, phospholipid binding, and interacting proteins should be compared between WT and mutant versions of SYT5 and SYT7.
SYT1-EPCSs are expanded in msl10-3G plants
EPCSs in plant epidermal cells expand in response to environmental perturbations like cold and ionic stress (Lee et al., 2019; Lee et al., 2020; Ruiz-Lopez et al., 2021). We did not find a role for MSL10 in salinity or mannitol-induced EPCS expansion, nor in the shrinking observed after hypo-osmotic shock (Figure 4—figure supplement 1). However, we did find that SYT1 EPCSs were constitutively expanded in leaf epidermal cells of adult msl10-3G plants (Figure 4). We did not observe expanded SYT5- or SYT7-EPCSs in msl10-3G plants (Figure 8). Although SYT1, SYT5, and SYT7 can interact with each other in immunoprecipitations of whole seedling extracts and in bimolecular fluorescence complementation assays (Ishikawa et al., 2020; Lee et al., 2020), perhaps they are not in a complex together in all cell types or developmental stages as we have drawn in the model for simplicity. We note that it is formally possible that SYT1, SYT5, and SYT7 play nonredundant roles along with MSL10. For example, only SYT5 and SYT7 were discovered in the genetic screen, and only SYT1 EPCSs were strongly affected in msl10-3G leaves. However, we favor the model that SYT1, SYT5, and SYT7 function redundantly and that each approach described here simply captured the interaction between MSL10 and different individual SYTs depending on their expression in a particular tissue and/or developmental stage.
Why are SYT1-EPCSs expanded in msl10-3G leaves? We previously reported that the msl10-3G allele promotes a stronger cytosolic Ca2+ transient in response to hypo-osmotic cell swelling than is seen in WT seedlings (Basu and Haswell, 2020a). The affinity of SYT1 for PM phospholipids is partially dependent on Ca2+ (Schapire et al., 2008; Pérez-Sancho et al., 2015), suggesting that MSL10 could affect SYT1 function. Alternatively, perhaps EPCSs are expanded in msl10-3G cells because these cells are already ‘stressed’; msl10-3G plants constitutively express markers of wounding and abiotic stress (Zou et al., 2016; Basu et al., 2020b). If overactive stress responses in msl10-3G plants increase PM phosphatidylinositol 4,5-bisphosphate (PI(4,5)P2) levels, as wounding (Mosblech et al., 2008) or saline conditions (Lee et al., 2019) do, SYT1-EPCS expansion could be promoted. Both of these scenarios are consistent with the fact that we do not observe altered EPCSs in null msl10-1 leaves. At the moment, the effects we observe on SYT1 area are limited to the gain-of-function msl10-3G allele.
However, we did find genetic interactions between the null msl10-1 allele and a SYT1-GFP overexpression transgene (Figure 4—figure supplement 1). In addition, we were unable to isolate any adult plants overexpressing VAP27-3-GFP in either the null msl10-1 or gain-of-function msl10-3G lines. Taken together, these unexpected genetic results may indicate that the stoichiometry of proteins at plant EPCSs is tightly balanced, and that when disturbed, perturbations of components even in opposing directions can be detrimental. In support of this idea, VAP27-1 gain-of-function and loss-of-function lines both have abnormal root hairs (Wang et al., 2016). Transient overexpression of two EPCS proteins at the same time can drastically alter plant ER and EPCS morphology or even cause necrosis (Wang et al., 2016; Ruiz-Lopez et al., 2021). Additionally, a yeast strain missing all EPCS tethering proteins is viable but cannot tolerate the loss of OSH4, a redundant lipid-transport protein (Quon et al., 2018; Quon et al., 2022). Thus, we interpret the synthetic lethality of MSL10 alleles and VAP27-3 or SYT1 overexpression transgenes as additional evidence that MSL10 functions at plant EPCSs, and we speculate that the ectopic cell death observed in plants overexpressing MSL10-GFP (Veley et al., 2014; Basu et al., 2020b) may be a consequence of altered stoichiometry of EPCS proteins and/or dysfunction of EPCSs. Future studies should examine the dynamics of MSL10, SYTs, and VAP27s in the presence, absence, and overexpression of each other—similar to the study of Siao et al., 2016—to begin to understand the influence they have on each other.
Implications of having a mechanosensitive ion channel at EPCSs
To our knowledge, MSL10 is the first mechanosensitive ion channel to be found in plant or animal EPCSs, but this may be an unsurprising location to find a mechanosensory protein in any system. It is hypothesized that plant EPCSs interact indirectly with the cell wall (Wang et al., 2017). VAP27-1 and SYT1 are found at Hechtian strands (Wang et al., 2016; Lee et al., 2020), sites of connection between the PM and the cell wall, and the mobility of VAP27-1 is constrained by the presence of a cell wall (Wang et al., 2016). Additionally, plant EPCSs link to the actin and microtubule cytoskeletons (Wang et al., 2014; Zang et al., 2021), which might convey or transduce mechanical information to or from the ER-PM-cell wall interface. By placing the mechanosensitive ion channel MSL10 at EPCSs, our results indicate that EPCSs will be an important nexus for understanding plant mechanotransduction cascades in a cellular context.
Materials and methods
Plant lines and growth conditions
Request a detailed protocolAll A. thaliana lines used in this study are in the Col-0 ecotype. msl10-3G (rea1) seeds were derived from an ethyl methanesulfonate (EMS) mutant screen (Zou et al., 2016) and subsequently backcrossed twice (once to parental RAP2.6::Luc background and once to Col-0) to remove additional EMS-induced mutations. T-DNA insertion mutants syt1-2 (SAIL_775_A08), syt5 (SALK_03961), and syt7 (SALK_006298) (Ishikawa et al., 2020) and msl10-1 (Haswell et al., 2008) were obtained from the Arabidopsis Biological Resource Center. UBQ:MAPPER-GFP seeds were a gift from Abel Rosado (Lee et al., 2019). Unless otherwise specified, plants were grown on soil at 22°C under a constant light regime (120 µmol m–2 s–1). To randomize position effects within flats, the position of individual genotypes within flats was changed between replicate experiments.
Genotyping
Request a detailed protocolDNA was isolated by homogenizing tissue in 300 µL crude extraction buffer (200 mM Tris–HCl pH 7.5, 250 mM NaCl, 250 mM EDTA, and 0.5% sodium dodecyl sulfate) followed by precipitation with an equal volume of isopropanol. Mutant lines were genotyped using the primers indicated in Table 2. The msl10-3G point mutation was genotyped using primers 663 and 702 followed by digestion with the Taq1 restriction enzyme, which cuts only the WT MSL10 allele. The sdm26 (SYT5 S66F) point mutation was genotyped using primers 4155 and 4156 followed by digestion with the Taq1 restriction enzyme, which cuts the mutant, but not WT SYT5 sequence. The sdm34 (SYT7 G427R) point mutation was genotyped using dCAPs primers 4231 and 4232 and digestion with the DdeI enzyme, which cuts the mutant but not the WT SYT7 allele.
Table 2
Primers used in subcloning, genotyping, and sequencing.
| # | Name | Sequence (5' → 3') | Purpose |
|---|---|---|---|
| 2229 | LBb1.3 | ATTTTGCCGATTTCGGAAC | Genotyping SALK T-DNA insertion lines |
| 3623 | msl10 salk F | GTTGGTTTCTGGGTTTAAGCC | msl10-1 genotyping |
| 3624 | msl10 salk R | TACTTGGAGTAACCGGTGCTG | msl10-1 genotyping |
| 702 | MSL10 exon2 For | GCAACGACTAAGGTTTTGCTG | msl10-3G genotyping (for CAPS with Taq1 digestion) |
| 663 | MSL10 exon4 Rev | GTTCTTCTTTGTGAGATTAATGTCTTGAGG | msl10-3G genotyping (for CAPS with Taq1 digestion), sequencing of MSL10 genomic DNA |
| 1214 | LB1.SAIL | GCTTTTCAGAAATGGATAAATAGCCTTGCTTCC | Genotyping SAIL T-DNA insertion lines |
| 4127 | syt1 genotyping F | GAATTGTCCATGTGAAAGTTGTG | syt1 genotyping |
| 4128 | syt5 genotyping F | CTGTCAGCGTTTCTCTTAGAG | syt5 genotyping |
| 4129 | syt5 genotyping R | GAAGAACGTCAACAGTTCAA | syt5 genotyping |
| 4130 | syt7 genotyping F | GAGAAAGCACTAGATAGTTTGACG | syt7 genotyping |
| 4131 | syt7 genotyping R | CTGCTGTTTTGCACCATC | syt7 genotyping |
| 4055 | VAP27-1 For | CACCATGAGTAACATCGATCTGATTG | Amplification of VAP27-1 ORF for pENTR/D-TOPO cloning |
| 3993 | VAP27-1 Rev | TGTCCTCTTCATAATGTATCCC | Amplification of VAP27-1 ORF for pENTR/D-TOPO cloning |
| 3988 | VAP27-3 For | CACCATGAGTAACGAGCTTCTCAC | Amplification of VAP27-3 ORF for pENTR/D-TOPO cloning |
| 4053 | VAP27-3 Rev | TTATGTCCTCTTCATAATGTATCC | Amplification of VAP27-3 ORF for pENTR/D-TOPO cloning |
| 3990 | SYT1 For | CACCATGGGCTTTTTCAGTACGATAC | Amplification of SYT1 ORF for pENTR/D-TOPO cloning |
| 3991 | SYT1 Rev | AGAGGCAGTTCGCCACTC | Amplification of SYT1 ORF for pENTR/D-TOPO cloning / syt1 genotyping |
| 4038 | ACT8 For | CACCATGGCCGATGCTGATGAC | Amplification of ACT8 ORF for pENTR/D-TOPO cloning |
| 4039 | ACT8 Rev | TTAGAAGCATTTTCTGTGGACAATGA | Amplification of ACT8 ORF for pENTR/D-TOPO cloning |
| 4024 | DL1 For | CACCATGGAAAATCTGATCTCTCTGGT | Amplification of DL1 ORF for pENTR/D-TOPO cloning |
| 4025 | DL1 Rev | CTTGGACCAAGCAACAGC | Amplification of DL1 ORF for pENTR/D-TOPO cloning |
| 4026 | RAB1c For | CACCATGAATCCTGAATATGACTATTTGTT | Amplification of RAB1c ORF for pENTR/D-TOPO cloning |
| 4027 | RAB1c Rev | TTAAGAGGAGCAGCAGCC | Amplification of RAB1c ORF for pENTR/D-TOPO cloning |
| 4020 | aCOP1 For | CACCATGTTGACAAAGTTCGAAACC | Amplification of COPA1 ORF for pENTR/D-TOPO cloning |
| 4052 | aCOP1 Rev | CCGGACTTGAGATGGAGAGCATA | Amplification of COPA1 ORF for pENTR/D-TOPO cloning |
| 4030 | LOS1 For | CACCATGGTGAAGTTTACAGCTG | Amplification of LOS1 ORF for pENTR/D-TOPO cloning |
| 4031 | LOS1 Rev | TTAAAGCTTGTCTTCGAAC | Amplification of LOS1 ORF for pENTR/D-TOPO cloning |
| 4036 | MTO3 For | CACCATGGAATCTTTTTTGTTCAC | Amplification of MTO3 ORF for pENTR/D-TOPO cloning |
| 4037 | MTO3 Rev | AGCTTGGACCTTGTTAGAC | Amplification of MTO3 ORF for pENTR/D-TOPO cloning |
| 3986 | AT3G44330 For | CACCATGGCGGAAGAGAAGAAAT | Amplification of M28 peptidase ORF for pENTR/D-TOPO cloning |
| 3987 | AT3G44330 Rev | TCCCATTTTCACTTTCCG | Amplification of M28 peptidase ORF for pENTR/D-TOPO cloning |
| 4032 | RPT1a For | CACCATGGTGAGAGATATTGAAGAT | Amplification of RPT1a ORF for pENTR/D-TOPO cloning |
| 4033 | RPT1a Rev | ATTGTAGACCATATACTTGGG | Amplification of RPT1a ORF for pENTR/D-TOPO cloning |
| 4028 | CAT2 For | CACCATGGATCCTTACAAGTATCGTC | Amplification of CAT2 ORF for pENTR/D-TOPO cloning |
| 4029 | CAT2 Rev | TTAGATGCTTGGTCTCACG | Amplification of CAT2 ORF for pENTR/D-TOPO cloning |
| 3994 | AT3G62360 For | CACCATGGCGGCCAGTAGGAAG | Amplification of AT3G44330 ORF for pENTR/D-TOPO cloning |
| 3995 | AT3G62360 Rev | GAACGTCTTCTTTCTAGCAACAGC | Amplification of AT3G44330 ORF for pENTR/D-TOPO cloning |
| 4022 | RAN1 For | CACCATGGCTCTACCTAACCAG | Amplification of RAN1 ORF for pENTR/D-TOPO cloning |
| 4023 | RAN1 Rev | CTCAAAGATATCATCATCGTC | Amplification of RAN1 ORF for pENTR/D-TOPO cloning |
| 3781 | MSL10g upstream seq For | CCCACAGTGTTCTTCTATAATC | Amplification of MSL10 genomic DNA |
| 3782 | MSL10g downstream seq Rev | CAGTATCACAACGTTTGGTA | Amplification of MSL10 genomic DNA |
| 699 | MSL10 exon1 For | CAGCACCGGTTACTCCAAGT | Sequencing of MSL10 genomic DNA |
| 701 | MSL10 exon1 For2 | ACACATTGGACGAAACAGCA | Sequencing of MSL10 genomic DNA |
| 1611 | MSL10 exon1 Rev | GTTATTGACGTTGAAATTCGCTGCAAGG | Sequencing of MSL10 genomic DNA |
| 2227 | MSL10 exon3 Rev | CGGACTTCTGAAGTAAGCGCTTATCGGTTTCGTGG | Sequencing of MSL10 genomic DNA |
| 3789 | MSL10 intron2 Rev | CCATAATTTATCTTTAAAGAATAAAAGCATG | Sequencing of MSL10 genomic DNA |
| 4145 | SYT5 S66F For | CCTGGGTTGTCTTCTTCGAGCGTCAGAAGTTG | Introducing S66F mutation into SYT5 by site-directed mutagenesis |
| 4146 | SYT5 S66F Rev | CAACTTCTGACGCTCGAAGAAGACAACCCAGG | Introducing S66F mutation into SYT5 by site-directed mutagenesis |
| 4147 | SYT7 G427R For | CAATGGATGCAGTCAGGATGGTGGGAAGTGG | Introducing G427R mutation into SYT7 by site-directed mutagenesis |
| 4148 | SYT7 G427R Rev | CCACTTCCCACCATCCTGACTGCATCCATTG | Introducing G427R mutation into SYT7 by site-directed mutagenesis |
| 4155 | SYT5 For | CACCATGGGTTTCATAGTCGGC | Amplifying SYT5 for S66F CAPs genotyping/ SYT5 Gateway cloning |
| 4156 | SYT5 internal rev | ACATAAGGCCAGATCTTTGTC | Amplifying SYT5 for S66F CAPs genotyping/ SYT5 Gateway cloning |
| 4231 | SYT7 dCAPs For | GTAGCACAATGGATGCACTC | Amplifying SYT7 for G427R dCAPs genotyping |
| 4232 | SYT7 internal Rev | ATCCACTACCGACCGCTC | Amplifying SYT7 for G427R dCAPs genotyping |
| 4157 | SYT5 Rev | GGAATCACGATAAATTGATTGA | Amplification of SYT5 for pENTR/D-TOPO cloning |
| 4158 | SYT7 For | CACCATGGGTTTGATTTCTGGG | Amplification of SYT7 for pENTR/D-TOPO cloning |
| 4159 | SYT7 Rev | CTGCTGTTTTGCACCATC | Amplification of SYT7 for pENTR/D-TOPO cloning |
| 1758 | attB1-F | ACAAGTTTGTACAAAAAAGCAGGCTCTCCAACCACCATG | Amplifying genes for split-ubiquitin cloning in yeast |
| 1759 | attB2-R | TCCGCCACCACCAACCACTTTGTACAAGAAAGCTGGGTA | Amplifying genes for split-ubiquitin cloning in yeast |
| 3196 | EF1α qRT For | ACAGGCGTTCTGGTAAGGAG | Amplifying EF1α transcripts for qPCR |
| 3197 | EF1α qRT Rev | CCTTCTTCACTGCAGCCTTG | Amplifying EF1α transcripts for qPCR |
| 4442 | SYT5 qRT For | AGAGGTGAAGCTTGTGCAAG | Amplifying SYT5 transcripts for qPCR |
| 4443 | SYT5 qRT Rev | TGTTGAGTTGACGCGTCTTC | Amplifying SYT5 transcripts for qPCR |
| 4444 | SYT7 qRT For | GCCTTGGACTTGTGAAACTTCC | Amplifying SYT7 transcripts for qPCR |
| 4445 | SYT7 qRT Rev | TCTTCCAACGCAGCCATTTG | Amplifying SYT7 transcripts for qPCR |
Cloning and generation of transgenic plants
Request a detailed protocolTo make SYT5g S66F and SYT7g G427R constructs, the SYT5 and SYT7 genomic sequences were amplified from pGWB553 SYT5g-mRFP and pGWB553 SYT7g-mRFP vectors (Ishikawa et al., 2020), which were a gift from Kazuya Ishikawa, and cloned into the pENTR vector using the pENTR/D-TOPO Cloning Kit (Thermo Fisher). These pENTR constructs were used as templates for site-directed mutagenesis to introduce SYT5 S66F or SYT7 G427R mutations (primers in Table 2). The mutated genomic sequences were subcloned back into pGWB553 vectors using Gibson Assembly with NEBuilder Hifi DNA Assembly Master Mix (NEB). The WT constructs included a C-terminal mRFP tag (Ishikawa et al., 2020), and the sdm constructs had a short, 31aa tag before a stop codon was reached. The resulting constructs were transformed into msl10-3G plants using Agrobacterium tumefaciens GV3101 and the floral dip method (Clough and Bent, 1998). T1 individuals were identified based on hygromycin resistance.
To make UBQ:SYT1-GFP, UBQ:SYT5-GFP, UBQ:SYT7-GFP, UBQ:VAP27-1-GFP, and UBQ:VAP27-3-GFP constructs, the SYT1, SYT5, SYT7, VAP27-1, and VAP27-3 coding sequences were amplified from Col-0 cDNA using primers in Table 2 and cloned into pENTR using pENTR/D-TOPO, then subcloned into the pUBC-GFP-DEST vector (Grefen et al., 2010) using LR Clonase II (Thermo Fisher recombination). The resulting constructs were introduced into Col-0 plants and transformed individuals were identified based on Basta resistance. T2 plants with moderate GFP fluorescence were crossed to msl10-1 and msl10-3G plants, and homozygous F2 siblings were identified by genotyping and by screening for Basta resistance. To make UBQ:mRFP-VAP27-1, UBQ:mRFP-VAP27-3, UBQ:SYT1-mRFP, UBQ:SYT5-mRFP, UBQ:SYT7-mRFP, and UBQ:MSL10-GFP, LR Clonase II recombination was used to subclone the coding sequences of VAP27-1 and VAP27-3 from pENTR into the pUBN-RFP-DEST vector, SYT1, SYT5, and SYT7 into pUBC-RFP-DEST, and MSL10 into pUBC-GFP-DEST (Grefen et al., 2010).
To make pK7-mRFP-VAP27-3g, the VAP27-3 genomic sequences were amplified from Col-0 genomic DNA. Using Gibson Assembly, this was cloned into the pK7FWG2 vector backbone, deleting the GFP tag and adding an N-terminal mRFP tag. For co-localization studies, this construct was transformed into Col-0 plants expressing a MSL10p:MSL10-GFP transgene (Haswell et al., 2008). T1 plants were identified by kanamycin resistance.
Newly created Arabidopsis lines will be submitted to the Arabidopsis Biological Resource Center (abrc.osu.edu), and plasmids deposited to Addgene.
Microsome isolation and immunoprecipitation
Request a detailed protocolSeeds of Col-0 and 35S:MSL10-GFP (line 12-3; Veley et al., 2014; Basu et al., 2020b) were densely sown on 1× Murashige and Skoog (MS) plates supplemented with 3% sucrose and grown vertically for 7 days in a 16 hr light/8 hr dark regime. Seedlings (1 g per replicate) were flash-frozen in liquid nitrogen and homogenized to a fine powder using a mortar and pestle. Protein extraction and microsome isolation protocols were modified from Abas and Luschnig, 2010. 1.5 mL of extraction buffer (100 mM Tris–HCl pH 7.5, 25% sucrose, 5% glycerol, 3.3% polyvinylpyrrolidone, 10 mM EDTA, 10 mM EGTA, 5 mM KCl, 1 mM DTT, 0.1 mM PMSF, 2 µM leupeptin, 1 µM pepstatin, 1× plant protease inhibitor cocktail [Sigma P9599], and 1× phosphatase inhibitor cocktails 2 [Sigma P5726] and 3 [Sigma P0044]) was added directly to the mortar and samples were homogenized in buffer for 2 min, then transferred to 1.5 mL tubes and incubated on ice for 10 min. Homogenates were centrifuged at 600 × g for 3 min (one replicate) or 10,000 × g for 10 min (three replicates) at 4°C to pellet cell debris and organelles. The supernatant was transferred to fresh tubes on ice, and the pellets were resuspended in half of the initial volume of extraction buffer using small plastic pestles. Resuspensions were centrifuged as above. Pooled supernatants were diluted 1:1 with ddH2O, then divided among 1.5 mL tubes, each with a maximum volume of 200 µL. Microsomes were pelleted by centrifugation at 21,000 × g for 2 hr at 4°C, and the supernatant was discarded.
Microsomal pellets were then resuspended in a total volume of 0.5 mL solubilization buffer (20 mM Tris–HCl pH 7.5, 150 mM NaCl, 2 mM EDTA, 10% glycerol, 0.5% Triton X-100, 0.25% NP-40, 0.1 mM PMSF, 2 µM leupeptin, 1 µM pepstatin, 1× plant protease inhibitor cocktail, and 1× phosphatase inhibitor cocktails 2 and 3) using small plastic pestles. Resuspended microsomes were incubated with end-over-end rotation at 4°C for 1 hr. Meanwhile, 65 µL of GFP-Trap Magnetic Agarose beads (Chromotek) per sample was prepared by washing twice with 1 mL 10 mM Tris–HCl, 150 mM NaCl, 0.5 mM EDTA. To this was added 400 µL of solubilized microsomes and 100 µL of solubilization buffer. Proteins were immunoprecipitated overnight with end-over-end rotation at 4°C. Beads were collected with a magnetic rack, and the flow-through was discarded. Beads were washed three times with 1 mL IP Wash Buffer 1 (20 mM Tris–HCl pH 7.5, 150 mM NaCl, 10% glycerol, 2 mM EDTA, 1% Triton X-100, and 0.5% NP-40), then six times with IP Wash Buffer 2 (20 mM Tris–HCl pH 7.5, 150 mM NaCl, 10% glycerol, 2 mM EDTA), switching to fresh tubes every other wash.
Liquid chromatography-tandem mass spectrometry (LC-MS/MS)
Request a detailed protocolProteins were eluted from the GFP-Trap beads by adding 100 µL of 8 M urea, then reduced in 10 mM dithiothreitol for 1 hr at room temperature (RT), and alkylated in the dark (50 mM 2-iodoacetamide) for 1 hr at RT. Excess alkylating agent was quenched with 50 mM DTT for 5 min at RT. Samples were diluted with 900 µL of 25 mM ammonium bicarbonate and digested overnight at 37°C in the presence of 0.35 µg of sequencing grade-modified porcine trypsin (Promega). Peptides were vacuum-dried in a centrifugal evaporator to approximately 250 µL, acidified with 10% trifluoroacetic acid (TFA) (pH < 3), desalted and concentrated on a 100 µL Bond Elut OMIX C18 pipette tip (Agilent Technologies A57003100) according to the manufacturer’s instructions. Peptides were eluted in 50 µL of 75% acetonitrile, 0.1% acetic acid, vacuum-dried in a centrifugal evaporator (Savant Instruments, model number SUC100H), and resuspended in 17 µL 5% acetonitrile, 0.1% formic acid.
Nanoscale liquid chromatography (LC) separation of tryptic peptides was performed on a Dionex Ultimate 3000 Rapid Separation LC system (Thermo Fisher). The protein digests were loaded onto a 20 μL nanoViper sample loop (Thermo Fisher) and separated on a C18 analytical column (Acclaim PepMap RSLC C18 column, 2 μm particle size, 100 Å pore size, 75 µm × 25 cm [Thermo Fisher]) by the application of a linear 2 hr gradient from 4% to 36% acetonitrile in 0.1% formic acid, with a column flow rate set to 250 nL/min. Analysis of the eluted tryptic peptides was performed online using a Q Exactive Plus mass spectrometer (Thermo Scientific) possessing a Nanospray Flex Ion source (Thermo Fisher) fitted with a stainless steel nanobore emitter operated in positive electrospray ionization (ESI) mode at a capillary voltage of 1.9 kV. Data-dependent acquisition of full MS scans within a mass range of 380–1500 m/z at a resolution of 70,000 was performed, with the automatic gain control (AGC) target set to 3.0 × 10⁶, and the maximum fill time set to 200 ms. High-energy collision-induced dissociation (HCD) fragmentation of the top eight most intense peaks was performed with a normalized collision energy of 28, with an intensity threshold of 4.0 × 10⁴ counts and an isolation window of 3.0 m/z, excluding precursors that had an unassigned, +1 or >+7, charge state. MS/MS scans were conducted at a resolution of 17,500, with an AGC target of 2 × 10⁵ and a maximum fill time of 300 ms. Dynamic exclusion was performed with a repeat count of 2 and an exclusion duration of 30 s, while the minimum MS ion count for triggering MS/MS was set to 4 × 10⁴ counts. The resulting MS/MS spectra were analyzed using Proteome Discoverer software (version 2.0.0.802, Thermo Fisher), which was set up to search the A. thaliana proteome database, as downloaded from http://www.tair.com/ (TAIR10_pep_20101214). Peptides were assigned using SEQUEST HT (Eng et al., 1994), with search parameters set to assume the digestion enzyme trypsin with a maximum of 1 missed cleavage, a minimum peptide length of 6, precursor mass tolerances of 10 ppm, and fragment mass tolerances of 0.02 Da. Carbamidomethylation of cysteine was specified as a static modification, while oxidation of methionine and N-terminal acetylation were specified as dynamic modifications. The target false discovery rate (FDR) of 0.01 (strict) was used as validation for peptide-spectral matches (PSMs) and peptides. Proteins that contained similar peptides and that could not be differentiated based on the MS/MS analysis alone were grouped to satisfy the principles of parsimony. Label-free quantification as previously described (Silva et al., 2006) was performed in Proteome Discoverer with a minimum Quan value threshold of 0.0001 using unique peptides, and ‘3 Top N’ peptides used for area calculation. All samples were injected in technical duplicate, and the resulting values were averaged. The mass spectrometry proteomics data have been deposited to the ProteomeXchange Consortium via the PRIDE partner repository (Perez-Riverol et al., 2019) with the dataset identifier PXD018747.
Using the Perseus platform (Tyanova et al., 2016), intensity values from mass spectrometry were log2 imputed and missing values were replaced with random numbers from a Gaussian distribution with a width of 0.3 and a downshift of 1.8. Statistical significance was determined using t-tests. Only proteins with >8 peptide spectrum matches were included in volcano plots.
mbSUS assay
Request a detailed protocolThe coding sequence for the 14 proteins selected from the MSL10 interactome were amplified from Col-0 cDNA using primers in Table 2 and cloned into pENTR using pENTR/D-TOPO, then subcloned into the pK7FWG2 destination vector (Karimi et al., 2002) or BiFC destination vectors (Gehl et al., 2009) using LR Clonase II recombination. These constructs were used as templates for PCR amplification with attB1 For and attB2 Rev primers (Table 2). Following the protocol of Obrdlik et al., 2004 and Basu et al., 2020b, attB-flanked inserts were combined with linearized vectors and transformed into yeast for recombinational in vivo cloning. Inserts were cloned into pMetYCgate for a C-terminal fusion with Cub, pXNgate21-3HA for a C-terminal fusion with NubG, or pNXgate33-3HA for an N-terminal NubG fusion. For integral membrane proteins, split-ubiquitin tags were placed at the terminus predicted to lie in the cytosol. For soluble proteins, the NubG tag was placed on the terminus where fusions had previously reported to be tolerated (or, for unstudied proteins, where homologous proteins had been tagged). NubG vectors and inserts were transformed into THY.AP5 cells (ABRC stock CD3-809, derived from Saccharomyces cerevisiae 4932) and selected on synthetic complete (SC) plates lacking tryptophan and uracil. Cub vectors and inserts were transformed into THY.AP4 cells (ABRC stock CD3-808) and selected on SC plates lacking leucine. Transformed cells were mated and diploids selected on SC media lacking tryptophan, uracil, and leucine. Overnight cultures of diploid cells were pelleted, resuspended in dH2O to an OD600 of 1.0, and 4 µL of a 10× dilution series were spotted onto synthetic minimal (SD) or SC + Ade + His media. Growth was assessed 3 days after plating; growth on SC + Ade + His media tested the presence of both constructs. To quantify the strength of interactions, β-galactosidase activity in liquid cultures was assayed using CPRG as substrate as described in the Yeast Protocols Handbook (Takara, PT3024-1).
FRET-FLIM
Request a detailed protocolUBQ:mRFP-VAP27-1, UBQ:mRFP-VAP27-3, UBQ:SYT1-mRFP, UBQ:SYT5-mRFP, UBQ:SYT7-mRFP, and UBQ:MSL10-GFP plasmids were transformed into A. tumefaciens GV3101. Following the protocol of Waadt and Kudla, 2008, construct pairs were co-infiltrated into Nicotiana benthamiana leaves along with A. tumefaciens strain AGL-1 (from Herman Scholthof, which harbors p19 to suppress gene silencing). Five days post-infiltration, leaves were imaged using a Leica TCS SP8 Multiphoton microscope fitted with an HC PL IRAPO ×40/1.10 WATER objective. The tunable multiphoton laser was adjusted to its optimum excitation for EGFP (920 nm), and fluorescence lifetimes were recorded in an emission range of 595–570 nm. Using the Leica LASX software’s FLIM tool, an n-Exponential Reconvolution model with one component was used to calculate the average fluorescence lifetime of GFP per image.
Co-localization analysis
Request a detailed protocolLeaves of plants co-expressing MSL10p:MSL10-GFP and mRFP-VAP27-3g were imaged using an Olympus FV3000 confocal microscope with a UPLSAPO 100XS oil-immersion objective. Then, 8–12 Z-slices were captured at the equator of abaxial leaf epidermal cells, and these Z-stacks were deconvolved. For each image, regions of interest (ROIs) were defined at the periphery of four different cells. Co-localization was quantified using the ‘Co-localization’ tool of the Olympus cellSens software, using the ‘Rectangle’ mode to automatically estimate thresholds, and the mean of the Mander’s coefficients was calculated from the four ROIs in four Z-slices.
Confocal microscopy and quantification of ER–PM contact sites
Request a detailed protocolLines expressing MAPPER-GFP, SYT1-GFP, SYT5-GFP, SYT7-GFP, VAP27-1-GFP, and VAP27-3-GFP under the control of the UBQ10 promoter were visualized using an Olympus FV3000 confocal microscope with a UPLSAPO 100XS oil-immersion objective. GFP was excited using a 488 nm laser and detected in the 500–540 nm range. Chlorophyll autofluorescence was excited by the same laser and detected in the 650–750 nm range. Z-stacks were taken of abaxial leaf epidermal cells beginning at the top of the cell and ending with an equatorial slice. Z-stacks were deconvolved with the Olympus CellSens software using the Advanced Maximum Likelihood Algorithm with five iterations. The area of MAPPER-GFP or SYT1-GFP puncta was quantified using Fiji (Schindelin et al., 2012). Deconvolved Z-stacks were converted to a Z-projection (sum slices for MAPPER-GFP and maximum intensity for SYT1/5/7-GFP) and the area of each cell was traced and set as an ROI, excluding the periphery of cells where puncta were typically overlapping. After thresholding (between 25–255 for MAPPER-GFP, 100–255 for SYT1-GFP, 85–255 for SYT7-GFP, and 70–255 for SYT5-GFP), the ‘Analyze Particles’ function was used to quantify the percentage of cell area that the puncta represented for each ROI.
Identification of suppressed death from msl10-3G (sdm) mutants
Request a detailed protocol250 mg of backcrossed msl10-3G seeds (approximately 12,500 seeds) were treated with 0.4% EMS as described in Kim et al., 2006. Mutagenized seeds were sown directly on soil in 40 pools, stratified for 2 days at 4°C, then transferred to a 22°C growth chamber. sdm mutants were identified based on increased height compared to parental msl10-3G plants 4–5 weeks after sowing, each from individual pools. When multiple plants with sdm phenotypes were seen in the same M2 pool, they were assumed to be from the same parent. sdm mutants were genotyped to ensure they had the msl10-3G point mutation. To see whether sdm mutants harbored second-site mutations in the MSL10 gene, the locus was PCR-amplified using primers 3781 and 3782 and Sanger-sequenced using primers 663, 699, 701, 1611, 2227, and 3789 (Table 2). sdm26 and sdm34 were backcrossed to msl10-3G plants, and rosette leaves from 30 to 50 F2 progeny were separated into two pools based on phenotype: msl10-3G (dwarfed) or sdm (suppressed). Genomic DNA was extracted from pooled tissue following the protocol described in Thole et al., 2014 and submitted to the Genome Technology Access Center at the McDonnell Genome Institute (GTAC@MGI) at the WUSTL Medical Center. Libraries were prepared using the Kapa HyperPrep Kit PCR-free (Roche) and sequenced on an Illumina NovaSeq 6000 S4 Flowcell using 150 nt paired-end reads and 80× coverage. GTAC@MGI aligned reads to the A. thaliana Col-0 reference genome (TAIR10.1 assembly), called variants using SAMtools (Li et al., 2009), and annotated them using snpEff (Cingolani et al., 2012). Variants were filtered to include those with a quality score of >20 and a total depth of >5. SNPs that were present in multiple sdm mutants were removed, as they were likely present in the parental msl10-3G line. For each of the retained SNPs, the allele frequency (mutant/reference) was plotted against chromosomal position.
Alignment of SYT5 and SYT7 protein sequences
Request a detailed protocolSYT5 and SYT7 homologs in other plant species were identified using the BLAST tools in Phytozome 13 or NCBI using the Arabidopsis SYT5 and SYT7 amino acid sequences as queries. To remove sequences that were orthologous to other Arabidopsis synaptotagmins, we aligned the obtained sequences to the protein sequences of the seven known synaptotagmins in Arabidopsis and constructed a Neighbor-Joining phylogenic tree in Mega 11. We then considered only those sequences that were in the same clade as AtSYT5 or AtSYT7 to be SYT5 or SYT7 homologs. SYT5 homologs identified with this method and shown in Figure 6C have the following accession numbers from Phytozome: B. rapa B.rapaFPsc v1.3|Brara.J00373.1.p, V. vinifera v2.1|VIT_211s0118g00230.2, P. trichocarpa v4.1|Potri.018G025000.3.p, O. sativa v7.0|LOC_Os04g55220.1, B. distachyon v3.2|Bradi5g23880.2.p. From NCBI: N. tabacum XP_016446163.1. SYT7 homologs identified in Phytozome include B. rapa B.rapaFPsc v1.3|Brara.D00127.1.p, V. vinifera v2.1|VIT_215s0048g01410.1, P. trichocarpa v4.1|Potri.014G072800.2.p, O. sativa v7.0|LOC_Os07g22640.1, B. distachyon v3.2|Bradi1g52680.1.p. From NCBI: N. tabacum XP_016486625.1.
Trypan blue staining
Request a detailed protocolA stock solution of Trypan blue (0.025% in a 1:1:1:1 solution of phenol:lactic acid:glycerol:water) was diluted with ethanol to make a working solution (one part Trypan blue:two parts ethanol). This was heated to boiling, then allowed to cool for 10 min. Then, 4- or 5-week-old rosette leaves were submerged in working solution and gently agitated for 15 min. Chlorophyll was removed from leaves by submerging them in an ethanol series, and finally by repeated changes in 1:1:1:1 ethanol:acetic acid:glycerol:water. Leaves were mounted in 20% glycerol for imaging with ×10 magnification.
Immunoblotting
Request a detailed protocolRosette leaves were flash-frozen and homogenized in a microcentrifuge tube using a small plastic pestle. Then, 4 µL of 2× sample buffer was added for every 1 mg of tissue, this mixture was denatured for 10 min at 70°C, and cell debris pelleted by centrifugation at 5000 × g for 1 min. Supernatants were resolved on 10% SDS-PAGE gels and transferred overnight to PVDF membranes (Bio-Rad) at 100 mA. Blocking and antibody incubations were performed in 5% non-fat dry milk in 1× TBS-T buffer. MSL10 tagged with GFP was detected using an anti-GFP antibody (Takara #632380, RRID:AB_10013427) for 16 hr at a dilution of 1:5000, followed by a 1 hr incubation in HRP-conjugated goat-anti-mouse secondary antibody at a 1:10,000 dilution (Millipore #12-349, RRID:AB_390192). Blots were stripped and reprobed with anti-α-tubulin (Sigma T5168, RRID:AB_477579, 1:30,000 dilution) for 1 hr. Proteins were detected using the SuperSignal West Dura Extended Duration Substrate (Thermo Fisher).
Gene expression analysis
Request a detailed protocolRosette leaves were flash-frozen in liquid nitrogen and homogenized into a powder. RNA was extracted using RNeasy Kit (QIAGEN) following the manufacturer’s instructions for plant RNA isolation and on-column DNase digestion. cDNA was synthesized using M-MLV reverse transcriptase (Promega) and oligo(dT) priming. qRT-PCR was performed in technical triplicate using the SYBR Green PCR Master Mix (Thermo Fisher) kit, with primers specific to SYT5, SYT7, or ELONGATION FACTOR 1α (EF1 α) transcripts (Table 2) on a StepOne Plus Real-time PCR System (Applied Biosystems).
Accession numbers
Request a detailed protocolThe genes utilized in this study have the following Arabidopsis Genome Initiative locus codes: MSL10 (At5G12080), VAP27-1 (At3G60600), VAP27-3 (At2G45140), SYT1 (At2G20990), SYT5 (At1G05500), SYT7 (At3G61050), ACTIN 8 (ACT8, At1G49240), DYNAMIN-LIKE 1 (DL1, At5G42080), RAB GTPase homolog 1C (RAB1c, At4G17530), METHIONINE OVERACCUMULATOR 3 (MTO3, At3G17390), COATOMER ALPHA-1 SUBUNIT (αCOP1, At1G62020), unnamed protein with a carbohydrate-binding like fold (At3G62360), unnamed protein-M28 Zn-peptidase nicastrin (At3G44330), RAS-RELATED NUCLEAR PROTEIN 1 (RAN1, At5G20010), CATALASE 2 (CAT2, At4G35090), LOW EXPRESSION OF OSMOTICALLY RESPONSIVE GENES 1 (LOS1, At1G56070), REGULATORY PARTICLE TRIPLE-A 1A (RPT1a, At1g53750), POTASSIUM CHANNEL IN ARABIDOPSIS THALIANA 1 (KAT1, At5G46240).
Statistical analyses
Request a detailed protocolStatistical analyses were performed in RStudio (v4.1.2), except for chi-squared tests, which were performed in Microsoft Excel. Shapiro–Wilk tests were used to test for normality. The car and agricolae packages were used to perform ANOVAs and indicated post-hoc tests, and FSA and rcompanion packages for Kruskal–Wallis and Dunn’s post-hoc tests. Data was visualized using RStudio ggplot2, GraphPad Prism 7, and Excel. The Venn diagram shown in Figure 1B was created using http://bioinformatics.psb.ugent.be/webtools/Venn/.
Data availability
Mass spectrometry data have been deposited to the ProteomeXchange Consortium via the PRIDE partner repository with the dataset identifier PXD018747, and is included as a Source Data file for Figure 1.
-
PRIDEID PXD018747. Genetic and proteomic screens suggest that signaling by the mechanosensitive ion channel MSL10 is influenced by its association with a synaptotagmin complex.
References
-
Eukaryotic mechanosensitive channelsAnnual Review of Biophysics 39:111–137.https://doi.org/10.1146/annurev.biophys.37.032807.125836
-
The mechanosensitive ion channel MSL10 modulates susceptibility to pseudomonas syringae in Arabidopsis thalianaMolecular Plant-Microbe Interactions 35:567–582.https://doi.org/10.1094/MPMI-08-21-0207-FI
-
Plant cell mechanobiology: greater than the sum of its partsThe Plant Cell 34:129–145.https://doi.org/10.1093/plcell/koab230
-
An approach to correlate tandem mass spectral data of peptides with amino acid sequences in a protein databaseJournal of the American Society for Mass Spectrometry 5:976–989.https://doi.org/10.1016/1044-0305(94)80016-2
-
Regulation of Kv2.1 K (+) conductance by cell surface channel densityThe Journal of Neuroscience 33:1259–1270.https://doi.org/10.1523/JNEUROSCI.3008-12.2013
-
Induction of stable ER-plasma-membrane junctions by Kv2.1 potassium channelsJournal of Cell Science 128:2096–2105.https://doi.org/10.1242/jcs.166009
-
United in diversity: mechanosensitive ion channels in plantsAnnual Review of Plant Biology 66:113–137.https://doi.org/10.1146/annurev-arplant-043014-114700
-
Gateway vectors for Agrobacterium-mediated plant transformationTrends in Plant Science 7:193–195.https://doi.org/10.1016/s1360-1385(02)02251-3
-
Ems mutagenesis of arabidopsisMethods in Molecular Biology 323:101–103.https://doi.org/10.1385/1-59745-003-0:101
-
The sequence alignment/map format and samtoolsBioinformatics 25:2078–2079.https://doi.org/10.1093/bioinformatics/btp352
-
Endoplasmic reticulum-plasma membrane contact sites: regulators, mechanisms, and physiological functionsFrontiers in Cell and Developmental Biology 9:627700.https://doi.org/10.3389/fcell.2021.627700
-
Retrograde signaling: understanding the communication between organellesInternational Journal of Molecular Sciences 21:E6173.https://doi.org/10.3390/ijms21176173
-
Quantifying the impact of public omics dataNature Communications 10:3512.https://doi.org/10.1038/s41467-019-11461-w
-
The functional universe of membrane contact sitesNature Reviews. Molecular Cell Biology 21:7–24.https://doi.org/10.1038/s41580-019-0180-9
-
Calcium-dependent and -independent lipid transfer mediated by tricalbins in yeastThe Journal of Biological Chemistry 296:100729.https://doi.org/10.1016/j.jbc.2021.100729
-
Control of plasma membrane lipid homeostasis by the extended synaptotagminsNature Cell Biology 18:504–515.https://doi.org/10.1038/ncb3339
-
Fiji: an open-source platform for biological-image analysisNature Methods 9:676–682.https://doi.org/10.1038/nmeth.2019
-
The different facets of organelle interplay-an overview of organelle interactionsFrontiers in Cell and Developmental Biology 3:56.https://doi.org/10.3389/fcell.2015.00056
-
Coming together to define membrane contact sitesNature Communications 10:1287.https://doi.org/10.1038/s41467-019-09253-3
-
Absolute quantification of proteins by LCMSE: a virtue of parallel MS acquisitionMolecular & Cellular Proteomics 5:144–156.https://doi.org/10.1074/mcp.M500230-MCP200
-
Abscisic acid regulates root elongation through the activities of auxin and ethylene in Arabidopsis thalianaG3: Genes, Genomes, Genetics 4:1259–1274.https://doi.org/10.1534/g3.114.011080
-
UniProt: the universal protein knowledgebase in 2021Nucleic Acids Research 49:D480–D489.https://doi.org/10.1093/nar/gkaa1100
-
Mighty dwarfs: arabidopsis autoimmune mutants and their usages in genetic dissection of plant immunityFrontiers in Plant Science 7:369–378.https://doi.org/10.3389/fpls.2016.01717
-
Plant endoplasmic reticulum-plasma membrane contact sitesTrends in Plant Science 22:289–297.https://doi.org/10.1016/j.tplants.2016.11.008
-
Sticking with it: ER-PM membrane contact sites as a coordinating nexus for regulating lipids and proteins at the cell cortexFrontiers in Cell and Developmental Biology 8:675.https://doi.org/10.3389/fcell.2020.00675
-
A gain-of-function mutation in msl10 triggers cell death and wound-induced hyperaccumulation of jasmonic acid in ArabidopsisJournal of Integrative Plant Biology 58:600–609.https://doi.org/10.1111/jipb.12427
Article and author information
Author details
Richard David Vierstra

Elizabeth S Haswell
Funding
HHMI-Simons Faculty Scholar Grant (55108530)
- Elizabeth S Haswell
National Science Foundation (MCB 1253103)
- Elizabeth S Haswell
National Science Foundation (CMMI-1548571)
- Elizabeth S Haswell
National Science Foundation (DGE-1745038)
- Jennette M Codjoe
Washington University in St. Louis (William H. Danforth Plant Sciences Fellowship)
- Jennette M Codjoe
National Institutes of Health (R01-GM124452)
- Richard David Vierstra
The funders had no role in study design, data collection and interpretation, or the decision to submit the work for publication.
Acknowledgements
Heather Grossman generated the amino acid alignments in Figure 6C. Kazuya Ishikawa (Utsonomiya University) provided SYT5g-mRFP and SYT7g-mRFP plasmids and shared their full SYT1 immunoprecipitation-mass spectrometry dataset. Abel Rosado (University of British Columbia) provided the UBQ:MAPPER-GFP line. We thank the staff of the Jeanette Goldfarb Plant Growth Facility for plant growth assistance. Whole-genome sequencing in this publication was made possible in part by Grant Number UL1 RR024992 from the NIH-National Center for Research Resources (NCRR). This work was supported by HHMI-Simons Faculty Scholar Grant 55108530 to ESH, National Science Foundation grant MCB 1253103 to ESH, National Institutes of Health grant R01-GM124452 to RDV, and the NSF Center for Engineering Mechanobiology grant CMMI-1548571. JMC was supported by NSF Graduate Research Fellowship DGE-1745038 and a William H Danforth Plant Sciences Fellowship. Figure 9 was created using BioRender.com.
Copyright
© 2022, Codjoe et al.
This article is distributed under the terms of the Creative Commons Attribution License, which permits unrestricted use and redistribution provided that the original author and source are credited.
Metrics
-
- 2,633
- views
-
- 607
- downloads
-
- 20
- citations
Views, downloads and citations are aggregated across all versions of this paper published by eLife.
Citations by DOI
-
- 20
- citations for umbrella DOI https://doi.org/10.7554/eLife.80501
Download links
A two-part list of links to download the article, or parts of the article, in various formats.
Downloads (link to download the article as PDF)
Open citations (links to open the citations from this article in various online reference manager services)
Cite this article (links to download the citations from this article in formats compatible with various reference manager tools)
Unbiased proteomic and forward genetic screens reveal that mechanosensitive ion channel MSL10 functions at ER–plasma membrane contact sites in Arabidopsis thaliana
eLife 11:e80501.
https://doi.org/10.7554/eLife.80501


