Osteocytes regulate senescence of bone and bone marrow
- Department of Orthopaedics, Shanghai Sixth People’s Hospital Affiliated to Shanghai Jiao Tong University School of Medicine, China
- Centre for Orthopaedic Translational Research, Medical School, University of Western Australia, Australia
- Perron Institute for Neurological and Translational Science, Australia
- Ningbo Institute of Life and Health Industry, University of Chinese Academy of Sciences, China
- Institute of Microsurgery on Extremities, Shanghai Sixth People’s Hospital Affiliated to Shanghai Jiao Tong University School of Medicine, China
Figures
Figure 1 with 1 supplement
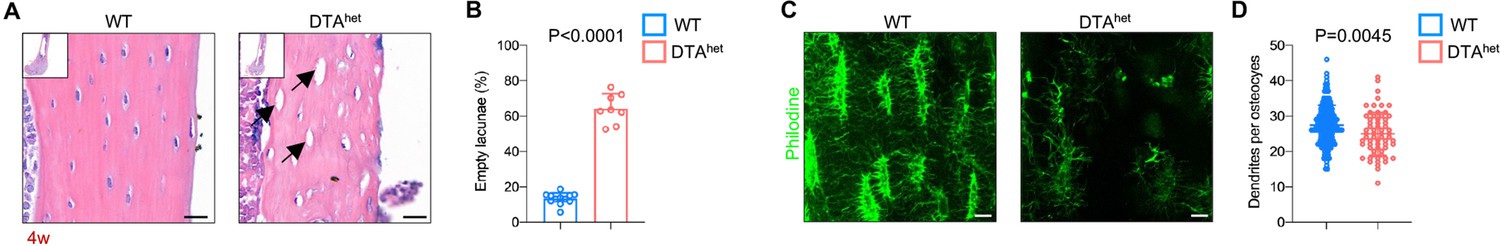
DTAhet mice display partial osteocyte ablation.
(A, B) Hematoxylin–eosin staining of WT and DTAhet mice femur at 4 weeks (A) and quantification of the ratio of empty lacunae (arrows) (B) (n = 8–12 per group), indicating reduced osteocyte number in DTAhet mice. Scare bar, 20 µm. (C, D) Immunofluorescence staining of femoral cortical bone of 4-week-old WT and DTAhet mice (C) and quantification of dendrites per osteocyte based on the images (D) (n = 152 osteocytes in WT group and n = 64 osteocytes in DTAhet group). Scare bar, 20 µm. Error bar represents the standard deviation.
-
Figure 1—source data 1
DTAhet mice display partial osteocyte ablation.
- https://cdn.elifesciences.org/articles/81480/elife-81480-fig1-data1-v2.xlsx
Figure 1—figure supplement 1

Osteocyte ablation has no impact on embryonic skeletal development.
(A) Whole-mount skeleton staining of WT and DTAhet mice at E19.0 by Alizarin red/Alcian blue. (B, C) Hematoxylin–eosin staining of WT and DTAhet mice femur at 13 weeks (B) and quantification of the ratio of empty lacunae (C) (n = 6 per group). Scare bar, 20 µm. Error bar represents the standard deviation.
-
Figure 1—figure supplement 1—source data 1
DTAhet mice display partial osteocyte ablation.
- https://cdn.elifesciences.org/articles/81480/elife-81480-fig1-figsupp1-data1-v2.xlsx
Figure 2 with 2 supplements
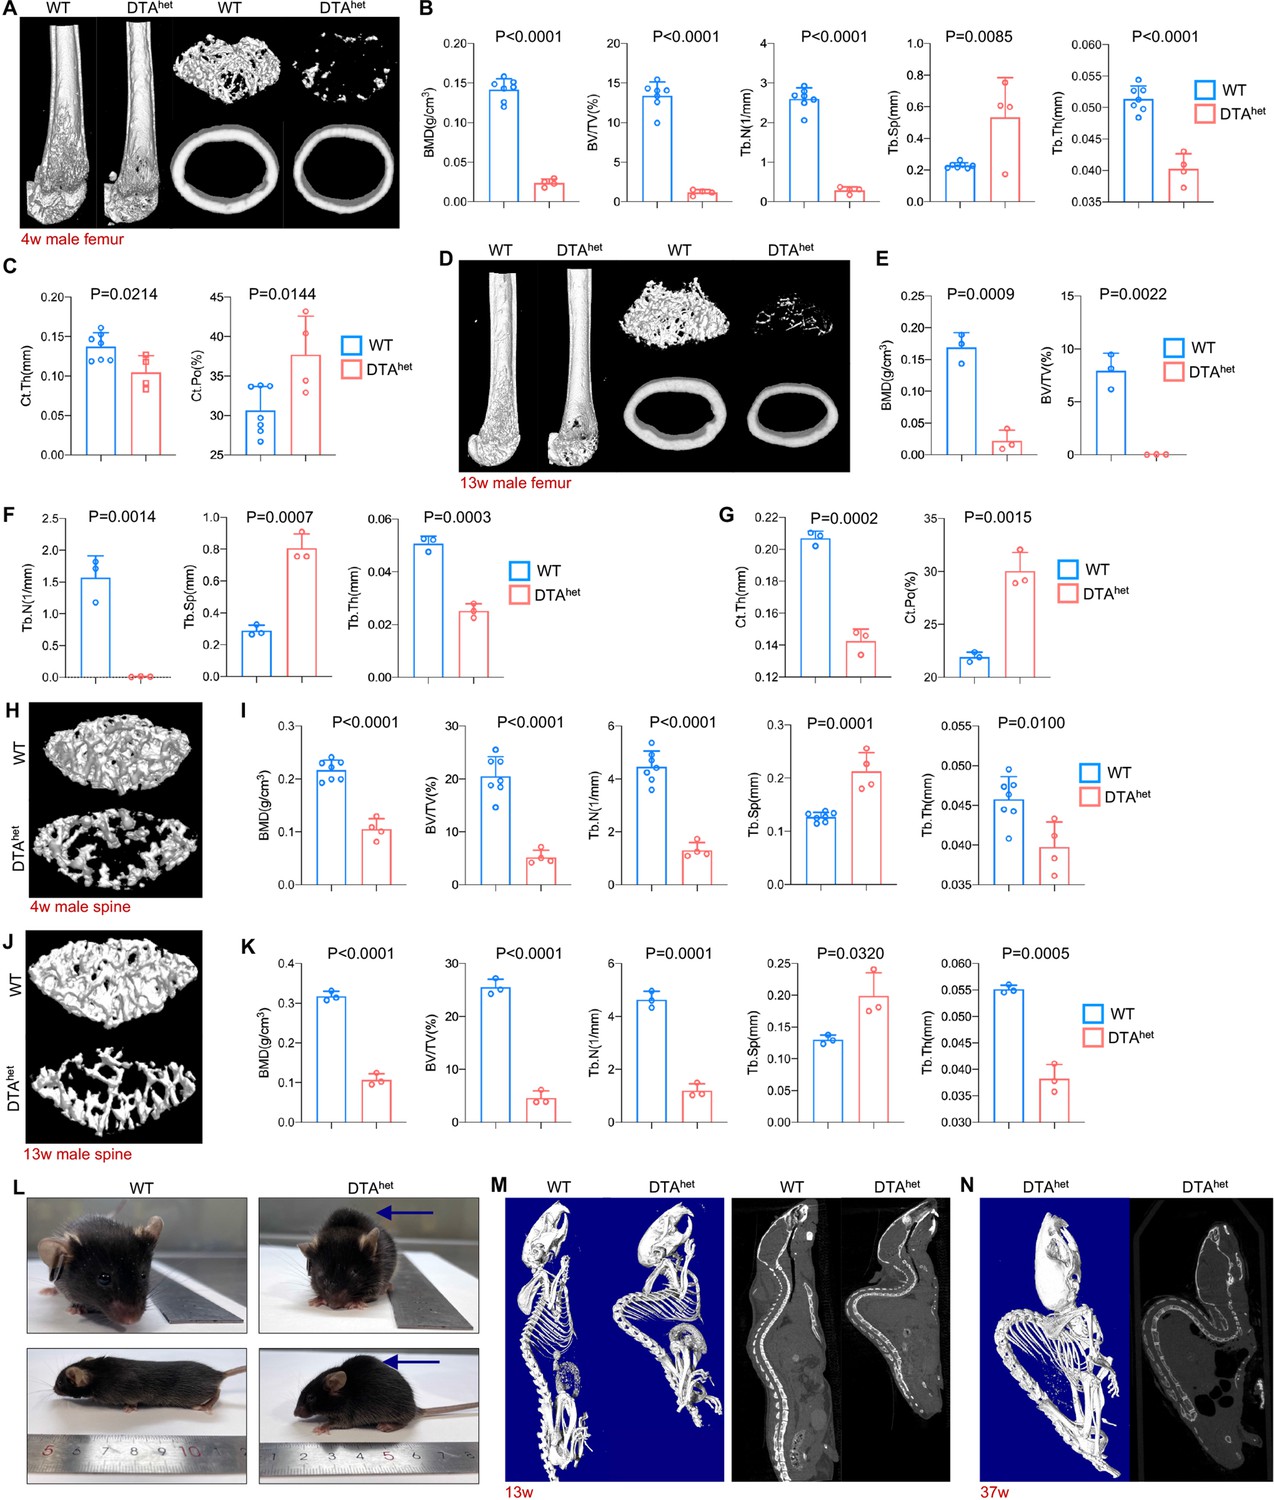
Osteocyte ablation induces severe osteoporosis and kyphosis.
(A–C) Representative micro-computed tomography (µCT) reconstructive images of male WT and DTAhet mice femur at 4 weeks (A) and trabecular microstructural parameters (BMD, bone mineral density; BV/TV, bone volume fraction; Tb.N, trabecular number; Tb.Sp, trabecular separation; , Tb.Th, trabecular thickness) (B) and cortical microstructural parameters (Ct.Th, cortical thickness; Ct.Po, cortical porosity) (C) derived from µCT analysis (n = 4–7 per group). (D–G) Representative µCT reconstructive images of male WT and DTAhet mice femur at 13 weeks (D) and trabecular microstructural parameters (BMD, BV/TV, Tb.N, Tb.Sp, and Tb.Th) (E, F) and cortical microstructural parameters (Ct.Th and Ct.Po) (G) derived from µCT analysis (n = 3 per group), demonstrating severe bone loss in DTAhet mice. (H, I) Representative µCT reconstructive images of male WT and DTAhet mice third lumbar at 4 weeks (H) and trabecular microstructural parameters (BMD, BV/TV, Tb.N, Tb.Sp, and Tb.Th) (I) derived from µCT analysis (n = 4–7 per group). (J, K) Representative µCT reconstructive images of male WT and DTAhet mice third lumbar at 13 weeks (J) and trabecular microstructural parameters (BMD, BV/TV, Tb.N, Tb.Sp, and Tb.Th) (K) derived from µCT analysis (n = 3 per group), showing vertebral body bone loss in the spine of DTAhet mice. (L) Gross images of male WT and DTAhet mice at 13 weeks. (M) Representative whole-body µCT reconstructive and sagittal images of male WT and DTAhet mice at 13 weeks. (N) Representative whole-body µCT reconstructive and sagittal images of male DTAhet mice at 37 weeks, noting that severe kyphosis occurred in DTAhet mice. Error bar represents the standard deviation.
-
Figure 2—source data 1
Osteocyte ablation induces severe osteoporosis in male mice.
- https://cdn.elifesciences.org/articles/81480/elife-81480-fig2-data1-v2.xlsx
Figure 2—figure supplement 1
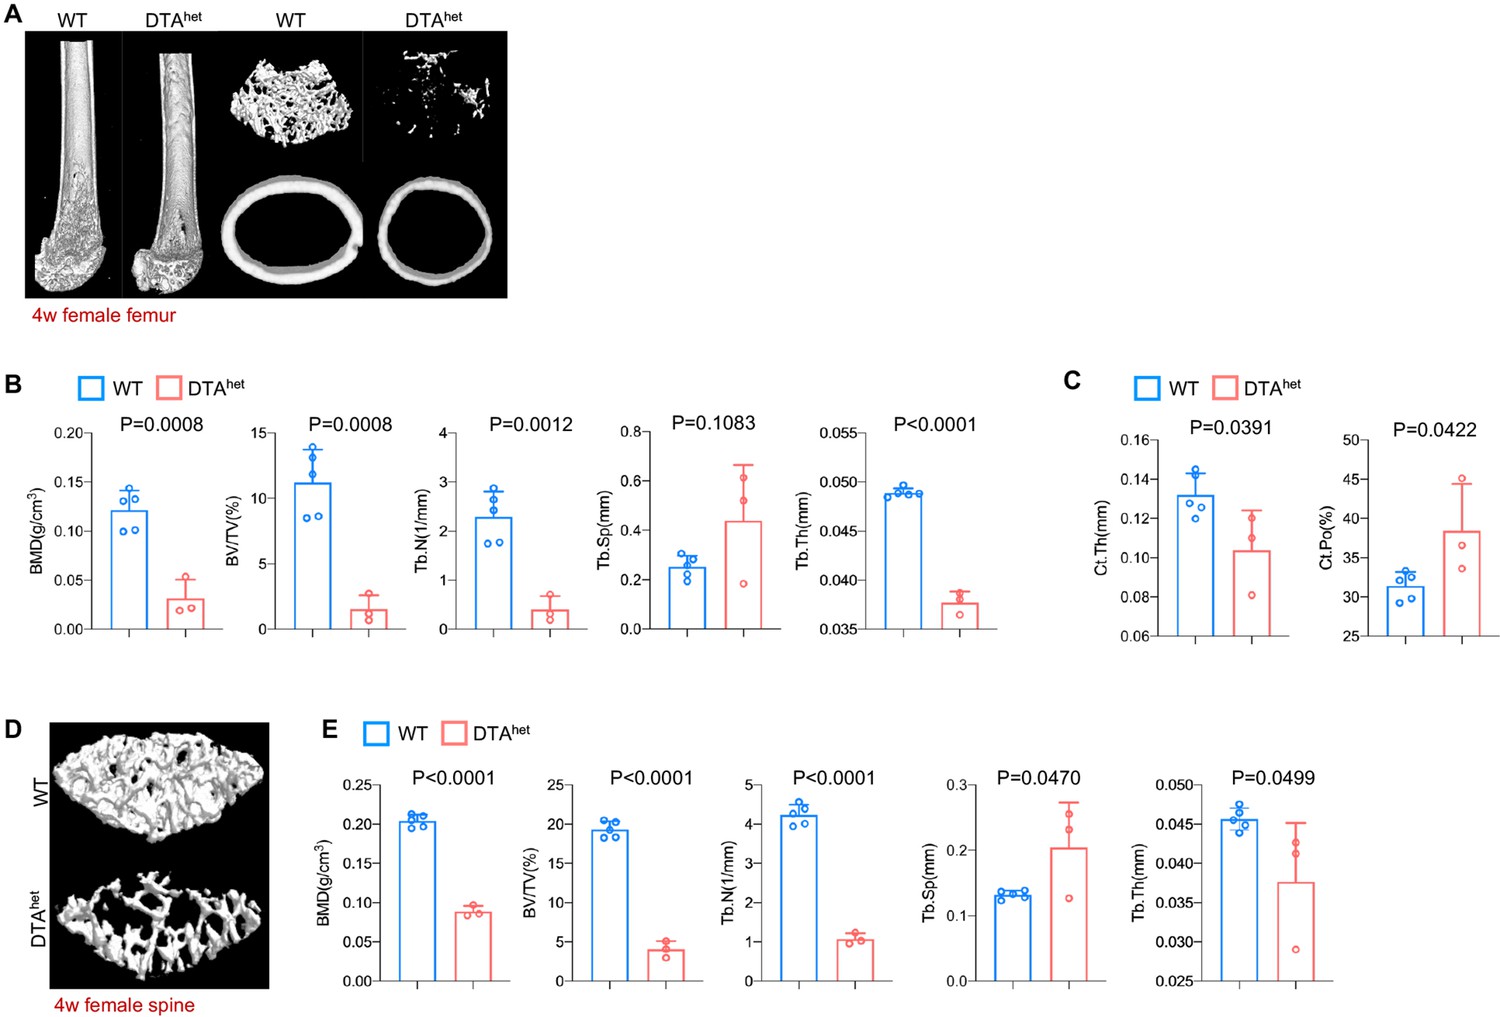
Osteocyte ablation induces severe osteoporosis and kyphosis.
(A–C) Representative micro-computed tomography (µCT) reconstructive images of female WT and DTAhet mice femur at 4 weeks (A) and trabecular microstructural parameters (BMD, bone mineral density; BV/TV, bone volume fraction; Tb.N, trabecular number; Tb.Sp, trabecular separation; Tb.Th, trabecular thickness) (B) and cortical microstructural parameters (Ct.Th, cortical thickness; Ct.Po, cortical porosity) (C) derived from µCT analysis (n = 3–5 per group). (D, E) Representative µCT reconstructive images of female WT and DTAhet mice third lumbar at 4 weeks (D) and trabecular microstructural parameters (BMD, BV/TV, Tb.N, Tb.Sp, and Tb.Th) (E) derived from µCT analysis (n = 3–5 per group). Error bar represents the standard deviation.
-
Figure 2—figure supplement 1—source data 1
Osteocyte ablation induces severe osteoporosis in female mice.
- https://cdn.elifesciences.org/articles/81480/elife-81480-fig2-figsupp1-data1-v2.xlsx
Figure 2—figure supplement 2

Osteocyte ablation induces severe osteoporosis and kyphosis.
(A) Gait analysis of normal step sequence ratio of male WT and DTAhet mice at 4 weeks (n = 6 per group). (B–D) Representative gait images and foot pattern of male WT and DTAhet mice (B) at 4 weeks and gait analysis of stride length and swing speed of each paw (C, D) (LF: left front; LH: left hind; RF: right front; RH: right hind) (n = 6 per group). Error bar represents the standard deviation.
-
Figure 2—figure supplement 2—source data 1
Osteocyte ablation induces abnormal steps of mice.
- https://cdn.elifesciences.org/articles/81480/elife-81480-fig2-figsupp2-data1-v2.xlsx
Figure 3 with 1 supplement
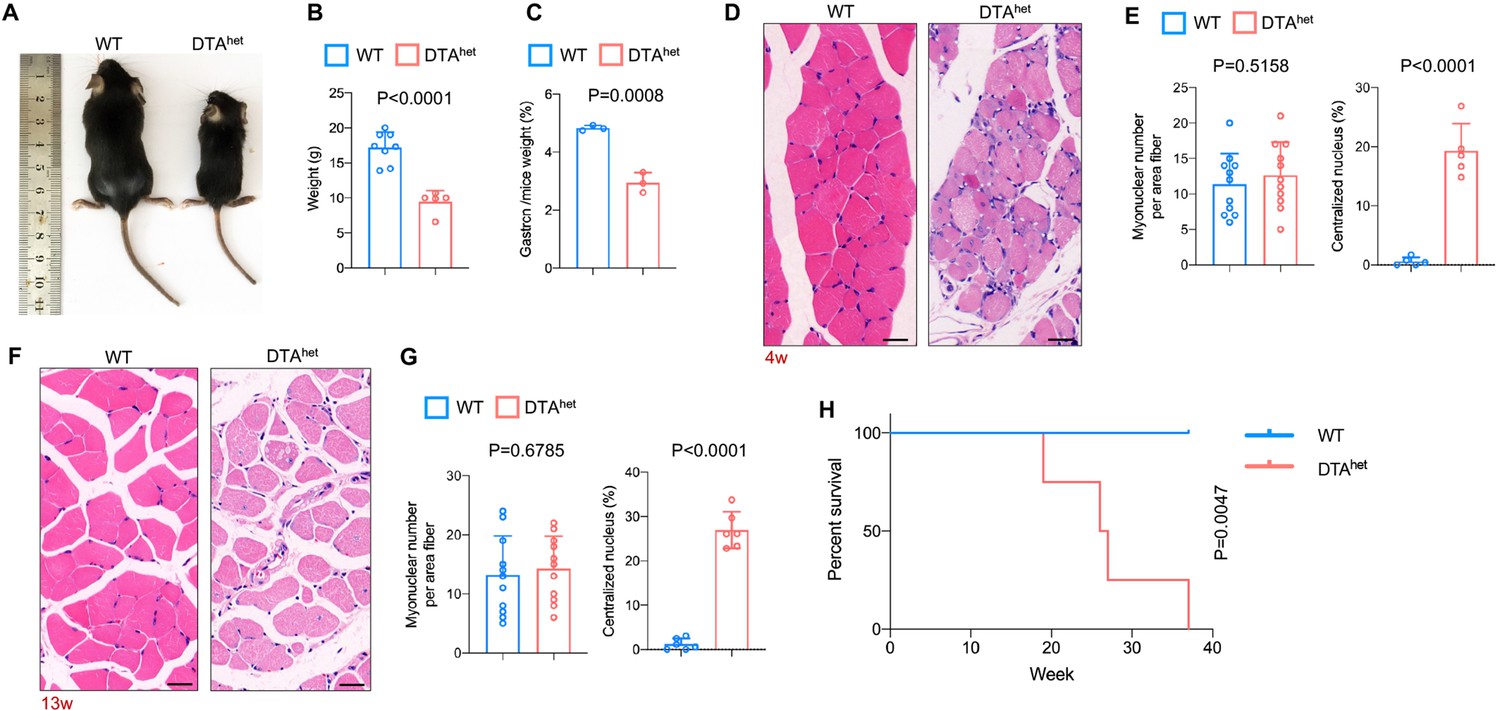
Osteocyte ablation leads to severe sarcopenia and shorter lifespan.
(A, B) Gross images (A) and weight (B) of male WT and DTAhet mice at 4 weeks (n = 5–8 per group). (C) The ratio of gastrocnemius muscle weight in WT and DTAhet mice at 4 weeks (n = 3 per group). (D, E) Hematoxylin–eosin staining of WT and DTAhet mice gastrocnemius muscle at 4 weeks (D) and quantification of myonuclear number per area fiber (n = 11 per group) and centralized nucleus per field (E) (n = 5 per group), showing focal muscle atrophy, increased centralized myonuclei, and mild inflammation in DTAhet mice. Scale bar, 20 µm. (F, G) Hematoxylin–eosin staining of WT and DTAhet mice gastrocnemius muscle at 13 weeks (F) and quantification of myonuclear number per area fiber (n = 11 per group) and centralized nucleus per field (G) (n = 6 per group), noting muscle atrophy, rimmed vacuoles, and inclusion bodies within the muscle fibers in DTAhet mice. Scale bar, 20 µm. (H) Kaplan–Meier survival curve of WT and DTAhet mice (n = 4–5 per group), showing that DTAhet mice had shorter lifespan than that of WT mice. Error bar represents the standard deviation.
-
Figure 3—source data 1
Osteocyte ablation leads to severe sarcopenia and shorter lifespan.
- https://cdn.elifesciences.org/articles/81480/elife-81480-fig3-data1-v2.xlsx
Figure 3—figure supplement 1

Osteocyte ablation leads to severe sarcopenia and shorter lifespan.
(A, B) The quantification of muscle fiber number of WT and DTAhet mice at 4 weeks (A) and 13 weeks (B) (n = 5–6 per group). (C) RT-qPCR verification of Dmp1 expression of cortical bone and muscle (n = 3 per group). Error bar represents the standard deviation.
-
Figure 3—figure supplement 1—source data 1
Osteocyte ablation leads to severe sarcopenia.
- https://cdn.elifesciences.org/articles/81480/elife-81480-fig3-figsupp1-data1-v2.xlsx
Figure 4 with 1 supplement
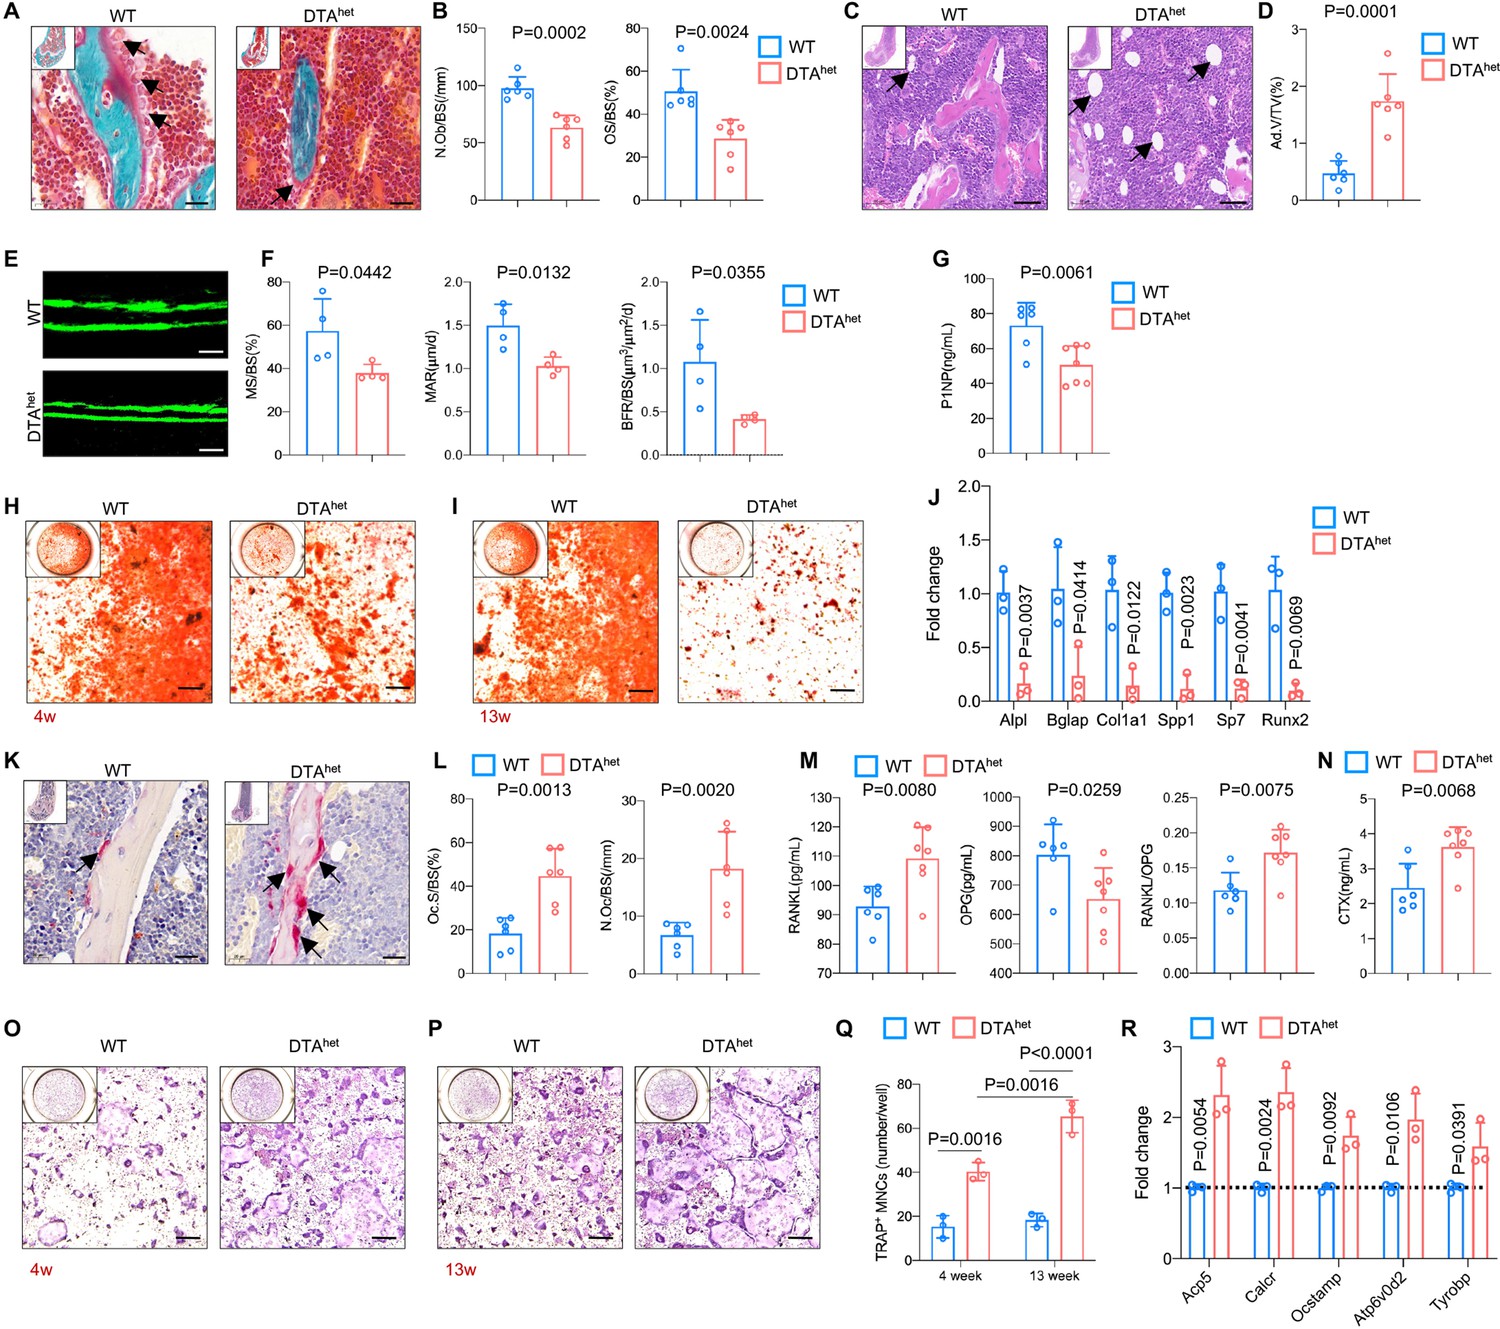
Ablation of osteocytes alters mesenchymal lineage commitment and promotes osteoclastogensis.
(A, B) Goldner trichrome staining of male WT and DTAhet mice femur at 4 weeks (A) and histomorphometry analysis of osteoblast numbers (N.Ob/BS) (arrows) and osteoid-covered surface (OS/BS) (B) (n = 6 per group). Scale bar, 20 µm. (C, D) Hematoxylin–eosin staining of WT and DTAhet mice femur at 4 weeks (C) and histomorphometry analysis of adipocyte (arrows) volume (Ad.V/TV) (D) (n = 6 per group). Scale bar, 50 µm. (E, F) Representative images of calcein double labeling of the mineral layers of male WT and DTAhet mice femur at 4 weeks (E) and histomorphometry analysis of the mineral surface (MS/BS), mineral apposition rate (MAR), and bone formation rate (BFR/BS) (F) (n = 4 per group). Scale bar, 50 µm. (G) ELISA of the concentration of bone formation index P1NP in the serum (n = 6–7 per group). (H, I) Alizarin red staining of osteogenesis from 4-week (H) and 13-week mice (I). Scale bar, 250 µm. (J) RT-qPCR analysis of osteoblast signature genes expression at the mRNA levels of osteogenesis from 4-week mice (n = 3 per group from three independent experiments), indicating impaired osteogenesis in DTAhet mice. (K, L) Tartrate-resistant acid phosphatase (TRAP) staining of WT and DTAhet mice femur at 4 weeks (K) and histomorphometry analysis of osteoclast (arrows) surface (Oc.S/BS) and osteoclast numbers (N.Oc/BS) (L) (n = 6 per group). Scale bar, 20 µm. (M) ELISAs of the concentration of receptor activation of nuclear factor-κ B ligand (RANKL), osteoprotegrin (OPG), and the ratio of RANKL/OPG in the serum (n = 6–7 per group). (N) ELISA of the concentration of bone resorption index CTX in the serum (n = 6–7 per group). (O, P) TRAP staining of osteoclastogenesis from 4-week (O) and 13-week mice (P) and quantitative analysis (Q) of TRAP-positive cells (nucleus > 3) per well (n = 3 per group from three independent experiments). Scale bar, 250 µm. (R) RT-qPCR analysis of osteoclast signature genes expression at the mRNA level of osteoclastogenesis from 4-week mice (n = 3 per group from three independent experiments), showing increased osteoclastogensis in DTAhet mice. Error bar represents the standard deviation.
-
Figure 4—source data 1
Ablation of osteocytes alters mesenchymal lineage commitment and promotes osteoclastogensis.
- https://cdn.elifesciences.org/articles/81480/elife-81480-fig4-data1-v2.xlsx
Figure 4—figure supplement 1
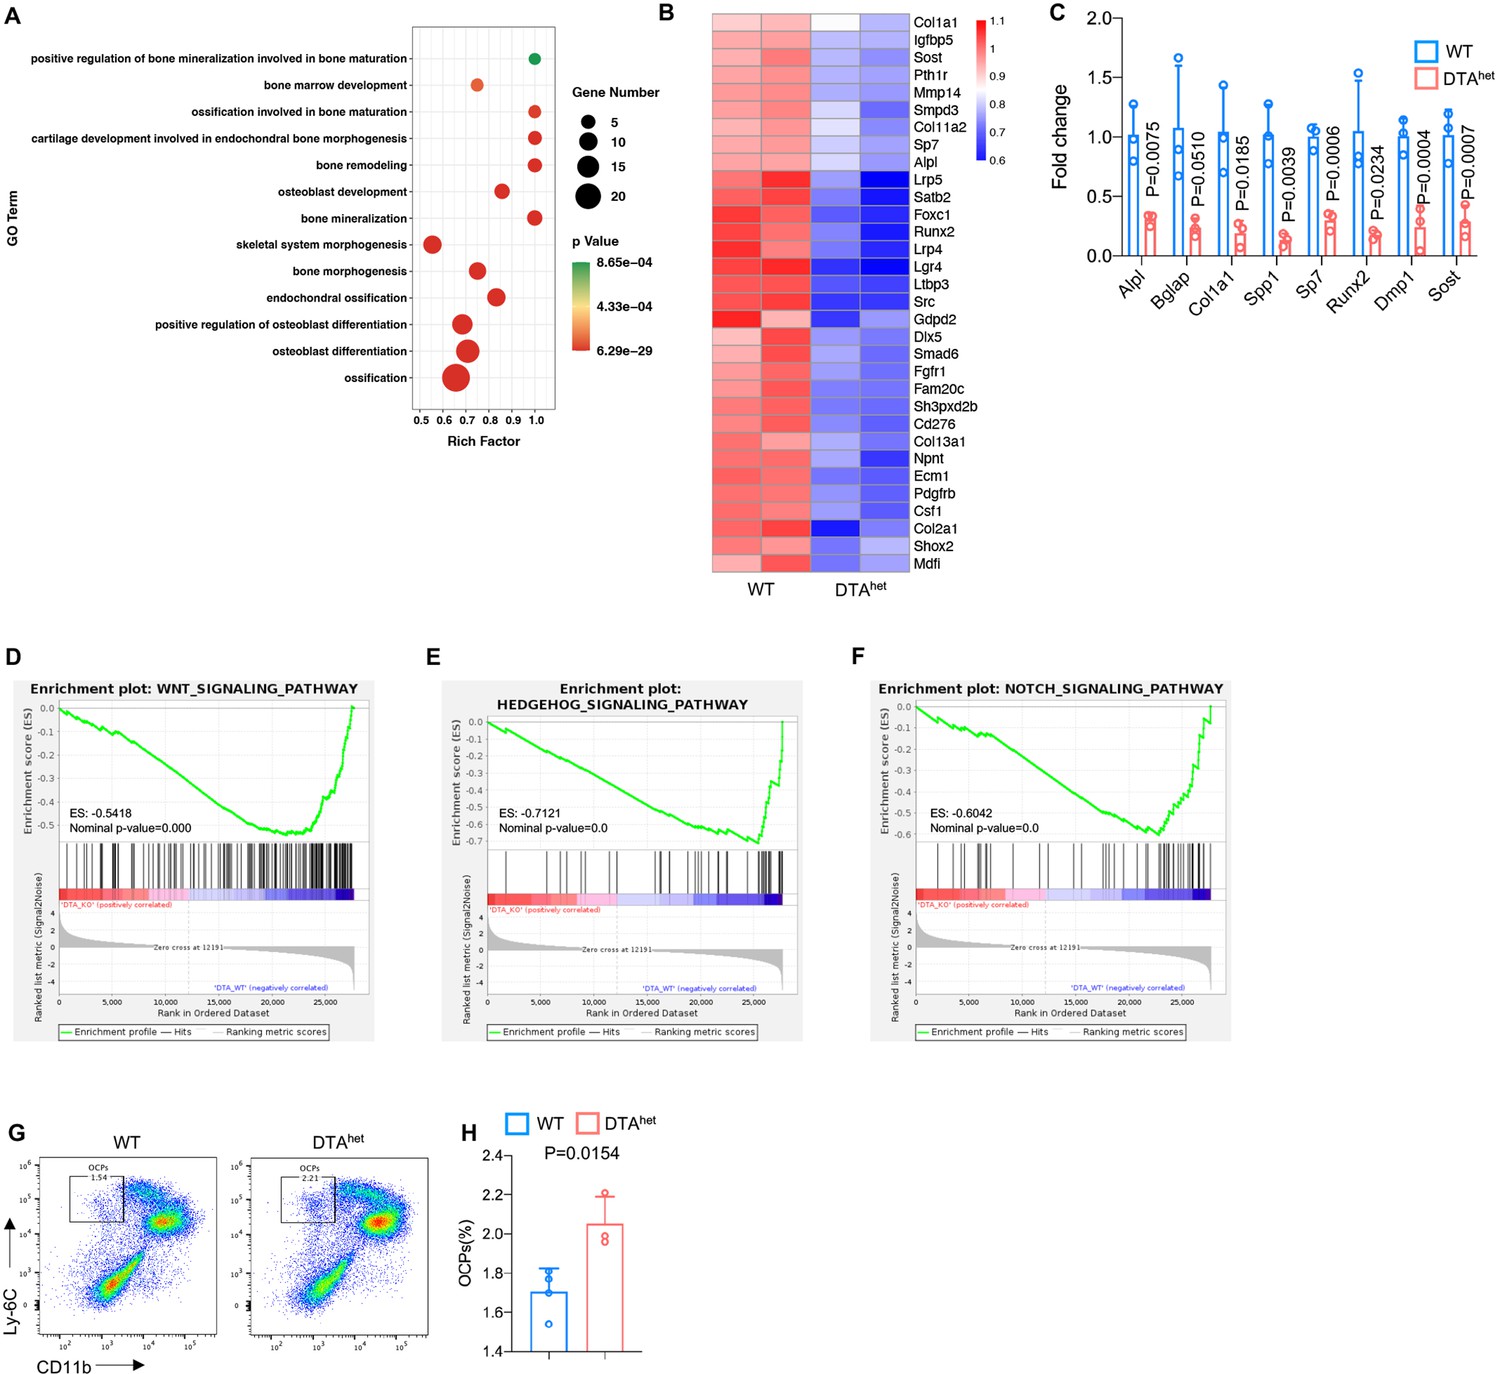
Ablation of osteocytes alters mesenchymal lineage commitment and promotes osteoclastogensis.
(A) Selected osteogenesis-related Gene Ontology (GO) analysis of downregulated genes by osteocyte ablation. (B) Heatmap of significantly differentiated genes (fold change > 2.0-fold, WT FPKM > 10, false discovery rate [FDR] < 0.05) (n = 2 per group). (C) Indicated gene expression analysis of the cortical bones of WT and DTAhet mice (n = 3 per group). (D–F) Gene set enrichment analysis (GSEA) of osteogenesis-related pathways, including Wnt signaling pathway (D), Hedgehog signaling pathway (E), and Notch signaling pathway (F). (G, H) Representative image of flow cytometry (G) and analysis of proportions of osteoclast progenitors (B220-CD11bloLy-6Chi) (H) of 4-week WT and DTAhet mice (n = 3–4 per group). Error bar represents the standard deviation.
-
Figure 4—figure supplement 1—source data 1
Ablation of osteocytes alters mesenchymal lineage commitment and promotes osteoclastogensis.
- https://cdn.elifesciences.org/articles/81480/elife-81480-fig4-figsupp1-data1-v2.xlsx
Figure 5 with 3 supplements
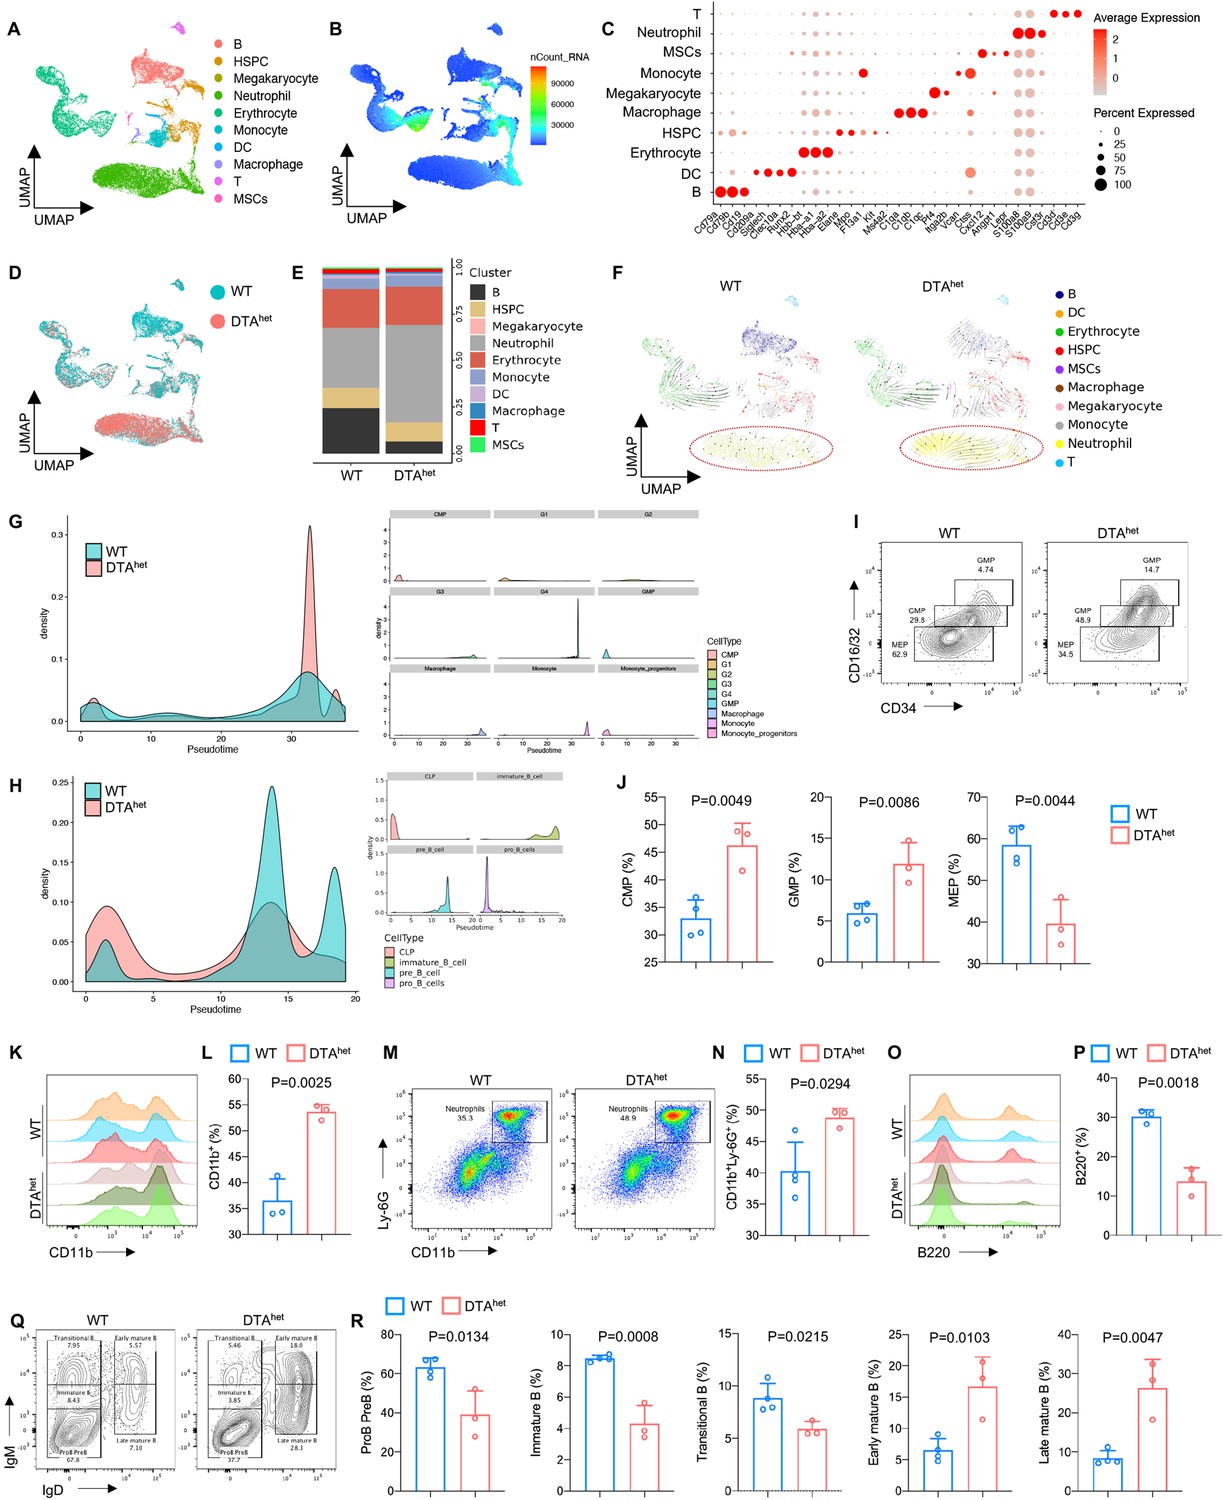
Alteration of hematopoietic lineage commitment by osteocyte ablation.
(A, B) The Uniform Manifold Approximation and Projection (UMAP) plot of cells isolated from the bone marrow of 4-week WT and DTAhet mice and inferred cluster identity (A) and number of mRNA per cell (B). (C) Dot plot showing the scaled expression of selected signature genes for each cluster. Dot size represents the percentage of cells in each cluster with more than one read of the corresponding gene, and dots are colored by the average expression of each gene in each cluster. (D, E) The UMAP plot of cells shown by sample (D) and proportions of each cluster in two samples (E). (F) RNA velocity analysis of clusters of WT and DTAhet mice shown by the UMAP embedding, showing stronger directionality of velocity vectors from hematopoietic stem cell and progenitor cell (HSPC) cluster to neutrophil cluster in DTAhet mice. (G) Trajectory analysis of myeloid clusters of WT and DTAhet mice, demonstrating myeloid-biased hematopoiesis in DTAhet mice. (H) Trajectory analysis of lymphoid clusters of WT and DTAhet mice, demonstrating impaired lymphopoiesis in DTAhet mice. (I, J) Representative image of flow cytometry (I) and analysis of proportions of myeloid progenitors (common myeloid progenitors [CMP], granulocyte–monocyte progenitors [GMP], and megakaryocyte erythroid progenitors [MEP]) (J) of 4-week WT and DTAhet mice (n = 3–4 per group). (K, L) Representative image of flow cytometry (K) and analysis of proportions of CD11b+ myeloid cells (L) of 4-week WT and DTAhet mice (n = 3 per group). (M, N) Representative image of flow cytometry (M) and analysis of proportions of neutrophils (N) of 4-week WT and DTAhet mice (n = 3–4 per group). (O, P) Representative image of flow cytometry (O) and analysis of proportions of B220+ lymphoid cells (P) of 4-week WT and DTAhet mice (n = 3 per group). (Q, R) Representative image of flow cytometry (Q) and analysis of proportions of ProB PreB, immature B, transitional B, early mature B, and late mature B (R) of 4-week WT and DTAhet mice (n = 3–4 per group), indicating altered B cell development pattern in DTAhet mice. Error bar represents the standard deviation.
-
Figure 5—source data 1
Alteration of hematopoietic lineage commitment by osteocyte ablation.
- https://cdn.elifesciences.org/articles/81480/elife-81480-fig5-data1-v2.xlsx
Figure 5—figure supplement 1
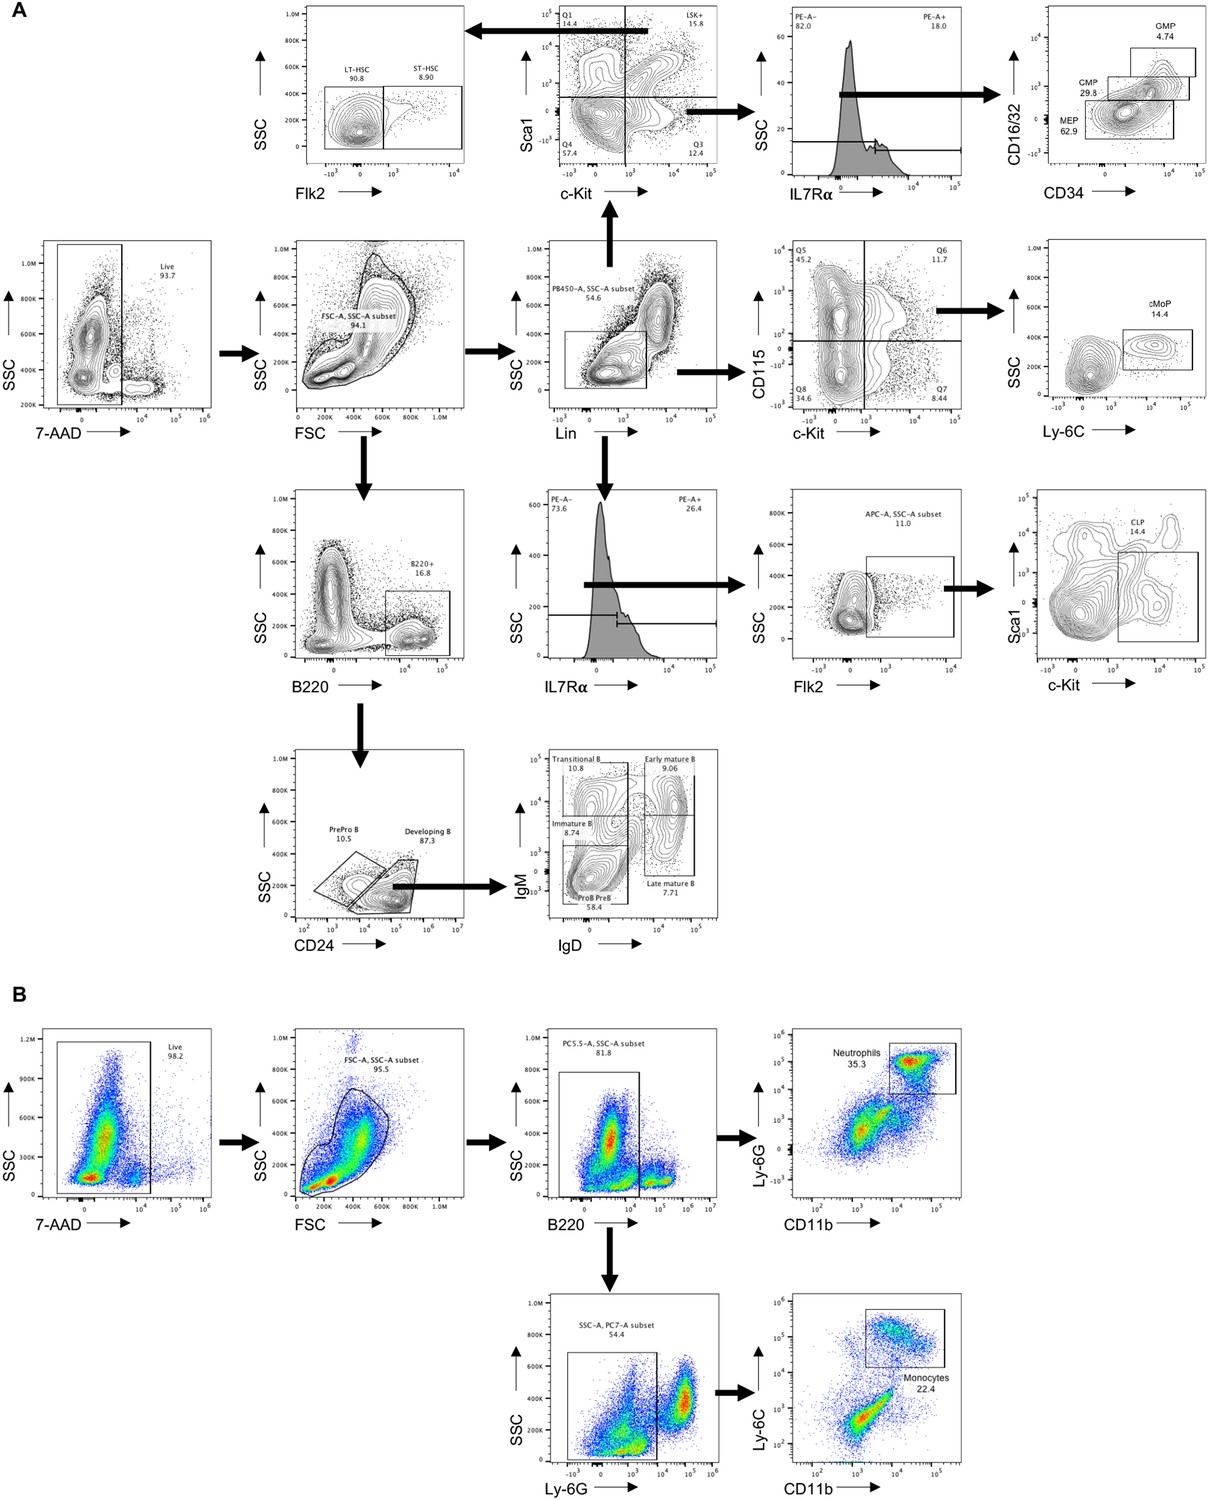
Flow cytometry gating strategy.
(A) Flow cytometry of gating hematopoietic stem cell (HSC) (Lin-Sca1+c-Kit+), long-term HSC (LT-HSC) (Lin-Sca1+c-Kit+Flk2-), short-term HSC (ST-HSC) (Lin-Sca1+c-Kit+Flk2+), common myeloid progenitors (CMP) (Lin-Sca1-c-Kit+IL7Rα-CD34+FcγRⅡ/Ⅲlo), granulocyte–monocyte progenitors (GMP) (Lin-Sca1-c-Kit+IL7Rα-CD34+FcγRⅡ/Ⅲhi), megakaryocyte erythroid progenitors (MEP) (Lin-Sca1-c-Kit+IL7Rα-CD34-FcγRⅡ/Ⅲlo), common monocyte progenitors (cMoP) (Lin-c-Kit+CD115+Ly-6Chi), common lymphoid progenitors (CLP) (Lin-IL7Rα-Flk2+Sca1+c-Kit-), ProB PreB (B220+CD24+IgM-IgD-), immature B (B220+CD24+IgMloIgD-), transitional B (B220+CD24+IgM+IgD-), early mature B (B220+CD24+IgM+IgD+), and late mature B (B220+CD24+IgMlo/-IgD+). (B) Flow cytometry of gating neutrophil (B220-CD11b+Ly-6G+) and monocyte (B220-Ly-6G-CD11b+Ly-6C+).
Figure 5—figure supplement 2

Alteration of hematopoietic lineage commitment by osteocyte ablation.
(A, B) Representative images of flow cytometry (A) and analysis of proportions of hematopoietic stem cells (HSC) (B) of 4-week WT and DTAhet mice (n = 3–4 per group). (C, D) Representative image of flow cytometry (C) and analysis of proportions of long-term HSC (LT-HSC) and short-term HSC (ST-HSC) (D) of 4-week WT and DTAhet mice (n = 3–4 per group). (E, F) Representative image of flow cytometry (E) and analysis of proportions of common monocyte progenitors (cMoP) (F) of 4-week WT and DTAhet mice (n = 3–4 per group). (G, H) Representative image of flow cytometry (G) and analysis of proportions of monocyte (H) of 4-week WT and DTAhet mice (n = 3–4 per group). (I, J) Representative image of flow cytometry (I) and analysis of proportions of common lymphoid progenitors (CLP) (J) of 4-week WT and DTAhet mice (n = 3–4 per group). Error bar represents the standard deviation.
-
Figure 5—figure supplement 2—source data 1
Alteration of hematopoietic lineage commitment by osteocyte ablation.
- https://cdn.elifesciences.org/articles/81480/elife-81480-fig5-figsupp2-data1-v2.xlsx
Figure 5—figure supplement 3
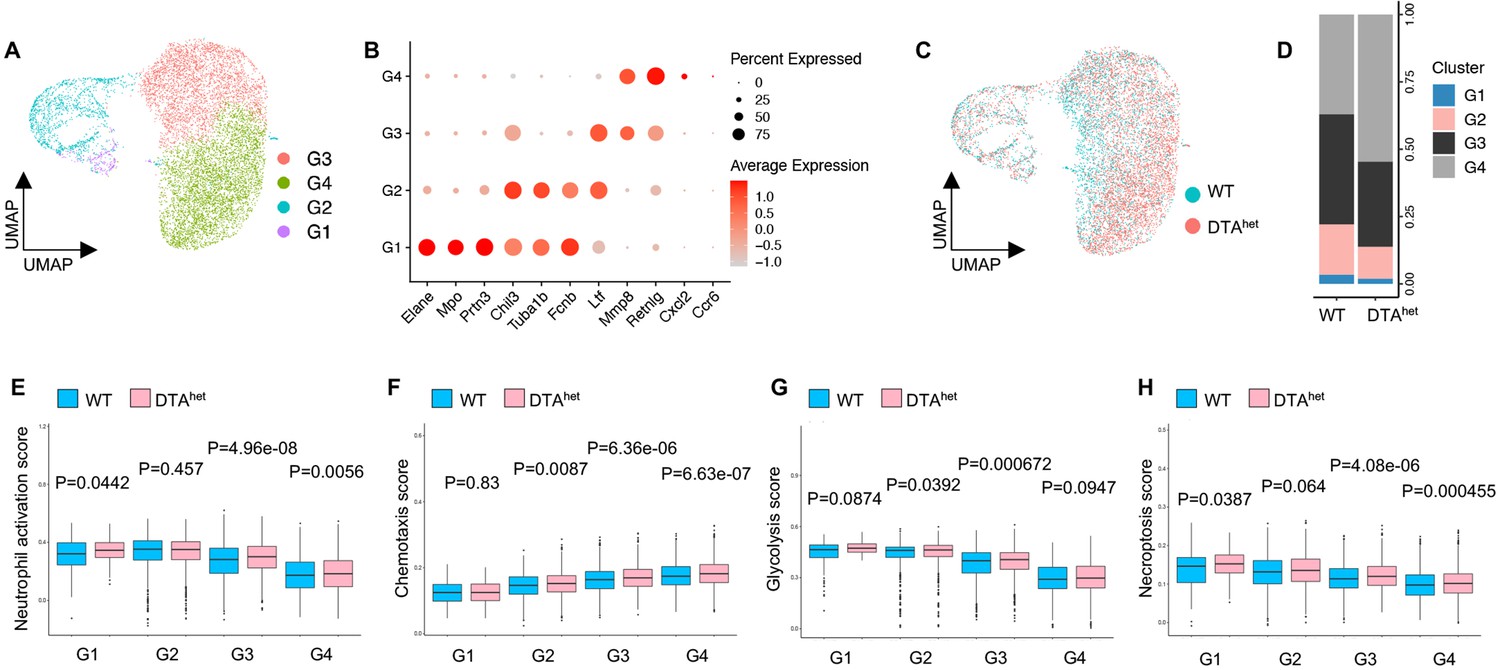
Increased granulopoiesis after osteocyte ablation.
(A) The Uniform Manifold Approximation and Projection (UMAP) plot of neutrophils of 4-week WT and DTAhet mice and inferred subcluster identity. (B) Dot plot showing the scaled expression of selected signature genes for each cluster. Dot size represents the percentage of cells in each cluster with more than one read of the corresponding gene, and dots are colored by the average expression of each gene in each cluster. (C, D) The UMAP plot of cells shown by sample (C) and proportions of each subcluster in two samples (D). (E–H) Comparisons of neutrophil activation score (E), chemotaxis score (F), glycolysis score (G), and necroptosis score (H) between 4-week WT and DTAhet mice.
Figure 6 with 1 supplement
Senescence of osteoprogenitors and myeloid lineage cells leads to the accelerated skeletal aging.
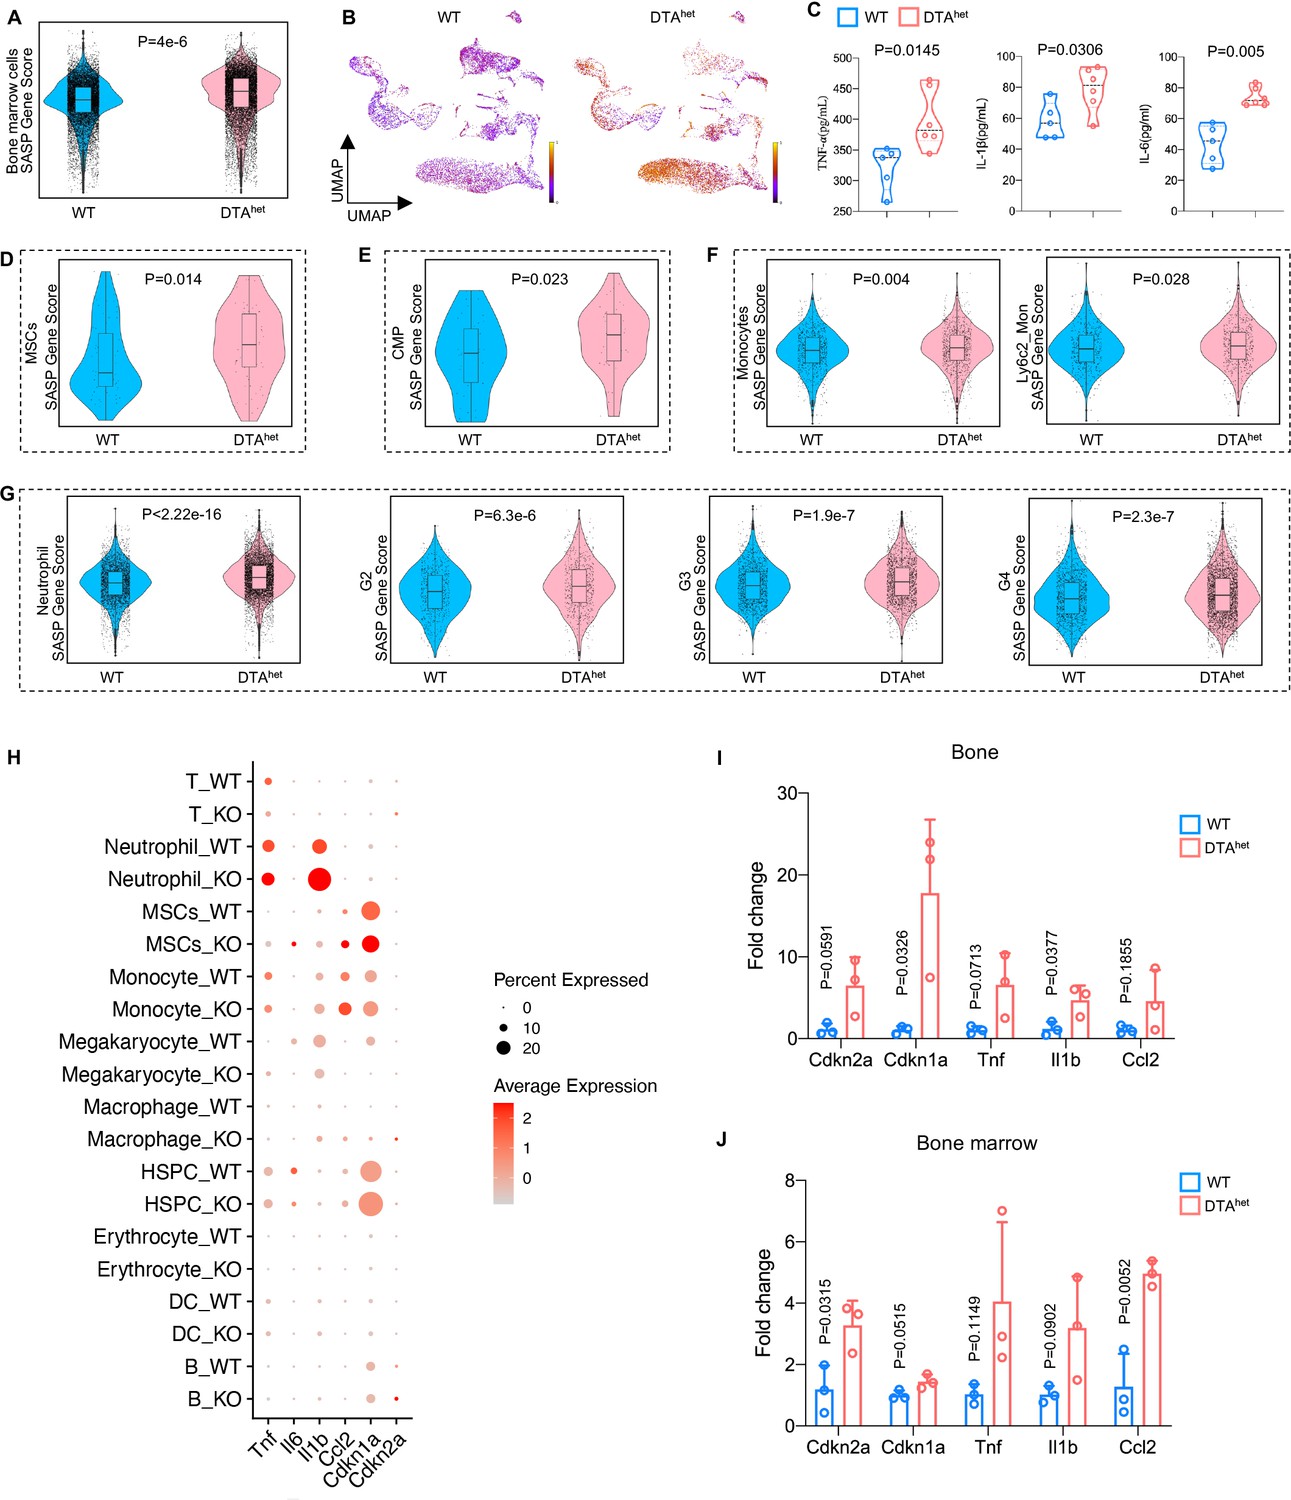
(A) Comparisons of total bone marrow cells senescence-associated secretory phenotype (SASP) score between 4-week WT and DTAhet mice. (B) Latent time of RNA velocity analysis of WT and DTAhet mice shown by the Uniform Manifold Approximation and Projection (UMAP) embedding. (C) ELISAs of the concentration of TNF-α, IL-1β, and IL-6 of 4-week WT and DTAhet mice in the serum (n = 5–6 per group). (D) Comparisons of mesenchymal stem cells (MSCs) SASP score between 4-week WT and DTAhet mice, indicating the senescence of osteoprogenitors in DTAhet mice. (E) Comparisons of common myeloid progenitors (CMP) SASP score between 4-week WT and DTAhet mice. (F) Comparisons of monocytes and its subcluster Ly6c2_monocytes SASP score between 4-week WT and DTAhet mice. (G) Comparisons of neutrophils and its subcluster (G2, G3, and G4) SASP score between 4-week WT and DTAhet mice, indicating the senescence of myeloid lineage cells. (H) Bubble plot of the expression of senescence-related genes in subclusters of WT and DTAhet mice. (I) RT-qPCR analysis of senescence-related genes expression at the mRNA level of 4-week WT and DTAhet mice cortical bone (n = 3 per group). (J) RT-qPCR analysis of senescence-related genes expression at the mRNA level of 4-week WT and DTAhet mice bone marrow (n = 3 per group). Error bar represents the standard deviation.
-
Figure 6—source data 1
Senescence of osteoprogenitors and myeloid lineage cells leads to the accelerated skeletal aging.
- https://cdn.elifesciences.org/articles/81480/elife-81480-fig6-data1-v2.xlsx
Figure 6—figure supplement 1

Senescence of osteoprogenitors and myeloid lineage cells leads to the accelerated skeletal aging.
(A) SA-βGal staining of frozen sections of femur of WT and DTAhet mice. Scale bar, 20 µm. (B) Bar plot of Gene Ontology (GO) analysis of mesenchymal stem cell (MSC) cluster. (C, D) RT-qPCR analysis of the mRNA expression of adipogenesis (C) and chondrogenesis (D)-related signature genes (n = 3 per group). (E, F) Bar plot of Kyoto Encyclopedia of Genes and Genomes (KEGG) analysis of subclusters 2 and 4 of Ly6c2_monocytes. Error bar represents the standard deviation.
-
Figure 6—figure supplement 1—source data 1
Osteocyte ablation induced MSC lineage towards adipogenesis.
- https://cdn.elifesciences.org/articles/81480/elife-81480-fig6-figsupp1-data1-v2.xlsx
Figure 7

Schematic diagram of osteocyte ablation-induced skeletal senescence.
Ablation of osteocytes induced senescence-associated secretory phenotype (SASP) accumulation in bone marrow osteoprogenitors and myeloid lineage cells, which altered mesenchymal stem cell (MSC) and hematopoietic stem cell (HSC) lineage commitments with promoted adipogenesis, myelopoiesis, and osteoclastogenesis at the expense of osteogenesis and lymphopoiesis, leading to the accelerated skeletal aging phenotype with severe sarcopenia, osteoporosis, degenerative kyphosis, and bone marrow myelopoiesis, thus shortened lifespan of mice.
Videos
Video 1
Representative movie showing movement in WT mice at 4 weeks.
Video 2
Representative movie showing movement defects in DTAhet mice at 4 weeks.
Video 3
Representative movie showing movement in WT mice at 13 weeks.
Video 4
Representative movie showing movement defects in DTAhet mice at 13 weeks.
Video 5
Representative movie showing movement in WT mice at 37 weeks.
Video 6
Representative movie showing movement defects in DTAhet mice at 37 weeks.
Additional files
-
Supplementary file 1
Selected skeleton-related Gene Ontology (GO analysis).
- https://cdn.elifesciences.org/articles/81480/elife-81480-supp1-v2.xlsx
-
Supplementary file 2
Gene sets involving neutrophil function and senescence-associated secretory phenotype (SASP).
- https://cdn.elifesciences.org/articles/81480/elife-81480-supp2-v2.xlsx
-
MDAR checklist
- https://cdn.elifesciences.org/articles/81480/elife-81480-mdarchecklist1-v2.docx
Download links
A two-part list of links to download the article, or parts of the article, in various formats.
Downloads (link to download the article as PDF)
Open citations (links to open the citations from this article in various online reference manager services)
Cite this article (links to download the citations from this article in formats compatible with various reference manager tools)
Osteocytes regulate senescence of bone and bone marrow
eLife 11:e81480.
https://doi.org/10.7554/eLife.81480


