A coordinated transcriptional switching network mediates antigenic variation of human malaria parasites

  1. Xu Zhang
  2. Francesca Florini
  3. Joseph E Visone
  4. Irina Lionardi
  5. Mackensie R Gross
  6. Valay Patel
  7. Kirk W Deitsch  Is a corresponding author
  1. Department of Microbiology and Immunology, Weill Cornell Medical College, United States
  2. Jill Roberts Center for Inflammatory Bowel Disease, Weill Cornell Medical College, United States

Abstract

Malaria parasites avoid immune clearance through their ability to systematically alter antigens exposed on the surface of infected red blood cells. This is accomplished by tightly regulated transcriptional control of individual members of a large, multicopy gene family called var and is the key to both the virulence and chronic nature of malaria infections. Expression of var genes is mutually exclusive and controlled epigenetically, however how large populations of parasites coordinate var gene switching to avoid premature exposure of the antigenic repertoire is unknown. Here, we provide evidence for a transcriptional network anchored by a universally conserved gene called var2csa that coordinates the switching process. We describe a structured switching bias that shifts overtime and could shape the pattern of var expression over the course of a lengthy infection. Our results provide an explanation for a previously mysterious aspect of malaria infections and shed light on how parasites possessing a relatively small repertoire of variant antigen-encoding genes can coordinate switching events to limit antigen exposure, thereby maintaining chronic infections.

Editor's evaluation

This is an important study addressing the mechanisms of variant gene expression and switching in the malaria parasite Plasmodium falciparum. The work provides solid evidence supporting the existence of a non-random, highly structured switch pathway for var genes and identifies one var gene, called var2csa, as a sink node in this network. The findings consolidate previous observations and further the understanding of the enigmatic mechanism that underlies the regulation of the var gene family and antigenic variation in P. falciparum, which is paramount for immune evasion and acquired immunity and further influences malaria pathology.

https://doi.org/10.7554/eLife.83840.sa0

eLife digest

Malaria causes severe illness and deaths in hundreds of thousands of people each year. Most of them are young children in Sub-Saharan Africa. The disease is transmitted when a mosquito carrying single-celled Plasmodium parasites bites a human, introducing the parasites into the bloodstream, where they enter red blood cells.

When a red blood cell becomes infected, the parasite presents a protein on the cell’s surface that the immune system can recognize to start fighting the infection. Immune cells then produce antibodies that flag infected cells for destruction, relieving the symptoms of the disease. To avoid being destroyed in this manner, the parasites repeatedly ‘change’ the protein that ends up on the surface of the red blood cells. With each change, the number of parasites rebounds, symptoms return, and the immune system must produce new antibodies. As the parasites and immune system battle it out, patients may experience repeated flare-ups of symptoms for well over a year.

To change the protein that is presented on the surface of red blood cells, Plasmodium parasites switch the genes in the var gene family on and off one at a time. Each of these genes encodes a different surface protein, and the parasites may cycle through the entire var gene family during an infection. However, it remains a mystery how the millions of infecting parasites coordinate to produce the same surface protein each time.

Zhang et al. show that a gene from Plasmodium parasites called var2csa is responsible for coordinating protein switching through a set pattern that allows the parasites to synchronize which protein they switch to next. Deleting the var2csa gene in malaria parasites blocks protein switching and disables this coordinated immune evasion tactic.

Zhang et al.’s experiments provide new insights about protein switching in malaria parasites. Further research may help scientists characterize each step in the process and identify which steps can be targeted to treat malaria. While not a cure, treatments that disable protein switching could reduce the number of times patients relapse and relieve symptoms. More generally, the results of Zhang et al. describe a mechanism for coordinated gene expression that may be used in organisms other than Plasmodium, including humans.

Introduction

Malaria is a disease of enormous historical significance that continues to exert a heavy burden on health and economic development in many regions of the world (World Health Organization, 2021). The most virulent of the human malaria parasites is Plasmodium falciparum, a mosquito-borne pathogen that infects the circulating red blood cells (RBCs) of its hosts. While resident within the RBC, the parasites modify the host cell cytoskeleton through the insertion into the RBC membrane of an adhesive protein called Plasmodium falciparum erythrocyte member protein 1 (PfEMP1) (Baruch et al., 1995; Smith et al., 1995; Su et al., 1995). This enables adhesion to the vascular endothelium (Gardner et al., 1996), thereby avoiding filtration and destruction in the spleen (David et al., 1983; Barnwell et al., 1983), however this also exposes PfEMP1 as a target for adaptive immunity (Bull et al., 1998; Giha et al., 2000). To escape clearance by antibodies that recognize PfEMP1, parasites systematically change the form of PfEMP1 they express, thus continuously altering their antigenic signature and promoting a chronic infection that can extend over a year (reviewed in Deitsch and Dzikowski, 2017).

Different forms of PfEMP1 are encoded by individual members of the var gene family, a collection of highly variable, paralogous genes numbering between 45 and 90 and distributed throughout the parasite’s genome, primarily within subtelomeric regions or as tandemly arranged clusters within the interior of the chromosomes (Otto et al., 2018). Epigenetic mechanisms ensure that only a single gene is actively transcribed at a time (Scherf et al., 1998; Deitsch et al., 1999), a process with parallels to allelic exclusion of immunoglobulin genes (Corcoran, 2005) or mutually exclusive expression within the olfactory receptor gene family in mammals (Rodriguez, 2013). However, unlike these systems in which selection of the active gene is part of the differentiation process and thus permanent, var gene activation and silencing are reversible, thereby enabling parasites to switch which var gene is expressed, thus changing the form of PfEMP1 on the infected cell surface. Many attributes of the epigenetic processes that control var gene expression, including the histone modifications that mark a gene for activation or silencing, are shared with model eukaryotes (Chookajorn et al., 2007; Lopez-Rubio et al., 2009; Flueck et al., 2009). However, the added complexity of switching which gene is active while maintaining mutually exclusive expression is largely without precedent outside of pathogenic organisms. Moreover, given that the number of var genes within the parasite’s genome is relatively limited, switching events must be coordinated to avoid rapid exhaustion of the parasite’s variant capacity. Specifically, uncoordinated, random var gene switching by individual parasites within a circulating population that can number in the billions would result in rapid exposure of the entire var repertoire. In contrast, P. falciparum infections are characterized by rising and falling waves of parasitemia, with each wave representing a population of parasites expressing a single or small number of var genes (Bachmann et al., 2011; Bachmann et al., 2019; Kaestli et al., 2004). Modeling studies have suggested that in semi-immune hosts, an underlying structure or coordination to the switching process would be optimal for extending an infection (Recker et al., 2011; Noble and Recker, 2012; Noble et al., 2013) by limiting activation to a single or small number of genes at a time within the circulating parasite population. However, while communication between parasites has been suggested (Mantel et al., 2013; Regev-Rudzki et al., 2013), there is no evidence that this influences var gene expression patterns and there does not appear to be a strict switching order within the var gene family, therefore how this is accomplished remains entirely without explanation.

In 2011, Recker et al. explored this phenomenon using mathematical modeling based on data from switching events observed in cultured parasites (Recker et al., 2011). They proposed that parasites do not switch directly from one gene to another, but rather that a population of parasites switches from a dominant var gene, through a switch-intermediate state in which many genes are transiently expressed, to either a new dominant transcript or back to the original. This model also predicted that specific genes could serve as either ‘source’ or ‘sink’ nodes and provide additional structure to the network. The model provided a compelling explanation for how a population of parasites that can reach up to 1010 individuals can display seemingly coordinated switching patterns without the need for communication between cells or a fixed order of gene activation. Further, it described both how parasites can extend a chronic infection as well as successfully reinfect individuals when partial immunity exists. However, to date no experimental data have provided a molecular basis for such a structured network, the hypothetical switch-intermediate state or the source/sink nodes predicted by this model.

Here, we describe molecular genetic evidence that fulfils many of the predictions of the previously proposed mathematical model. We identified a universally conserved, unique var gene that displays characteristics of a sink node and plays a key role in coordinating transcriptional switching events. Deletion of this locus disrupts var gene switching, resulting in parasites that have a drastically reduced ability to change var gene expression, thus disabling the process of antigenic variation that is required to maintain a chronic infection. In addition, we describe an underlying pattern of biased var transcriptional activation which shifts overtime, providing the potential for a coordinated pattern of expression switching that could prevent premature exposure of the parasite’s variant repertoire over the length of an infection. These data extend our understanding of antigenic variation beyond mathematical models and represent an important step forward in understanding the pathogenic nature of human malaria.

Results

Clonal parasite lines display either ‘single’ or ‘many’ var gene expression profiles and can transition between these two states

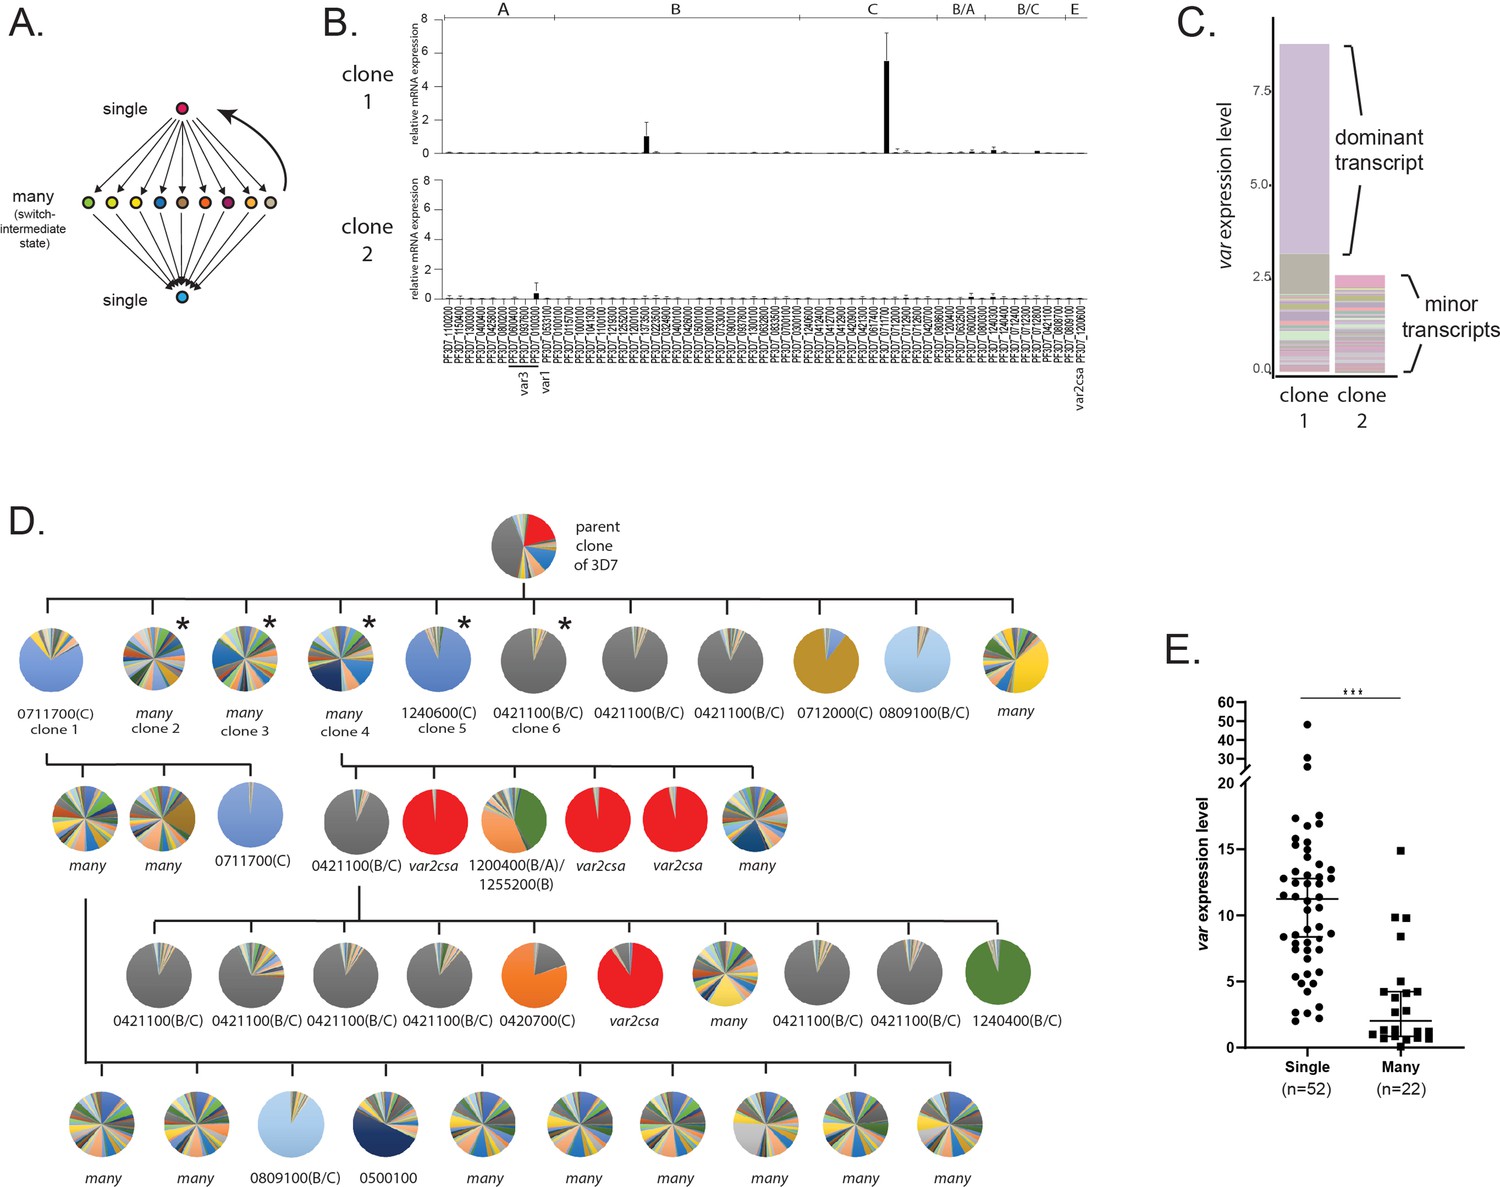
The mathematical model derived by Recker et al. was based on observations of var expression patterns observed in recently isolated clonal parasite populations (Recker et al., 2011). The proposed transition from expression of a single var gene, through an intermediate state in which many genes are expressed, then back to a single gene that becomes dominant in the population is referred to as the ‘single-many-single’ model for var gene switching (Figure 1A). This is similar to the two-step model for olfactory receptor gene activation in vertebrates, which has recently been shown to involve an initial, transient state in which large numbers of genes are expressed at a low level, followed by selection of a single gene for stable expression (Tan et al., 2015). Given the observations from this model system and previous reports of var gene switching patterns, we attempted to experimentally validate the SMS model of structured switching and to determine the molecular requirements that underlie the hypothetical var gene network that forms the foundation for this pathway.

Figure 1 with 2 supplements see all
Detection of ‘single’ and ‘many’ var expression profiles in cultured parasite populations.

(A) Schematic representation of the single-many-single (SMS) model for var gene transcriptional switching. Each circle represents expression of an individual var gene and arrows represent switches in expression. Switching events are hypothesized to transition from activation of a single gene (top) to a broad range of genes (middle) to a different single gene (bottom) or back to the original gene (reverse arrow). (B) var gene expression profiles for two clonal populations that display the single phenotype (clone 1, top) or the many phenotype (clone 2, bottom). var transcription levels were determined using a standardized quantitative real-time RT-PCR (qRT-PCR) protocol with the expression of each individual var gene displayed as relative copy number in the histogram. Error bars represent standard deviation of three biological replicates. (C) Total var expression for the two subclones shown in B, with transcripts from each individual var gene shown in a different color. For clone 1, transcripts from the dominant gene are marked, while both clones display similar levels of minor transcripts. (D) Clone tree of wildtype 3D7 parasites. Pie charts display the var expression profile for each subcloned population with each slice of the pie representing the expression level of a single var gene. Vertical and horizontal lines delineate sequential rounds of subcloning by limiting dilution. For parasite populations that display a dominantly expressed var gene, the annotation number is shown below the pie chart with the var type shown in parenthesis. The five subclones marked with an asterisk are further analysed in Figure 2. (E) Total var expression levels as determined by qRT-PCR for 74 subclones (see Figure 1—figure supplement 1). The median ± 95% confidence interval is shown, and an unpaired t-test indicates a ***p < 0.0001.

The original proposal of the SMS model was based on analysis of var gene expression by Northern blotting and quantitative real-time RT-PCR (qRT-PCR) using the IT and 3D7 genetic backgrounds (Recker et al., 2011). Since this original description, the method for determining var expression patterns has become widely used for NF54 (Delemarre and van der Kaay, 1979) and 3D7 (Walliker et al., 1987) through the further refinement of a standardized qRT-PCR method developed specifically for this genetic background (Salanti et al., 2003). This standardized method enables rapid, quantitative assessment of the expression level of each var gene in the parasite’s genome. We employed this method to examine var gene expression profiles obtained from recently cloned parasite lines derived from a single parent population of 3D7. Specifically, we determined the expression level of each var gene within each subcloned population approximately 5 weeks after cloning, the earliest time point from which we could obtain suitable parasite numbers. Interestingly, these subcloned populations displayed two fundamentally different expression patterns. Clones displayed either dominant, relatively high-level expression of a single var gene with low-level expression of other members of the family, as exemplified by clone 1 (Figure 1B, top panel), or alternatively they lacked expression of a dominant gene and instead only displayed heterogeneous, low-level expression of a large portion of the var gene family, as shown by clone 2 (Figure 1B, bottom panel). Measurement of the total level of var gene expression from all members of the family detected significantly fewer var transcripts in the expression profile of clone 2 (Figure 1C), consistent with the lack of a dominantly expressed gene and indicating that overall var expression is lower in this population in addition to being more heterogenous. Given that the number of generations after cloning was identical for both populations, these differences in var gene expression profiles presumably reflect differences in the initial var expression state or in switching frequency. Similar, rather dramatic differences in total var expression levels have been previously described for clonal lines derived from both the NF54 and IT parasite isolates (Merrick et al., 2015; Janes et al., 2011), suggesting this phenomenon is typical of cultured parasites of different genetic backgrounds. The two phenotypes, either high-level, stable expression of a dominant var gene or highly diverse, low-level expression of many genes, are consistent with the ‘single’ and ‘many’ expression states proposed in the SMS model (Recker et al., 2011).

If parasites transition between the single and many states as part of var expression switching as proposed in the SMS model, and if this model applies to the two different var expression profiles we observed in our recently cloned lines, then the phenotypes should be reversible. Specifically, it should be possible to obtain ‘single’ parasites from a population of parasites that cumulatively expresses ‘many’ var genes, and vice versa. To test this hypothesis, we used serial subcloning by limiting dilution to isolate and examine a large number of additional subclones (Figure 1D). As predicted, we again obtained parasite populations that either displayed low-level expression of many var genes or high-level, stable expression of one or a small number of genes, regardless of which phenotype was displayed by the population from which the clone was derived (Figure 1D; additional clones are shown in Figure 2B). Thus, it appears that parasites can transition between these two states, leading to populations that display heterogenous expression of many var genes or relatively stable expression of a single, dominant var gene. We also anticipated that populations primarily consisting of parasites in the ‘many’ state would display lower total var expression levels than populations that express one or two dominant var transcripts. To test this prediction, a larger collection of 74 recently subcloned lines were examined and each subclone was determined to be primarily in either the ‘single’ or ‘many’ state (see Figure 1—figure supplement 1). Specifically, populations in which over 50% of the total var expression profile was derived from one or two genes were defined as ‘singles’ while populations with more diverse expression patterns were considered ‘manys’. When total var transcript levels were determined by qRT-PCR, levels were significantly lower in the ‘many’ lines (Figure 1E), consistent with the initial observations shown in Figure 1B and the SMS model. To ensure that this phenomenon was not a property unique to parasites that had been in continuous culture for decades, we repeated the subcloning and var expression analysis with a line of NF54 (the original isolate from which 3D7 was derived) that had not been in culture for as many replicative cycles and that maintains many characteristics of parasites recently isolated from the field, for example gametocytogenesis and knob formation. These subcloned lines similarly displayed either the ‘single’ or ‘many’ phenotypes, with the ‘singles’ displaying higher levels of total var transcripts (Figure 1—figure supplement 2). Note that there is a very clear and statistically significant difference in total var expression levels between populations categorized as ‘single’ or ‘many’, however there is some overlap. We hypothesize this is because no population is completely homogeneous and that parasites in the single state contribute disproportionately to the overall expression profile of a population due to their higher expression level. Thus, mixed populations will display intermediate expression levels. Nonetheless the trend is very clear and statistically significant.

Detection of var gene minor transcript expression profiles in clonal populations overtime.

(A) Heatmap of var minor transcripts for clones 2–6. The clones were all derived from the same parent population as shown in Figure 1D. Pie charts show the initial var gene expression profiles above the heatmap. The annotation numbers for each var gene are shown to the left of the heatmap and organized according to var type (left, var2csa is considered separately in Figure 3). Six time points are included for each clone. Two genetically identical parasite populations (clones 7 and 8) also originally derived from 3D7 but grown separately for several years are shown for comparison. For clones 5 and 6, the dominant transcript (PF3D7_1240600 and PF3D7_0421100, respectively, marked by black boxes in the heatmap) was removed from the analysis to enable visualization of the minor transcripts. (B) Clone tree of wildtype 3D7. The tree is organized into three ‘subclone generations’ derived from initial clone 4 (top row). Pie charts display the var expression profile for each subclone. (C) Heatmap of var minor transcripts for the individual clones from each generation shown in B with the pattern of the parent population (clone 4) shown at the left for comparison. The annotation numbers for each var gene are shown to the left of the heatmap, and the gene order was organized according to var type. The order from left to right of each column in the heatmap corresponds to the order from left to right of the pie charts for each subclone generation shown in B. For parasites expressing the ‘single’ phenotype, the dominant transcript (marked by black boxes in the heatmap) was removed to enable visualization of the minor transcripts.

Distinct semi-conserved pattern of var gene transcription underlies the ‘single’ and ‘many’ states and shifts slowly over time

In our var expression analysis of recently cloned parasites populations, we observed that populations in both the ‘many’ and ‘single’ states expressed a subset of the var gene family at a low level (Figure 1C). Importantly, the entire var gene family is not equally represented within the subset of minor transcripts, suggesting that this low-level var gene activation is consistently biased toward certain var genes. If such intrinsic switching biases shift over time, they could shape the trajectory of var gene expression over the course of an infection and provide a model for how large populations of parasites could systematically cycle through their complement of var genes. This would lead to semi-coordinated var gene switching, thereby avoiding antibody-mediated clearance while protecting the majority of the variant repertoire. If true, this hypothesis provides a key insight into how antigenic variation with a small repertoire of genes can maintain a chronic infection, however direct evidence for shifting switching biases within the context of the SMS model has been lacking.

To specifically examine minor transcript expression, we compared the patterns of minor transcripts from five of the newly isolated clonal populations shown by asterisks in Figure 1D that displayed both the ‘single’ and ‘many’ expression profiles. RNA was obtained on days 0, 20, 45, 90, 116, and 147 after initiation of the experiment and the expression level of each var gene determined by qRT-PCR. The dominant var transcript was removed from the expression profile of ‘single’ populations and the expression levels of the remainder of the var gene family displayed in a heatmap, thus enabling easy visualization of the minor transcript expression pattern. var2csa is a unique var gene that often dominates cultured parasite populations and therefor was considered separately in Figure 3. We used this method to determine if a distinct pattern exists and if it shifts overtime (Figure 2A). The heatmap shows that there are subsets of var genes that are more highly represented within the profiles of minor transcripts, and this pattern is largely shared within this group of closely related subclones. However, the pattern is not fixed and displays variation between subclones and over time. Two additional parasite populations that are genetically identical but had been cultured separately for several years (clones 7 and 8) displayed entirely different patterns of minor transcripts, providing additional evidence that the pattern is not fixed (Figure 2A). The similarity of the patterns displayed by the five subclones examined here likely reflects that these populations originated from a common original clonal population.

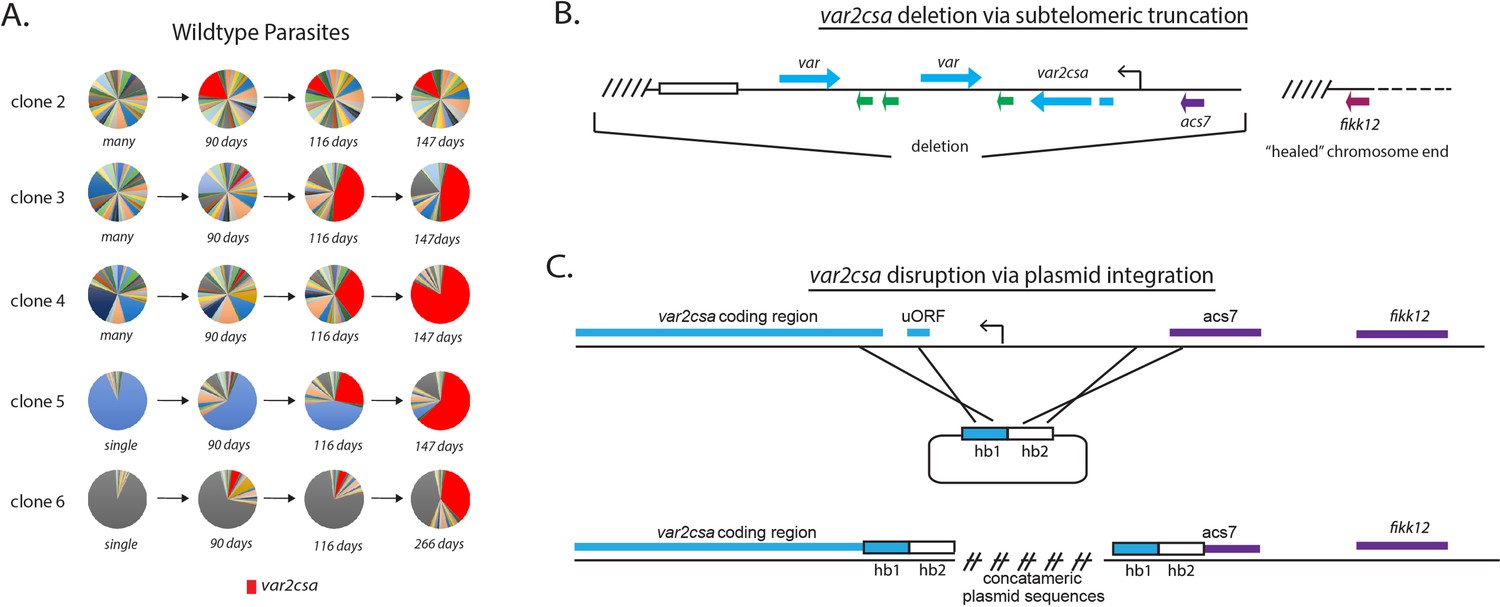
Convergence to var2csa expression in long-term cultures and targeted deletion of the var2csa locus.

(A) Changes in var expression over time in five clonal parasite populations, three ‘manys’ (clones 2–4) and two ‘singles’ (clones 5 and 6), over several months of continuous culture. Expression of var2csa is shown in red. (B) Schematic diagram showing the truncation of the end of chromosome 12 by telomere healing. Telomere repeats are shown as slanted lines and the telomere-associated repeat elements (TAREs) are shown as an open box. The interior of the chromosome is displayed as a dashed line. A ~60 kb deletion, including three var genes (blue), three rif genes (green), and the acs7 gene is shown. (C) Schematic diagram showing the var2csa locus and the plasmid containing homology blocks for targeted integration (hb1 and hb2). The crossed lines linking the plasmid to the chromosome signify sites of double cross over recombination leading to deletion of approximately 2.5 kb upstream of the va2csa gene, including the promoter.

To further investigate the shifting pattern of var minor transcript expression, we employed a parallel approach. We again performed serial subcloning starting from clone 4, thereby obtaining additional closely related populations. If the pattern of minor transcripts is semi-conserved and shifts slowly over time, it should be largely shared in all the subcloned populations, regardless of whether they display a ‘single’ or ‘many’ var expression profile, or if they express different dominant var genes. Rather than following individual populations overtime, we instead isolated three ‘subclone generations’ (Figure 2B) and determined both the dominant var transcript as well as the pattern of minor var transcripts for each subcloned population. Similar to our previous observations, the subcloned populations displayed both ‘single’ and ‘many’ expression patterns, and the dominant var gene varied among the ‘single’ subclones (Figure 2B). Comparison of the var minor transcripts once again detected the existence of a distinct expression pattern that was semi-conserved but not fixed within this group of closely related populations (Figure 2C).

Switching events converge overtime to var2csa, a conserved var locus

Previously, Mok et al. observed that after extended growth in culture, most parasite populations eventually converged to stable expression of a unique, highly conserved var gene called var2csa (UpsE), proposing that this gene could represent a default choice for var gene switching (Mok et al., 2008). We similarly previously observed convergence to var2csa expression when we artificially induced accelerated var gene switching by altering the activity of histone modifiers (Ukaegbu et al., 2014; Ukaegbu et al., 2015), further suggesting that the var2csa locus could occupy a unique position in the var switching hierarchy. To determine if var2csa likewise displayed preferential activation in our recently subcloned parasite populations, we more closely examined var transcript prevalence over time in the expression profiles for the five clonal lines shown in Figure 2A. Consistent with previous observations (Mok et al., 2008; Ukaegbu et al., 2015), all the clones, regardless of their initial switching frequency, eventually displayed significant expression levels of var2csa (Figure 3A). While how quickly each population converged to var2csa expression varied, in each instance, switching to var2csa was highly favored, suggesting that this var gene might occupy a unique position within the var gene switching hierarchy.

The var2csa locus is required for efficient var gene switching

With respect to the SMS model, var2csa displays the properties of a sink node, and is by far the most likely var gene to become highly activated in our cultures (Figure 3A). This gene also displays several other properties that make it an atypical member of the family, including universal conservation extending to related species that infect chimpanzees and gorillas (Zilversmit et al., 2013; Gross et al., 2021) and the presence of a unique upstream regulatory region that includes an upstream open reading frame (uORF) resulting in translational repression of the mRNA (Amulic et al., 2009; Bancells and Deitsch, 2013; Chan et al., 2017). The gene can therefore transcribe mRNA without producing PfEMP1 and thus could be transcriptionally activated repeatedly over the course of an infection without generating an antibody response by the host. Based on these unusual properties, we hypothesized that var2csa represents the dominant sink node at the center of the SMS network. If correct, we predicted that loss of var2csa would significantly alter how parasites undergo var gene switching. We recently isolated numerous independent clonal parasite lines in which the entire subtelomeric region surrounding var2csa was deleted from the parasite’s genome and the chromosome end ‘healed’ through de novo telomere addition (Figure 3B; Zhang et al., 2019). To complement this set of deletions, we employed CRISPR/Cas9-mediated genome editing to replace the var2csa upstream region with a plasmid construct that included a drug selectable marker, thereby deleting the entire promoter region and rendering the gene non-functional (Figure 3C). Several independent clones were obtained from independent transfections of both 3D7 and NF54 that had this integration event and the structure of the resulting locus was verified by whole-genome sequencing. Examination of var expression profiles from each of these by qRT-PCR or RNAseq failed to detect any var2csa transcripts, indicating that transcriptional activity of the gene has been abolished. For all subsequent experiments, we observed no differences in phenotypes between the clones resulting from telomeric truncations and those derived from deletion of the var2csa promoter region.

To examine the effect of disruption of var2csa on var gene expression, var expression profiles were examined over an extended time in culture using qRT-PCR, and five representative clones (two derived from CRISPR-mediated disruption of the locus and three from subtelomeric deletion) are shown in Figure 4A. For all the clones, the initial var expression profiles resembled the two phenotypes previously observed when wildtype parasite populations were examined (i.e., either ‘single’ or ‘many’). For example, three clonal lines (V2dis1, V2dis2, and ΔV2_3) displayed expression of a dominant var gene while two other clones (ΔV2_1 and ΔV2_2) displayed a heterogeneous mixture of numerous var transcripts (Figure 4A). These results suggest that the var2csa locus is not required for var gene activation or expression, since all the isolated clones were able to express var genes. To determine if var2csa has a role in var gene switching, these five clones were cultured continuously in parallel for various periods of time, ranging from 8 months to a year, monitoring var gene expression profiles periodically. Given that wildtype parasite populations tend to converge to expression of var2csa after extended time in culture (Figure 3A and Mok et al., 2008), we investigated what would happen in the absence of this locus. We observed that all the var2csa-deleted clones remained remarkably stable in their expression profiles, with the two ‘single’ lines maintaining dominant expression of the same active var gene throughout the experiment, a time period extending over a year (Figure 4A). Moreover, the two clones that displayed the ‘many’ state failed to converge to expression of any dominant var gene and continued to display highly heterogenous expression profiles (Figure 4A). These data indicate that convergent transcriptional activation is a unique property of var2csa and that no other var gene within the 3D7 genome can easily substitute upon var2csa deletion. In addition, the loss of var2csa appears to alter how efficiently parasites undergo var gene switching, resulting in parasites that, while some changes in expression are detectable, switch at a much slower rate. These results are consistent with a role for var2csa as the dominant sink node at the center of the SMS network.

Alterations in var gene expression after deletion or disruption of var2csa.

(A) Changes in var expression profile over time in five clonal parasite populations containing deletions or disruption of the var2csa locus, including two in which the locus was disrupted by plasmid integration (V2dis1 and V2dis2, top) and three in which the locus was deleted by chromosomal truncation (ΔV2_1, ΔV2_2, and ΔV2_3). V2dis1, V2dis2, and ΔV2_3 display a ‘single’ phenotype while ΔV2_1 and ΔV2_2 express many var genes. (B) Heatmap displaying the pattern of var minor transcripts over several time points for five var2csa-deleted lines. The clones were all derived from the same parent population, and pie charts showing the initial var gene expression profiles are shown above the heatmap. The annotation numbers for each var gene are shown to the left of the heatmap, organized according to var type. For ΔV2_3, the dominant transcript (Pf3D7_0712600, marked by black boxes in the heatmap) was removed to enable visualization of the minor transcripts. (C) Non-metric multidimensional scaling (NMDS) plot based on Bray–Curtis dissimilarities displaying the expression profiles of the var minor transcripts for the six var2csa-deleted lines alongside five wildtype lines. (D) The variability within each cluster shown in C is inferred by its area on the plot (as defined by the mean distance from the group centroid for each time point) and displayed in a boxplot. (E) Transcriptomic analysis of wildtype and var2csa-mutated parasite lines. Principal component analysis (PCA) is shown based on the normalized expression level of 5721 genes log10(fragments per kilobase of transcript per million mapped fragments (FPKM) + 1). RNAseq derived whole transcriptomes were obtained from 11 clonal parasite populations: two wildtype lines (WT 3.1 and WT 7) and two WT lines with a control plasmid integration into a rif gene (WT_rif1 and WT_rif2) are displayed in orange; four var2csa-mutated lines displaying a ‘single’ phenotype (V2dis1, V2dis2, V2dis3, and ΔV2_3) are displayed in blue; and three var2csa-mutated lines displaying a “many” phenotype (ΔV2_1, ΔV2_5, and ΔV2_7) are displayed in green. All analyses were performed using data obtained from synchronized populations ~16 hr after red cell invasion. (F) Comparisons of normalized var transcript counts from var2csa-mutated and wildtype lines displaying either the single (left) or many (right) phenotypes.

Loss of var2csa disrupts the underlying var gene transcriptional activation network

Given that the loss of var2csa altered var gene switching frequency (Figure 4A), we were interested in whether it might also influence the underlying pattern of minor var transcript expression that we observed in wildtype parasites (Figure 2). To investigate this, we generated a set of var2csa-deleted subclones that were all derived from the same parent clonal population but that displayed different var expression profiles (Figure 4B, top). Similar to our previous analysis, we then examined the minor transcript pattern over multiple time points of continuous culture (Figure 4B, heatmap). While patterns of expression are detectable within individual subclones, these patterns were much more diverse than displayed by the wildtype subclones and varied substantially between subclones and over time. To verify this conclusion in an unbiased, empirical fashion, we applied non-metric dimensional scaling based on Bray–Curtis dissimilarity (NMDS), treating the expression levels of each var minor transcript as variables (Figure 4C), and for comparison we included both wildtype and var2csa-deleted lines that had been similarly monitored for changes in minor transcript patterns over time. The patterns from all the wildtype clones closely clustered within a small region of the plot (shown in shades of light green), indicative of the similarity in the underlying expression patterns. In sharp contrast, the clusters from the different var2csa-deleted lines are scattered throughout the plot with only minor overlap, thus displaying a much-reduced stability of the pattern of var minor transcripts upon deletion of var2csa (Figure 4C). The increased variance within the clusters from the var2csa-deleted lines was confirmed by measuring the degree of sample dispersion, which can be inferred by the area on the plot (as defined by the mean distance of each time point from the group centroid) (Figure 4D).

Taken together, these data are consistent with the conclusion that the underlying pattern of var expression is semi-stable within closely related wildtype parasite populations but is less stable and displays much greater variability in the var2csa-deleted lines. If the patterns of minor transcripts analysed here reflect underlying on-switching rates for individual genes, a model emerges in which var genes have differing propensities for activation, and that these change overtime, thereby enabling populations of parasites to systematically cycle through their repertoire of var genes over the course of an infection. The greater variability displayed by the var2csa-deleted lines indicates that the loss of the var2csa locus disrupted the organization of the underlying pattern of var gene minor transcripts or its stability, which could in turn disrupt or substantially alter the structured pattern of var gene transcriptional activation.

The ‘single’ and ‘many’ var expression states are associated with differences in the overall ring-stage transcriptome

To gain additional insights into the two hypothetical var expression states, we employed whole transcriptome analysis of both wildtype and var2csa-mutated lines. Specifically, we performed RNAseq from tightly synchronized ring stage (~16 hours post-invasion [hpi]) and trophozoite stage (~34 hpi) parasite populations. We compared transcriptomes from 11 different lines, including 4 var2csa-mutated lines in the ‘single’ state, 3 var2csa-mutated lines in the ‘many’ state, and 4 wildtype lines (2 ‘manys’ and 2 ‘singles’). To control for possible effects from plasmid integration, two of the wildtype lines (called WT_rif1 and WT_rif2) contain a plasmid integrated into a rif gene, analogous to the integration used to disrupt var2csa as shown in Figure 3C. Because we were interested in changes to expression of genes other than those that undergo clonally variant expression (Cortés and Deitsch, 2017), we excluded var, rif, stevor, and phist genes and performed the analysis on the remaining protein coding genes in the 3D7 genome.

As an initial assessment of gene expression in ring-stage parasites (16 hpi), we performed principal component analysis based on the mRNA levels of 5721 genes to determine if gene expression patterns are associated with the different var expression states. This analysis demonstrated clear clustering between populations that displayed either the ‘single’ or ‘many’ phenotype (Figure 4E). Further, the parasite lines with the var2csa-mutant ‘single’ or ‘many’ expression profiles displayed the most polarized patterns of gene expression while the wildtype lines presented intermediate expression patterns. Permutational multivariate ANOVA (ADONIS) confirmed that the var expression profiles contributed strongly to gene expression variability (R2 = 0.42768, ***p = 0.001). This implies that the var gene expression state (either ‘single’ or ‘many’) is associated with changes in the overall transcriptome at the ring stage of the asexual cycle. Interestingly, this phenomenon was not observed in trophozoites (see below). Our previous qRT-PCR analysis of wildtype ‘single’ and ‘many’ parasite lines found that they display very different total var gene expression levels (Figure 1C, E). To confirm this observation, we quantified the var transcripts from our RNAseq analysis from all sequenced lines. Consistent with our previous results, the wildtype ‘single’ lines displayed higher total var transcripts than the ‘many’ lines, and these differences were magnified in the var2csa-mutant lines (Figure 4F).

Transcriptome analysis indicates that ‘single’ and ‘many’ parasites differ in cell cycle progression

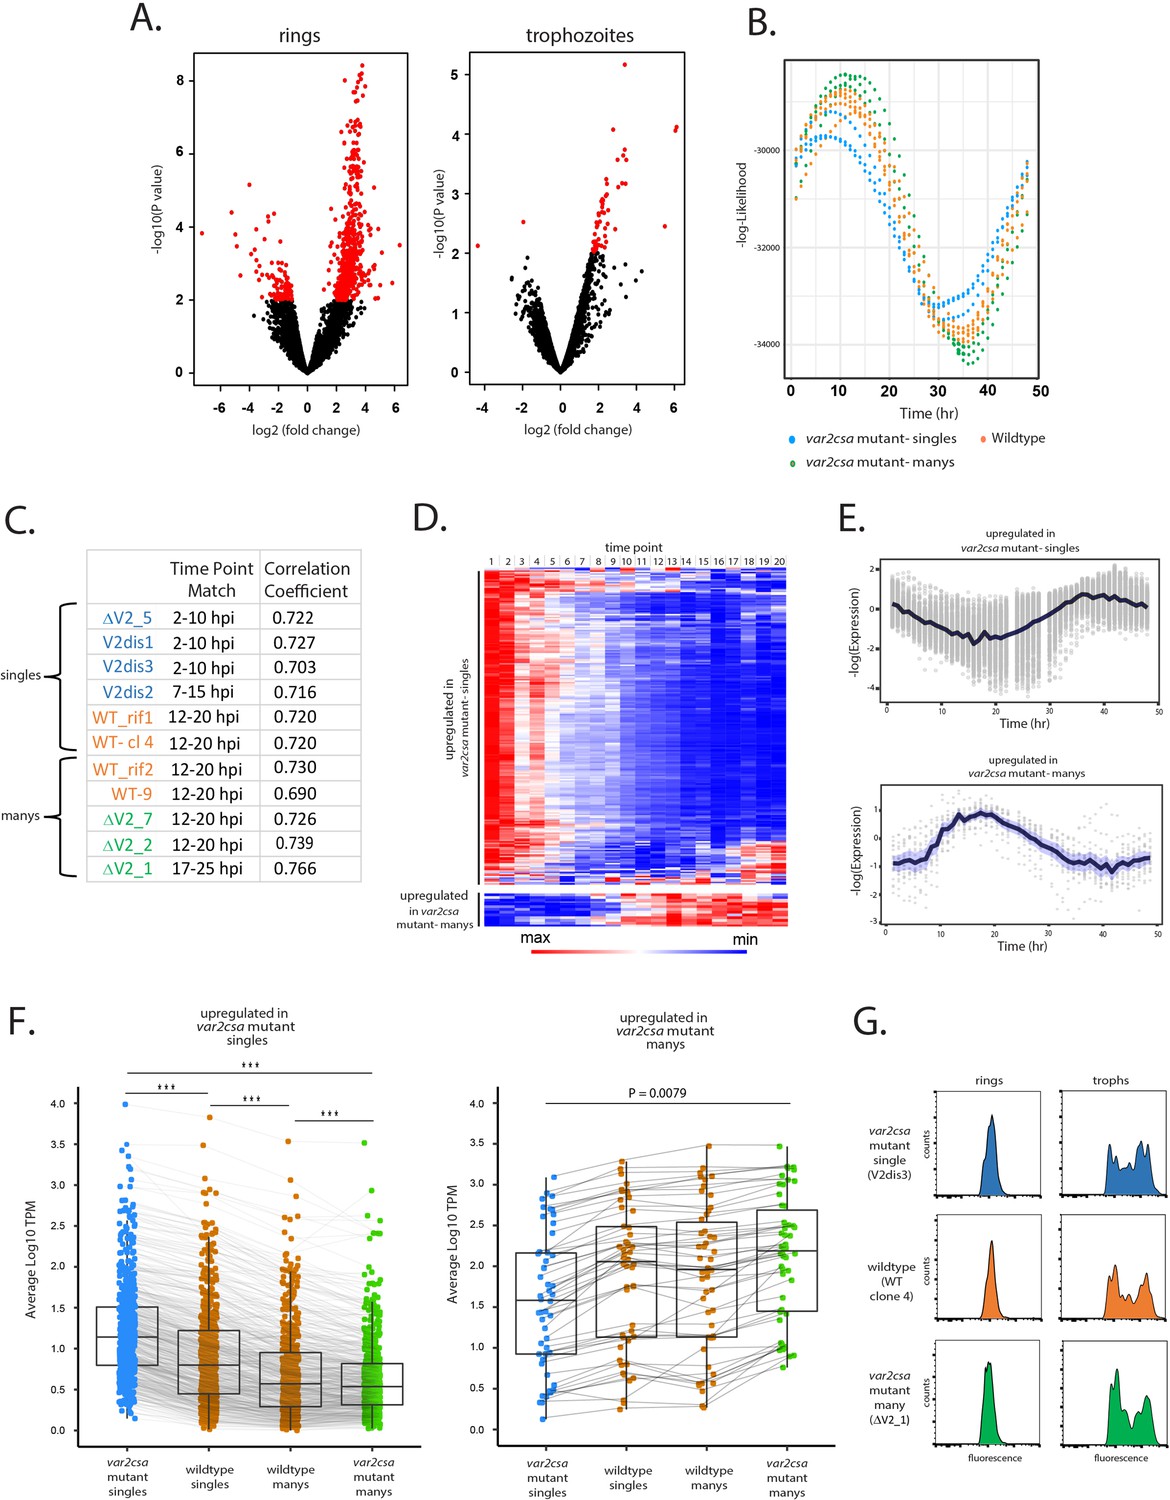
Further analysis of the transcriptional differences between the populations identified 611 differentially expressed genes (false discovery rate [FDR] <0.05) when comparing the var2csa-mutant ‘singles’ to the var2csa-mutant ‘manys’ at the ring stage (Figure 5A, left; Supplementary file 1). Specifically, we found 562 genes upregulated in ‘singles’ and the remaining 49 genes upregulated in ‘manys’, and these differences largely disappeared in trophozoites (Figure 5A, right; Supplementary file 2). Functional and gene ontology analyses of the differentially expressed genes only presented broad, relatively unspecific terms and did not identify any enriched metabolic pathways or functions (Supplementary file 3 and Supplementary file 4). This result prompted us to investigate whether the observed transcriptional changes were indicative of a shift in cell cycle progression rather than specific changes in cellular functions. We therefore applied two independent methods as described by Poran et al., 2017 and Lemieux et al., 2009 to estimate the approximate point in the replicative cycle of each of our ring-stage parasite populations. We compared the transcriptomes obtained from our lines to hypothetical transcriptomes derived from modeled parasite populations over a simulated asexual replication time course. Both methods consistently indicated a shift in cell cycle progression, with the var2csa-mutant ‘single’ lines displaying an earlier point in the asexual cycle than the var2csa-mutant ‘many’ lines and with the wildtype lines displaying an intermediate time point (Figure 5B, C). This continuum in cell cycle progression was consistent for all 11 lines, despite the fact that all cultures were synchronized to 16 hpi. Once again, the var2csa-mutant lines occupied the extreme positions in this continuum, indicating that these lines display more polarized phenotypes (Figure 5B, C, Supplementary file 5).

Figure 5 with 1 supplement see all
Parasites displaying ‘single’ vs. ‘many’ var expression profiles differ in replication cycle progression.

(A) Volcano plots showing differentially expressed genes derived from whole transcriptome comparisons of var2csa-mutated ‘single’ and ‘many’ parasite lines. Differentially expressed genes are shown in red. For ring-stage parasites (left), 562 transcripts displayed higher expression levels in the single lines, while 49 were higher in the many lines. For trophozoite-stage parasites, only 51 genes were differentially expressed. (B) Estimation of cell cycle position using the method of Lemieux et al., 2009. Using the transcriptome profiles in Supplementary file 8 (Bártfai et al., 2010), the likelihood (vertical axis) of each sample having been derived from a particular time point of the cycle (horizontal axis) is displayed. Eleven parasite lines are shown, with wildtype parasites in orange, var2csa-mutated, ‘single’ parasites in blue and var2csa-mutated, ‘many’ parasites in green type. (C) Table showing estimates of replication cycle progression for all 11 parasite lines. Estimates of the approximate time point within the 48-hr asexual cycle for each population were obtained by comparison with a modeled parasite population over a simulated infection time course using established datasets (Poran et al., 2017). The best time point match is shown for each population along with the correlation coefficient. Wildtype parasites are designated with orange type, var2csa-mutated, ‘single’ parasites with blue type and var2csa-mutated, ‘many’ parasites with green type. (D) Heatmap displaying changes in expression over the asexual replicative cycle for 611 differentially expressed genes according to the 48-hr asexual cycle of the P. falciparum HB3 transcriptome datasets defined by Bozdech et al., 2003; Supplementary file 9. Genes upregulated in var2csa-mutated ‘single’ lines are shown on top and those from var2csa-mutated ‘many’ lines are displayed on the bottom. (E) Average expression levels across the 48-hr asexual cycle of HB3 for 611 differentially expressed genes. Genes upregulated in var2csa-mutated, ‘single’ lines are shown on top and those upregulated in var2csa-mutated, ‘many’ lines are shown on the bottom. (F) Left panel, transcript expression levels for 559 differentially expressed genes that display higher expression in ‘single’ parasites. Average, normalized transcript levels were obtained from var2csa-mutated, ‘single’ parasites (blue), wildtype ‘single’ and ‘many’ parasites (orange, left and right, respectively), and var2csa-mutated, ‘many’ parasites (green). Box and whisker plots display the mean and standard deviation for each dataset. Right panel, analysis of transcript expression levels for 49 differentially expressed genes that display higher expression in ‘many’ parasites. Pairwise comparisons using t-tests with pooled standard deviation. p value adjustment method is from Bonferroni (significance codes: 0 ‘***’, 0.001 ‘**’, 0.01 ‘*’). (G) Monitoring of DNA content of infected cells by flow cytometry. Populations of var2csa-mutant ‘singles’ (top), wildtype (middle), and var2csa-mutant ‘manys’ (bottom) were tightly synchronized then assayed for DNA content by flow cytometry using Hoechst 33342 staining. Parasites were assayed at 16 and 36 hr after invasion.

To further investigate the possibility that the differences in gene expression resulted from a shift in ring-stage progression, we used the PlasmoDB database to examine the transcriptional timing of all the differentially expressed genes. We found that of the 562 genes upregulated in ‘singles’, 559 have higher transcription levels at 0–10 hpi compared to 10–20 hpi and similarly, all 49 genes upregulated in ‘manys’ have higher transcription levels at 10–20 hpi compared to 0–10 hpi (Figure 5D, E, Supplementary file 3 and Supplementary file 4; Bártfai et al., 2010), providing additional evidence that the transcriptional differences of these populations likely reflect a shift in the replicative cycle. The expression levels of the differentially expressed genes for all 11 lines again confirm that the 4 wildtype lines display an intermediate level of transcription for all the differentially expressed genes (Figure 5F). Taken together, these analyses indicate that being in the ‘single’ or ‘many’ state correlates strongly with how quickly parasites progress through the ring stage of the cycle. In addition, the var2csa-mutant lines display more polarized phenotypes, suggesting that these populations are more homogenous in being either ‘single’ or ‘many’, a conclusion consistent with the hypothesis that in the absence of var2csa, parasites are less efficient in transitioning between states. A similar change in ring-stage progression was previously observed in response to treatment with a histone methyltransferase inhibitor (Chan et al., 2020) that also altered var gene expression patterns (Ukaegbu et al., 2015), as well as in parasites that display reduced sensitivity to artemisinin (Mok et al., 2011; Mok et al., 2015), indicating that how quickly parasites progress through the first half of their replicative cycle is somewhat flexible. Interestingly, these differences appear to be largely limited to progression through the ring stage. Measurement of DNA content of synchronized cultures by flowcytometry indicated that var2csa-mutant ‘single’ and ‘many’ populations undergo DNA replication with similar timing as wildtype parasites (Figure 5G), and growth assays did not detect any overall differences in the growth of the cultures (Figure 5—figure supplement 1), indicating that length of the complete replication cycle is not detectably different. Combined with the gene expression data obtained from RNAseq, it appears that ‘single’ parasites catch up to ‘manys’ as they begin DNA replication, thereby negating any growth advantage. These experiments indicate that the ring stages of ‘single’ and ‘many’ states are distinct beyond just var gene expression, and likely reflect changes in the nuclear or epigenetic organization of the parasite’s genome that affect ring-stage progression and associated gene expression patterns.

Discussion

The SMS model for var gene transcriptional switching proposes that switching expression from one var gene to another involves transition from transcribing a single var gene, to many, then back to a single gene again (Figure 1A). This type of two-step selection of a gene for activation is now well documented for the choice of a single transcriptionally active olfactory receptor gene in mammals (Serizawa et al., 2004) and more recently for expression of a single vsg in metacyclic African trypanosomes (Hutchinson et al., 2021). In both cases this involves the initial, low-level transcription of multiple genes, which is then limited to a single gene in fully differentiated cells (Tan et al., 2015; Hutchinson et al., 2021; Hanchate et al., 2015; Saraiva et al., 2015). In olfactory neurons, this coincides with the stepwise establishment of specific interchromosomal contacts and the assembly of subnuclear compartments that limit expression to a single gene (Monahan et al., 2019). Our results indicate that a similar process occurs in malaria parasites during var gene switching, a possibility that is consistent with the suggestion that individual parasites can express multiple var genes, a phenomenon that was previously reported using immunofluorescence and in situ hybridization (Joergensen et al., 2010). If correct, mutually exclusive var gene expression is possibly more plastic than previously assumed, although additional work at the single cell level will be required to fully characterize the extent of var gene activation in individual parasites in the ‘many’ state.

Populations of parasites in which var2csa was deleted or disrupted displayed slower var gene switching rates (Figure 3) and appear more polarized with respect to the ‘single’ vs. ‘many’ states (Figure 5), indicating that they are much less efficient in transitioning between these two states. How the var2csa locus contributes to transcriptional switching is not known, although given that the var2csa promoter region appears to be important for this function, it is tempting to propose a model of promoter competition, as has been proposed for chromosome choice during X-inactivation in mammals or vsg expression site choice in African trypanosomes (Hutchinson et al., 2021; Constância et al., 1998). Such models typically propose that when in the many state, multiple loci compete or ‘race’ for activation, with each locus expressing a low level of transcripts. When one locus reaches a threshold, transcription from the other loci is suppressed, resulting in stable monoallelic expression. If this model applies to var gene expression, the unique nature of the var2csa promoter could enable it to compete with an actively expressed var gene, thereby lowering its expression level to below the threshold and thus allowing the parasite to re-enter the ‘many’ state. This would provide an explanation for why loss of the var2csa locus results in stabilization of the active var gene and greatly reduces switching. Previous work from Duffy et al., 2009; Duffy et al., 2017 showed that alterations to sequences adjacent to the var2csa promoter can further increase its competitiveness, making it hypercompetitive and stably expressed, thus suppressing switching rates in a way consistent with this model. The propensities of cultured parasites to converge toward expression of var2csa independent of genomic rearrangement is also consistent with its highly competitive nature (Mok et al., 2008). To complete a switch to an alternative var gene, activation of var2csa would have to be unstable, a property that could result from its unique structure, including the presence of an uORF and an untranslated mRNA (Amulic et al., 2009; Bancells and Deitsch, 2013). While var2csa is unique in its structure and appears to be the dominant ‘sink node’ in the experiments described here, other var genes could also display greater propensities for activation, thereby functioning as additional nodes and providing greater structure to the network. For example, we observed frequent activation of Pf3D7_0421100 in our subcloned populations, indicating this gene could be acting as a node, at least in the context of our study.

The location of a large proportion of the var gene family within subtelomeric regions makes them uniquely subject to frequent recombination and deletion events, an inherent plasticity that is reflected in the variable number of var genes observed in the genomes of different parasites isolates (Otto et al., 2019). Interestingly, despite the hyper-recombinogenic nature of the subtelomeric region in which it resides, var2csa remains conserved in all P. falciparum lines examined, and this conservation extends to the related species P. reichenowi and P. praefalciparum (Gross et al., 2021). We hypothesize that its role in mediating expression switching selects for its preservation within the genomes of wildtypes parasites. This hypothesized additional role for var2csa is consistent with detection of its transcription non-pregnant individuals (Duffy et al., 2006; Beeson et al., 2007; Rovira-Vallbona et al., 2011) as well as activation of var2csa coincident with var gene switching during an experimental human infection (Bachmann et al., 2019). We previously documented frequent subtelomeric deletions that included var genes on other chromosomes (Calhoun et al., 2017; Reed et al., 2021), including the subtelomeric regions of chromosomes 2, 3, and 14 in the 3D7 control lines employed here (Calhoun et al., 2017), however none of these deletion events resulted in altered var switching phenotypes, indicating that the properties we describe here are unique to the var2csa locus. The frequently described convergence of cultured parasite populations to expression of var2csa could be a result of a selective growth advantage parasites acquire if the var2csa transcript only translates the uORF, thus saving the metabolic cost of translating a full-length PfEMP1. While feasible, if true one would expect the ‘many’ parasites to similarly display a selective growth advantage given their very low rate of var gene transcription, which we do not observe (Figure 5—figure supplement 1).

In addition to changing the frequency of var expression switching, deletion of var2csa also resulted in major changes in the pattern of minor var transcripts displayed by parasite populations (Figure 3). This underlying pattern of transcription has been proposed to reflect switching biases within the var gene network (Recker et al., 2011; Horrocks et al., 2004), thereby imposing a structure on the trajectory that var expression takes over the course of an infection. This type of structured genetic network could coordinate var gene activation throughout the parasite population without requiring communication between infected cells and thus would enable lengthy infections despite a relatively small number of variant antigen-encoding genes. The shifting pattern of var minor transcripts observed in wildtype parasites and shown in Figure 2 is consistent with this hypothesis. The disruption of the pattern of minor transcripts upon deletion of var2csa indicates that this gene plays an important role in maintaining the structure of the var gene transcriptional network, although the molecular mechanism underlying this phenomenon is not known. Additional work focused on subnuclear genome organization, specifically with regard to heterochromatic regions, and the role that var2csa plays in this organization are likely to shed light on this process.

The switching biases observed in cultured parasites could help refine the trajectory of var expression over the course of an infection, as suggested by the model proposes by Recker et al., 2011. However, it is important to note that while var gene expression patterns displayed by parasite cultures likely reflect inherent switching biases, in a natural infection the host’s immune system, in particular existing antibodies against PfEMP1, are likely to exert a profound selective pressure that determines which parasites can successfully establish a high parasitemia. Pre-existing anti-PfEMP1 antibodies that recognize any particular variant will select against parasites expressing its encoding var gene, thus strongly shaping the var expression pattern over the course of an infection. The importance of antibody selection and pre-existing immunity explains why expression patterns cannot be truly hardwired and must maintain flexibility, indicating why switching biases rather than a strict switching order are ideal for maintaining chronic infections.

Given the lack of an in vivo experimental system for P. falciparum, it is difficult to investigate the ‘single’ and ‘many’ states in natural infections. However, an interesting case study of a semi-immune African immigrant to Europe might be informative (Bachmann et al., 2009). No parasites were initially detected in this patient by microscopy or by malaria antigen tests, although the individual displayed high titers of antibodies to malaria antigens indicating a significant level of immunity. Upon splenectomy, parasitemia became evident and increased to high levels, indicating a latent infection existed prior to removal of the spleen. The parasites observed in the peripheral circulation represented all stages of the asexual cycle, indicating a lack of cytoadherence, and in vitro binding assays failed to detect adhesion to various endothelial receptors. Further, molecular analysis indicated that these parasites did not express var genes at a detectable level. However, upon transfer to in vitro culture, var gene expression became easily detectable and the infected cells became cytoadherent. This is reminiscent of our observations that parasites can transition between high-level expression of individual var genes (the ‘single’ state) and very low-level var gene expression (the ‘many’ state). A similar example of parasites lacking expression of surface antigens upon splenectomy was observed in monkeys infected with Plasmodium knowlesi (Barnwell et al., 1983), suggesting that this might be a more general phenomenon among malaria parasite species that display cytoadherence. It is tempting to speculate that in the presence of high titers of anti-PfEMP1 antibodies, parasites in the ‘many’ state are selected for and thus represent the dominant population found in semi-immune, asymptomatic infected individuals. Consistent with this hypothesis, Kho et al. more recently reported that the vast majority of the parasite biomass in asymptomatic infections is found in the spleen (Kho et al., 2021), indicative of non-cytoadherent parasites and potentially reflecting lower expression of PfEMP1. Similarly, a recent study of parasites obtained from asymptomatic patients at the end of a dry season detected a lower level of var expression than observed in parasites from symptomatic patients, although this difference was not statistically significant (Andrade et al., 2020). Thus, it is possible that in individuals with significant levels of immunity, parasites in the ‘many’ state can persist at a low level, escaping anti-PfEMP1 antibodies through repressed var gene expression and maintaining very low parasitemias.

Materials and methods

Key resources table
Reagent type (species) or resourceDesignationSource or referenceIdentifiersAdditional information
Gene (Plasmodium falciparum)var2csaEuPathDBPF3D7_1200600
Strain, strain background (P. falciparum)NF54Delemarre and van der Kaay, 1979 (PMID:390409)NF54
Strain, strain background (P. falciparum)3D7Walliker et al., 1987 (PMID:3299700)3D7
Transfected construct (P. falciparum)pL6_eGFPGhorbal et al. (PMID:24880488)CRISPR-targeting plasmid
Transfected construct (P. falciparum)pUF1_Cas9Ghorbal et al. (PMID:24880488)CRISPR-targeting plasmid
Software, algorithmaligner HISAT2Kim et al., 2019 (PMID:31375807), Afgan et al., 2018 (PMID:29790989)v.2.2.0
Software, algorithmfeatureCountsLiao et al., 2014 (PMID:24227677)Package Rsubread v.2.0.1
Software, algorithmDESeq2Love et al., 2014 (PMID:25516281)v.3.14
Software, algorithmEdgeRChen et al., 2016 (PMID:27508061), McCarthy et al., 2012 (PMID:22287627), Robinson et al., 2010 (PMID:19910308)v.3.14
Software, algorithmRRstudio (1.4.1717)v.4.1.0
Software, algorithmveganCommunity Ecology Packagev.2.5-7
Software, algorithmPERMANOVACommunity Ecology Packagev.2.5-7
Software, algorithmheatmap.2gplotsv.2.3.0

Parasite culture

Request a detailed protocol

All parasite strains were derived from the reference strain NF54/3D7 and maintained in RPMI 1640 supplemented with 0.5% AlbuMAX II (Invitrogen) in an atmosphere of 5% O2, 5% CO2, and 90% N2 at 37°C and 3–5% hematocrit. Strain identify was confirmed by whole-genome sequencing and any contaminating mycoplasma were removed at the beginning of the study as described (Singh et al., 2008). Transgenic lines were maintained under continuous drug selection. Clonal parasite lines were obtained by limiting dilution Kirkman et al., 1996 in 96-well plates. For analysis of gene expression in subcloned populations, parasites were grown for 5 weeks from the initial isolation of individual parasites. Daily parasitemias were monitored using a Cytek DxP12 flow cytometer.

Generation of transgenic lines

Request a detailed protocol

Parasites with chromosomal truncations that included the var2csa locus were generated and described in a previous study (Zhang et al., 2019). Specific disruption of the var2csa locus was performed via CRISPR-targeted plasmid integration. Briefly, parasites were transfected by electroporation (Wu et al., 1996; Deitsch et al., 2001) using derivatives of the plasmids pL6_eGFP and pUF1_Cas9 for CRISPR/Cas9-based genome editing as described by Ghorbal et al., 2014. Homology blocks were PCR amplified from 3D7 genomic DNA, using specific primers flanked by 15-bp overlapping regions from pL6-var2csa-promoter-deletion plasmid and pUF1_Cas9 (list of primers, see Supplementary file 6) that allowed the cloning by infusion cloning (Clontech, Takara Bio USA, Mountain View, CA, USA). Plasmid integration was validated by PCR across the site of integration and whole-genome sequencing.

RNA extraction, cDNA synthesis, and quantitative RT-PCR

Request a detailed protocol

Parasite RNA was extracted from synchronized late ring-stage parasites as described previously (Dzikowski et al., 2006). Briefly, ring-stage parasites were collected using a double synchronization approach. Cultures were initially synchronized using 5% sorbitol to select for ring stages. Thirty-six hours later, late-stage infected erythrocytes (42–48 hpi) were collected using percoll/sorbitol gradient centrifugation and allowed to reinvade overnight. Ring-stage parasites were collected for RNA extraction 18 hr after enrichment for late-stage infected erythrocytes (12–18 hpi). After an additional 20 hr in culture, trophozoites were collected for RNA isolation. Synchronization was verified by microscopy and flow cytometry. RNA was extracted with TRiZol (Invitrogen) and purified on PureLink (Invitrogen) columns following the manufacturer’s protocols. Isolated RNA was treated with Deoxyribonuclease I (DNase I) (Invitrogen) to degrade contaminating genomic DNA. cDNA was synthesized from approximately 800 ng of RNA in a reaction that included Superscript II RNase H reverse transcriptase (Invitrogen) as described by the manufacturer. Control reactions in the absence of reverse transcriptase were employed to verify a lack of gDNA contamination. We employed the qRT-PCR var primer set of Salanti et al. to detect transcript levels from all var genes (Salanti et al., 2003). This primer set was specifically designed and tested to enable absolute quantification of transcript levels. Additional primers were designed and applied to increase the accuracy (list of primers, see Supplementary file 6). Quantitative PCR was performed using a Quant Studio 6 Flex 489 realtime PCR machine (Thermo Fisher) using iTaq Sybr Green (Bio-Rad). Quantities were normalized to seryl-tRNA synthetase (PF3D7_0717700). ΔCT for each individual primer pair was determined by subtracting the individual CT value from the CT value of the control and converting to relative copy numbers with the formula 2ΔCT. All qRT-PCR assays were performed in a 384-well format PCR machine enabling duplicate or triplicate runs performed simultaneously. Biological replicates were prepared from independent RNA extractions. Relative copy numbers for each var gene were determined in Microsoft Excel and transcriptional profiles of individual genes are presented as pie charts or as bar graphs. In bar graphs, standard deviations from biological replicates are shown with error bars.

RNA sequencing and analysis

Request a detailed protocol

Parasite-infected RBCs from highly synchronous cultures containing ring or trophozoites stage parasites were collected for RNAseq. Following RNA isolation, RNA concentrations were measured using the NanoDrop system (Thermo Fisher Scientific, Inc, Waltham, MA). Total RNA integrity was checked using a 2100 Bioanalyzer (Agilent Technologies, Santa Clara, CA). rRNA removal, preparation of an RNA sample library and final cDNA library were completed and the libraries pooled for sequenced using an Illumina HiSeq4000 sequencer with paired-end protocol performed by the Genomics Core Laboratory at Weill Cornell Medicine. The raw reads that passed quality control were mapped to the P. falciparum genome (PlasmoDB-9.0_Pfalciparum3D7_Genome) by aligner HISAT2 (v.2.2.0) (Kim et al., 2019; Afgan et al., 2018). Based on the alignment, featureCounts (Package Rsubread v.2.0.1) (Liao et al., 2014) was used to generate a raw counts matrix for differential expression analysis. We independently performed both DESeq2 (v.3.14) (Love et al., 2014) and EdgeR (v.3.14) (Chen et al., 2016; McCarthy et al., 2012; Robinson et al., 2010) for the differential expression analysis. Genes with a false discovery rate of ≤0.05 with a mean fragments per killobase of transcript per million mapped fragments (FPKM) >5 in at least one strain were called significant. To exclude the obvious impact of antigenic variant genes, we excluded var, rif, stevor, and phist genes from the differential expression analysis. The analysis was conducted with R (v.4.1.0) in Rstudio (1.4.1717). RNA sequencing was performed by the Weill Cornell Genomic core with the following parameters. All samples must have an RIN value greater than 8 for library synthesis. Ribosomal RNA was removed from total RNA using the Ribo Zero Gold for human/mouse/rat kit (Illumina). Using the TruSeq RNA Sample Library Preparation v.2 kit (Illumina), RNA was fragmented into small pieces using divalent cations under elevated temperature. Cleaved RNA fragments were copied into first-strand cDNA using reverse transcriptase and random primers. Second-strand cDNA synthesis followed, using DNA Polymerase I and RNaseH. The cDNA fragments then went through an end repair process, the addition of a single ‘A’ base and ligation of adaptors. The products were then purified and enriched with PCR to create the final cDNA library. Libraries were pooled and sequenced on an Illumina HiSeq4000 sequencer with 100-bp Paired End Sequencing (PE100). Total reads and mapped reads for each sample are shown in Supplementary file 7.

Statistical analysis

Request a detailed protocol

Statistical analysis was performed in R (v.4.1.0). We assessed beta diversity of our samples’ var genes expression profiles using NMDS ordination. NMDS plots and beta dispersion were generated in vegan: Community Ecology Package (v.2.5-7) using Bray–Curtis dissimilarity. Permutational multivariate analysis of variance (PERMANOVA) was performed using the ‘adonis’ function in vegan. Heatmaps were generated by heatmap.2 from gplots (v. 2.3.0).

Flow cytometry and assays for cell cycle progression

Request a detailed protocol

Progression through the cell cycle was determined by flow cytometric analysis of parasite DNA content as previously described (Grimberg, 2011). Briefly, parasites were tightly synchronized were stained at 37°C with 16 µM Hoechst 33342 for 30 min at 1% hematocrit in incomplete media followed by a single wash in phosphate-buffered saline (PBS). Cells were then diluted to 0.1% hematocrit in PBS and analyzed using a Cytek DxP11 flow cytometer for Hoechst 33342 DNA staining (375 nm laser, 450/50 emission filter).

Growth assays

Request a detailed protocol

Cultures were adjusted to 0.05–0.5% parasitemia, 5% hematocrit in a total culture volume of 5 ml. Parasitemia was obtained daily by flow cytometry and verified by thin smear stained with Giemsa (Sigma). Parasitemia was allowed to increase over time until reaching a level greater than 0.5–1%, at which time cultures were diluted 1 in 10 in culture media containing uninfected RBCs. Changes in parasitemia were calculated by multiplying the daily parasitemia by the exponential dilution factor and the data were graphed on a log scale over time.

Materials availability statement

Request a detailed protocol

Data deposition: Whole-genome sequence and transcriptome data are available at the BioProject database of the NCBI. The genome sequencing data can be accessed at this link: http://www.ncbi.nlm.nih.gov/bioproject/515738. The RNAseq data can be accessed at this link: https://www.ncbi.nlm.nih.gov/bioproject/?term=PRJNA802886. All genetically modified parasite lines are available from the authors upon request.

Data availability

Whole-genome sequence and transcriptome data are available at the BioProject database of the NCBI. The genome sequencing data can be accessed at this link: http://www.ncbi.nlm.nih.gov/bioproject/515738. The RNAseq data can be accessed at this link: https://www.ncbi.nlm.nih.gov/bioproject/?term=PRJNA802886.

The following data sets were generated
    1. Zhang X
    2. Deitsch KW
    (2022) NCBI BioProject
    ID PRJNA802886. A coordinated transcriptional switching network mediates antigenic variation of human malaria parasites.
The following previously published data sets were used
    1. Zhang X
    2. Deitsch KW
    (2019) NCBI BioProject
    ID PRJNA515738. Rapid antigen diversification through mitotic recombination in the human malaria parasite Plasmodium falciparum.

References

    1. Delemarre BJ
    2. van der Kaay HJ
    (1979)
    Tropical malaria contracted the natural way in the Netherlands
    Nederlands Tijdschrift Voor Geneeskunde 123:1981–1982.

Decision letter

  1. Olivier Silvie
    Reviewing Editor; Sorbonne Université, UPMC Univ Paris 06, INSERM, CNRS, France
  2. Dominique Soldati-Favre
    Senior Editor; University of Geneva, Switzerland

In the interests of transparency, eLife publishes the most substantive revision requests and the accompanying author responses.

[Editors' note: this paper was reviewed by Review Commons.]

Thank you for submitting your article "A coordinated transcriptional switching network mediates antigenic variation of human malaria parasites" for consideration by eLife. Your article has been reviewed by two reviewers (including one from the initial evaluation at Review Commons), and the evaluation at eLife has been overseen by a Reviewing Editor and Dominique Soldati-Favre as the Senior Editor.

Based on the previous reviews and the revisions, the manuscript has been improved but there are some remaining issues that need to be addressed, as outlined below.

Recommendations for authors

1. For many clonal lineages, only pie charts are provided for visual inspection and categorization into 'single' or 'many'. However, this also appears to be largely dependent on overall var gene expression, as in Figure S1A, subclone NF54-5 has dominant expression of a single variant and low overall var gene expression and was therefore classified as 'many'. The authors should provide expression levels as displayed in Figure 1C for all subclones analyzed in the study. These graphs could be displayed next to the corresponding pie chart, or as supplemental figures.

Importantly, an unbiased approach to categorizing parasites into different states would be desirable. Perhaps the combination of a diversity index and total var gene expression could provide sufficient discrimination.

2. The transcriptomics data reveal that "manys" progress through the first half of the replicative cycle faster, yet the "singles" catch up in the second half, and thus both populations have equivalent replication cycle lengths. The authors should discuss further why 'many' parasites have no growth advantage over several parasite generations, despite faster ring stage progression. Do the 'single' parasites catch up with this lag later? Giemsa smears, in addition to growth curves, would be useful to better document progression through the IDC of 'single' versus 'many' parasites.

3. The authors should discuss how the switch model proposed by Recker et al. could work with only a single dominant sink node that is barely inactivated during the cultivation of the parasites in vitro. In fact, what about the PF3D7_0421100 gene, which is also frequently activated and stably expressed in many subclones in different generations (Figure 2B)? Could this also be a sink node?

4. Reviewers appreciated that the authors have made an effort to improve the readability and presentation of the data. However, they also noted that there is still room for improvement.

a) The labeling of the heatmaps and bar graphs is not consistent with respect to the order of var genes and the var groups are labeled twice in the heatmaps (largely on the left side and after each gene).

b) There are some inconsistencies: cultivation days for the same clonal lines are not identical in Figures 2A and 3A; clonal line V2dis2 is classified as "many" in Figure 4A but as "single" in Figures 4E and F.

c) Why do the authors not show var2csa expression in the wild-type heat maps, but in the pie charts?

d) The phylogenetic trees of clones and subclones are partly redundant, but an overview including all clonal lineages, e.g. also clones 1, 2, 4, and 5, is still missing (could be included as a Supplemental figure).

e) Var1 should not be labeled as group D, which has been shown not to exist. The authors also do not explicitly designate var3 type genes, and the reviewers suggest including var1 and var3 in group A and more accurately labeling them var1 and var3 variants.

f) The similarity of the minor transcripts between Figure 2A and C is difficult to judge from the heat maps. Why did the authors not include the subclones from Figure 2C in the Bray-Curtis dissimilarity analysis shown in Figures 4C and D?

5. After disruption of the var2csa promoter, do the authors still see var2csa expression, or can they confirm its absence?

https://doi.org/10.7554/eLife.83840.sa1

Author response

Reviewer #1 (Evidence, reproducibility and clarity (Required)):

Summary:

Xu and colleagues studied to unravel the program that underlies the antigenic switching mechanism between members of the var gene family, which encode major virulence factors that help evade immune clearance during natural infection. The authors propose that a unique member of the family, var2csa, is central to a hierarchical switching program, which disruption of the loci results in the impairment of the program.

Major comments:

A) On data presentation

One of the confusions, if not annoyance, for any reader to navigate through the figures and data is the lack of standardization. The presented figures give an impression of poor stringency during the construction especially regarding the finer details.

For example, the annotation of the different clones used in the study appear to be unmethodical. Ideally, the annotation of the clone should reflect information of the parental genetic background and the history of the cloning procedures. For example in Figure 1 the clones are annotated as C3C6…whereas in Figure 2 there are clones being annotated as A3.B8. Both tend to suggest the parasite have been cloned twice but named in a different way. Furthermore, A3.B8 and A3.C10 intuitively suggest both being a subclone of A3, yet they are stated not to be from the same parent population (line 221). Also on Figure 2, A3 and 3A are just too similar to give rise to confusion. It is advised to re-name all the clones methodically.

We now appreciate that the original naming scheme applied to the clones was confusing and difficult to follow. We have therefore renamed all the clones described in the manuscript and used names that reflect their origins. We hope this clarifies the logic and progression of the paper.

It is rather inappropriate and potentially biased to calculate column z-score using the relative copy numbers of different var genes in the heatmaps. Since Cq values generated from sybr green signal are dependent on the amplicon size, even different primers on the same var gene can give different relative copy numbers. Relative copy numbers can be used to calculate row z-score, but column z-score requires the use of absolute quantitation method. Furthermore, the purpose of the heatmaps used in this study is to illustrate the abundance of different minor transcripts. Since the authors do not intend to demonstrate the relationship between the clones nor the different var genes, ordering the genes by hierarchical clustering is not useful. It is more preferable to order the genes in a standardized manner (for example by the ups type), so that they can be compared between figures. The omitted dominant var genes can also be denoted by a special color in the heatmap. This can maximize data retention and the readability of the heatmaps.

For example, on line 183-185, "the entire var gene family is not equally represented […] biased towards certain var genes." It is difficult to appreciate this statement because it is impossible to assess such bias using the current heatmaps.

We appreciate the concerns of the reviewer and have modified the figures appropriately. As suggested by the reviewer, the heatmaps in Figures 2 and 4 are no longer arranged using hierarchical clustering and instead have been restructured according to ups type. This provides a standardized structure and enables easy comparison of all the figures, as the reviewer had hoped. Patterns are now discernable. We thank the reviewer for this suggestion. The reviewer was also concerned about the calculation of column z-scores derived from relative copy numbers in the construction of the heatmaps, particularly if the amplicons from each var gene are not of equal length. However, the primer set designed by Salanti et al. (Mol Micro, 2003) was specifically designed and tested to enable absolute quantification. Because we intend to compare patterns across the different clones, we prefer this method for creating the heatmaps. We now specifically mention this in the Results section and the Methods section (see lines 131-134 and 601-608).

The timepoints and clones chosen for var profiling appear to be arbitrary. Different timepoints (Figure 3A and 4A) and random removal/ addition of clones (among Figure 4A,4B and 4F) are seen without proper justification.

The clones chosen for the var profiling were not arbitrary, although with the previous naming scheme this might have been difficult to follow. We hope the new naming organization will make our logic clear. The timepoints for analysis are constant in Figure 2A. The reviewer is correct that timepoints shown in Figures 3 and 4 are not constant. While perhaps not ideal, this reflects the evolution of the experiment over the years in which the project was conducted and does not alter the conclusions of the experiments. The time points are now clearly marked in each figure.

Experimental details regarding technical/ biological repeats are lacking. For example, it will be important to state how many times the CRIPSR protocol was repeated?

The var2csa deletion (via chromosome truncation) resulted from multiple independent events that were previously described in detail in Zhang et al. PLOS Bio, 2019. Clones derived from three of these independent events were fully characterized in the previous paper and were used in the current manuscript. All displayed the same phenotype. The CRISPR-mediated integration was repeated in both 3D7 and NF54, and all clones provided the same phenotype. We have added to the text to make this clearer (see lines 260-271).

B) On experimental design

In my opinion, the conclusion of the manuscript can be substantially strengthened if a control parasite, which has the promoter region of a random subtelomeric var gene deleted, was also generated and analysed. As is now, the statement on line 319-321, "These data indicate […] no other var gene within the 3D7 genome can easily substitute upon var2csa deletion.", are not necessarily supported. As one can easily argue that the same switch and convergent impairment maybe readily observed if any var gene is deleted. Indeed, ref14 cited in this manuscript also reported a complete switch impairment concommitant to the subtelomeric deletion of chr 2 and 9, dismissing the reduced-switching phenotype as a specific effect upon var2csa deletion as stated on line 321-323. It is understandable that it can be challenging to generate and analyse this control parasite due to the long time-frame of the experiment. The authors should at least address this in the discussion.

The reviewer makes a good point here that we did not discuss in the original version of the manuscript. In previously published work, we had deleted several var genes in alternative positions in the genome and did not observe the switching impairment described here. In addition, the 3D7 reference line that is frequently used throughout the world has subtelomeric deletions of var genes on both ends of chromosome 14 (Calhoun et al., 2017), but appears to undergo var transcriptional switching. We now discuss this and provide citations in the Discussion section (see lines 478-482). We also added two additional control lines to the RNAseq analysis (Figure 5) in which we disrupted a rif gene near var2csa. These lines clearly display a wildtype phenotype as expected. We also now note in the discussion that reference 31 (Mok et al) concluded that switching to var2csa was independent of genomic rearrangement (lines 461-463) and mention the work of Duffy et al. (lines 458-461), which similarly reported a genomic rearrangement adjacent to var2csa that resulted in var2csa activation leading them to conclude that the effect resulted from the cis-sequence surrounding var2csa, a hypothesis consistent with our model indicating that var2csa is highly competitive. We think these observations are entirely consistent with one another and together lead to a more refined model of how the var network is coregulated.

C) On data interpretation

Stochastic switching and subsequent clonal selection is a vying hypothesis of var switching program regime. While the conclusion made by the authors that var2csa is central to a switching hierarchy is fair and reasonable. It is also possible that the "sink" property of var2csa is due to in vitro selection. Var2csa expressing parasites may gain a growth advantage because as the authors pointed out, it contains a unique uORF that prevents the unnecessary translation of VAR2CSA in vitro and diverts the much needed resources for growth especially during early stage where heamoglobin digestion is limited and nutrient import machinery still nascent. Deletion of var2csa appears to cause inefficient switching may simply because no parasite, regardless of the var profile, gain any growth advantage to be selected.

Results from Figure 5 that show "many"s, which express lower level of total var, are always progressing faster during early stage support such a case.

One experiment that can further validates the authors claim is to generate a parasite with point mutation on the start codon of the var2csa uORF. Again such manipulation will be challenging and time-consuming, therefore, the authors should at least discuss this since stochastic switching and selection is indeed a more prevailing view among the community.

The reviewer describes a very plausible model suggesting that energy conservation from not expressing PfEMP1 could lead to convergence to var2csa. The more rapid progression through the first half of the replicative cycle by “manys” is consistent with this hypothesis. To address this possibility, we generated growth assays for “single” and “manys” as well as parasites in which var2csa had been deleted and detected no difference in growth rates (see new Supplementary Figure 1). We also observed that while “manys” progress through the first half of the replicative cycle faster, the “singles” catch up in the second half, and thus both populations have equivalent replication cycle lengths. We have added a flow cytometry analysis of DNA replication to Figure 5 to show that all clones replicate their DNA in a similar time frame suggesting that the more rapid progression through the early stages of the asexual cycle does not slow replication. We now discuss these ideas in the Discussion section (see lines 482-488).

The reviewer’s suggestion regarding creating a point mutation in the start codon of the var2csa uORF is an excellent idea and something we had previously done for a different line of investigation. This generates a profound phenotype unrelated to what we are describing in this paper and thus would be uninformative for the current manuscript. This will be described in an independent submission.

Minor comments:Specifically:

1. In Figure 1C, it is not known what the values of the y-axis represent.

This has been corrected.

2. The endogenous control for the qPCR has not been specified (indeed not even in the method section).

qRT-PCR reactions were normalized to seryl-tRNA synthetase (PF3D7_0717700). This is now stated in the Methods section (see line 610).

3. For Figure 2C, importantly, none of the gene ID corresponds to a var gene. It is recommended to double-check all the source data used to generate all the figures.

As described above, all the heatmaps have been restructured, and the gene annotation numbers are now correct and organized according to ups type.

4. For Figure 3B, it is unclear the purpose for this panel. The authors have not seemingly profiled the var transcriptome of this parasite. So it is irrelevant for this manuscript.

We apologize for the confusion. Figure 3B and C display two alternative methods that both disrupted the function of var2csa as a regulator of var gene switching. Indeed, the transcriptomes of parasites derived using both of these methods are analyzed in Figures 4 and 5. We have improved the description in the text to make this clear (see lines 260-271).

5. In Figure 4A, the parasites studied are clones derived from a var2csa knockout population, whereas in Figure 4B, the parasites are claimed to be subclones derived from a clonal parasite (line 355-357). However, since some of the annotations overlap between the figs, it appears that Figure 4B is only an expansion of Figure 4A using the same parasites (at least B10, F11 and G91). However, the pie charts in Figure 4B are utterly confusing, the pie chart for G91 corresponds to the one after 1 year in Figure 4A, whereas for F11 it corresponds to the initial time point, but it resembles none of the timepoints for B10. Overall, better clarification is needed.

We agree that the original notation in the figure was unclear and confusing. As mentioned above, we have restructured the naming scheme for all the clones described in the manuscript. In addition, Figure 4A now separates the analysis for parasites derived from the different methods used to disrupt var2csa.

6. On line 359, please describe what pattern was observed.

We now arrange the gene expression profiles according to ups type rather than hierarchical clustering, therefore this section has been rewritten. We now emphasize that upon disruption of var2csa, the pattern of minor transcripts is more divergent and dispersed over time or when comparing closely related subclones, as quantified in Figure 4C.

7. For Figure 5A, I believe the x-axis should be log2FC rather than logFC, also, the p-value cutoffs were differentially applied between rings and trophozoites stage. Accordingly, the differentially regulated genes in trophozoites stage should be more than 3.

The reviewer is correct and we have corrected the figure as suggested.

8. For fig5D, the time point in the left panel should be labeled as h.p.i rather than being categorical in order to be comparable with the right panels. The panels on the right should have the same range on the y-axis.

We agree with the reviewer that it would be best to have the two figures using comparable time points, however the figures were derived from different previously published datasets, and thus we are unable to convert the data. We have now separated the analysis into two separate panels to avoid confusion.

9. For fig5E, it is much more appropriate to use TPM than CPM (as in fig4F). Since different genes have different length, CPM does not normalize for such difference.

We agree with the reviewer and have corrected the figure as suggested.

10. Fig5F intends to show single-cells that express multiple var genes have lower overall var transcription than cells with dominant var expression. It is therefore more meaningful to compute total var genes abundance on the y-axis. Furthermore, it is unclear what the value actually represents on the y-axis.

At the suggestion of one of the other reviewers, the analysis of the previously published single cell RNAseq data has been removed.

Reviewer #1 (Significance (Required)):

The conception of this study is based on previous observation and the study employed methods that are commonly used in studies of similar line of research. The conclusion made by the authors is fair.

Findings of this study consolidate many previous observations and further the understanding of the enigmatic mechanism that underlies the regulation of var gene family.

Audience:

It will be of interest for community members with lines of research focusing on surface antigens and gene regulation in the parasite. Furthermore, interest can potentially broaden to the community members within malaria research, since var genes encode major virulence factors.

Field of expertise:

Malaria molecular biology, Gene regulation, PfEMP1 regulation.

Reviewer #2 (Evidence, reproducibility and clarity (Required)):

In this study, Zhang and colleagues investigate the pattern of antigenic switching in the human malaria parasite Plasmodium falciparum. Antigenic switching between members of the var gene family as the main mechanism of immune evasion allows the parasite to maintain long infectious periods. However, the relatively limited repertoire of var genes requires some form of organisation to prevent premature exposure to the immune system. In a previous study based on in vitro data and mathematical modelling, Recker et al. hypothesised a non-random switching network involving an expansion and contraction of var transcript diversity, with some variants acting as a source and others as a sink for diversity. Using long-term cultured P. falciparum parasite lines, Zhang and colleague provide experimental evidence for the hypothesised switching network and further elucidate var2csa as playing a central role in var gene switching.

Overall, this is a well written manuscript with results presented in a very clear fashion and following a logical structure. The amount of work that must have gone into this is also evident and admirable. My main comments are relatively minor:

- l74: it would be nice to provide some reference for repeated waves of (in vivo) parasitaemias being dominated by single or just a few variants

We agree and have added appropriate references to this paragraph (see line 75 and references 19-21).

- l74-76: could mention that previous modelling studies have shown that structured switching is not strictly necessary (although appear to be optimal in semi-immune hosts)

We have modified this description as suggested by the reviewer (see lines 75-78).

- l77: there seems to be some evidence for cell-to-cell communication in P. falciparum (Regev-Rudzki et al., 2013); although whether this could influence var gene transcription / switching is not clear.

We agree and have added appropriate references to this paragraph (see lines 78-80 and references 25 and 26).

- l78 / general: what I was missing was more of a discussion of how results presented here align with observed in vivo switch hierarchies; that is, genetic switching might just be one side of the coin, with immune selection possibly playing another important role

We agree with the reviewer that any discussion of expression patterns in vivo must consider immune selection. We have now added a paragraph to discuss this topic to the Discussion section (see lines 505-517).

- l179 onwards: would it be possible to provide some information on the types of var genes being activated in either the 'single' or many 'state' (e.g. ups-type, chromosomal position); there has been previous work proposing switch rate differences and how these relate to var type, can this also be observed here?

As described in our responses to Reviewer 1, we have modified the figures that display var activation patterns to include ups-type (see annotation of ups type in the clones shown in Figure 1D, for example), and all the heatmaps now have a uniform arrangement of genes arranged by ups-type. This enables the reader to consider the characteristics mentioned by the reviewer.

- figure 4f: could these be put on the same scale?

We considered this, and recreated the graphs with a single scale, however the white space became quite large and we prefer the reduced scale to give the reader the most resolution of the data.

- figure 4 / 5 / general: it would be good to better differentiate the var2csa WT single and many lines to make it easier to see / understand that differences are also apparent in the wild-type lines (even though these will be smaller than for the var2csa-deleted ones).

We agree with the reviewer that the differences between wildtype singles and manys should be similar to the differences we observe between the var2csa mutant lines, albeit smaller. At the request of the reviewer, we now separate the wildtype “singles” and “manys” in Figure 5F. As predicted, this analysis shows the wildtype lines do in fact display intermediate levels of gene expression, consistent with a shift in cell cycle progression. We thank the reviewer for this excellent suggestion and agree that this is likely to make it easier for readers to understand this concept.

- l380: please clarify whether this implies that switch rates are variable / change over time, rather than being some fixed properties of different var genes, as previously proposed. Or is this with reference with on-switches, which would depend on previously expressed genes.

In this sentence, we were specifically referring to on-rates, rather than overall switch rates. We have modified the sentence to make this clear (see line 326).

Reviewer #2 (Significance (Required)):

The authors provide seemingly robust evidence for both structured var gene switching in P. falciparum and the central role that var2csa plays in this process. Given that antigenic variation is paramount for immune evasion and acquired immunity and further influences malaria pathology, deepening our understanding of the molecular mechanisms underlying this process is highly important and should be of broad interest to a wide range of researchers.

Reviewer #3 (Evidence, reproducibility and clarity (Required)):

Zhang et al. aimed to gain further insight into the long-standing question of the mechanism of var gene switching in the malaria parasite Plasmodium falciparum. To this end, the authors first generated series of clonal parasite lines and report two different var gene expression states, "single" and "many", and were able to show that these additionally differ in the total amount of var transcripts. While this approach is not very innovative and has been used previously to study var gene expression patterns of P. falciparum isolates in vitro (e.g., also by the authors themselves Frank et al. 2007), the proposed two different states associated with differences in overall levels of var gene expression are novel and interesting. They linked this observation to a previously proposed model (Recker et al. 2011) based on in vitro var gene expression data of clonal lines, which implies a non-random, highly structured switch pathway in which an originally dominant transcript switches through a series of intermediates to either a new variant or back to the original. This so-called single-many-single pathway also applies to the in-host situation, in which an optimized switching network with sink and source nodes would allow the parasite to maintain and re-establish infections in humans. Because a previous publication by the authors suggests that var2csa may play a role in coordinating this var gene switching network, the authors used reverse genetics to render the var2csa locus inactive and examined its effects on var gene expression and switching. They demonstrated that (i) the var2csa locus is not required for gene expression or activation of other var gene variants, (ii) var2csa may be involved in var gene switching, as clonal var2csa KO lines show a remarkably stable var gene expression pattern over long in vitro culture periods, and (iii) var2csa KO lines show a shift in cell cycle progression estimated from RNAseq expression profiles. In addition, they analyzed a dataset from the malaria cell atlas (Howitt et al. 2019) to investigate whether the "single" and "many" states are also found at the single cell level, which would challenge the mechanism of mutually exclusive var gene expression. According to their analysis, in 15% of ring-stage parasites in which var expression was detected, reads were assigned to two different variants, suggesting that individual cells were in the "many" state, these also had reduced var expression, and that var gene expression is not always mutually exclusive.

Major comments:

(i) Clonal parasite lines show either "single" or "many" var gene expression profiles and can alternate between these two states.

This data point is convincing because the authors analyzed many clonal cell lines (how many in total throughout the manuscript?)

We have added an additional dataset to Figure 1 which incorporates data from a large number of wildtype subclones. Figure 1D has been greatly expanded to include 41 closely related, clonal lines, and data included in a new Figure 1E includes data from a total of 74 lines.

Showing the existence of both states and the transition between them in the 3D7 parasite line used. However, why do the authors show only a single example of each state in Figure 1 without indicating how many clonal cell lines were made in total and how many clonal lines exhibited each state?

Figure 1 was intentionally kept simple to illustrate that the single and many states are reversible. However, given the reviewer’s comments, we have now expanded Figure 1D to show a larger set of wildtype subclones through multiple “generations”. We have also added quantification of the number of subclones displaying each phenotype and the level of var gene expression in the lines displaying either the “single” or “many” expression profile (Figure 1E).

The accompanying data on the difference in total var gene expression between the two stages is interesting, but needs further support from analysis of more clonal WT lines at the RNA and protein levels (biological replicates), which in turn would allow statistical analysis of more data points. And do the authors have any idea how long these states last?

We have added analysis of additional recently subcloned populations to figure 1D and E, including statistical analysis. We also analyzed several clones by RNA-seq in Figure 4F, and the trend is quite clear. Regarding how long these states last, this is shown in Figure 3A for wildtype parasites and in Figure 4A for var2csa deletion lines.

Also, it would be good to know if these states can be observed in other P. falciparum isolates or if this phenomenon is restricted to 3D7.

Most of the experiments described in the manuscript were performed in 3D7 due to the availability of tools to easily, rapidly and quantitatively examine the full var repertoire. In the absence of these tools, it is difficult to use the same approach in alternative isolates. However, Recker et al. also observed the single and many states in IT, a different genetic background, and found the pattern to be comparable to what they observed in NF54 and 3D7 (ref 22). This is where the concept of “single” and “many” comes from. We now explain more clearly that we are applying an optimized qRT-PCR method in 3D7 to investigate an observation originally made in IT (see lines 127-133). However, to ensure that our observations are not a result of exceptionally long-term culture of 3D7, we obtained a stock of NF54 (the original isolate from which 3D7 was derived) that has been cultured for many fewer generations and that maintains many wildtype qualities (knobs, sexual differentiation, etc). Cloning of this culture also yielded “single” and “many” lines with similar characteristics and frequency as our original experiments using 3D7. We now include these data in Supplementary Figure 1. We also now mention that two other labs have similarly observed dramatic changes in var expression levels and heterogeneity in both NF54 and IT (references 29 and 30), indicating that this phenomenon is not specific to our 3D7 line (see lines 151-157).

(ii) var2csa is the main "sink node" and required for var gene switching.

The observation that many cell lines tend to express var2csa over time during in vitro culturing is well known, but also nicely illustrated in the data given here. However, as the authors also note, activation of var2csa would have to be unstable to meet the requirements of a sink node that allows the parasite to re-enter the "many" state and switch to another var variant. In contrast, however, var2csa expression in vitro appears to be quite stable, as also shown by the data in Figure 3A. Thus, it remains unclear how this could be achieved, and the authors only speculate that the "unique structure, including the presence of an upstream open reading frame and an untranslated mRNA" could lead to a switch to another variant. Do they think that in this intermediate state var2csa is not translated into a protein? And is the switching network from Recker et al. still working with a single dominant sink node or does it require multiple ones? Mechanistically, the switching of many parasites to var2csa expression might also be a consequence of the combination of a strong promoter that effectively maintains a euchromatin state (i.e., high levels of more stable H2Az/H2Bz nucleosomes that counteract heterochromatin) and frequent positioning within a locus that is poorly able to nucleate heterochromatin at that site (e.g., left chromosome 12). Consequently, when the subtelomeric sequences of var2csa are exchanged for those even less capable of propagating heterochromatin, its switching properties change and it dominates the transcriptome (shown in Duffy et al., 2009 and 2016). However, when the var2csa promoter is knocked out, parasites do not revert to normal switching with the next "strongest" var promoter, with the "weakest" neighboring heterochromatin nucleation taking over as the "switching" hub, so var2csa activation does indeed appear to be required for frequent var gene switching. The effects of other sequences in the vicinity of var2csa were not examined in this study, but it would be interesting to see what happens if the coding region of var2csa is replaced by another var gene variant, the var2csa promoter is replaced by a weak promoter (e.g., of var3 variants), or if only the TSS is mutated. Similar to the experiments of Duffy et al., did the authors try to enrich their clonal lines on a particular var gene (e.g., on ICAM-1 binding) to see if this still worked?

The reviewer mentions many clever experiments and hypotheses for further deciphering the mechanism by which var2csa serves as a node in the switching network. Many ideas mentioned here we have also considered and are designing experiments to test, although incorporating all of them into the current manuscript is not possible given time and space constraints. The concept of promoter competition, with var2csa being a strong promoter, is now described in the 2nd paragraph of the Discussion section, and we added a discussion of the Duffy et papers from 2009 and 2016 (see lines 458-461). We did not enrich our populations for activation of specific var genes, however we noticed no differences when we examined populations expressing different dominant var genes.

(iii) Differences in the ring stage transcriptome explained by shift in cell cycle progression of "single" vs "many" parasites.

Unfortunately, the rather short section on material and methods does not allow any conclusions to be drawn about how the synchronization of the parasite lines was actually performed. Since a number of different cell lines were used, the authors should explain how they ensured that they analyzed all lines at the same time point, i.e. at the same hour after invasion. Thus, it is not entirely clear whether the authors observed an altered transcriptional profile that can only be explained by the altered duration of the ring stage, or whether this observed difference in ring stage progression resulted in a generally different duration of IDC (do parasites emerge earlier in "many" stages than in "single" stages?). And can this be explained by the cost of investment in var mRNA and PfEMP1 protein?

We have greatly expanded the methods section to provide details into how we synchronized our parasite cultures to ensure that all were entering the replicative cycle simultaneously (see lines 589-598). We performed the experiments in the replication cycle immediately after synchronization, thus the differences in gene expression reflect how rapidly the ring stages progress, rather than the populations becoming out of sync with one another over time. We also find that the overall cycle progression is similar in all lines, which is also reflected by the timing of DNA replication (Figure 5G) and in the overall growth rates of the parasites (Supplementary Figure 2). These data suggest that the more rapid progression through the early stages of the replicative cycle does not slow parasite replication. The reviewer brings up the question of whether reduced var/PfEMP1 expression might result in faster progression through the cycle (as also mentioned by reviewer 1). While this is an interesting and plausible hypothesis, we don’t detect the expected change in replication rates when comparing “singles” vs “manys” (Supplementary Figure 2). We now describe this in the Discussion section (see lines 482-488).

Although the authors have already used two different approaches to estimate the "age" of parasites from RNAseq data (although the age window shown in figure 5C is very large), they could also use the approach of Tonkin-Hill et al. (2018), recently applied to several datasets, to determine the stage distribution as well as the mean hpi of parasites used for RNAseq analysis (Guillochon et al., 2022; Thomson-Luque et al., 2021; Wichers et al. 2021). In addition, it would be important to generate growth curves for the different cell lines with proper quantification of stages by manual counting or by using other available tools, which would allow to answer the remaining open questions and potentially support their conclusions at the cell biology level.

The reviewer is correct that we could use an additional method to estimate progression of the replicative cycle in each of the lines, although we find this unnecessary. The point we are trying to make in this analysis is that the “manys” progress more rapidly through the ring stage than the “singles” and that this difference explains the differences in the transcriptomes. Exactly at what point in the cycle the samples were obtained is less important. We feel the analysis we have included supports this conclusion well. Importantly, all 11 clonal populations fit this model precisely, providing additional confidence in this conclusion. We have now added growth curves (Supplementary Figure 2) as well as analysis of DNA replication by flow cytometry (Figure 5G) to further define the differences in cell cycle progression.

(iv) Individual parasites can occur in either "many" or "single" states, implying that a single cell can express multiple var gene variants, which in turn implies that the mechanism of mutually exclusive var gene expression is more plastic than previously thought.

Apart from previous reports showing expression of two var genes in a single cell (Joergensen et al., 2010), the re-analysis of the scRNA-seq data by Howick et al. in its current state provides in my opinion no further support for leaky, mutually exclusive transcription due to the technical limitations of the 10x scRNAseq protocol used and could be omitted. Howick et al. used a 3' library prep kit (transcripts are sequenced from the 3' end), var genes are very similar in their 3' end coding for the ATS region, the Illumina reads are quite short (PE-75bp), and sequencing errors that occur could further complicate the correct assignment of reads to individual variants. 10x is also quite noisy and leaky, as indicated by the absence of var gene reads in 1/3 of the cells, and in the remaining cells the median var reads is only 4 (minimum: 1; maximum: 30). It is also already known from other multicopy gene families that RNAseq mapping requires further stringent adjustments to be variant-specific (Wichers et al., 2019). To show convincing support at the single cell level, the authors need to show the mapping of reads to different var gene variants in these 144 cells.

We agree with the reviewer that the data from the Howick paper are not ideal for the analysis we would like to perform. These limitations cannot be overcome with the current dataset, so we have taken the reviewer’s advice and omitted this analysis.

Should the authors qualify some of their claims as preliminary or speculative, or remove them altogether?

The entire section on single cell transcriptomics is rather leaky and preliminary and should be removed or replaced by single cell data optimized for the detection of var gene expression, e.g. by covering the whole transcript.

As mentioned above, we have removed this section.

Overall, several parts from the results should be shortened and/or moved to the introduction or discussion (eg. line 111-122, line 156-164, line 181-193, line 277-287, line 499-507), which would also sharpen the manuscript. The comparisons to the olfactory receptor family in mammals is mentioned several times throughout the MS, instead of discussing the similarities and differences between both systems in a single paragraph.

We have reexamined the text with respect to the reviewer’s suggestions and made many changes. However, with respect to mentions of model systems like the olfactory receptor gene example, we prefer to keep the citations as is, because we think it helps to bring clarity to a very complex concept. Given that many readers are likely to not be experts in the concepts of mutually exclusive expression and transcriptional gene choice, we feel that giving ample examples and repeating them when necessary is helpful.

It remains unclear how var2csa fulfills the function of the most important sink node in the model proposed by Recker et al. since the model contains an entire network with multiple sink (and source) nodes. In terms of robustness and path length, does the model work with only a single dominant sink node? And how is inactivation of the relatively stable expressed var2csa achieved?

These are excellent questions. We would prefer to defer to mathematical modelers to determine how current models could be modified to accommodate a single, dominant sink node. This is not our expertise. How var2csa is inactivated is an active line of research ongoing in our lab. We suspect that the unique structure of the gene, including the uORF and its encoded protein, are likely involved, but this will require extensive additional work beyond the current manuscript to definitively determine.

Would additional experiments be essential to support the claims of the paper? Request additional experiments only where necessary to evaluate the paper as it is, and do not ask authors to open new lines of experimentation.

- Cell biological assays (such as growth curves) should be performed to clarify the observed differences in cell cycle progression (see iii) above.

These have been performed and added to the manuscript (see Supplementary Figure 2) as well as flow cytometry measuring DNA replication (Figure 5G).

- As far as the reviewer understood, the authors investigated the Var gene expression pattern only in the long-standing culture-adapted 3D7 clone derived from the African isolate NF54. To rule out the possibility that the observed patterns are (in part) a consequence of longstanding in vitro culture selection or a specific feature of the 3D7 clone, the experiments to generate subclones with "single" and "many" status in genetically distinct parasite lines should be repeated, which would suggest that the claims of the paper are a general phenomenon of P. falciparum. This would, in my opinion, increase the relevance of the study.

The original identification of the single-many-single (SMS) model was from qRT-PCR and Northern blot data using the genetic isolates IT and 3D7 (Recker, 2011). In our paper, we attempted to verify and further examine this model using a somewhat refined quantitative qRT-PCR method. This employs a specific var primer set originally designed by Salanti et al., 2003 that has been modified and improved as the genome sequence of 3D7 has been updated. This is a unique primer set because it was developed to allow absolute quantification (see similar comments to reviewer 1). Unfortunately, this primer set is only suitable for analysis of 3D7 or NF54. We now explain this more clearly in the manuscript, noting that Recker et al. observed similar “many” and “single” expression patterns in the IT parasite line (see lines 127-135). We also note that Merrick et al. (2015) similarly observed stark differences in var expression levels using independently derived clones of NF54 and 3D7 (see lines 149-152), as did Janes et al. (2011) working with the IT line, indicating that this phenomenon is not unique to the lines we describe. Nonetheless, to ensure that our observations are not a result of exceptionally long-term culture of 3D7, we obtained a stock of NF54 (the original isolate from which 3D7 was derived) that has been cultured for many fewer generations and that maintains many wildtype qualities (knobs, sexual differentiation, etc). Cloning of this culture also yielded “single” and “many” lines with similar characteristics and frequency to our original observations using 3D7. We now include these data in Supplementary Figure 1.

- A limitation of the manuscript in its current form is the exclusive focus on the mRNA transcriptional level and the lack of protein level data. Do the observed differences at the var gene transcriptional level correlate with less PfEMP1 protein at the parasite bulk level? This would allow to determine the effects of "single" and "many" status on PfEMP1 levels and whether var2csa needs to be translated to act as a sink node, thus also providing insight into the mechanism, which would expand the scope of the study and potentially increase its relevance. If this is beyond the scope of this study, the authors should discuss these points in their revised manuscript.

We agree that expanding the study to PfEMP1 expression levels would be an excellent next step, and we intend to pursue these studies in the future. However, the current manuscript is focused on the var transcriptional network, coordination of var gene activation and the identification of var2csa as a potential sink node. In our view, these are important findings independent of protein expression levels. Nonetheless, we have added discussion of PfEMP1 expression to the revised Discussion section (see lines 482-488 and 505-517).

- Panning of var2csa deletion cell lines to a different receptor (e.g. ICAM-1) would clarify whether the cell lines are indeed irreversibly stuck on their previous var gene expression or whether switching with lower frequency still occurs.

The reviewer is correct that panning has the potential to determine if it is possible for var2csa-disrupted parasites to undergo switching, however we already have data indicating that this can occur at a low frequency. For example, in Figure 4 A and B, parasites expressing different var gene profiles can be observed, however as suggested by the reviewer, this appears to occur at a much lower frequency. We have modified the text to make this clear (see lines 295-298).

Are the suggested experiments realistic for the authors? It would help if you could add an estimated cost and time investment for substantial experiments.

While the generation of subclones in genetically distinct parasite lines would require a considerable amount of time (for cultivation), the follow-up experiments themselves are neither technically demanding nor expensive, especially since genetically distinct parasite lines can be easily obtained from public sources (e.g. BEI Resources) or other malaria laboratories. Experiments on PfEMP1 protein levels can most easily be performed using commercially available anti-ATS antibodies. Performing the required cell biological assays should be a relatively quick and feasible experiment.

As mentioned above, the methodology we employed in this study is heavily reliant on the primer set of Salanti et al., which is only suitable for NF54 and 3D7. However, we now describe and cite published work from others that used both the NF54 and IT lines, and which displayed a similar phenomenon (lines 127-135, 151-154 and references 22, 29 and 30), and we have added a similar analysis from the original NF54 isolate that has not been in culture for as many generations as 3D7 (see supplementary Figure 1). We are unaware of any commercially available anti-ATS antibodies, despite trying to find them. Several past publications have described such antibodies, but to date we have been unable to acquire them. We will continue to explore alternative sources for such antibodies, however as mentioned above, we believe our focus on coordination of var gene switching and a description of the central role var2csa plays in the var gene transcriptional network is a significant contribution to our understanding of antigenic variation in malaria parasites. The cell biological assays (growth rate comparisons and cell cycle progression, supplementary Figure 2 and Figure 5G) have been performed as requested.

Are the data and the methods presented in such a way that they can be reproduced?

The method section and some of the legends to the figures would benefit from a more detailed description that includes important details about the experimental setup, the period of in vitro cultivation of the parasites, etc. As mentioned earlier, it is only clear from the figures that the experiments were performed in the 3D7 parasite background. The synchronization procedures used in each experiment are not properly described, which seems particularly important in the context of the observed differences in cell cycle progression, and the origin of parasite lines "A3.B8" and "A3.C10" remains unclear.

We appreciate the reviewer’s comments on these details. We have greatly expanded the methods section and the figure legends to cover all the areas mentioned by the reviewer. We have also changed much of the annotation of the figures to make the experimental design and details clearer.

Are the experiments adequately replicated and statistical analysis adequate?

- The analysis of total var gene expression levels shown in Figure 1C for the two subclones "C3C6" and "C3C2" should be expanded using the already generated var gene expression data of all subclones stratified for the "single" and "many" states to statistically determine whether the observed difference is a general feature of these two states.

At the reviewer’s request, we have added an analysis of these data to Figure 1E and found that the differences are consistent and highly statistically significant. It is also worth noting that a similar analysis was derived from RNA-seq (Figure 4F), which gave a similar conclusion as the qRT-PCR data shown in Figure 1C and E. Thus, we are confident in the conclusions.

- Figure 1B see minor comment below.

Minor comments:

Specific experimental issues that are easily addressable.

- In the first Results section, the authors generated "several clonal parasite lines derived from a single parent population" that four weeks later showed two fundamentally different expression patterns. Figure 1 and the text show only two representative subclones (C3C6 and C3C2), which they claim to have used to verify the single-many-single theory, and which show a much lower overall level of var gene expression in the subclone with many expressed var genes. Since the authors have already produced more subclones, they should provide more replicates to support this. Is it a general feature of all "many" subclones to have lower total var expression (also applies to the data in Figure 2)? How many subclones were actually generated and how many showed which var expression phenotype?

We have added cumulative data from a large number (74) of recently derived subcloned populations to demonstrate that the level of var transcripts observed in distinctly and consistently different. These data are now shown in the greatly expanded clone tree in Figure 1D and in the analysis of total var expression in Figure 1E.

Do RNA expression levels correlate with protein levels?

As mentioned above, we do not currently have the ability to accurately assess protein expression levels but will attempt to do so in the future.

The authors could have used a different cell line to determine if this phenomenon applies to P. falciparum in general.

As mentioned above, the methodology we employed is limited to 3D7 and NF54, however we now cite other studies, including two that observed a similar phenomenon in the IT line (references 22 and 30).

- More details are needed for the experimental procedures:

Only from the figures it is clear that the authors used the 3D7 parasite line for their study, which is not mentioned anywhere else.

Our choice of the 3D7 line is now explained in detail in the first section of the Results (see lines 127-134).

The procedure for obtaining synchronous parasites is insufficiently described with terms such as " highly synchronous cultures containing ring and trophozoite stage parasite were collected" (line 686ff). Is there a "or" missing here? Please describe exactly how you synchronize your parasites before performing qRT-PCR and RNAseq and provide the exact age of the parasites in hpi (+/-hpi). It is also unclear whether the parasite populations were synchronized immediately prior to RNA purification using Percoll/Sorbitol density gradient centrifugation, which at the very least has a massive impact on total RNA amounts and may also lead to variable quantitative qRT-PCR data.

We have added a greatly expanded Methods section to describe in detail how we synchronized our cultures (see lines 589-598). This includes “double synchronization” to obtain very tight synchronization. Importantly, parasites are allowed to recover from the synchronization procedure for 18 or 38 hours prior to RNA extraction, thus enabling the recovery of consistent amounts of RNA.

For qRT-PCR, it is unclear whether the entire run was always performed twice, as indicated by the statement in line 682f: "All qRT-PCR assays were performed at least in duplicates with no apparent differences between runs." It appears that the authors used the cycler (Quant Studio 6 Flex 489 realime PCR machine, Thermo Fisher) in a 96-well format and had to perform two runs per sample to cover all primer pairs in technical duplicates. However, since the cycler is also compatible with 384-well plates, it is not clear how they meet the standard of running all reactions in duplicate or even the recommended triplicate. Therefore, it is also unclear where the error bars in Figure 1B come from, which should be omitted if they come from technical duplicates, how much template was used for each qRT-PCR reaction and whether samples were checked for absence of genomic DNA before qRT-PCR or by using minus RT controls. In addition, the amplification efficiency of each primer pair is missing, skewing the comparison of transcript levels obtained with different primer pairs.

We have added details to the methods section to cover the questions raised by the reviewer. All qRT-PCR reactions were indeed performed in a 384-well format, enabling duplicates or triplicates to be performed together in a single run. We now explain this in detail in the figure legends and methods section (613-615). We have added details regarding controls for the presence of gDNA and how much template as used for each individual reaction (see lines 601-604). The PCR primer set employed here was originally created specifically to ensure similar amplification efficiencies for each primer pair and to enable absolute quantification (see Salanti et al., 2003). It has been used extensively by numerous groups when investigating var gene expression in the 3D7/NF54 genetic background. We have added this to the methods section (see lines 604-608). For Figure 1B, the error bars represent standard deviation from three biological replicates (see legend to Figure 1B).

Some more information should be provided for the RNAseq analysis. What was the actual RIN of the samples used for RNAseq? What library prep kit was used? How was the rRNA removed? How many cycles was the cDNA amplified during library prep, and was a polymerase suitable for high AT samples used? What was the actual fragment size, and were PE150 reads sequenced? What was the sequencing depth (total reads, mapped reads)? For analysis of gene families with multiple copies, mapping parameters may be critical to distinguish between variants (Wichers et al. 2019).

We have added the requested details to the Methods section (see lines 619-648), including an additional Supplementary table (Table S9). The analysis of gene families with multiple copies is not relevant since we omitted the multicopy gene families for the RNAseq analysis described in Figures 4 and 5.

- Please, use the term "rif" for genes and RIFIN for proteins. The used term "rifin" is a confusing combination.

We have corrected the text as requested.

- Figure 2A: Are the five new subclones derived from the same voluminous parasite culture as the first subclones?

As noted in our comments to reviewer 1, we have entirely renamed all the clonal lines to make it easier to determine their relationships to each other. We have also added a significantly larger number of clones to Figure 1D, including the 5 subclones shown in Figure 2A, to show exactly how the different parasite subclonal lines are related.

It is stated that these clonal lines were cultured in parallel for 70 generations and analyzed every 15-20 generations; however, 6 samples were shown for each clonal line, implying that the clones were cultured and analyzed for much longer than "just" 70 generations or were analyzed in shorter time periods. Please clarify and indicate the number of parasite generations at the top of the heatmap.

We have added the specific number of days in culture below each column of the heatmaps in Figures 2A and 4B to make the time of collection clear for each sample.

Hierarchical clustering should be shown on the left side of the heatmap. Is it correct that the gene PF3D7_0412700, which has a Z-score above 0 in all clones and at all time points, is not clustered with the genes showing the same pattern at the top of the heatmap!!!? Again, different groups of genes should be shown or color coded.

As also described in our response to reviewer 1, the heatmaps are no longer organized by hierarchical clustering. The genes are now arranged according to ups type.

Since all clonal lines, "manys" and "singles", show the same pattern of Z-scores, do they still differ in their total var gene expression level?

An extensive analysis of var gene expression levels is now provided in Figure 1E. Indeed, throughout all the clones analyzed (74 clones), the expression level is highly correlated with the many vs single phenotype (p<0.0001).

What is the origin of these other two clonal cell lines (A3.B8 and A3.C10)? There is no information about the origin or at least a reference. How do they know they are genetically identical, have they done whole genome sequencing?

These two clones have now been renamed “clone 4 and clone 5” to indicate that they are simply additional clones of 3D7 that were generated in our lab several years ago and cultured separately. They are thus derived from the same genetic background, but simply separated by time. This is now described in greater detail in the figure legend.

- Figure 2B&C: The term generation is somewhat misleading for the different "generations" of subclones, as it is also used for parasite generations in terms of the number of replication cycles of the parasite.

To avoid confusion, in the figure legend and the text we now refer to “subclone generations” and “replication cycles”. We hope this helps to avoid confusion.

Serial subcloning was performed only for clones in the "single" state, not for clones in the "many" state.

We have added a much more extensive subcloning tree in Figure 1D, including subcloning of both “singles” and “manys”. It is clear from this experiment that either phenotype can be generated from a population that displays the alternative phenotype. It is true that in Figure 2B, each round of subcloning originated from a “single” line, however Figure 2C includes heatmaps from both “singles” and “manys”, with no apparent difference.

How much time is between the actual cloning and the analysis? Please also include the parental 3D7 clone in the heatmap, put var gene group labels next to the IDs and labels for the different subclones so that the reader can easily see which pie chart from B belongs to which row in C.

The cloning process takes approximately 5 weeks from isolation of an individual parasite until a population has expanded sufficiently for the analysis to take place. We have added this to the methods section (see lines 574-577). The heatmaps are now organized according to var type. The rows in the heatmap in Figure 2C are now organized from left to right to match the pie charts in Figure 2B, thus enabling a reader to determine this relationship. We have added a description of this to the figure legend.

- As shown in supplemental Table S11, most of the 144 cells with two expressed var genes also expressed the var2csa variant and additionally another variant that was not mentioned in the manuscript but may be important because var2csa expression in the many-state is not detected as dominant by bulk RNAseq or qRT-PCR.

In response to a previous suggestion from this reviewer, we have deleted the single cell analysis because of the limitations of this dataset.

- The var2csa gene is expressed earlier than other var genes. Could this have an impact on the difference in cell cycle progression observed in the var2csa-deletion clones?

This is an interesting idea. We have no reason to think this might be the case, particularly since var2csa-mutant clones can be either singles or manys, and thus they can progress either rapidly or slowly through the ring stage. Without a better hypothesis, we have chosen not to discuss this idea.

- Which var genes are frequently found in minor transcripts and which in major expression states? Is there a correlation with the var gene group or position on the chromosome?

We have now organized all the heatmaps according to ups type and we don’t detect any correlation. However, these data are now available for readers to consider.

- The data of the cell line with the complete deletion of the telomere end of chromosome 12 shown in Figure 3B are not included in the manuscript, so this scheme and the mention of this cell line can be omitted.

We thank the reviewer for pointing out that we did not clearly describe the different methods for disrupting or deleting var2csa or how parasites derived from each method were analyzed. This is now shown in the revised Figure 4 as well as described in the revised text (see lines 260-271).

Are prior studies referenced appropriately?

- Several parts of the introduction (eg. line 70ff.) that contain general statements about var genes and malaria pathogenesis would benefit from additional references.

We have added numerous references to this section to ensure the reader can easily access the relevant literature.

- Line 255: References for «Consistent with previous observations» seem to be missing.

We have added the appropriate references to this sentence (see line 243).

- The two papers by Duffy et al. (2009, 2016) that deal mechanistically with var2csa activation and control of switching are not mentioned at all, but the effects of the chromatin state of the var2csa locus should be discussed at least briefly.

We cite the Duffy papers in our discussion of var2csa promoter competition (see lines 458-461), where they fit nicely. We thank the reviewer for this suggestion.

- Correlation to in vivo var2csa gene expression data is lacking. For example, var2csa is also known to be expressed in children and males, suggesting a function other than "just" the receptor for CSA in pregnancy-associated malaria (Duffy et al., 2006; Beeson et al., 2007; Rovira-Vallbona et al., 2011). Or, Bachmann et al. (2019) have shown that an increase in var2csa expression parallels a change in var gene expression in a malaria-experienced volunteer infected with NF54.

We have incorporated these ideas and references into the Discussion section (see lines 475-478).

- An entire paragraph in the discussion addresses a case report of a splenectomized patient infected with non-adherent P. falciparum parasites that accordingly did not exhibit VSA expression. It is speculated that this may reflect the condition of "many" parasites with low var gene expression, however, it is rather unlikely that the qualitative approach in the cited study would not have detected these var gene transcripts, as they were also detectable by qPCR in the present study. Furthermore, this VSA-free phenotype can also be observed in other Plasmodium species that infect animals but lack var genes (e.g. Barnwell et al., 1983), suggesting that it may be a more general mechanism. However, this may indeed indicate that var gene expression could be regulated on a broader scale and in response to specific conditions.

This is an interesting point of discussion that we were hoping to stimulate with the paragraph in question. We note that indeed we were able to detect very low levels of transcript by qPCR in our study, however we were using specific primers optimized for the parasite line used in our experiments. In contrast, in the case of the splenectomized patient, the investigators had to use degenerate primers since the genome sequence was not known, which might have reduced sensitivity below the threshold of detection. In addition, the patient is presumed to have extensive anti-PfEMP1 immunity, thus providing a heavy selection pressure against var gene expression, a selection that is missing in our cultures. We now mention the similar example from P. knowlesi and have added the Barnwell reference (see lines 533-536 and the accompanying text).

Are the text and figures clear and accurate?

- Figure 1: The histograms are too small and the transition groups might be placed between the corresponding main groups: A, B/A, B, B/C, C, E. The group D doesn't exist anymore, the var1 gene was included into the main group A (Kraemer et al., 2017 BMC Genomics). Dashed lines between the groups might help to see the classification of the expressed var gene on the first sight. It would also be useful to include the var gene group next to the annotation in the pie chart since on- and off rates might be influenced by the chromosomal location associated with the different var gene groups.

The text of the Figure has been enlarged to make it easier to read. We prefer to keep var1 as group D because this gene is unique amongst group A genes in that it does not recombine with other members of the family and represents an unusual gene that is conserved across species (see Gross et al., 2021). We have added the group designation next to the annotated pie charts as requested.

- Figure 3A: From PFD it not clear if all subclones tend to switch on var2csa over time, since the clones A9 and B6 seems to have different reddish color than the other clones. Since this is a general problem of multicolored pie charts, maybe indicate the percent of var2csa expression next to the corresponding pie?

We have replotted all of the pie charts to adjust the colors so that the red color that represents var2csa is conserved throughout the manuscript. Only var2csa is represented by red.

- Figure 4: The data shown in the different subpanels are not from the same clonal lines, which is not explicitly mentioned in the text. In addition, the data from the clonal lines should always be presented in the same clonal order.

To overcome the confusion from our original naming of the various clonal lines throughout the manuscript, we have renamed all clones in a systematic fashion. This also applies to the clones shown in Figure 4. This figure has also been reorganized to some extent for greater clarity.

Do you have suggestions that would help the authors improve the presentation of their data and conclusions?

Figures would benefit from a more detailed labelling of the var gene groups, the time of cultivation of the different clonal lines and by showing the hierarchical clustering of var genes. Dominantly expressed variants should be clearly labelled in the pie charts.

As requested, we have added labeling of each var group and we indicate the dominantly expressed gene for each pie chart. We have also added the time of cultivation to each heatmap.

Reviewer #3 (Significance (Required)):

Describe the nature and significance of the advance (e.g. conceptual, technical, clinical) for the field.

Zhang et al. aimed to gain further insight into the long-standing question of the mechanism of var gene switching in the malaria parasite Plasmodium falciparum, and they are to be credited for tackling this important but experimentally difficult question. To this end, they sought to experimentally confirm earlier predictions of the var gene switching modeling studies of Recker at al. If successful, this would be a significant advance in the field. However, the reviewer is concerned that the manuscript in its present form provides data that, although partially consistent with the predicted models, are insufficient to be considered experimental proof of concept. Nevertheless, this study is not only of great interest to malaria researchers, but may also contribute to the understanding of similar mechanisms in other organisms. In addition, disruption of var gene expression and parasite antigenic variation may be a future target for intervention.

Parasitologists, researchers working on host-parasite interactions or interested in gene regulation mechanisms might be interested in the reported findings.

I'm working in the field of parasitology, malaria, var genes, but I'm not an expert in mathematical modeling.

[Editors' note: further revisions were suggested prior to acceptance, as described below.]

Recommendations for authors

1. For many clonal lineages, only pie charts are provided for visual inspection and categorization into 'single' or 'many'. However, this also appears to be largely dependent on overall var gene expression, as in Figure S1A, subclone NF54-5 has dominant expression of a single variant and low overall var gene expression and was therefore classified as 'many'. The authors should provide expression levels as displayed in Figure 1C for all subclones analyzed in the study. These graphs could be displayed next to the corresponding pie chart, or as supplemental figures.

Importantly, an unbiased approach to categorizing parasites into different states would be desirable. Perhaps the combination of a diversity index and total var gene expression could provide sufficient discrimination.

To address this suggestion, as well as comment 4D below, we have assembled a complete clone tree that includes all 74 lines derived from the subcloning experiments. This is quite large and perhaps a bit cumbersome to view, therefore we have included it as Figure 1—figure supplement 1. To make this large tree easier to understand, we modified the numbering scheme slightly. Two clones that were not derived from the subcloning experiments but were used for comparison in Figure 2A are also displayed here. We prefer to keep the smaller clone trees in the main manuscript (Figures 1D and 2B) where they are easier to follow and illustrate specific points. We included stacked graphs of total var expression for each clone in the clone tree in Figure 1—figure supplement 1 as requested.

The question of how to systematically categorize a subcloned population as either “single” or “many” is both challenging and somewhat arbitrary, as the reviewer correctly points out. We believe that no population is entirely “single” or “many”, but rather is a mix dominated by parasites in one or the other state. To test whether “single” vs “many” populations have different total var transcript levels as we do in Figure 1E, it is important that we not include transcript levels in the definition. Therefore, we now categorize populations in which more than 50% of the total var transcript is derived from 1 or 2 var genes as being “single” while populations with more diverse expression patterns are considered “many”. This stricter, unbiased definition resulted in only changing the classification of one population in the complete clone tree shown in Figure 1—figure supplement 1 (out of 74). We also changed the classification of the population specifically mentioned by the reviewer, NF54-5 in Figure 1—figure supplement 2. This population barely meets the definition of a “single” and has a correspondingly low transcript level. We now explicitly explain our methodology and our interpretation of the results on lines 172-182 and 192-198 of the main text.

2. The transcriptomics data reveal that "manys" progress through the first half of the replicative cycle faster, yet the "singles" catch up in the second half, and thus both populations have equivalent replication cycle lengths. The authors should discuss further why 'many' parasites have no growth advantage over several parasite generations, despite faster ring stage progression. Do the 'single' parasites catch up with this lag later? Giemsa smears, in addition to growth curves, would be useful to better document progression through the IDC of 'single' versus 'many' parasites.

Indeed the “singles” catch up with the “manys” and replicate at the same overall rate. This is reflected in three sets of data: (1) the RNAseq data (Figure 5A) show that at the trophozoite stage, there is very little difference in gene expression (compared to the substantial changes observed in the ring stages), indicating that the two populations are at nearly identical points in the replicative cycle, (2) analysis by flow cytometry (Figure 5G) shows that there is no detectable difference in DNA content between “singles” and “manys” (a reflection of nuclear replication), thus overall progression of the replicative cycle in not discernably different, and (3) the overall replication rate is not different when comparing the different populations (Figure 5—figure supplementary 1). We now make this point more clearly on lines 472-477. We could add Giemsa-stained smears, however we feel that the data we’ve already included are more quantitative and less subjective than smears and thus smears would not add to the manuscript.

3. The authors should discuss how the switch model proposed by Recker et al. could work with only a single dominant sink node that is barely inactivated during the cultivation of the parasites in vitro. In fact, what about the PF3D7_0421100 gene, which is also frequently activated and stably expressed in many subclones in different generations (Figure 2B)? Could this also be a sink node?

As mentioned previously, we are not mathematical modelers and would prefer to leave detailed discussions or the derivation of a new mathematical model to researchers who specialize in this methodology. We focused this manuscript on var2csa for the reasons detailed in the text, however we agree with the reviewer that it is possible that not all var genes are created equal. We have added to the discussion the possibility that other genes (and we specifically mention Pf3D7_0421100) could similarly serve as nodes in a hypothetical network (see lines 526-531). We thank the reviewer for this suggestion.

4. Reviewers appreciated that the authors have made an effort to improve the readability and presentation of the data. However, they also noted that there is still room for improvement.

a) The labeling of the heatmaps and bar graphs is not consistent with respect to the order of var genes and the var groups are labeled twice in the heatmaps (largely on the left side and after each gene).

The labeling of the heatmaps have been modified to remove the redundancy of the var types, as suggested by the reviewer. We have also changed the order of the genes in the figures so that they all match.

b) There are some inconsistencies: cultivation days for the same clonal lines are not identical in Figures 2A and 3A;

We thank the reviewer for examining the figures so closely. There was indeed an error in assembling Figure 2A. We have corrected the time points and it is now clear that the times correlate between Figures 2A and 3A, although more time points are included in Figure 2. A later timepoint was included for clone 6 in Figure 3A because this more clearly shows convergence to var2csa expression. We now note that the time to convergence to var2csa is variable (see line 277), but all populations eventually express var2csa.

clonal line V2dis2 is classified as "many" in Figure 4A but as "single" in Figures 4E and F.

Once again, we thank the reviewer for catching this error. We now recognize that the population originally included in this figure (similar to the NF54 population discussed in response to point 1 above) was a poor choice given its initial expression profile, leading to confusion and mislabeling. To avoid confusion, we have replaced this population with an equivalent subclone in Figures 4A, 4E and 4F. This population was originally labeled V2dis3 and was included in the analysis in Figures 4E and 4F. We have now relabeled this as V2dis2 and show the pie chart for its var expression profile in Figure 4A. The population originally shown in Figure 4A is now labeled V2dis3 and is included in the analysis in Figures 4E and F. As expected, this population is the least polarized of the var2csa-mutant populations analyzed, although its var expression profile, as determined from RNA-seq, indicates it qualifies as a “single”.

c) Why do the authors not show var2csa expression in the wild-type heat maps, but in the pie charts?

The heat maps are designed to display the minor transcripts or “background” var expression pattern that we hypothesize might reflect switching biases. The heatmaps are presented so that readers can observe shifting patterns in the minor transcripts over time (Figure 2A) and when comparing closely related subclones (Figure 2C). var2csa is unique since it becomes activated in essentially all subcloned populations, thus we don’t consider it a “minor” transcript and it does not contribute to the purpose of these heatmaps. We now explain this in the text (see lines 228-230). We do indeed present expression data on var2csa, however we present it separately (see Figure 3A).

d) The phylogenetic trees of clones and subclones are partly redundant, but an overview including all clonal lineages, e.g. also clones 1, 2, 4, and 5, is still missing (could be included as a Supplemental figure).

As requested, we now present a complete tree with all related subclones in Figure 1—figure supplement 1.

e) Var1 should not be labeled as group D, which has been shown not to exist. The authors also do not explicitly designate var3 type genes, and the reviewers suggest including var1 and var3 in group A and more accurately labeling them var1 and var3 variants.

As requested, we now explicitly label var1 and the var3 variants, and include them as a subset of the group A var genes in Figures 1, 2, and 4.

f) The similarity of the minor transcripts between Figure 2A and C is difficult to judge from the heat maps. Why did the authors not include the subclones from Figure 2C in the Bray-Curtis dissimilarity analysis shown in Figures 4C and D?

The point of Figures 4C and D is to examine the differences between wildtype and var2csa-mutant lines, specifically by comparing how expression patterns shift over time. The data displayed in Figure 2C, while similar, does not reflect how the var pattern shifts within a population overtime, but rather how it shifts as populations go through the sequential bottlenecks of repeated subcloning. The analysis in Figures 4C and D thus reflects directly comparable experiments, while the data shown in Figure 2C is from a different experimental design. We now explain the nature of this comparison on lines 356-357. We are concerned that incorporating the additional, somewhat different experiment could be misleading. Further, adding another 5 sets of data points (44 additional dots) could obscure the message that we are trying to relate. We have therefore decided to leave the figure unchanged.

5. After disruption of the var2csa promoter, do the authors still see var2csa expression, or can they confirm its absence?

We checked for var2csa expression after disruption of the promoter using both Q-RT-PCR and RNA-seq and failed to detect any var2csa transcripts. We have added this confirmation to the text of the manuscript (see lines 303-305).

https://doi.org/10.7554/eLife.83840.sa2

Article and author information

Author details

  1. Xu Zhang

    Department of Microbiology and Immunology, Weill Cornell Medical College, New York, United States
    Contribution
    Conceptualization, Data curation, Formal analysis, Investigation, Methodology, Writing – original draft, Writing – review and editing
    Competing interests
    No competing interests declared
  2. Francesca Florini

    Department of Microbiology and Immunology, Weill Cornell Medical College, New York, United States
    Contribution
    Data curation, Formal analysis, Funding acquisition, Investigation, Methodology, Writing – review and editing
    Competing interests
    No competing interests declared
    ORCID icon "This ORCID iD identifies the author of this article:" 0000-0003-2579-3820
  3. Joseph E Visone

    Department of Microbiology and Immunology, Weill Cornell Medical College, New York, United States
    Contribution
    Data curation, Formal analysis, Investigation, Methodology, Writing – review and editing
    Competing interests
    No competing interests declared
  4. Irina Lionardi

    Jill Roberts Center for Inflammatory Bowel Disease, Weill Cornell Medical College, New York, United States
    Contribution
    Formal analysis, Writing – review and editing
    Competing interests
    No competing interests declared
  5. Mackensie R Gross

    Department of Microbiology and Immunology, Weill Cornell Medical College, New York, United States
    Contribution
    Data curation, Methodology
    Competing interests
    No competing interests declared
  6. Valay Patel

    Department of Microbiology and Immunology, Weill Cornell Medical College, New York, United States
    Contribution
    Data curation
    Competing interests
    No competing interests declared
  7. Kirk W Deitsch

    Department of Microbiology and Immunology, Weill Cornell Medical College, New York, United States
    Contribution
    Conceptualization, Data curation, Formal analysis, Supervision, Funding acquisition, Validation, Investigation, Methodology, Writing – original draft, Project administration, Writing – review and editing
    For correspondence
    kwd2001@med.cornell.edu
    Competing interests
    No competing interests declared
    ORCID icon "This ORCID iD identifies the author of this article:" 0000-0002-9183-2480

Funding

National Institute of Allergy and Infectious Diseases (AI 52390)

  • Kirk W Deitsch

National Institute of Allergy and Infectious Diseases (AI99327)

  • Kirk W Deitsch

National Institutes of Health (T32GM008539)

  • Joseph E Visone

Swiss National Science Foundation (P2BEP3_191777)

  • Francesca Florini

National Institutes of Health (F31AI164897)

  • Joseph E Visone

The funders had no role in study design, data collection, and interpretation, or the decision to submit the work for publication.

Acknowledgements

The Department of Microbiology and Immunology at Weill Medical College of Cornell University acknowledges the support of the William Randolph Hearst Foundation. This work was supported by grants AI 52390 and AI99327 from the National Institutes of Health to KWD. JEV was supported by training grant T32GM008539 from the National Institutes of Health to Weill Cornell Graduate School of Biomedical Sciences and by fellowship number F31AI164897 from the National Institutes of Health. FF received support from Early Postdoc Mobility grant P2BEP3_191777 from the Swiss National Science Foundation. KWD is a Stavros S Niarchos Scholar and a recipient of a William Randolf Hearst Endowed Faculty Fellowship. The funders had no role in the study design, data collection and analysis, decision to publish, or preparation of the manuscript.

Senior Editor

  1. Dominique Soldati-Favre, University of Geneva, Switzerland

Reviewing Editor

  1. Olivier Silvie, Sorbonne Université, UPMC Univ Paris 06, INSERM, CNRS, France

Version history

  1. Preprint posted: September 30, 2022 (view preprint)
  2. Received: September 30, 2022
  3. Accepted: December 13, 2022
  4. Accepted Manuscript published: December 14, 2022 (version 1)
  5. Version of Record published: January 11, 2023 (version 2)

Copyright

© 2022, Zhang et al.

This article is distributed under the terms of the Creative Commons Attribution License, which permits unrestricted use and redistribution provided that the original author and source are credited.

Metrics

  • 1,075
    Page views
  • 188
    Downloads
  • 2
    Citations

Article citation count generated by polling the highest count across the following sources: PubMed Central, Crossref, Scopus.

Download links

A two-part list of links to download the article, or parts of the article, in various formats.

Downloads (link to download the article as PDF)

Open citations (links to open the citations from this article in various online reference manager services)

Cite this article (links to download the citations from this article in formats compatible with various reference manager tools)

  1. Xu Zhang
  2. Francesca Florini
  3. Joseph E Visone
  4. Irina Lionardi
  5. Mackensie R Gross
  6. Valay Patel
  7. Kirk W Deitsch
(2022)
A coordinated transcriptional switching network mediates antigenic variation of human malaria parasites
eLife 11:e83840.
https://doi.org/10.7554/eLife.83840

Further reading

    1. Cell Biology
    2. Microbiology and Infectious Disease
    Heledd Davies, Hugo Belda ... Moritz Treeck
    Tools and Resources

    Reverse genetics is key to understanding protein function, but the mechanistic connection between a gene of interest and the observed phenotype is not always clear. Here we describe the use of proximity labeling using TurboID and site-specific quantification of biotinylated peptides to measure changes to the local protein environment of selected targets upon perturbation. We apply this technique, which we call PerTurboID, to understand how the P. falciparum exported kinase, FIKK4.1, regulates the function of the major virulence factor of the malaria causing parasite, PfEMP1. We generated independent TurboID fusions of 2 proteins that are predicted substrates of FIKK4.1 in a FIKK4.1 conditional KO parasite line. Comparing the abundance of site-specific biotinylated peptides between wildtype and kinase deletion lines reveals the differential accessibility of proteins to biotinylation, indicating changes to localization, protein-protein interactions, or protein structure which are mediated by FIKK4.1 activity. We further show that FIKK4.1 is likely the only FIKK kinase that controls surface levels of PfEMP1, but not other surface antigens, on the infected red blood cell under standard culture conditions. We believe PerTurboID is broadly applicable to study the impact of genetic or environmental perturbation on a selected cellular niche.

    1. Microbiology and Infectious Disease
    Rita M Meganck, Deanna Zhu ... Longping V Tse
    Short Report

    A hallmark of dengue virus (DENV) pathogenesis is the potential for antibody-dependent enhancement, which is associated with deadly DENV secondary infection, complicates the identification of correlates of protection, and negatively impacts the safety and efficacy of DENV vaccines. Antibody-dependent enhancement is linked to antibodies targeting the fusion loop (FL) motif of the envelope protein, which is completely conserved in mosquito-borne flaviviruses and required for viral entry and fusion. In the current study, we utilized saturation mutagenesis and directed evolution to engineer a functional variant with a mutated FL (D2-FL), which is not neutralized by FL-targeting monoclonal antibodies. The FL mutations were combined with our previously evolved prM cleavage site to create a mature version of D2-FL (D2-FLM), which evades both prM- and FL-Abs but retains sensitivity to other type-specific and quaternary cross-reactive (CR) Abs. CR serum from heterotypic (DENV4)-infected non-human primates (NHP) showed lower neutralization titers against D2-FL and D2-FLM than isogenic wildtype DENV2 while similar neutralization titers were observed in serum from homotypic (DENV2)-infected NHP. We propose D2-FL and D2-FLM as valuable tools to delineate CR Ab subtypes in serum as well as an exciting platform for safer live-attenuated DENV vaccines suitable for naïve individuals and children.