Dysregulated Ca2+ signaling, fluid secretion, and mitochondrial function in a mouse model of early Sjögren’s disease
- Department of Pharmacology and Physiology, University of Rochester, United States
- Arthritis and Clinical Immunology, Oklahoma Medical Research Foundation, United States
eLife assessment
This manuscript presents important observations on the early changes that occur in calcium signaling, TMEM16a channel activation, and mitochondrial dysfunction in salivary gland cells in a murine model of autoimmune Sjögren's disease. The study reports that in response to DMXAA treatment which induces a murine model of Sjögren's disease, salivary gland cells show significant changes in saliva release, calcium signaling, TMEM16a activation, mitochondrial function, and sub-cellular morphology of the endoplasmic reticulum. The work is compelling and will be of strong interest to physiologists working on secretion, calcium signaling, and mitochondria.
https://doi.org/10.7554/eLife.97069.3.sa0Significance of the findings:
Important: Findings that have theoretical or practical implications beyond a single subfield
- Landmark
- Fundamental
- Important
- Valuable
- Useful
Strength of evidence:
Compelling: Evidence that features methods, data and analyses more rigorous than the current state-of-the-art
- Exceptional
- Compelling
- Convincing
- Solid
- Incomplete
- Inadequate
During the peer-review process the editor and reviewers write an eLife Assessment that summarises the significance of the findings reported in the article (on a scale ranging from landmark to useful) and the strength of the evidence (on a scale ranging from exceptional to inadequate). Learn more about eLife Assessments
Abstract
The molecular mechanisms leading to saliva secretion are largely established, but factors that underlie secretory hypofunction, specifically related to the autoimmune disease Sjögren’s syndrome (SS) are not fully understood. A major conundrum is the lack of association between the severity of salivary gland immune cell infiltration and glandular hypofunction. SS-like disease was induced by treatment with DMXAA, a small molecule agonist of murine STING. We have previously shown that the extent of salivary secretion is correlated with the magnitude of intracellular Ca2+ signals (Takano et al., 2021). Contrary to our expectations, despite a significant reduction in fluid secretion, neural stimulation resulted in enhanced Ca2+ signals with altered spatiotemporal characteristics in vivo. Muscarinic stimulation resulted in reduced activation of the Ca2+-activated Cl- channel, TMEM16a, although there were no changes in channel abundance or absolute sensitivity to Ca2+. Super-resolution microscopy revealed a disruption in the colocalization of Inositol 1,4,5-trisphosphate receptor Ca2+ release channels with TMEM16a, and channel activation was reduced when intracellular Ca2+ buffering was increased. These data indicate altered local peripheral coupling between the channels. Appropriate Ca2+ signaling is also pivotal for mitochondrial morphology and bioenergetics. Disrupted mitochondrial morphology and reduced oxygen consumption rate were observed in DMXAA-treated animals. In summary, early in SS disease, dysregulated Ca2+ signals lead to decreased fluid secretion and disrupted mitochondrial function contributing to salivary gland hypofunction.
Introduction
Saliva plays crucial roles in oral health, including lubricating the mouth, maintaining pH balance, defense against microorganisms, aiding taste, and initiating digestion of macronutrients (Humphrey and Williamson, 2001; Carpenter, 2013; Pedersen et al., 2018). Saliva is produced primarily by three major salivary glands; the submandibular gland (SMG), parotid gland (PG), sublingual gland (SLG), and some minor glands in the lower lip, tongue, and cheek. Saliva is generated in secretory acinar cells, with its content adjusted by ducts before reaching the mouth. The acinar cells are fundamental to the production of the primary salivary secretion (de Paula et al., 2017). The fluid secretion process is driven by the trans-epithelial movement of Cl- across acinar cells. To accomplish vectorial movement of Cl-, acinar cells are polarized such that the basolateral plasma membrane (PM) faces the interstitium and is adjacent to blood vessels, while the apical PM forms a lumen with the distinct PM regions physically segregated by tight-junctional complexes. At the basolateral PM, Cl- is transported into the acinar cell cytoplasm against their electrochemical gradient via the Na+/K+/2Cl- cotransporter, (NKCC1). Following mastication or the experience of the taste and the smell of food, the neurotransmitter, acetylcholine (ACh) is released from parasympathetic nerves and acts on muscarinic receptors on the basolateral PM. Activated muscarinic receptors promote the production of inositol 1,4,5 trisphosphate (IP3), and subsequently Ca2+ release from endoplasmic reticulum (ER) stores via IP3 receptors (IP3Rs) situated in the ER in the extreme apical aspects of the cell (Futatsugi et al., 2005; Lee et al., 1997; Pages et al., 2019). Elevated [Ca2+]i activates a Ca2+-activated Cl- channel named TMEM16a that allows Cl- to move through the apical PM to the ductal lumen which is continuous with the salivary intercalated duct (Pedersen et al., 2018; Melvin et al., 2005). In turn, Na+ moves through the paracellular space to balance the Cl- and water follows osmotically both paracellularly and through the water channel aquaporin5 (AQP5) to generate the primary saliva (Melvin et al., 2005).
The importance of saliva is underappreciated in the absence of hypofunction. Reduced salivary secretion is termed xerostomia and can result from the iatrogenic effects of drugs, as collateral damage to salivary glands following radiotherapy for malignancy in the head and neck area, and commonly in SS (Saleh et al., 2015). SS is a chronic autoimmune disorder, that is predominantly manifested as profound dry eye and dry mouth as ultimately the immune system targets and destroys lacrimal and salivary gland cells (Tabbara and Vera-Cristo, 2000; Ramos-Casals et al., 2012; Mavragani and Basiaga, 2014; Brito-Zerón et al., 2016). SS can occur independently (primary SS, pSS) or concurrently with diseases such as arthritis or lupus (secondary SS, sSS) (Kiripolsky et al., 2017). SS affects millions of people, predominantly females in their fourth and fifth decades of life. While treatments can alleviate symptoms, there is no cure or intervention to halt its progression. The etiology of SS remains largely unresolved, but it’s believed to result from a combination of genetic, environmental, hormonal, and possibly viral factors, causing an aberrant immune response directed against the exocrine glands. The identification of SS usually is scored by the extent of salivary hypofunction, the degree of immune infiltration, evidence of damage to minor salivary glands observed following biopsy, and the presence of autoantibodies, such as anti-SSA (Ro) and Anti-SSB (La) and anti-nuclear antibody (ANA) which are classically found in SS (Mavragani and Basiaga, 2014; Brito-Zerón et al., 2016; Jonsson et al., 2018). Notably, however, in the early phases of SS, there is minor immune infiltration and little overt damage to exocrine tissue despite profound hypofunction. Provocatively, these data indicate that loss of secretory tissue per se is not the causative event resulting in dryness early in the disease, and further indicates that a defect in the stimulus-secretion coupling mechanism precedes glandular destruction and possibly contributes to the progression of the disease.
Over the years, numerous mouse models both genetic and ‘induced’ have been developed to study the pathogenesis of SS, with each exhibiting specific aspects of the human condition, including glandular dysfunction, autoantibody production, and lymphocytic infiltration (Lee et al., 2012; Gao et al., 2020). To investigate the early events in SS, we concentrated on an SS model induced by the activation of the stimulator of the interferon gene (STING) pathway. This is thought to mirror the molecular response to bacterial/viral infection. STING is primarily located in the ER and plays a crucial role in the innate immune response, especially against DNA viruses and intracellular bacteria. Activation of STING occurs upon sensing cytosolic DNA as a result of cell damage or from microbial origin following infection. When cytosolic DNA is detected, it is first recognized by a sensor molecule called cGAS (cyclic GMP-AMP synthase). Binding to DNA prompts cGAS to generate cGAMP (cyclic GMP-AMP), which, in turn, binds to and activates STING (Decout et al., 2021). Once STING is activated, it undergoes a series of transformations that ultimately result in the transcription of type I interferon genes, especially the gene encoding interferon-β (IFN-β) (Papinska et al., 2018). The production of type I interferons is a primary antiviral response and a significant characteristic of SS (Papinska et al., 2018; Huijser et al., 2022). STING can be activated pharmacologically by exposure to 5,6-Dimethyl-9-oxo-9H-xanthene-4-acetic acid (DMXAA), which faithfully reproduces the immune response observed following physiological STING activation (Gao et al., 2013; Weiss et al., 2017; Cerón et al., 2019).
In this study, we investigated the early events in the initiation of SS-like disease that lead to salivary gland hypo-function using the DMXAA SS model. We first utilized in vivo intravital imaging to investigate any potential dysregulation of Ca2+ signaling in the DMXAA-induced SS mouse model. Paradoxically, the spatially averaged Ca2+ levels achieved following neural stimulation in mice treated with DMXAA were enhanced despite significantly reduced fluid secretion. Notably, however, the stereotypical spatial characteristics of the Ca2+ signal were disrupted. Downstream of the Ca2+ signal, the activity of the TMEM16a Ca2+-activated Cl channel stimulated by muscarinic secretagogues was reduced, despite no changes in the abundance or localization of the protein or absolute sensitivity to activation by Ca2+. The intimate localization of IP3R and TMEM16a was, however, disrupted, contributing to the reduced activity of TMEM16a upon agonist stimulation as local peripheral coupling between channels is disrupted. Moreover, we observed disordered mitochondrial morphology, abundance, and function in the disease model. These data suggest that early in SS, reduced fluid secretion occurs because of a defect in the secretagogue activation of Cl- secretion. Further significant mitochondrial dysfunction is evident, possibly as a result of the aberrant Ca2+ signals that may contribute to the dysregulated Ca2+ signals and/or progression of SS disease.
Results
Saliva secretion is attenuated in both SMG and PG in the SS mouse model
Activation of the STING pathway in mice has been established as a model for the initiation of SS. This pathway is normally activated following exposure to foreign nucleic acids and is thought to mimic exposure of cells to DNA/RNA from viruses and bacteria. Activation of this pathway in salivary glands is characterized by initiation of a type-1 interferon response, mild immune cell infiltration, and a marked loss of saliva secretion without obvious morphological damage and, therefore, mimics the early clinical manifestations of SS disease. Thus, to investigate the early cellular events in acinar cells during the initiation of SS in mice, we chose to pharmacologically activate this pathway using DMXAA, a STING pathway agonist. As described in Methods, DMXAA (or control solution) was administered on day 0 and day 21 of the experimental timeline (Figure 1A). Immunofluorescent staining in sliced SMG tissue indicated that STING protein was increased in SMG in the DMXAA-treated mouse on day 28, seven days after the final DMXAA administration (Figure 1—figure supplement 1) confirming the activation of the STING pathway. Whole saliva production from the major salivary glands was evaluated on day 28 following systemic stimulation with the muscarinic receptor agonist, pilocarpine. To avoid potential weight-related variations in saliva secretion, the total saliva output was normalized to the individual mouse’s body weight. Notably, the average saliva production was reduced from 130.1±48.96 mg in vehicle-treated mice to 63.71±30.41 mg in DMXAA-treated mice, a reduction in saliva production of 48.97% (Figure 1B). Consequently, DMXAA treatment resulted in 51.99% saliva production compared to vehicle-treated mice (Figure 1C). Moreover, H&E staining indicated that mild immune infiltration was observed in the DMXAA-treated mice with no overt changes to the morphology of the gland (Figure 1D). The mass of the SMG was also not significantly different in DMXAA vs. vehicle-treated animals, consistent with no loss of secretory tissue (Figure 1E). Collectively, these results suggest that DMXAA-treated mice exhibit characteristics of early-stage SS and could be a useful model for investigating the pathophysiological mechanisms underlying secretory dysfunction and advancing our understanding of the disease’s progression.
Figure 1 with 1 supplement see all
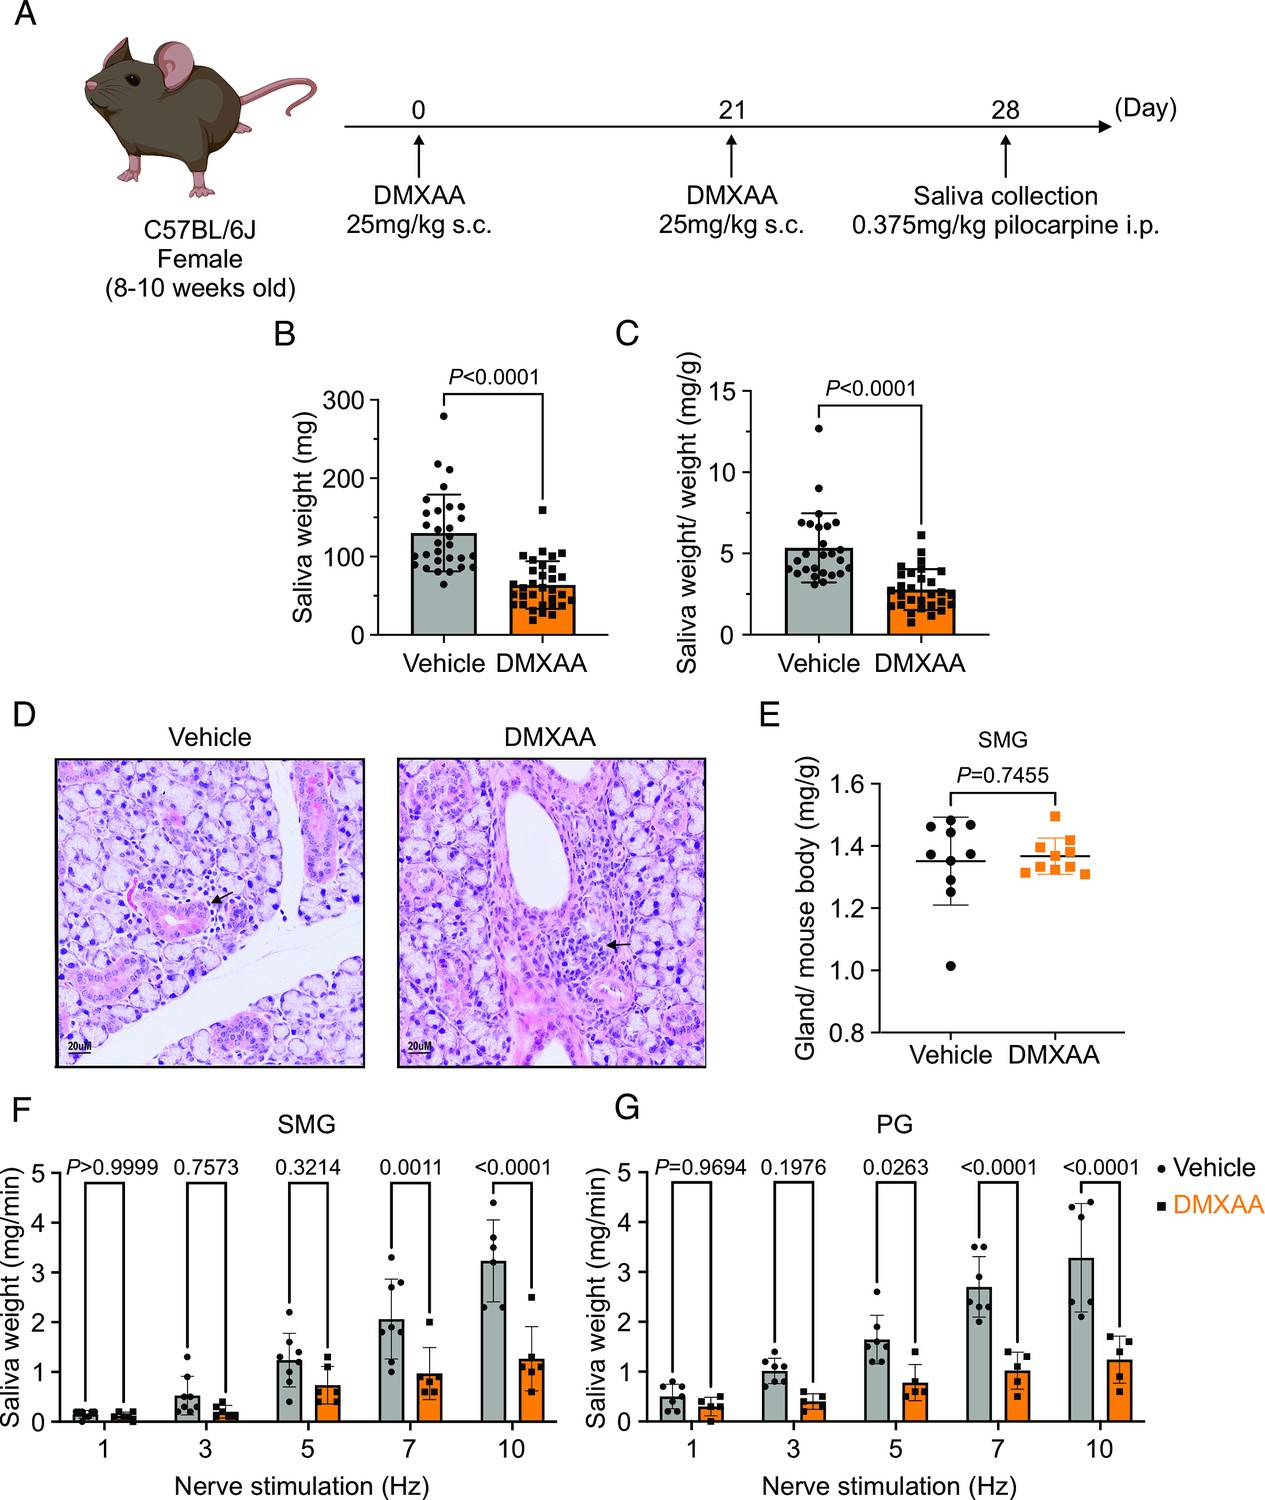
Deficiency in salivary secretion in 5,6-Dimethyl-9-oxo-9H-xanthene-4-acetic acid (DMXAA)-induced Sjögren's syndrome (SS) mouse model.
(A) Schematic timeline for the generation of the SS mouse model. Female wild-type (WT) mice were administered two subcutaneous doses of DMXAA on Day 0 and Day 21. Salivary gland function was assessed on day 28. (B–C) Saliva, stimulated by pilocarpine, was collected over 15 min. (B) The amount of saliva secretion was determined by measuring the saliva weight. Vehicle: n=30 mice, SS mouse model: n=32 mice. Mean ± SD. (C) The weight of collected saliva was normalized to each mouse’s body weight. Vehicle: n=26 mice, SS mouse model: n=29 mice. Mean ± SD. Unpaired two-tailed t-test. (D) H&E stained sections from the vehicle or DMXAA-treated animals. Treated animals showed minor lymphocyte infiltration and inflammation as focal peri-vascular/peri-ductal lymphocytic sialoadenitis adjacent to normal-looking acini. (E) The glandular damage was assessed by normalizing the weight of the submandibular gland (SMG) to the mouse’s body weight. Each dot represents the weight of one SMG. n=10 from 5 mice for both vehicle-treated and DMXAA-treated mice. (F–G) A comparison of total saliva secretion following 1 min stimulations at the indicated frequency (F) from the SMG of mice (Vehicle: n=8 mice, SS mouse model: n=6) and (G) from the parotid gland (PG) (Vehicle: n=7 mice, SS mouse model: n=5 mice). Mean ± SD. Two-way ANOVA with multiple comparisons. Source data is included in Figure 1—source data 1.
-
Figure 1—source data 1
Raw data of amounts of salivary secretion for individual animals.
- https://cdn.elifesciences.org/articles/97069/elife-97069-fig1-data1-v1.csv
To further investigate the individual relative contribution of the SMG and PG to the decrease in total saliva secretion using a more physiological stimulation paradigm, we performed experiments where the nerve bundle innervating a particular gland was electrically stimulated and saliva secretion quantitated. Previous research in our lab has established the range and parameters for physiological stimulation of secretion (Takano et al., 2021). The production of saliva was significantly diminished in DMXAA-treated animals compared with vehicle controls at stimulation frequencies of 7 and 10 Hz in SMG (Figure 1F) and at 5, 7, and 10 Hz in the PG (Figure 1G). These findings confirm that activation of the STING pathway reduces the function of both SMG and PG, consistent with the diminished production of whole saliva. Notably, the reduction in function of PG, the gland responsible for the majority of stimulated saliva secretion, was relatively greater than in SMG.
Altered spatiotemporal characteristics of Ca2+ signals in the SS mouse model
An increase in intracellular Ca2+ plays a central role in regulating the cellular machinery underlying the fluid secretion mechanism. In particular, as noted, an increase in Ca2+ is important for the activation of ion channels localized in particular domains of the polarized acinar cell which play a central role in saliva secretion (Takano et al., 2021). Given that the precise spatiotemporal characteristics of the Ca2+ signal in salivary acinar cells are thought to be fundamental to the appropriate activation of the fluid secretion machinery, we evaluated whether hypofunction following DMXAA treatment resulted from dysregulation of the stimulated Ca2+ signal. Previous research in our lab developed a platform to study Ca2+ signaling in vivo using Multiphoton (MP) imaging in transgenic mice engineered to express a genetic-encoded Ca2+ indicator, GCaMP6f, specifically in acinar cells (Takano et al., 2021). These mice were generated by crossing homozygous mice expressing the fast genetically encoded Ca2+ indicator GCaMP6f (B6J.Cg-Gt(ROSA)26Sortm95.1(CAG-GCaMP6f)Hze/MwarJ) floxed with a STOP cassette with heterozygous tamoxifen-inducible Mist1 Cre mice (B6.129-Bhlha15tm3(cre/ERT2)Skz/J). The protocol for STING pathway induction was applied to the mice expressing GCamp6f (Figure 2—figure supplement 1B). Salivary gland function was assessed by the amount of pilocarpine-induced saliva secretion. The secretion deficiency observed in wild-type mice was recapitulated in these mice from a different genetic background (Figure 2—figure supplement 1B). We reasoned that decreased fluid secretion could result from reduced or dysregulated Ca2+ signaling in DMXAA-treated mice. Therefore, next, we compared the spatially averaged Ca2+ signal evoked by direct nerve stimulation in DMXAA-treated vs. vehicle control animals in vivo in SMG. SMG were stimulated at frequencies optimum for fluid secretion (1–10 Hz) for 10 s and the Ca2+ signals were recorded. Figure 2A shows standard deviation (SD)-projection images visualizing the spatial and amplitude changes in Ca2+ throughout the field of view during the entire period of stimulation at the indicated frequencies. In vehicle-treated mice, the Ca2+ signals at low stimulus strengths occurred in a minority of the cells and predominantly propagated below the apical PM. As the stimulation strength increased, Ca2+ signals became more pronounced, and more acinar cells responded. Strikingly, acinar cells in DMXAA-treated mice demonstrated enhanced sensitivity to stimulation. At lower stimulation strengths, a larger number of acinar cells responded, and the spatially averaged Ca2+ signals in these cells were notably larger when compared to those in the control group. Figure 2B shows a time series of images following 7 Hz stimulation. This augmented response was manifested as an elevated maximum peak [Ca2+] (Figure 2D), shorter latency (Figure 2E), and larger area under the curve (AUC) during stimulation in DMXAA-treated animals (Figure 2F).
Figure 2 with 1 supplement see all
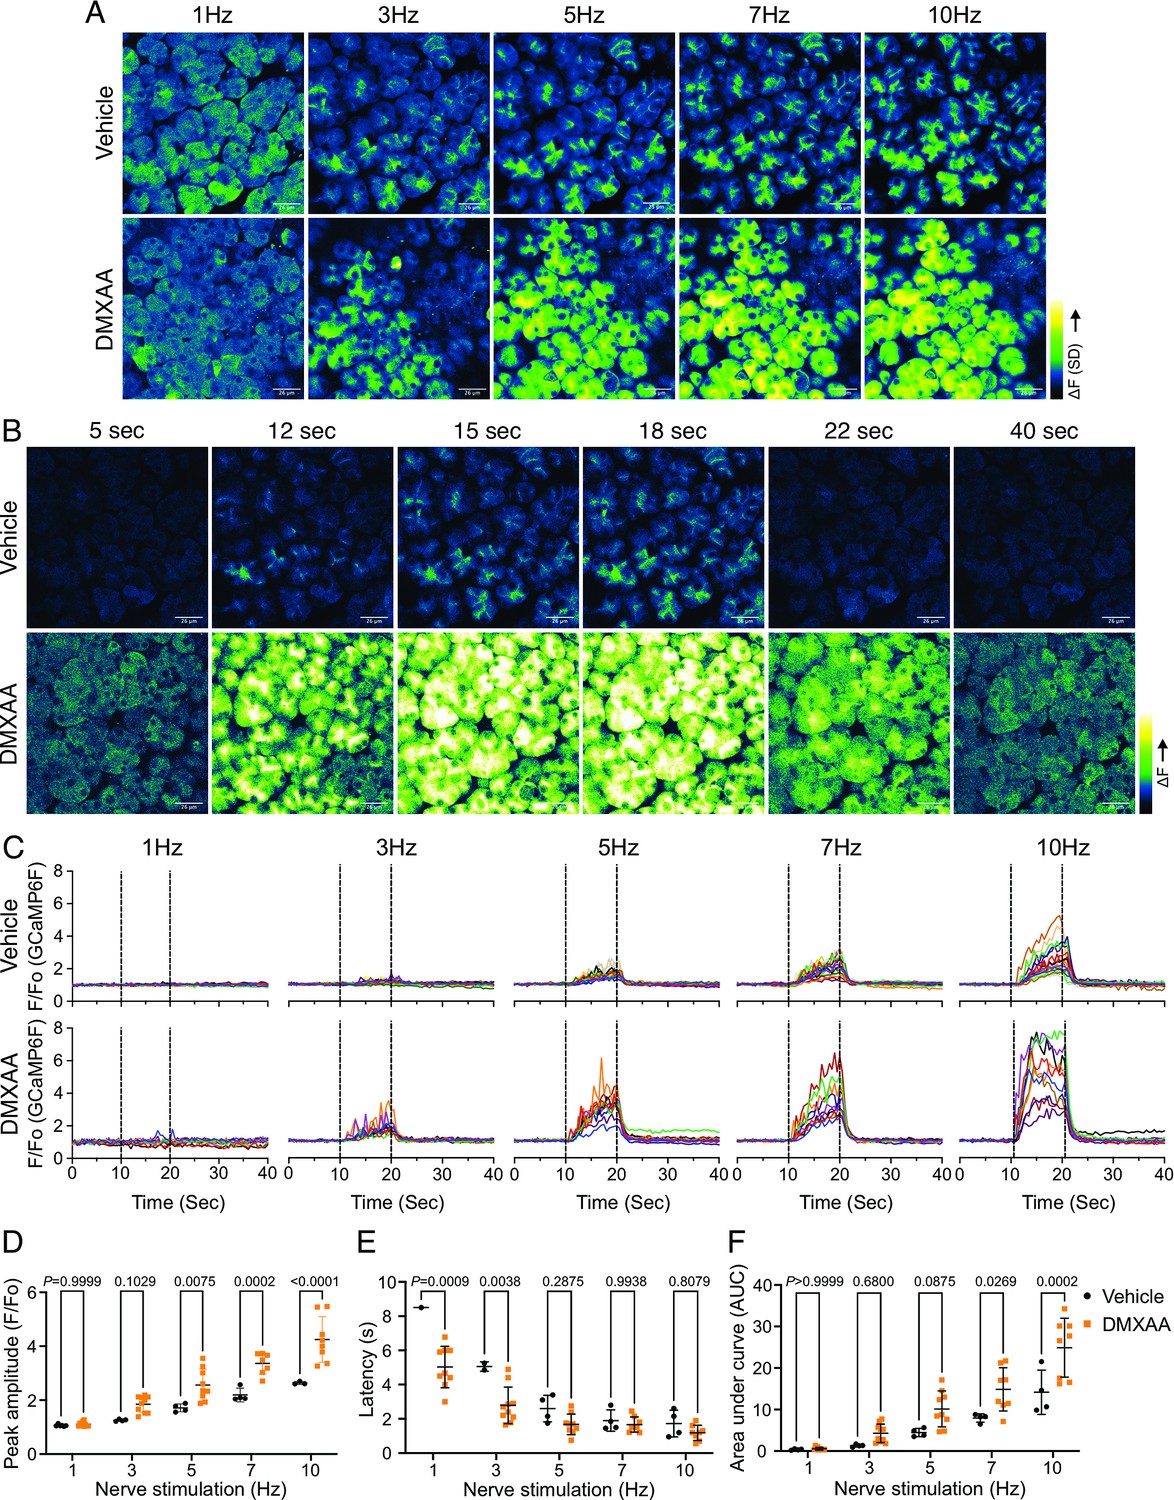
Augmented global Ca2+ signals in vivo in Sjögren's syndrome (SS) mouse model.
(A) Representative standard deviation images of Ca2+ signals during the 10 s of stimulation. Scale bar: 26 μm (B) The time-course of pseudo-color images of Ca2+ in response to 7 Hz stimulation. Scale bar: 26 μm (C) Representative cellular responses to stimulation at the indicated frequencies averaged from the entire cell. n=10 cells, one animal. (D) A comparison of peak Ca2+, (E) area under a curve, and (F) latency during each stimulation in submandibular gland (SMG). Each symbol represented the average response of ten cells from one view. Vehicle: n=3–6 from three mice; SS mouse model: n=8–10 from four mice. Mean ± SD. Two-way ANOVA with multiple comparisons. Source data is included in .
-
Figure 2—source data 1
Raw data for salivary secretion from individual animals.
- https://cdn.elifesciences.org/articles/97069/elife-97069-fig2-data1-v1.csv
In addition to the absolute magnitude of the spatially averaged Ca2+ signal, the subcellular spatial characteristics of the stimulated Ca2+ rise are also important for appropriate stimulation of fluid secretion (Takano et al., 2021). Ca2+ signals stimulated following nervous stimulation in SMG are invariably initiated in the extreme apical pole of acinar cells and subsequently establish a standing gradient that dissipates rapidly to result in apically confined signals that do not substantially propagate to the basal aspects of the cell following physiological stimulation (Takano et al., 2021). We, therefore, investigated if the spatial characteristics of stimulated Ca2+ signals were altered in DMXAA-treated animals. SD image projections generated during the period of stimulation demonstrated that the [Ca2+]i increase was tightly localized below the apical PM within the acinar cells in the vehicle-treated animals (Figure 3A). However, in the DMXAA-treated animals, the [Ca2+]i exhibited a more global distribution through the entire cell cytoplasm (Figure 3B). The [Ca2+]i was visualized via line-scan plots revealing the temporal alterations along a line extending from the apical PM to the basolateral PM, traversing the nucleus, over time within an acinar cell. A significant [Ca2+]i elevation was evident at the basolateral aspects of the acinar cell in the DMXAA-treated animals (Figure 3D) when compared to the vehicle-treated control (Figure 3C). As shown in the kinetic plots,the [Ca2+]i in the apical region is greater in DMXAA-treated mice compared to the vehicle-treated mice (Figure 3E). Moreover, a significant Ca2+ signal was observed in the extreme basal region of the cell in DMXAA but not in vehicle-treated animals (Figure 3F). The comparison of Ca2+ signal ratios at the apical versus basolateral PM indicated the most significant globalization of the Ca2+ signal occurred at 10 Hz stimulation (Figure 3G) which corresponds to the stimulation strength that results in maximal fluid secretion (Takano et al., 2021). In total, these data demonstrate that the magnitude of the spatially averaged Ca2+ signal, together with the spatiotemporal characteristics of the signal are altered in the DMXAA-treated animals, but that these changes can not readily account for the reduction in fluid secretion observed.
Figure 3
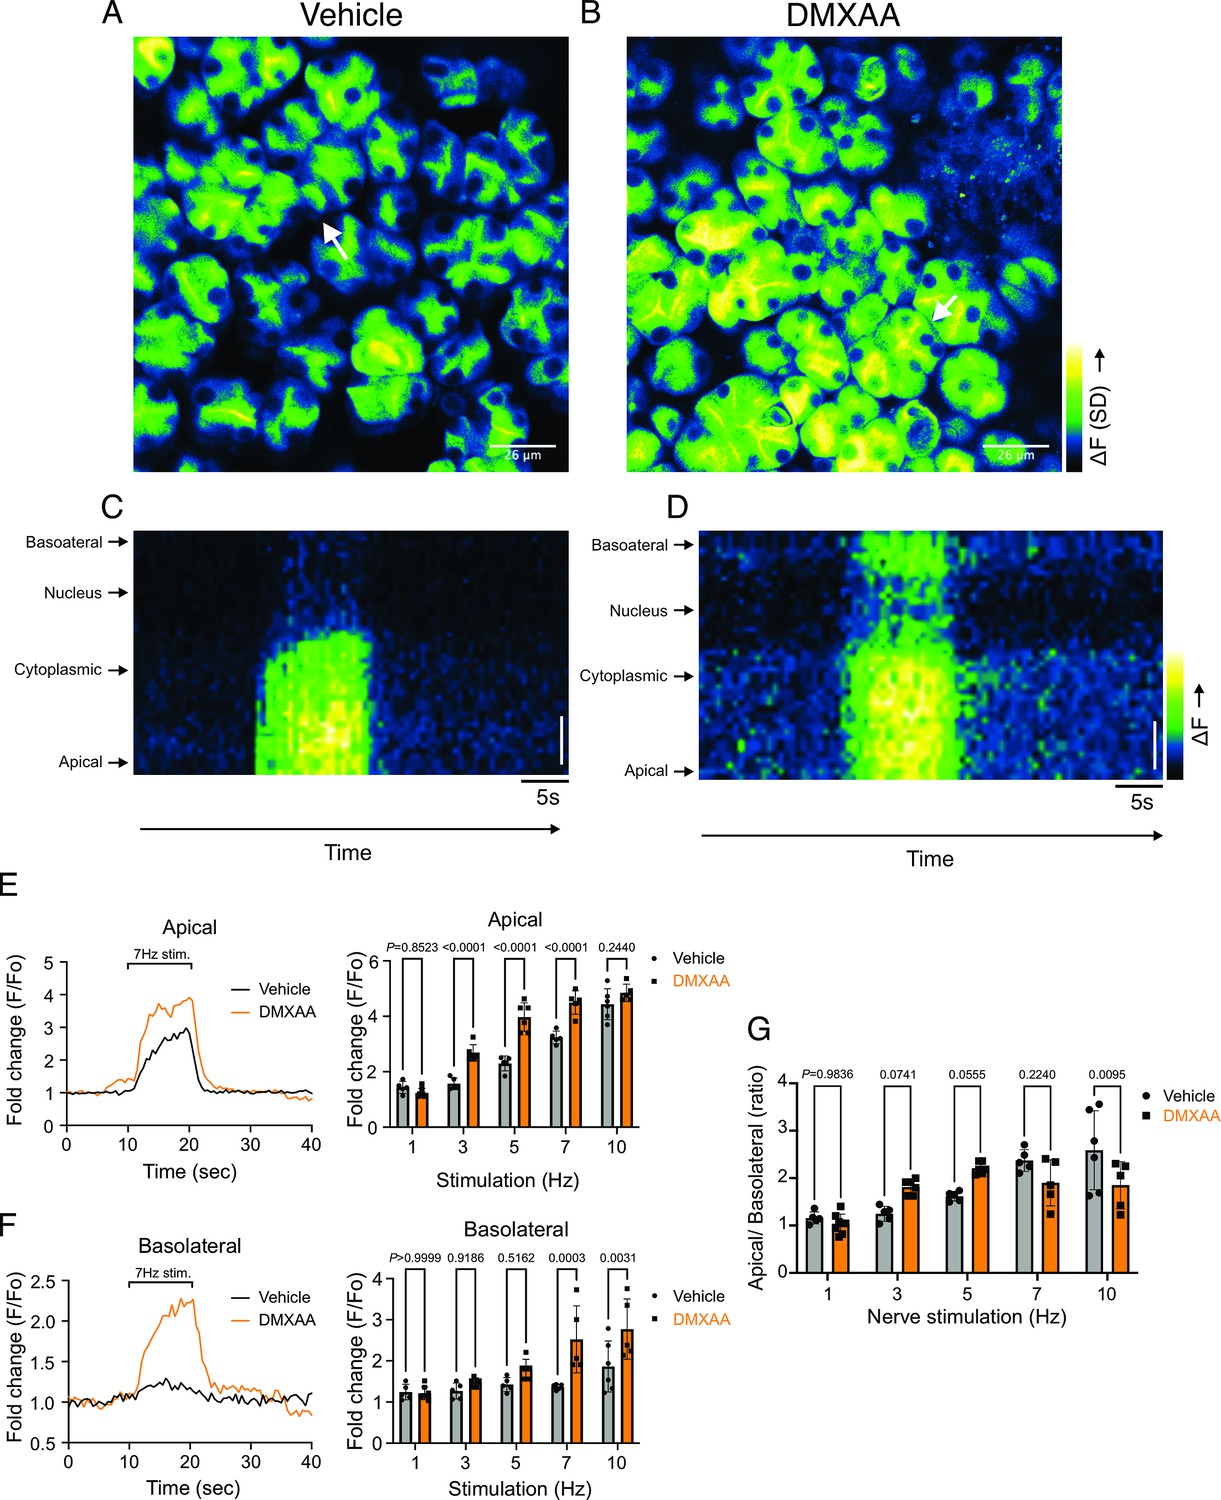
Disrupted spatial localization of Ca2+ signals in vivo in Sjögren's syndrome (SS) mouse model.
(A–B) A representative standard deviation image during the 7 Hz stimulation in (A) vehicle condition and (B) in the SS mouse model. Scale bar: 26 μm. An acinus is outlined by the white broken line and a line from apical to basal is shown in red in each standard deviation (SD) image. (C–D) A representative ‘kymograph’ image of consecutive lines stacked in space over time for 7 Hz stimulation in (C) vehicle condition and (D) SS mouse model. Time is encoded along the X-axis from left to right. Space is encoded along the Y-axis from the apical side (bottom) to the basolateral side (top). Scale bar: 3 μm. (E) Representative trace of Ca2+ signals at 7 Hz nerve stimulation in an apical ROI generated as the initial 2 mm of the scanned line over time (yellow line) in vehicle-treated (black) and DMXAA-treated (orange) mice. The changes in apical ROI fluorescence at the indicated frequencies were quantified as the maximal Ca2+ changes normalized to the basal intensity. (F) Representative trace of Ca2+ signals following 7 Hz nerve stimulation in a basolateral ROI generated as the final 2 mm of the scanned line (yellow line) over time in vehicle-treated (black) and DMXAA-treated (orange) mice. The changes in basolateral Ca2+ signals at the indicated frequencies were quantified by the maximal Ca2+ changes normalized to the basal intensity. (G) The ratio of the magnitude of Ca2+ signal on the apical vs. the basolateral ROI upon stimulation at the indicated frequencies. Vehicle: n=5–6 replicates from three mice; SS mouse model: n=5–8 replicates from four mice. Mean ± SD. Two-way ANOVA with multiple comparisons. Source data is included in Figure 3—source data 1.
-
Figure 3—source data 1
Raw data for individual animals.
- https://cdn.elifesciences.org/articles/97069/elife-97069-fig3-data1-v1.csv
Secretagogue-stimulated TMEM16a activity is suppressed in the SS mouse model
The rate-limiting step for the secretion of fluid is the activation of the Ca2+-activated Cl- channel, TMEM16a. We considered that a reduction in fluid secretion could conceptually occur by a reduction or mislocalization of TMEM16a protein, or by compromised muscarinic receptor-stimulated activation of the channel. Western blotting indicated the TMEM16a protein expression was comparable between the vehicle and SS mouse models (Figure 4A and B). In addition, immunolocalization using confocal microscopy demonstrated that TMEM16a localization remained largely unchanged in the SS mouse model (Figure 4C). Thus, a decrease in protein expression or mislocalization of the protein does not result in a reduction in stimulated saliva secretion. Similarly, the expression and localization of Aquaporin 5 were also not altered (Figure 4—figure supplement 1A–C). We next investigated whether the activation of this ion channel was compromised in DMXAA-treated animals using whole-cell patch clamp electrophysiology. In the absence of stimulation, no Cl- currents were observed in either vehicle or DMXAA animals following either depolarizing or hyperpolarizing voltage steps from a holding potential of –50 mV (Figure 4D). In the presence of 1 μM of the muscarinic agonist Carbachol (CCh), robust Cl- currents were measured in acini prepared from vehicle-treated animals (Figure 4E), which were greatly reduced in DMXAA-treated animals (Figure 4D and F). Reduced CCh-stimulated Cl- currents could potentially occur because of altered Ca2+ regulation of TMEM16a following disruption of the spatial characteristics of the stimulated Ca2+ signal.Theoretically,it is also possible that the [Ca2+]i in the immediate vicinity of TMEM16a was disrupted, despite the augmented spatially averaged peak response. We, therefore, next tested whether TMEM16a activity stimulated directly by 0.5, 1 or, 5 μM Ca2+ in the pipette solution (and thus globally in the cytoplasm) was altered in DMXAA-treated animals. Surprisingly, TMEM16a was activated to a similar extent by Ca2+ in the SS mouse model (Figure 5A and B). In total, our data suggest that TMEM16a abundance, localization, or activity per se are not altered and thus do not explain the significant reduction in saliva secretion in the DMXAA-treated model.
Figure 4 with 1 supplement see all
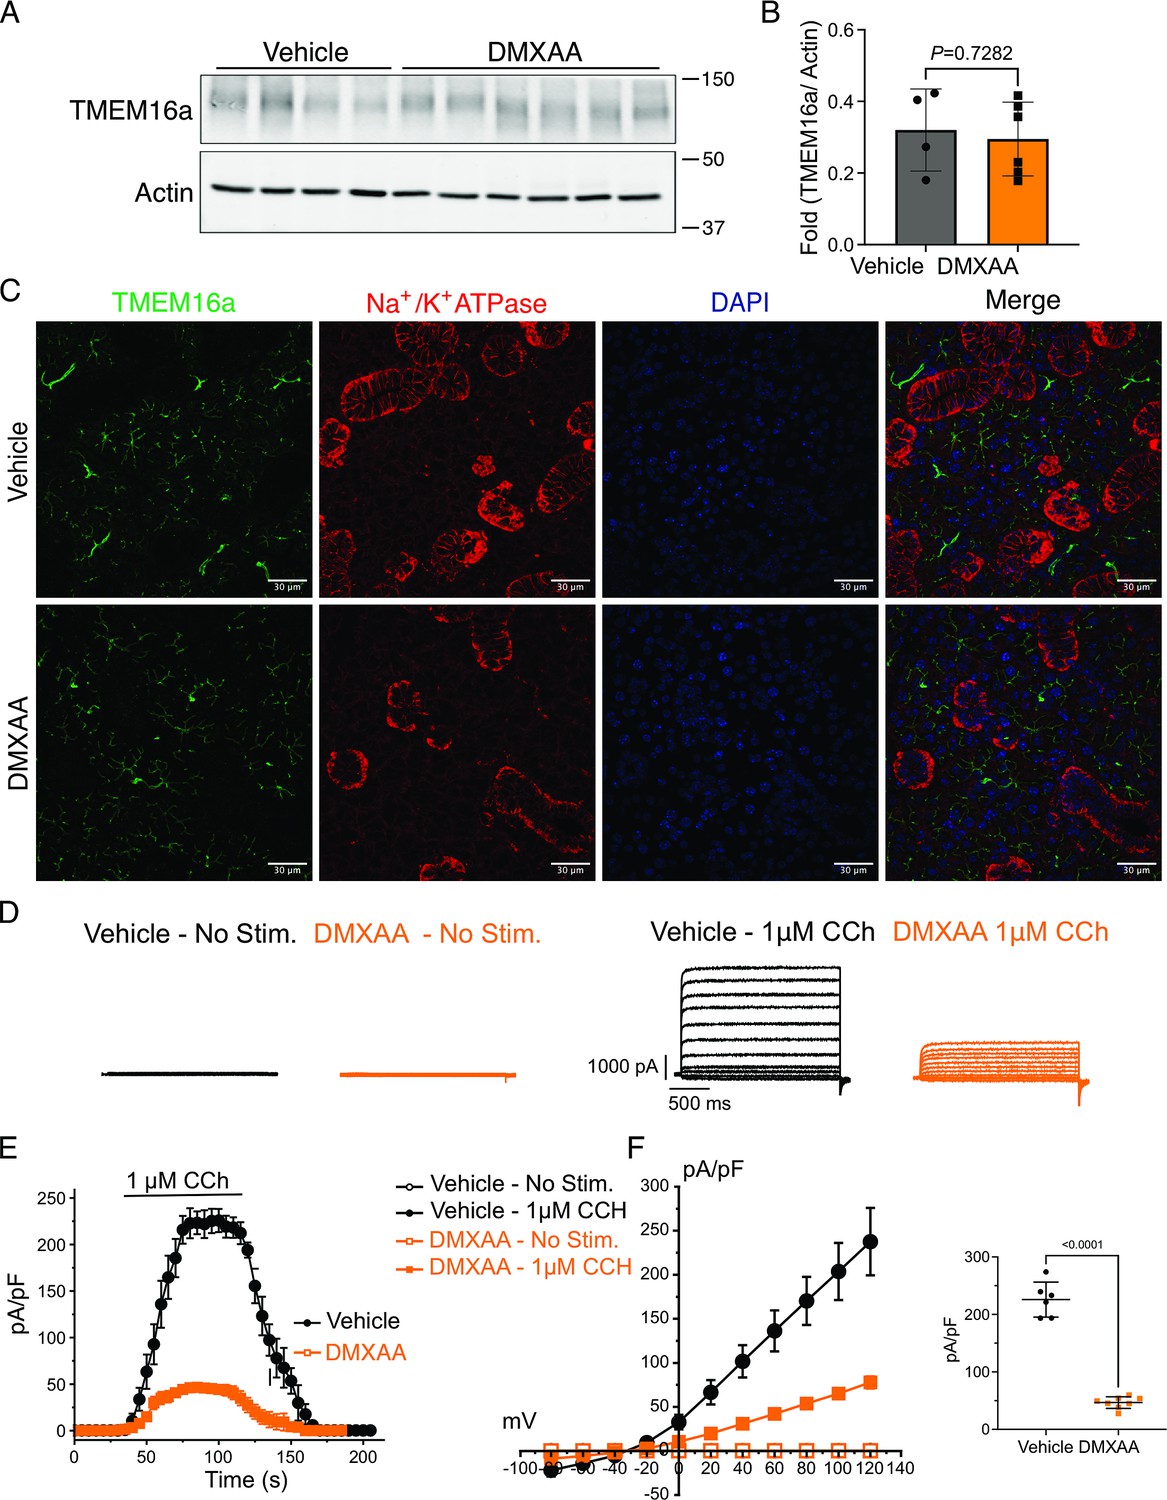
Attenuated whole-cell macroscopic Cl– currents induced by Carbachol (CCh) stimulation in Sjögren's syndrome (SS) mouse model.
(A) Western blotting showing the protein expression level of TMEM16a in the vehicle condition and the 5,6-Dimethyl-9-oxo-9H-xanthene-4-acetic acid (DMXAA)-treated SS mouse model. Actin is the internal control. (B) The quantification of TMEM16a protein expression normalized to the internal control, Actin. Vehicle, n=4 mice; SS mouse model: n=6 mice. (C) Immunofluorescent staining in submandibular gland (SMG) tissue for TMEM16a (green), Na+/K+ ATPase (red), and DAPI for nucleus (blue). The upper panel is from the vehicle-treated control and the bottom panel is from DMXAA-treated animals. Scale bar: 30 μm. Unpaired two-tailed t-test. (D) Cl- currents when cells were held at –50 mV and stepped from –80–120 mV in 20 mV increments. (E) Time-dependent Cl- current density changes in response to the Carbachol (CCh) in the isolated acinar cells in vehicle conditions and SS mouse model. (F) Current-voltage relationships were measured before and after the addition of CCh in vehicle conditions (n=three mice, 3–4 cells per mouse) and SS mouse model (n=three mice, 3–4 cells per mouse). TMEM16a currents in the treated mice were markedly reduced compared to the control mice. Black dots represent the vehicle-treated cells and orange squares represent DMXAA-treated cells. The open symbols represent no stimulation; the solid symbols represent CCh stimulation. Source data is included in Figure 4—source data 1 and 2.
-
Figure 4—source data 1
Raw densitometry and current magnitude data.
- https://cdn.elifesciences.org/articles/97069/elife-97069-fig4-data1-v1.csv
-
Figure 4—source data 2
Original immunoblots.
- https://cdn.elifesciences.org/articles/97069/elife-97069-fig4-data2-v1.zip
Figure 5
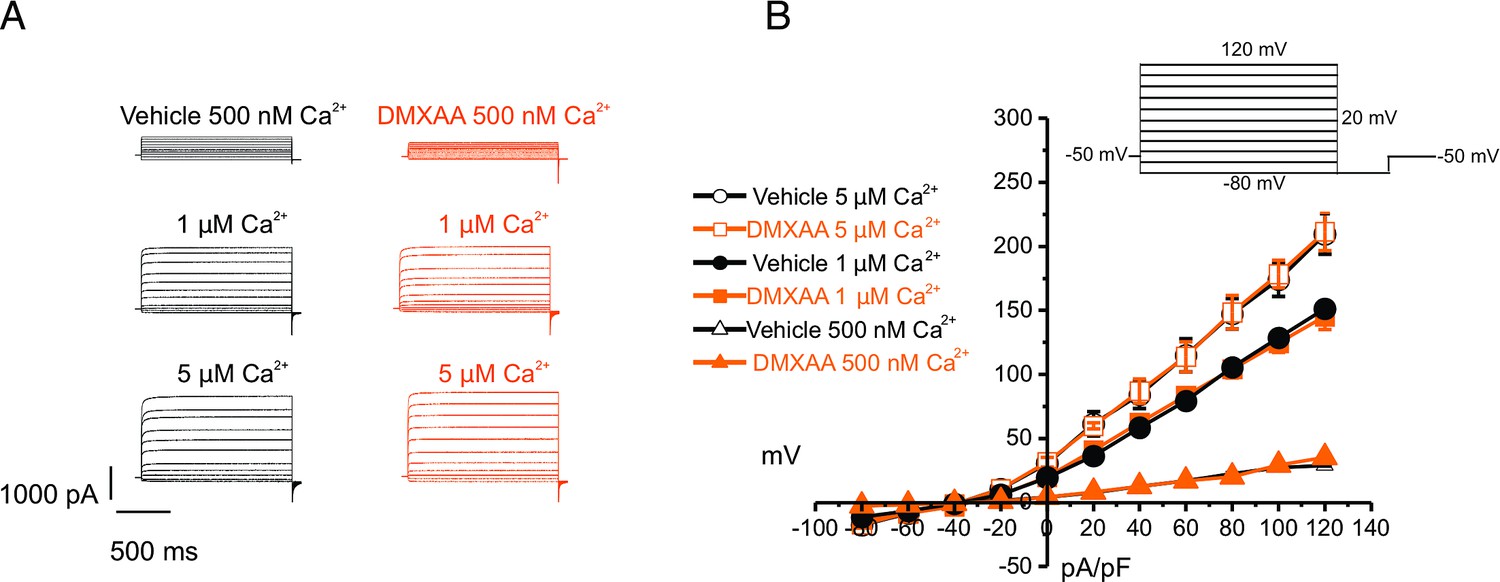
Increased [Ca2+]i is capable of restoring TMEM16a functionality to 5,6-Dimethyl-9-oxo-9H-xanthene-4-acetic acid (DMXAA)-treated mice.
(A) Cl- currents when cells were held at –50 mV and stepped from –80–120 mV in 20 mV increments. Either 0.5, 1, or 5 μM [Ca2+]i in the patch pipette elicited a similar magnitude of Cl- currents for both the treated (n=3 mice, 3–4 cells per mouse) and control mice (n=3 mice, 3–4 cells per mouse). (B) Current-voltage relationships for both populations were essentially identical. Vehicle and SS mouse model: n=3 mice, 3–4 cells per mouse.
An alternative mechanism could be that the microdomain between the apical ER Ca2+ release sites and the apical PM TMEM16a is disrupted in the disease model, resulting in compromised local coupling between the ER and PM channels. Therefore, we investigated how the activation of TMEM16a was affected by buffering the CCh-stimulated cytosolic Ca2+ with slow and fast Ca2+ chelators. EGTA is a high-affinity Ca2+ buffer with slow kinetics, while BAPTA has much more rapid kinetics. Experimentally, BAPTA can quickly buffer Ca2+ changes close to Ca2+ release sites and limit local activation of effectors within 20 nm. In contrast, EGTA has been shown to attenuate the rise in the bulk cytosol but is too slow to buffer local Ca2+ in a restricted microdomain (Eisner et al., 2023). In the presence of BAPTA, no CI- currents were detected in either vehicle-treated or DMXAA-treated animals (Figure 6A). However, in the presence of the slow Ca2+ chelator, EGTA, CCH-stimulated Cl- currents were observed in acinar cells from vehicle-treated animals but were absent in the DMXAA-treated animals (Figure 6A and B). These data suggest that physiologically TMEM16a is activated by local changes in Ca2+ signaling as a result of IP3-induced Ca2+ release in the apical domain of the acinar cell.
Figure 6
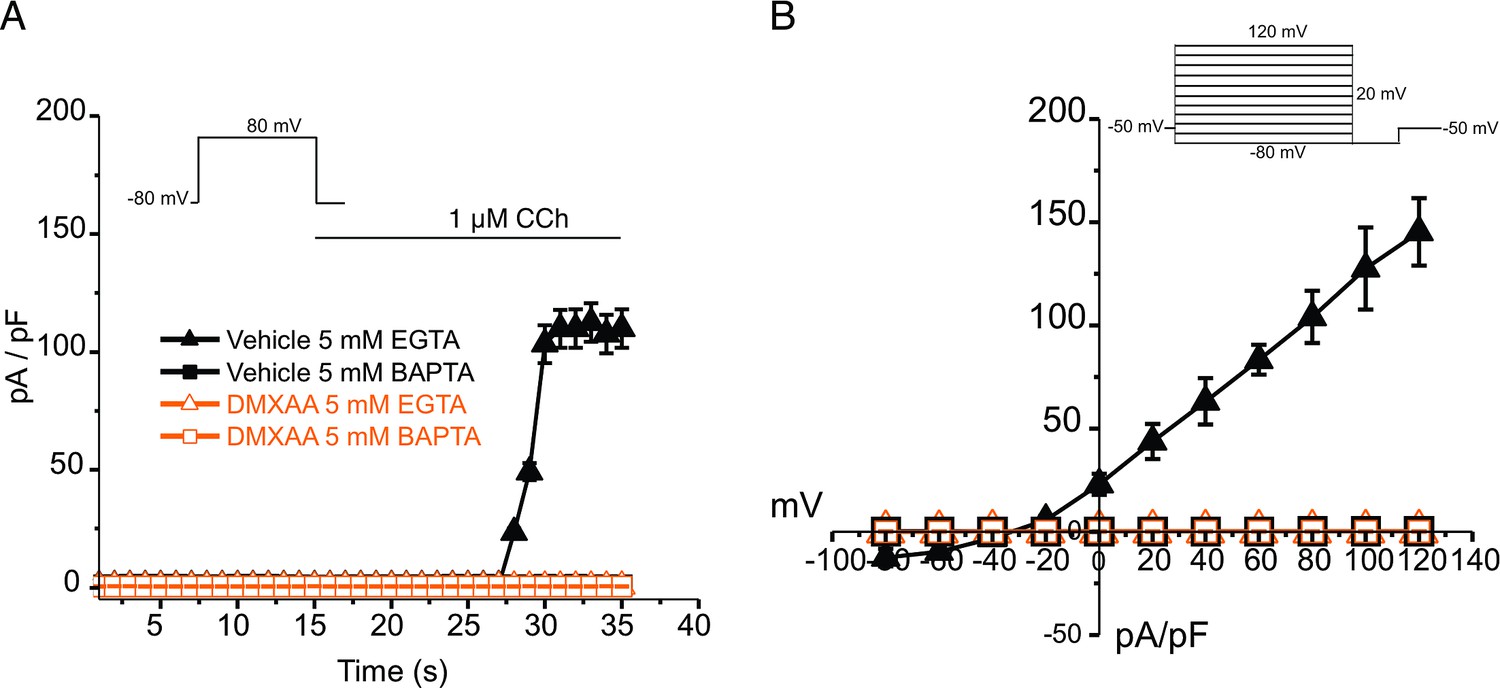
EGTA abolishes TMEM16a currents in 5,6-Dimethyl-9-oxo-9H-xanthene-4-acetic acid (DMXAA)-treated mice.
(A) Cl- currents in cells held at –80 mV and stepped to 80 mV with Carbachol (CCh) addition in EGTA (slow) and BAPTA (fast) buffered cells, respectively. (B) Current-voltage relationships were measured after the addition of CCh in 5 mM EGTA and 5 m M BAPTA-loaded isolated acinar cells from vehicle conditions (N=3 mice, 3–4 cells per mouse) and Sjögren’s syndrome (SS) mouse model (n=3 mice, 3–4 cells per mouse). No TMEM16a currents in acini in either vehicle or DMXAA-treated mice in cells buffered with BAPTA. Triangles represent the 5 mM EGTA condition; squares represent the 5 mM BAPTA condition. The solid black symbols represent the vehicle-treated cells and hollow orange symbols represent DMXAA-treated cells.
We noted that the abundance of IP3R2/3 was not significantly altered in DMXAA-treated animals (Figure 7—figure supplement 1A–C), nevertheless next, we employed STED super-resolution microscopy to closely examine the spatial relationship between apical PM TMEM16a and IP3R3 on the apical ER (Figure 7A). Despite the cell-cell contact distance remaining consistent in the disease model, as indicated by the distance between TMEM16a on the PM of adjacent acinar cells (Figure 7F), a notable increase in distance between the apical TMEM16a and IP3R3 expressed on apical ER compared to the control group was observed (Figure 7E). In the control mice, the distance between TMEM16a and IP3R3 was on average 84±17 nm, versus 155±20 nm in the SS disease mice. Similarly, the distance between IP3R3 in adjacent cells was increased from 505±34 nm to 689±68 nm (Figure 7C and D). In total, these observations support the conclusion that the reduced activity of the TMEM16a channel is attributable to the disruption of the microdomain between TMEM16a and IP3R3, such that the Ca2+ flux through the IP3R is not communicated appropriately to its effector, TMEM16a.
Figure 7 with 1 supplement see all
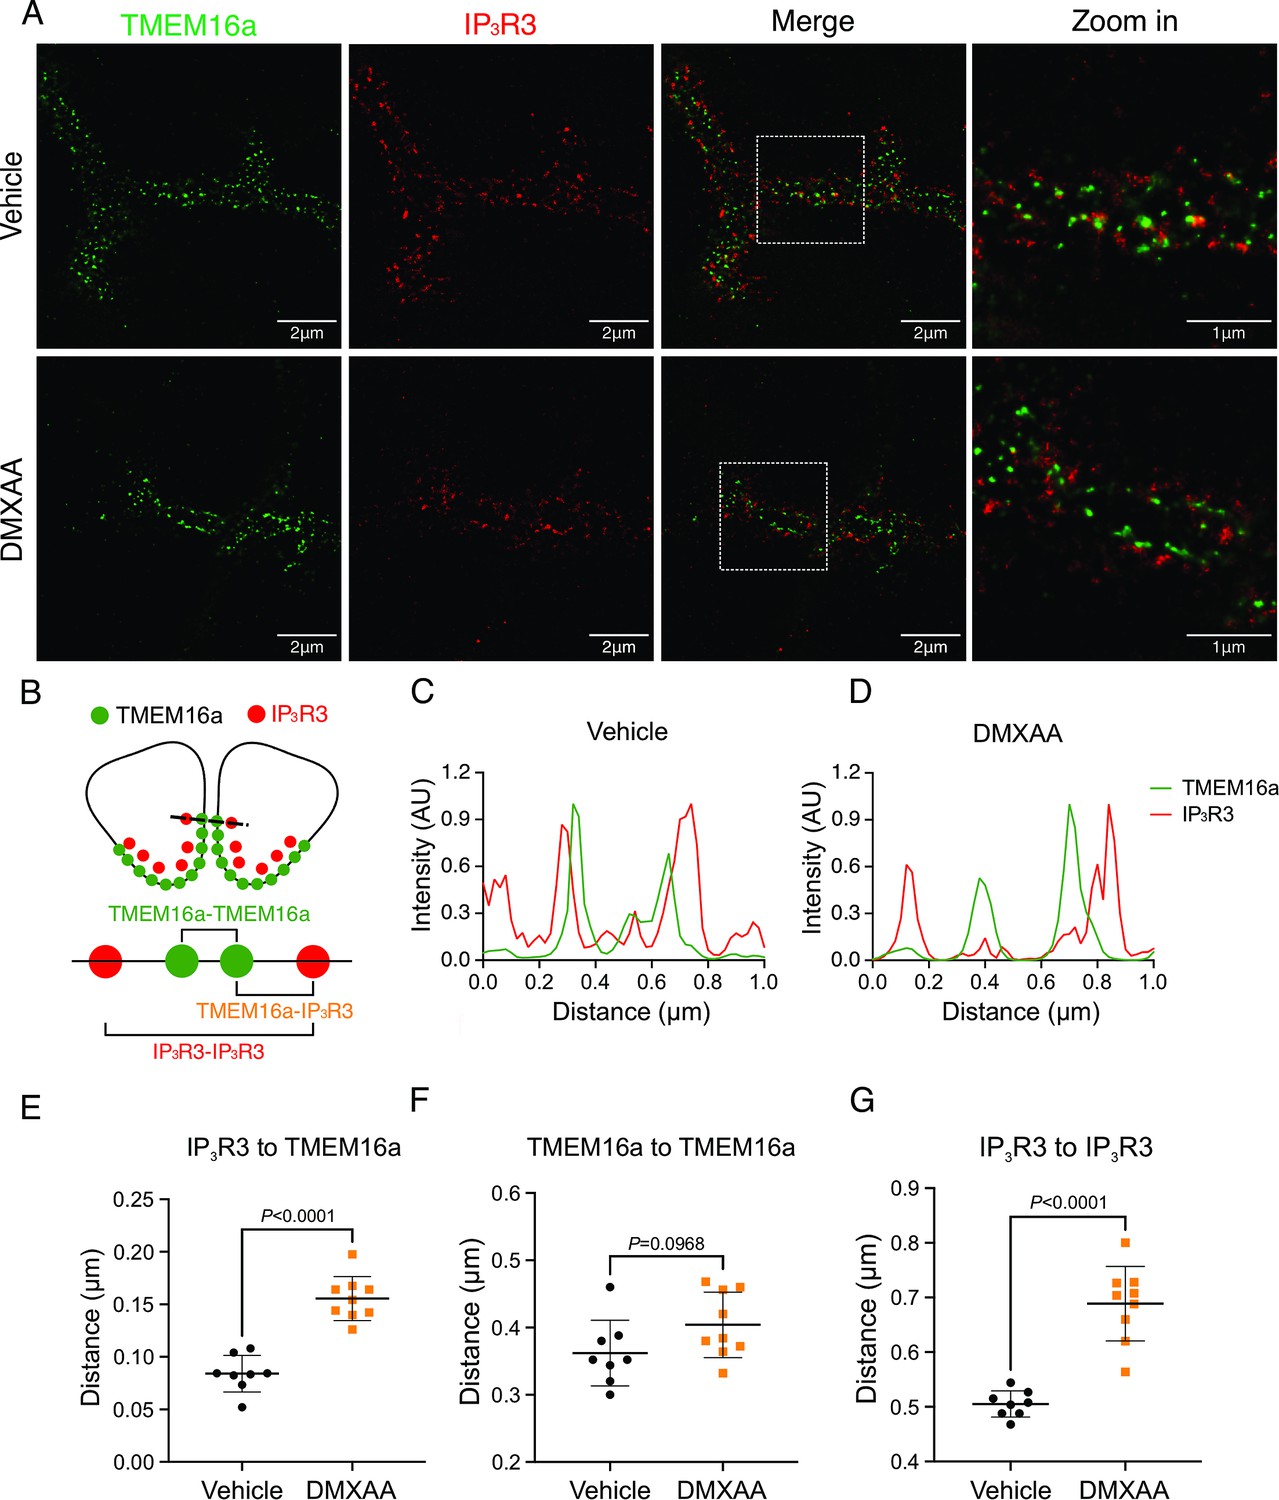
Disrupted proximity between TMEM16a and IP3R3 in the 5,6-Dimethyl-9-oxo-9H-xanthene-4-acetic acid (DMXAA)-treated Sjögren’s syndrome (SS) mouse model.
(A) Maximum projection of a STED z stack (1 μm) showing TMEM16a (green) and IP3R3 (red) in submandibular gland (SMG) tissue following Huygens deconvolution. The top panel represents the vehicle-treated control, and the bottom panel represents the SS mouse model. Scale bar: 2 μm. Zoomed images highlight the localization of TMEM16a and IP3R3 from the white square on the merged images. (B) Diagram illustrating the positioning of apical PM TMEM16a and apical IP3R3 in acinar cells. To analyze the proximity, a 1 μm reference line was drawn across the two parallel TMEM16a over two adjacent acinar cells with IP3R3 aligned vertically in the cytoplasm. (C–D) The representative traces of changes in fluorescence of TMEM16a (green) and IP3R3 (red) over the 1 μm distance. (E) Analysis of distance between TMEM16a and IP3R3 within cells. (F) Analysis of the distance between parallel TMEM16a on adjacent acinar cells. (G) Distance measurement of apical IP3R3 between two cells. Each symbol represents the mean of 5 examinations per image. Vehicle: n=8 replicates from 3 mice; SS mouse model: n=9 replicates from 3 mice. Mean ± SD. Unpaired two-tailed t-test. Source data is included in Figure 7—source data 1.
-
Figure 7—source data 1
Raw distance measurements for individual line profiles.
- https://cdn.elifesciences.org/articles/97069/elife-97069-fig7-data1-v1.csv
Compromised mitochondrial morphology and metabolism in the SS mouse model
Ca2+ modulates cellular metabolism by the intricate bidirectional interaction between the ER and mitochondria. Ca2+ transfer between ER and mitochondria is essential for optimal bioenergetics, and dysregulated [Ca2+]i can be deleterious to mitochondrial function and alter morphology (Duchen, 2000; Csordás et al., 2006; Ye et al., 2021; Katona et al., 2022). The transfer of Ca2+ between ER and mitochondria is dependent on the intimate physical localization of the organelles (Katona et al., 2022). Notably, aberrant mitochondrial morphology has been reported in the salivary glands of SS patients (Barrera et al., 2021). We first investigated mitochondrial abundance and morphology by immunofluorescence staining with antibodies directed against ATP5A, a component of the ATP synthesis machinery to visualize mitochondria, and Na+/K+ ATPase to localize the plasma membrane (Figure 8A). Using previously published methodologies (Valente et al., 2017; Harwig et al., 2018), quantification revealed a 22.16%±4.95 reduction in mitochondrial numbers in the SS mouse model relative to the vehicle-treated control (Figure 8B). Consistent with reduced mitochondrial numbers, less area was occupied by mitochondria in DMXAA-treated acinar cells (Figure 8C). Mitochondria morphology is intricately linked to their bioenergetic status We next evaluated mitochondrial morphology by their ‘so-called’ aspect ratio (AR) and form factor (FF) in DMXAA and vehicle-treated animals.The AR, the length of the major over minor axes of mitochondria documents the degree of fragmentation or elongation of individual mitochondria (Katona et al., 2022; Harwig et al., 2018). Mitochondria exhibited an 18.35%±4.62 decrease in mitochondrial elongation (Figure 8D) and a 20.7%±7.78 decrease in mitochondrial branching (Figure 7E) in the disease model compared to the vehicle-treated control condition. Importantly, these changes in mitochondrial number and morphology were not exclusive to the SMG as similar patterns were observed in the PG mitochondria, again marked by reduced mitochondrial count, increased fragmentation, and decreased branching (Figure 8—figure supplement 1A–E).
Figure 8 with 1 supplement see all
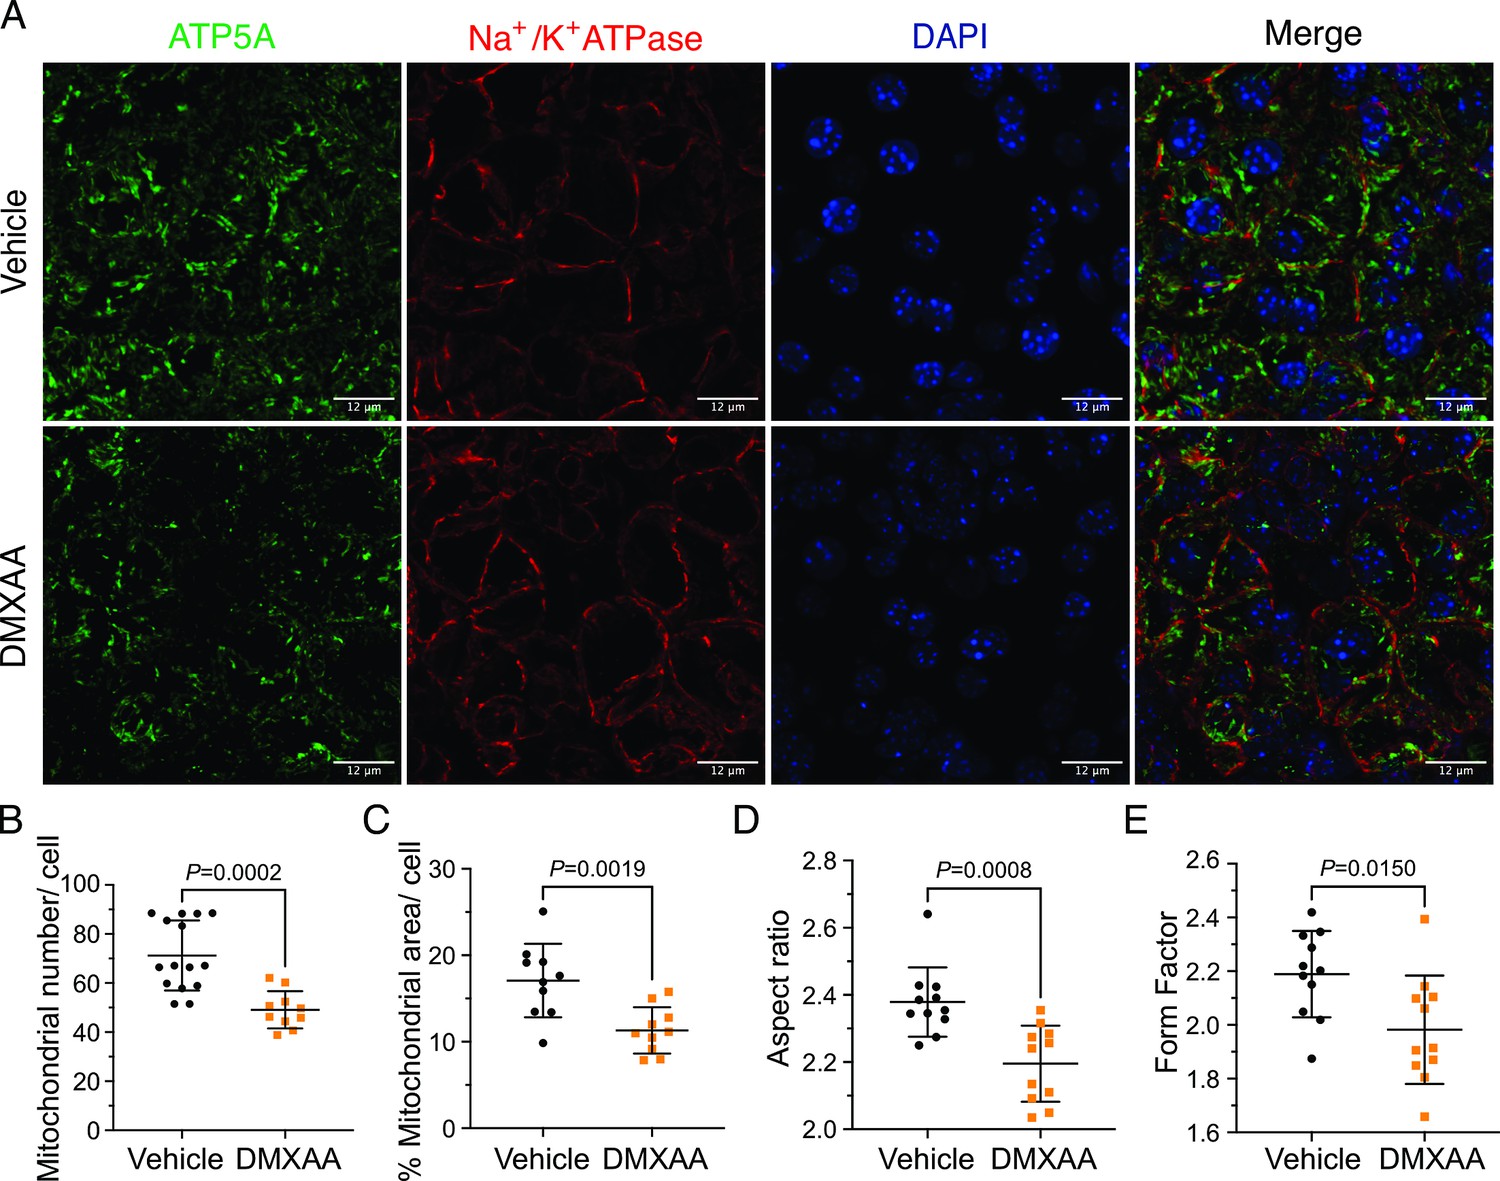
Mitochondrial alterations in acinar cells from the 5,6-Dimethyl-9-oxo-9H-xanthene-4-acetic acid (DMXAA)-treated Sjögren's syndrome (SS) mouse model.
(A) Immunofluorescent staining in submandibular gland (SMG) tissue for ATP5A (green), Na+/K+ ATPase (red), and DAPI for nucleus (blue). The upper panel is the vehicle, and the bottom panel is the SS mouse model. Scale bar: 12 μm. The mitochondrial content was quantified by (B) the mitochondrial number per acinar cell and (C) the percentage of area occupied by mitochondria per acinar cell. The mitochondrial morphology was analyzed by the (D) aspect ratio (AR) for the degree of mitochondrial tubular shape and (E) form factor (FF) for the degree of mitochondrial branching (complexity). In (B) to (E), black dots represent the vehicle condition, and orange squares indicate the SS mouse model. Each symbol represents the mean of 10 cells per image. Vehicle: n=10–15 from 3 mice; SS mouse model: n=10–11 from 3 mice. Mean ± SD. Unpaired two-tailed t-test. Source data is included in Figure 8—source data 1.
-
Figure 8—source data 1
Raw mitochondrial morphology data.
- https://cdn.elifesciences.org/articles/97069/elife-97069-fig8-data1-v1.csv
Next, we utilized electron microscopy (EM) to investigate mitochondrial ultrastructure. At low magnification, acinar cells from control mice contained defined mitochondria and well-formed ER stacks (Figure 9A. blue arrow). In contrast, the ER structure was disrupted in the SS disease model (Figure 9A’). At higher magnification,the coordinated ER structure was largely absent in diseased mice (Figure 9B and B’), and the proximity between ER and mitochondria was disrupted (Figure 9H and I). Moreover, we also observed scattered mitochondrial cristae at the highest magnification (Figure 9C’ , and G). Consistent with immunofluorescence studies, quantification of EM micrographs revealed that mitochondria were smaller, more fragmented (Figure 9D and E), and rounder (Figure 9F) in shape. In summary, our results collectively indicate significant morphological alterations in mitochondria in the SS disease model.
Figure 9
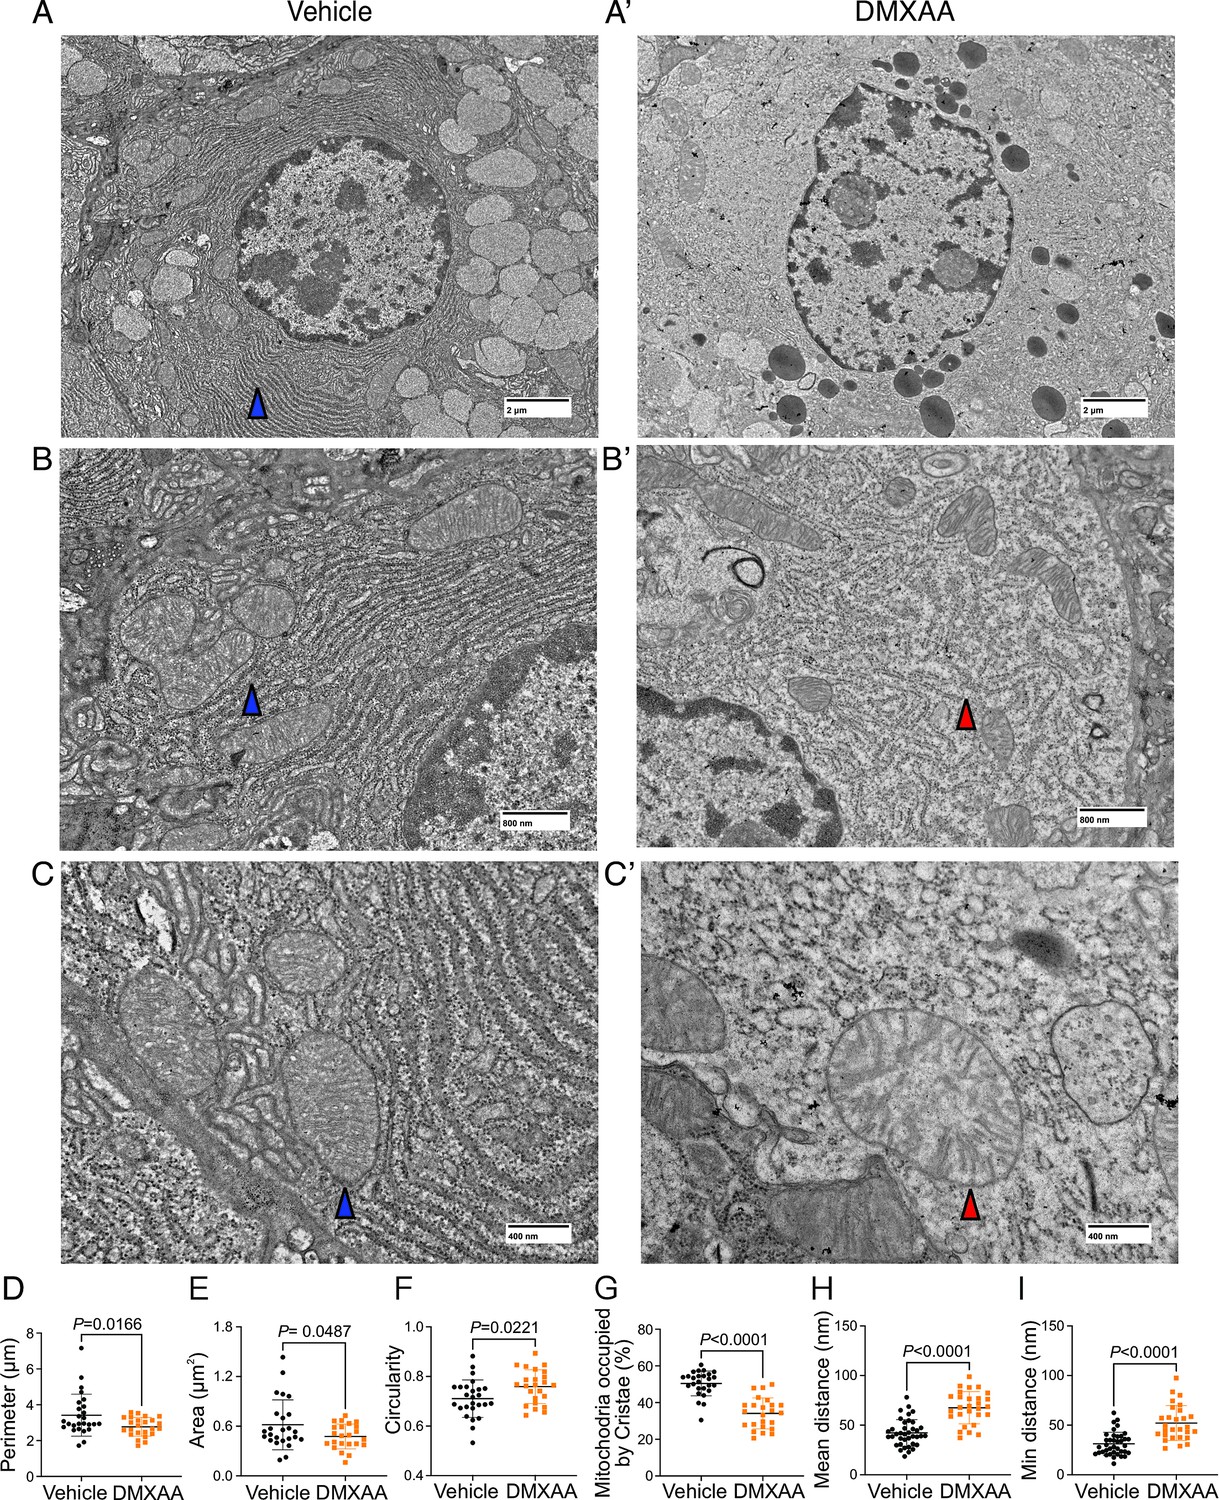
Ultrastructural analysis of mitochondria and endoplasmic reticulum (ER) in Sjögren's syndrome (SS) mouse model.
(A-C’') Images show mitochondrial cristae and ER structure by an electron microscopy (EM) at scales of (A-A’) 2 μm, (B-B’) 800 nm, and (C-C’) 400 nm. (D) Mitochondrial perimeter, (E) mitochondrial area, and (F) circularity were quantified by the shape description in ImageJ. (G) Quantification of mitochondrial cristae dispersion was evaluated by the percentage of cristae occupied in one mitochondrion. The (H) mean and (I) minimum proximity of ER and mitochondria were quantified by the plugin from http://sites.imagej.net/MitoCare/ in ImageJ. Vehicle: n=38 and SS mouse model: n=36 from 3 mice. Mean ± SD. Unpaired two-tailed t-test. Source data is included in Figure 9—source data 1.
-
Figure 9—source data 1
Raw mitochondrial morphology data.
- https://cdn.elifesciences.org/articles/97069/elife-97069-fig9-data1-v1.csv
Mitochondrial morphology is a dynamic process that is intimately associated with mitochondrial bioenergetics and alterations in both, occur in response to changes in cellular status (Hogan et al., 2005; Martínez et al., 2020; Navaratnarajah et al., 2021; Schaefer et al., 2019; Zorova et al., 2018) Therefore, we investigated if changes in morphology might be associated with the disrupted function of mitochondria in the disease model. We measured mitochondrial membrane potential (ΔΨm), established by the electrochemical H+ gradient, which is the driving force of ATP production. Isolated SMG acinar cells were loaded with TMRE, a ΔΨm-specific dye, and MitoTracker Green, to confirm mitochondrial localization and to facilitate the normalization of indicator loading. The maximal z-stacks projection images taken by confocal microscopy revealed colocalization of TMRE with MitoTracker Green (Figure 10A). The basal TMRE fluorescence was reduced in cells from DMXAA vs. vehicle-treated animals (Figure 10—figure supplement 1). To assess ΔΨm, we quantified the relative maximum dissipation of ΔΨm in DMXAA and vehicle-treated acinar cellsby the mitochondrial uncoupler, FCCP (Figure 10B). Consistent with the reduction in basal TMRE fluorescence, the change in TMRE fluorescence normalized to mitochondrial content revealed a marked reduction in ΔΨm in the acinar cells from the SS disease model (Figure 10C).
Figure 10 with 1 supplement see all
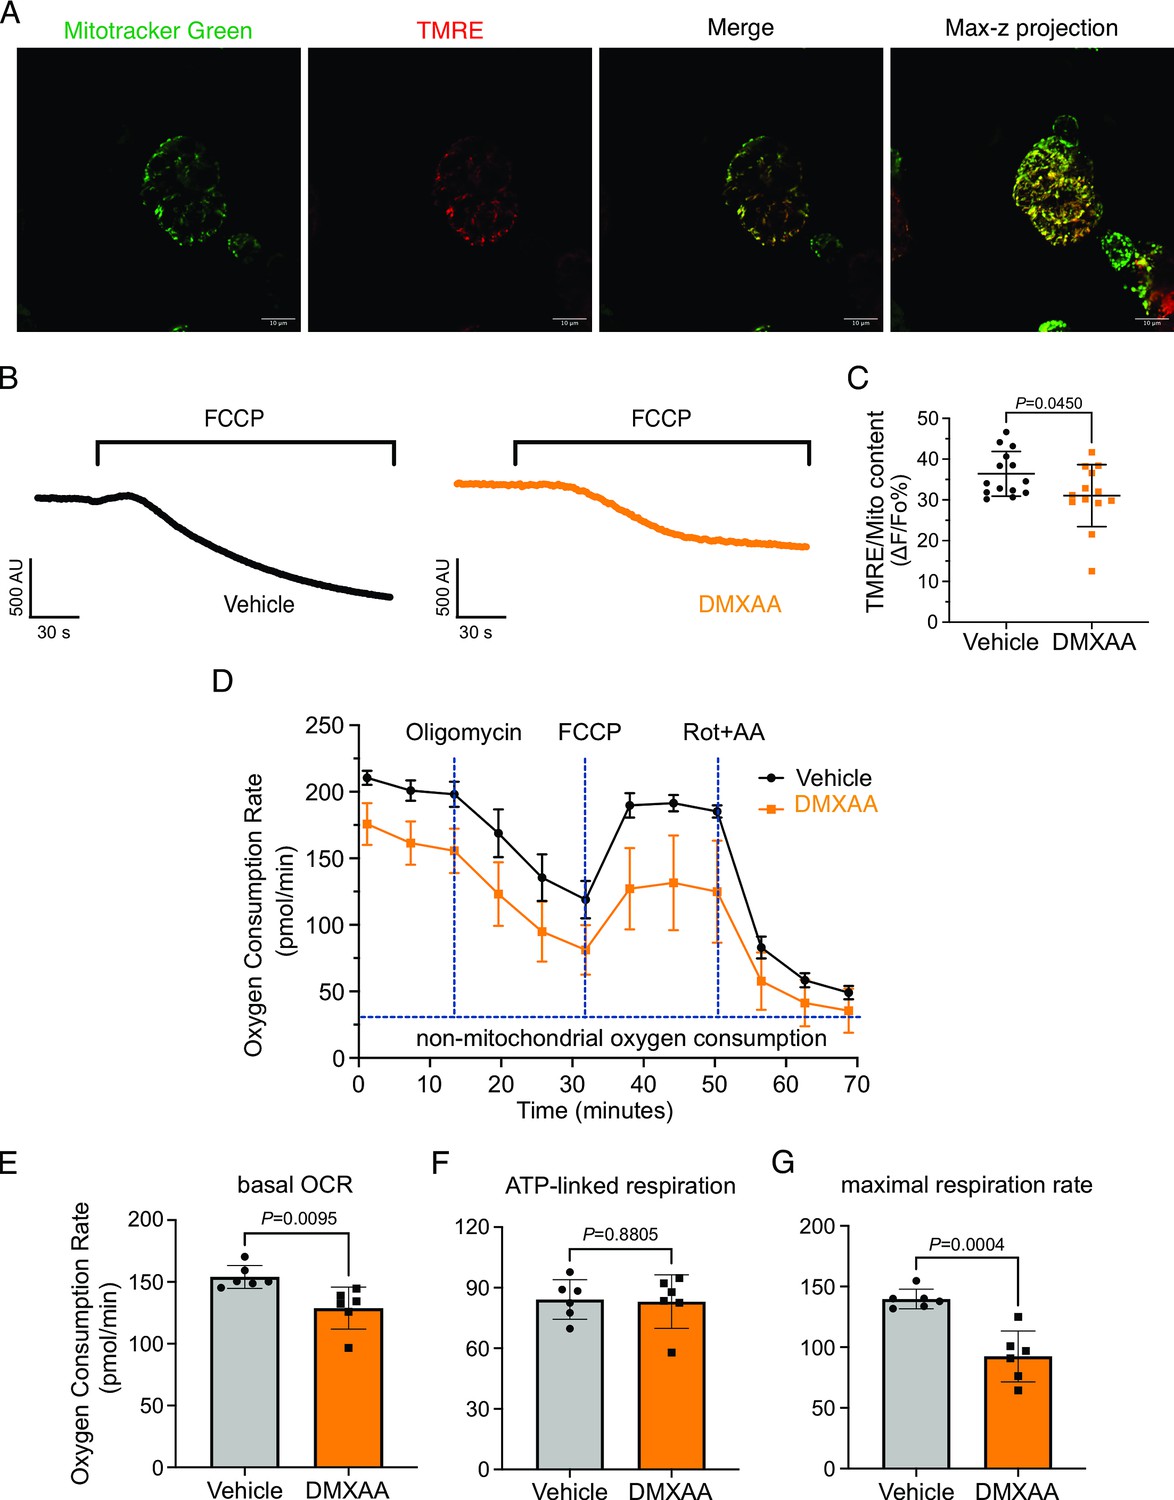
Mitochondrial bioenergetics are compromised in the 5,6-Dimethyl-9-oxo-9H-xanthene-4-acetic acid (DMXAA)-treated Sjögren's syndrome (SS) model.
(A) Mitochondria in the isolated acinar cells were labeled by the MitoTracker Green and co-stained with mitochondrial membrane potential dye, TMRE (red). The merged image shows the colocalization of both dyes, with maximal z-stack projection throughout the acinar cells. (B) Representative changes in mitochondrial membrane potential following FCCP-induced depolarization. The vehicle is shown in black; the SS mouse model is in orange. (C) The quantification was achieved by the difference of Tetramethylrhodamine, ethyl ester (TMRE) normalized to MitoTracker Green. Each dot is the mean of 10 cells from one experiment. Vehicle: n=14 and SS mouse model: n=13 from 3 mice. (D) Real-time mitochondrial respiration function was assessed in isolated acinar cells from the vehicle (black) and SS mouse model (orange) using the Seahorse XFe96 extracellular flux analyzer, in response to the pharmacological mito stress (oligomycin, FCCP, rotenone, and antimycin). Vehicle: n=59 and SS mouse model: n=32 from 6 mice. (E–G) Mitochondrial respiration function parameters were quantified by oxygen consumption rate (OCR) substracted the non-mitochondrial OCR for (E) basal respiration rate, (F) ATP-linked respiration rate, and (G) maximal respiration rate. Mean ± SD. Unpaired two-tailed t-test. Source data is included in Figure 10—source data 1.
-
Figure 10—source data 1
Raw mitochondrial bioenrgetics data.
- https://cdn.elifesciences.org/articles/97069/elife-97069-fig10-data1-v1.csv
An appropriate ΔΨm mitochondrial membrane potential is vital for maintaining bioenergetics (Zorova et al., 2018). Given that mitochondrial ΔΨm was significantly depolarized in DMXAA-treated animals, we next evaluated the OCR, a key metric of mitochondrial bioenergetic function in isolated SMG acinar cells. We employed sequential exposure to agents that target the function of the mitochondrial electron transport chain (ETC) using Seahorse technology (Figure 10D). Our results revealed a 25% reduction in basal OCR in the SS model compared to the control animals (at –25.25±7.89 pmol/min; Figure 10E). While ATP-linked respiration showed no significant difference in post-oligomycin-induced ETC Complex V blockade in both conditions (Figure 10F). Intriguingly, the FCCP-provoked maximal respiration rate, an indicator of stress tolerance, remarkably declined by 47%±9.19 after FCCP treatment in the SS model (Figure 10G). These data indicate impaired mitochondrial function and stress responses in the SS mouse model.
Discussion
SS is a complex inflammatory disease resulting from the intersection of genetics and environmental factors. This autoimmune disorder affects exocrine glands including salivary and lacrimal glands, leading to dry mouth and dry eyes, among other symptoms (Ramos-Casals et al., 2012; Mavragani and Basiaga, 2014; Brito-Zerón et al., 2016). SS animal models are crucial for understanding the pathogenesis, progression, and potential treatments for the disease, though like many animal models of disease, none can recapitulate all the aspects of SS. Currently, SS animal models are categorized as either those derived from genetically modified mice (Kiripolsky et al., 2017; Yanfei Hu et al., 1992; Shen et al., 2006; Shen et al., 2009) or those where disease is induced by specific agents or environmental factors. In the context of SS, DMXAA-induced SS can be used to mimic the early stages of the disease which might be triggered in response to bacterial or viral infection. This model is particularly effective in simulating type-1 interferon immune responses seen in early SS, which is thought to contribute to the initial glandular inflammation (Tabbara and Vera-Cristo, 2000; Papinska et al., 2018; Papinska et al., 2020). It should also be noted that DMXAA also has been reported to inhibit NAD(P)H quinone oxioreductase (Phillips, 1999) and thus the potential increase in free radical load in cells could contribute to the phenotype. The rapid symptom manifestation of disease in the DMXAA-induced model offers an advantage for investigating the early development of SS disease since DMXAA induction is a temporally controlled process, allowing the precise staging of disease onset, thus facilitating studies on the initiating events and ultimately potential early intervention and prevention strategies.
Our studies investigated stimulus-secretion coupling when fluid secretion from SMG and PG in response to physiological stimulation was significantly reduced. Previous work has established a crucial link between an increase in [Ca2+]i and stimulation of fluid secretion in the salivary glands (Melvin et al., 2005; Takano et al., 2021). Efficient secretion is reliant on the specific spatiotemporal regulation of secretagogue-stimulated [Ca2+]i signals. Given this idea, our initial hypothesis was that a deficiency in secretion after DMXAA administration could be due to reduced or disrupted secretagogue-stimulated [Ca2+]i signals. Indeed, previous work has revealed that in human SS patient acinar cells and the IL14α knock-in transgenic SS mouse model, CCh-induced [Ca2+] signals were diminished. This reduction was attributed to lower expression levels of the IP3R2 and IP3R3 proteins (Teos et al., 2015). To probe this hypothesis, we employed transgenic animals that express the fast Ca2+ indicator-GCaMP6f specifically in the acinar cells. Firstly, we validated that the activation of the STING pathway leads to similar salivary gland hypofunction in this genetic background. Surprisingly, DMXAA treatment led to a striking increase in the magnitude of neurally-induced spatially averaged [Ca2+]i signals. This observation is not consistent with the loss of IP3R proteins being responsible for reduced fluid secretion previously reported in other SS models. Indeed, the expression of IP3R proteins was unchanged following DMXAA treatment. The discrepancy could be attributed to the stage of SS disease represented by the previous studies, with our data presenting an earlier initiating phase of SS disease prior to progression, at a time point before any notable decrease in IP3R proteins has occurred. The molecular mechanism responsible for augmented global Ca2+ signals following DMXAA treatment requires further study. Increased Ca2+ release/influx, or conversely reduced Ca2+ clearance might be responsible. It is tempting to speculate that reduced mitochondrial Ca2+ uptake and/or reduced PMCA and SERCA activity as a result of decreased ATP levels may contribute to enhanced cytosolic signals. Nevertheless, we suggest that the augmented Ca2+ signals might represent a compensatory mechanism to drive fluid secretion in the face of compromised physiological stimulus-secretion coupling. Although the Ca2+ signals were not reduced, the spatiotemporal characteristics of the Ca2+ signal were markedly disrupted. Specifically, during neural stimulation, while in control animals there is a pronounced standing gradient of [Ca2+] such that the [Ca2+] is much greater in the apical vs. basal aspects of the cell, in DMXAA-treated animals this gradient is largely absent as large changes in Ca2+ are propagated to the basal regions of the cells. It is conceivable that the alteration in magnitude coupled with changes in the spatial characteristics of the Ca2+ signal contributes to both the defect in fluid secretion and downstream cellular changes including mitochondrial damage to ultimately result in the progression of disease.
We investigated whether changes in the secretory machinery per se were altered in DMXAA-treated animals to result in hyposecretion. Salivary gland fluid secretion is dependent on TMEM16a facilitating CI- flux across the apical PM as the driving force for water transport paracellularly and through AGP5 (Jin et al., 2016; Romanenko et al., 2010). The loss of either TMEM16a or AQP5 results in markedly attenuated fluid secretion (Romanenko et al., 2010; Tsubota et al., 2001; Catalán et al., 2015; Zeng et al., 2017). These findings indicate that alteration in expression level, localization, or regulation of these channels could potentially impact fluid secretion. Notably, in DMXAA-treated mice, the AQP5 expression and localization remain unchanged, consistent with a study in human labial minor salivary glands (Gresz et al., 2015). We next examined whether the TMEM16a channel function was compromised in the model. Our electrophysiological analysis revealed a significant decrease in TMEM16a activity following CCh-induced stimulation. Again, this reduced activity was not the result of overt mislocalization or lower expression levels of the protein (Figure 4A and C). Interestingly, although the secretagogue-stimulated TMEM16a was reduced in acinar cells from DMXAA-treated animals, the sensitivity of the channel to direct activation by Ca2+ in the patch pipette appeared unaffected. IP3R3 Ca2+ release channels on the ER are located approximately 50–100 nm from TMEM16a on the PM (Pages et al., 2019). In this microdomain, confocal microscopy cannot easily distinguish the distinct localization of TMEM16a/IP3R, despite their localization on different membranes. However, STED super-resolution microscopy provides a much higher spatial resolution, achieving 20–80 nm to enable the differentiation of proteins within 20–80 nm of each other. Data using STED microscopy, suggest that the microdomain between apical ER IP3R3 and apical PM TMEM16a is disrupted in the disease model. The severe fragmentation of ER observed in EM images from DMXAA-treated animals also is consistent with an alteration in the relationship between ER and other intracellular domains. The disruption of the relative localization of these channels could conceivably result in diminished TMEM16a activity, if activation is dependent on the local [Ca2+] in its vicinity. Our data showing that the slow Ca2+ buffer EGTA eliminates TMEM16a activation in the disease model, but that currents can still be evoked in vehicle-treated controls is consistent with the activation of TMEM16a by the local Ca2+ signal surrounding the channel rather than the global cytoplasmic Ca2+ signal (Jin et al., 2016; Shah et al., 2020; Wang et al., 2020). Thus, the disruption of this apical microdomain likely alters the local Ca2+ signal that TMEM16a experiences leading to reduced activation and fluid secretion.
While changes in cytosolic [Ca2+] are vitally important for stimulating ion flux and hence fluid secretion, Ca2+ is also critical for numerous other physiological processes in salivary gland acinar cells. We focused on the potential effects of the dysregulated Ca2+ signal on mitochondrial morphology and function. Secretion is an energy-demanding process, necessitating a constant supply of ATP for numerous functions, including vesicle transport, protein modification, membrane fusion, and maintaining ion gradients. For example, the Na+/K+ ATPase pump generates the Na+ gradient, driving Cl- transport into the cytosol of acinar cells through NKCC1, and SERCA pumps replenish ER Ca2+ levels. In this context, mitochondria are essential as they provide ATP, regulate Ca2+ homeostasis, supply metabolic intermediates, and coordinate with the ER to orchestrate cellular functions (Denton, 2009; Detmer and Chan, 2007). Notably, recent studies have highlighted that mitochondria are abundant and display varied positioning and dynamics in salivary gland cells (Porat-Shliom et al., 2019). In SS patients, there are notable alterations in mitochondrial structure, including swelling and disrupted cristae (Barrera et al., 2021; Li et al., 2022). Correspondingly, mitochondrial-related genes, particularly those involved in metabolism, dynamics, and the electron transport complex, are significantly affected (Li et al., 2022). Our data, employing fluorescent immunostaining and EM, mirrors these findings in DMXAA-treated animals. We observed that mitochondrial morphology is altered such that mitochondria are more swollen and rounded, with dispersed cristae, similar to that reported in human SS patients (Barrera et al., 2021). Since optimal mitochondrial bioenergetics are also dependent on Ca2+ signals, we assessed mitochondrial function by measuring the mitochondrial membrane potential (ΔΨm) using a membrane potential sensitive probe and the OCR using Seahorse technology. Our results show that in the SS mouse model, ΔΨm, which is critical for ATP synthesis, is diminished (Figure 10C). While the ATP-linked OCR remained unchanged, both the basal and maximal OCR were reduced. This suggests that mitochondrial functionality is compromised in the disease model, indicating a decreased capacity to respond to additional cellular stress. An intriguing question arises from these findings: are defects in the function of mitochondria a primary cause of fluid secretion loss in SS, or alternatively is this a consequence of disrupted [Ca2+]i regulation? Moreover, DNA from damaged mitochondria can activate the cGAS/STING pathway, leading to inflammation (Decout et al., 2021; Gao et al., 2013). This implies that compromised mitochondria in early SS stages could trigger prolonged inflammation through the STING pathway, potentially contributing to SS progression. Understanding these mechanisms is crucial for developing effective treatments to halt or slow the progression of SS.
Materials and methods
Key resources table
| Reagent type (species) or resource | Designation | Source or reference | Identifiers | Additional information |
|---|---|---|---|---|
| Strain, strain background (mouse) | C57BL/6 J | Jackson Laboratory | RRID:IMSR_JAX:000664 | 8–10 weeks-old female mice |
| Strain, strain background (mouse) | B6.129-Bhlha15tm3(cre/ERT2)Skz/J | Jackson Laboratory | RRID:IMSR_JAX:029228 | |
| Strain, strain background (mouse) | B6J.Cg-Gt(ROSA)26Sortm95.1(CAG-GCaMP6f)Hze/MwarJ | Jackson Laboratory | RRID:IMSR_JAX:028865 | |
| Chemical compound, drug | 5,6-dimethyl-9-oxo-9H-xanthene-4-acetic acid (DMXAA) | Vadimezan | GC16280 | Stock conc.: 10 mg/ml |
| Chemical compound, drug | Endotoxin 7.5% sodium bicarbonate solution | Sigma-Aldrich | S8761 | Working conc.: 5% |
| Chemical compound, drug | Pilocarpine | Millipore Sigma | P6503 | Stock conc.: 5.63 mg/ml Working conc: 1:100 |
| Antibody | Rabbit polyclonal TMEM16a antibody | Abcam | ab84115 | WB: 1:1000 IHC: 1:250 |
| Antibody | Mouse monoclonal alpha 1 Sodium Potassium ATPase antibody | Abcam | ab2872 | IHC: 1:250 |
| Antibody | Rabbit monoclonal alpha 1 Sodium Potassium ATPase antibody | Abcam | ab76020 | IHC: 1:500 |
| Antibody | Mouse monoclonal ATP5A antibody [15H4C4] | Abcam | ab14748 | IHC: 1:500 |
| Antibody | Rabbit monoclonal Aquaporin 5 antibody | Abcam | ab239904 | WB: 1:1000 IHC: 1:500 |
| Antibody | Rabbit monoclonal STING antibody (D2P2F) | Cell signaling Technology | #13647 | WB: 1:1000 IHC: 1:500 |
| Antibody | Rabbit polyclonal IP3R2 antibody (D2P2F) | PMID:33093175 | WB: 1:1000 IHC: 1:200 | |
| Antibody | Mouse monoclonal IP3R3 antibody (D2P2F) | BD Transduction Laboratory | 610313 | WB: 1:1000 IHC: 1:400 |
| Antibody | Mouse monoclonal Actin antibody | Millipore Sigma | A2228 | WB: 1:10000 |
| Antibody | Donkey anti-rabbit Alexa 488 | ThermoFisher Scientific | A-21206 | IHC: 1:500 |
| Antibody | Donkey anti-mouse Alexa 594 | ThermoFisher Scientific | A-21203 | IHC: 1:500 |
| Antibody | Goat anti-rabbit IgG (H&L) | Invitrogen | SA53557 | WB: 1:10000 |
| Antibody | Goat anti-mouse IgG (H&L) | Invitrogen | SA535521 | WB: 1:10000 |
| Chemical compound, drug | 4′,6-Diamidino-2-phenylindol (DAPI) | ThermoFisher Scientific | #62248 | IHC: 1:1000 |
| Chemical compound, drug | MitoTracker Green FM | InvitrogenTM | M7514 | Working conc.: 500 nM |
| Chemical compound, drug | Tetramethylrhodamine, ethyl ester (TMRE) | ThermoFisher Scientific | T669 | Working conc.: 20 nM |
| Chemical compound, drug | Oligomycin | Millipore Sigma | O4876 | Working conc.: 4 μg/ml |
| Chemical compound, drug | Carbonyl cyanide-p-trifluoromethoxyphenylhydrazone (FCCP) | Millipore Sigma | C2920 | Working conc.: 2 μM |
| Chemical compound, drug | Rotenone | Millipore Sigma | R8875 | Working conc.: 2 μM |
| Chemical compound, drug | Antimycin | Millipore Sigma | A8674 | Working conc.: 2 μM |
| Other | Collagenase Type II | Worthington Biochemical | LS004204 | Working conc.: 0.2 mg/ml Reference: https://doi.org/10.1074/jbc.M406201200 |
| Other | Tamoxifen | Sigma-Aldrich | T5648 | Reference: https://doi.org/10.7554/eLife.66170v |
| Software, algorithm | FIJI/Image | Fiji (imagej.net) | ||
| Software, algorithm | Prism | GraphPad |
All animal procedures were approved by the University of Rochester Committee on Animal Resources (UCAR-2001-214E).
Animals
The murine model of Sjögren’s syndrome was established through the induction of the STING pathway (Bagavant and Deshmukh, 2020). Briefly, 8–10 weeks old female C57BL/6 J wild-type (WT) mice (Jackson Laboratory; Jax 000664) received subcutaneous injections of DMXAA (Vadimezan; GC16280) at a concentration of 25 mg/kg of body weight on both day 0 and day 21 of the experimental timeline (see Figure 1). The control mouse received vehicle (5% sodium bicarbonate; Sigma-Aldrich; S8761), the DMXAA solvent at the corresponding time points. Experiments were performed on day 28 of the experimental timeline. Animals had access to water and were fed ad libitum. All animal procedures were approved by the University of Rochester Committee on Animal Resources (UCAR-2001-214E).
Evaluation of saliva production
Request a detailed protocolThe mice were fasted for 2 hr prior to the evaluation of saliva production. The mice were anesthetized with a solution containing Ketamine (10 mg/mL) and Xylazine (1 mg/ml) by intraperitoneal injection (IP) at a dose of 7 μl/gm body weight over 2 min. The mouse was placed on a heating pad at 37℃ during experimentation. A Salimetrics Children’s swab (Salimetrics; Cat. no. 5001.05) was placed within the oral cavity of each mouse. The mice were administered the muscarinic agonist pilocarpine (0.375 mg/kg body weight; Millipore Sigma; P6503) by IP injection. Two minutes after the pilocarpine injection, saliva was collected for the following 15 min. The saliva absorbed was subsequently separated from the moist swab through centrifugation at 10,000 rpm for 1 min. The measurement of saliva weight served as a quantitative evaluation of the efficacy of whole saliva secretion. To measure neurotransmitter-stimulated saliva secretion more directly, the mouse was anesthetized as previously described (Takano et al., 2021) and a surgical incision was made in the skin to expose the submandibular gland (SMG). The surrounding connective tissue was excised to facilitate positioning within a custom-made 3D-printed gland holder. A pair of stimulation electrodes were attached to the duct bundle and the SMG. The pre-weighed filter paper was positioned within the oral cavity of the mouse to capture saliva secretion. Secretion was initiated by electrical stimulation sequences generated by a stimulus isolator (Iso-flex, A.M.P.I.) set at 5 mA, 200 ms, at frequencies of 1, 3, 5, 7, and 10 Hz with train frequency and duration (typically 1 min) controlled by a train generator (DG2A, Warner Instruments). The interval between each stimulus was 3 min. After stimulation, the filter paper was removed and weighed. The difference between the weight of filter paper before and after the electrode stimulation represented the saliva produced by the respective salivary gland during the given stimulation period.
In vivo Ca2+ imaging
Request a detailed protocolTo generate mice expressing a fluorescent Ca2+ indicator in exocrine acinar cells, homozygous mice expressing the fast genetically encoded Ca2+ indicator GCaMP6f (B6J.Cg-Gt(ROSA)26Sortm95.1(CAG-GCaMP6f)Hze/MwarJ) floxed by a STOP cassette, were crossed with heterozygous tamoxifen-inducible Mist1 Cre mice (B6.129-Bhlha15tm3(cre/ERT2)Skz/J)A week before the DMXAA or 5% sodium bicarbonate injections, tamoxifen (Sigma-Aldrich; T5648) was given to the mice via oral gavage at a dose of 0.25 mg/g of body weight for three consecutive days to excise the loxP sites flanking the STOP codon allowing expression of the Ca2+ indicator within salivary glands. The mice were anesthetized and gland-exposed, as described previously (Takano et al., 2021; Takano and Yule, 2022). The immobilized gland was secured within the holder using a cover glass and maintained in Hank’s salt solution (HBSS). Ca2+ imaging was conducted in vivo via two-photon microscopy using an Olympus FVMPE-RS system equipped with an Insight X3 pulsed laser (Spectra-Physics) utilizing a heated (OKOLab COL2532) 25 x water immersion lens (Olympus XLPlan N 1.05 W MP). GCaMP6f was excited at 950 nm and emission collected between 495–540 nm, with images captured at 0.5 s intervals following stimulation for 10 s with 3 min between stimulation periods. Statistical analyses were performed with two-way ANOVA with multiple comparisons using Prism (GraphPad) as indicated in the figure legends.
Immunofluorescent staining for sliced tissue
Request a detailed protocolFollowing verification of decreased saliva secretion in mice, glands were processed for immunocytochemistry. Briefly, the isolated salivary glands were fixed in 4% paraformaldehyde at 4℃ overnight. The fixed gland was processed, embedded in paraffin, and subsequently sliced into 5 μm thick sections. Two temperature-induced antigen retrieval protocols were used either based on HIER buffer (10 mM Tris-base, 1 mM EDTA-dehydrate, pH 9.2) or sodium citrate buffer (10 mM sodium citrate, 0.05% Tween 20, pH 6.0). Gland sections were blocked with the 10% donkey serum in 0.2% PBSA (PBS + BSA) at room temperature (RT) for 1 hr. Sections were incubated with the primary antibody at 4℃ overnight (TMEM16a (Millipore Sigma; P6593; 1:250), Na+/K+ ATPase (Abcam; ab2872; 1:250), ATP5A (Abcam; ab14748; 1:500), AQP5 (Abcam; ab239904; 1:500), STING (Cell signaling Technology, Cat. 13647; 1:500)). Following washing, the sections were then incubated with the secondary antibody at RT for 1 hr (Donkey anti-rabbit Alexa 488 (Thermo Fisher Scientific; A-21206; 1:500), Donkey anti-mouse Alexa 594 (Thermo Fisher Scientific; A-21203; 1:500)). Nuclei were identified by incubation in DAPI (Thermo Fisher Scientific; Cat. 62248; 1:1000) at RT for 5 min. Tissue sections were mounted using Immu-Mount solution on a slide and then sealed under a coverslip. Images were acquired by Olympus FV1000MP confocal microscopy employing an Olympus UPlanSApo 60 x oil immersion objective. The analysis of images was performed using FIJI software. Statistical analyses were performed with a t-test using Prism (GraphPad) as indicated in the figure legends.
Patch clamp electrophysiology
Request a detailed protocolAcinar cells were allowed to adhere to Cell-Tak-coated glass coverslips for 15 min before experimentation. Coverslips were transferred to a chamber containing extracellular bath solution (155 mM tetraethylammonium chloride to block K+ channels, 2 mM CaCl2, 1 mM MgCl2, 10 mM HEPES, pH 7.2). Cl- currents in individual cells were measured in the whole cell patch clamp configuration using pClamp 9 and an Axopatch 200B amplifier (Molecular Devices). Recordings were sampled at 2 kHz and filtered at 1 kHz. Pipette resistances were 3–5 MΩ, and seal resistances were greater than 1 GΩ. Pipette solutions (pH 7.2) contained 60 mM tetraethylammonium chloride, 90 mM tetraethylammonium glutamate, 10 mM HEPES, 1 mM HEDTA (N-(2-hydroxyethyl) ethylenediamine-N, N’, N’-triacetic acid) and 20 μM CaCl2 were used to mimic physiological buffering and basal [Ca2+]i conditions (~100 nM Ca2+). Free [Ca2+] was estimated using Maxchelator freeware. Agonists were directly perfused onto individual cells using a multibarrel perfusion pipette. The pipette solution for the increased basal [Ca2+]i contained hEDTA and a free [Ca2+]i of 500 nM, 1 mM, or 5 mM to induce calcium-activated Cl- currents without the addition of any agonists. Experiments comparing EGTA, BAPTA, and HEDTA effects upon chloride currents induced by CCh stimulation contained 5 mM free concentrations of the chelator and 100 nM free [Ca2+] in the patch pipette. Chloride currents following agonist application were monitored with a single voltage step to 80 mV from a holding potential of –80 mV every second until current magnitudes reached a plateau. Current-voltage relationships were obtained by 20 mV incremental steps between –80 mv and 120 mV from a holding potential of –50 mV.
STED microscopy
Request a detailed protocol3D STED microscopy was performed using an Abberior Instruments Expert Line STED microscope equipped with an Olympus UPLSAPO 100x/1.4NA oil immersion objective. Briefly, lobules <1 mm were isolated following injection of saline beneath the capsule with a 29-gauge needle. The connecting tissue was digested in 0.1 mg/ml collagenase containing image buffer at 37℃ for 5 min. Then isolated lobules were fixed in 100% methanone at –20℃ for 5 min, and subsequently were blocked with 10% BSA in 0.1% PBST (PBS + 0.1% Tween20) at RT for 1 hr with gentle shaking. Isolated lobules were incubated with primary antibodies overnight at 4 °C (TMEM16a (Millipore Sigma; P6593; 1:300), IP3R3 (BD Transduction Laboratory; Cat. 610313; 1:200)). After being washed with 0.1% PBST, the membranes were incubated with secondary antibodies at RT for 1 hr (STAR RED, goat anti-rabbit IgG secondary antibody (Abberior, Cat#STRED-1001–500 UG; 1:1000), Alexa Fluor 594 anti-rabbit IgG secondary antibody (Molecular Probes Cat#A-11037; 1:1000)). The tissue was mounted on the slides with Prolong Gold antifade reagent (Invitrogen; Cat. P36930). Sequential confocal and STED images were obtained following excitation of Alexa Fluor 594 and STAR RED by 594 and 640 nm lasers, respectively. Both fluorophores were depleted in three dimensions with a 775 nm pulsed STED laser. Z-stacks were obtained by collecting images at 50 nm intervals using the 3D STED mode. Rescue STED was employed to minimize the light dosage. Blend mode depth projection images were generated and fluorophore volumes and interfaces between these volumes were analyzed using FIJI.
Seahorse XF cell mito stress assay
Request a detailed protocolIsolated SMGs were finely minced and subsequently resuspended in a solution composed of 0.5% bovine serum albumin (BSA) in Hank’s balanced salt solution (HBSS). To isolate acinar cells, the minced tissue was incubated in 0.5% BSA/HBSS containing 0.2 mg/ml of collagenase type II (Worthington; LS004204) for 30 min. Following this incubation, the suspension of cells was centrifuged at 500 rpm for 1 min and the cellular pellet was then resuspended in 40 μg/ml of Trypsin inhibitor (Millipore; Cat. 65035) to terminate further digestion. The function of mitochondria was assessed in isolated acinar cells by measurement of oxygen consumption rate (OCR) employing a Seahorse XF Cell Mito Stress Test system (Agilent, USA). Briefly, Equal sized SMG cell pellets were suspended in buffer and 10 μl of the acinar cell suspension was seeded into individual wells of Seahorse cell culture microplates coated with 10 uL of Cell-Tak (0.25 mg/ml) and the OCR was determined utilizing the Seahorse XFe96 extracellular flux analyzer following sequential exposure to 4 μg/ml oligomycin (Millipore Sigma; O4876), 4 µM carbonyl cyanide-4 (trifluoromethoxy)phenylhydrazone (FCCP; Millipore Sigma; C2920), and 0.5 µM rotenone/antimycin (Millipore Sigma; R8875; A8674) to measure the quantification of basal respiration, ATP-linked respiration, and maximum respiration rate, respectively. Statistical analyses were performed with a t-test using Prism (GraphPad) as indicated in the figure legends.
Measurement of mitochondrial membrane potential
Request a detailed protocolIsolated SMG acinar cells were loaded with 20 nM Tetramethylrhodamine, Ethyl Ester (TMRE; ThermoFisher Scientific: T669), and 1 μM of MitoTracker Green (Invitrogen; M7514). Fluorescence of both TMRE and MitoTracker Green was captured simultaneously using an inverted epifluorescence Nikon microscope with a 40 x oil immersion objective. The TMRE fluorescence was excited at 560 nm and emitted light collected at 574 nm; MitoTracker Green was excited at 488 nm and emitted light collected at 530 nm. Images were obtained every 1 s with an exposure of 20 ms and 4 × 4 binning using a digital camera controlled by TILL Photonics, TILLvision software. The acinar cells were exposed to 4 μM FCCP for 3 mins by perfusion to rapidly dissipate the membrane potential. Mitochondrial membrane potential was quantified as the change in the ratio of TMRE/MitoTracker Green fluorescence before and after the administration of FCCP. Statistical analyses were performed with a t-test using Prism (GraphPad) as indicated in the figure legends.
Western blotting
Request a detailed protocolFinely minced salivary glands were homogenized in a lysis buffer supplemented with protease inhibitor cocktail (Complete mini; Roche Diagnostics) for 16–20 strokes. After incubating on ice for 30 min, solubilized proteins were separated by centrifugation at 13,000 rpm at 4℃ for 30 min. 10 μg of protein lysate was loaded on 7.5–12% SDS- polyacrylamide gels. Subsequently, the proteins were transferred to PVDF membranes at a voltage of 35 V at 4 °C overnight. The membrane was blocked with 5% non-fat skimmed milk in TBST (50 mM Tris-HCl, pH 7.5 with 0.1% Tween20) at RT for 1 hr and subsequently incubated with primary antibodies overnight at 4 °C (Actin (Millipore Sigma; A2228; 1:10000), IP3R2 (Antibody Research Corporation; 1:1000), IP3R3 (BD Transduction Laboratory; Cat. 610313; 1:1000), TMEM16a (Abcam; ab84115; 1:1000)). After being washed with 0.1% TBST, the membranes were incubated with secondary antibodies at RT for 1 hr (Goat anti-rabbit IgG (H&L) (Invitrogen; SA535571; 1:10000), Goat anti-mouse IgG (H&L) (Invitrogen; SA535521; 1:10000)). Protein band intensity from western blotting was quantified by FIJI. The relative ratio of DMXAA-treated/vehicle control was calculated in Excel. Lastly, graphical generation and statistics were performed with a t-test using Prism (GraphPad) as indicated in the figure legends.
Data availability
All data generated and analyzed in this study are included in the manuscript and supporting files.
References
-
Protocols for experimental sjögren’s syndromeCurrent Protocols in Immunology 131:e114.https://doi.org/10.1002/cpim.114
-
The secretion, components, and properties of salivaAnnual Review of Food Science and Technology 4:267–276.https://doi.org/10.1146/annurev-food-030212-182700
-
Structural and functional features and significance of the physical linkage between ER and mitochondriaThe Journal of Cell Biology 174:915–921.https://doi.org/10.1083/jcb.200604016
-
The cGAS-STING pathway as a therapeutic target in inflammatory diseasesNature Reviews. Immunology 21:548–569.https://doi.org/10.1038/s41577-021-00524-z
-
Regulation of mitochondrial dehydrogenases by calcium ionsBiochimica et Biophysica Acta 1787:1309–1316.https://doi.org/10.1016/j.bbabio.2009.01.005
-
Overview of human salivary glands: Highlights of morphology and developing processesAnatomical Record 300:1180–1188.https://doi.org/10.1002/ar.23569
-
Functions and dysfunctions of mitochondrial dynamicsNature Reviews. Molecular Cell Biology 8:870–879.https://doi.org/10.1038/nrm2275
-
Mitochondria and calcium: from cell signalling to cell deathThe Journal of Physiology 529 Pt 1:57–68.https://doi.org/10.1111/j.1469-7793.2000.00057.x
-
Physiology of intracellular calcium bufferingPhysiological Reviews 103:2767–2845.https://doi.org/10.1152/physrev.00042.2022
-
Recent advances in mouse models of sjögren’s syndromeFrontiers in Immunology 11:1158.https://doi.org/10.3389/fimmu.2020.01158
-
Methods for imaging mammalian mitochondrial morphology: A prospective on MitoGraphAnalytical Biochemistry 552:81–99.https://doi.org/10.1016/j.ab.2018.02.022
-
A review of saliva: Normal composition, flow, and functionThe Journal of Prosthetic Dentistry 85:162–169.https://doi.org/10.1067/mpr.2001.113778
-
Activation of Ca(2+) -activated Cl(-) channel ANO1 by localized Ca(2+) signalsThe Journal of Physiology 594:19–30.https://doi.org/10.1113/jphysiol.2014.275107
-
Current concepts on Sjögren’s syndrome - classification criteria and biomarkersEuropean Journal of Oral Sciences 126 Suppl 1:37–48.https://doi.org/10.1111/eos.12536
-
Polarized expression of Ca2+ channels in pancreatic and salivary gland cellsJournal of Biological Chemistry 272:15765–15770.https://doi.org/10.1074/jbc.272.25.15765
-
Animal models in autoimmune diseases: lessons learned from mouse models for Sjögren’s syndromeClinical Reviews in Allergy & Immunology 42:35–44.https://doi.org/10.1007/s12016-011-8288-5
-
Mitochondrial bioenergetics and dynamics in secretion processesFrontiers in Endocrinology 11:319.https://doi.org/10.3389/fendo.2020.00319
-
Regulation of fluid and electrolyte secretion in salivary gland acinar cellsAnnual Review of Physiology 67:445–469.https://doi.org/10.1146/annurev.physiol.67.041703.084745
-
The relevance of mitochondrial morphology for human diseaseThe International Journal of Biochemistry & Cell Biology 134:105951.https://doi.org/10.1016/j.biocel.2021.105951
-
A model of [formula: see text] dynamics in an accurate reconstruction of parotid acinar cellsBulletin of Mathematical Biology 81:1394–1426.https://doi.org/10.1007/s11538-018-00563-z
-
Activation of stimulator of interferon genes (STING) and sjögren syndromeJournal of Dental Research 97:893–900.https://doi.org/10.1177/0022034518760855
-
Pulmonary involvement in a mouse model of sjögren’s syndrome induced by STING activationInternational Journal of Molecular Sciences 21:4512.https://doi.org/10.3390/ijms21124512
-
Salivary secretion in health and diseaseJournal of Oral Rehabilitation 45:730–746.https://doi.org/10.1111/joor.12664
-
Tmem16A encodes the Ca2+-activated Cl- channel in mouse submandibular salivary gland acinar cellsThe Journal of Biological Chemistry 285:12990–13001.https://doi.org/10.1074/jbc.M109.068544
-
Salivary hypofunction: an update on aetiology, diagnosis and therapeuticsArchives of Oral Biology 60:242–255.https://doi.org/10.1016/j.archoralbio.2014.10.004
-
Local Ca2+ signals couple activation of TRPV1 and ANO1 sensory ion channelsScience Signaling 13:eaaw7963.https://doi.org/10.1126/scisignal.aaw7963
-
Development of autoimmunity in IL-14alpha-transgenic miceJournal of Immunology 177:5676–5686.https://doi.org/10.4049/jimmunol.177.8.5676
-
IL-14 alpha, the nexus for primary Sjögren’s disease in mice and humansClinical Immunology 130:304–312.https://doi.org/10.1016/j.clim.2008.10.006
-
Sjögren syndromeCurrent Opinion in Ophthalmology 11:449–454.https://doi.org/10.1097/00055735-200012000-00011
-
In vivo Ca2+ imaging in mouse salivary glandsBIO-PROTOCOL 12:e4380.https://doi.org/10.21769/BioProtoc.4380
-
Functional changes in salivary glands of autoimmune disease-prone NOD miceJournal of Physiology 263:E607–E614.https://doi.org/10.1152/ajpendo.1992.263.4.E607
-
Mitochondrial membrane potentialAnalytical Biochemistry 552:50–59.https://doi.org/10.1016/j.ab.2017.07.009
Article and author information
Author details
Funding
National Institute of Dental and Craniofacial Research (DE014756)
- Takahiro Takano
The funders had no role in study design, data collection and interpretation, or the decision to submit the work for publication.
Acknowledgements
The authors gratefully acknowledge the University of Rochester’s Center for Advanced Microscopy and Nanoscopy (CALMN) for providing access to Multiphoton microscopy for in vivo live imaging and STED super-resolution microscopy, and for Center for Advanced Research Technologies (CART) for the Electron & cryo Microscopy Resource. We also thank the Flow Cytometry Resource (FCR) for its support with the mitochondrial stress assay. Special thanks to Dr. Paul Brooks for sharing Seahorse Technology XF analyzers and for engaging in discussions for optimization of experiments. Thanks to Dr. Catherine Ovitt for her instruction on tissue staining techniques. Additionally, we wish to express our appreciation to all members of the Yule laboratory for their invaluable feedback, discussions, and assistance, which have been essential in advancing this study. The work was supported by a grant from NIH (NIDCR) DE014756 (to DIY).
Ethics
All animal procedures were approved by the University of Rochester Committee on Animal Resources (UCAR-2001-214E).
Version history
- Preprint posted:
- Sent for peer review:
- Reviewed Preprint version 1:
- Reviewed Preprint version 2:
- Version of Record published:
Cite all versions
You can cite all versions using the DOI https://doi.org/10.7554/eLife.97069. This DOI represents all versions, and will always resolve to the latest one.
Copyright
© 2024, Huang et al.
This article is distributed under the terms of the Creative Commons Attribution License, which permits unrestricted use and redistribution provided that the original author and source are credited.
Metrics
-
- 1,509
- views
-
- 196
- downloads
-
- 16
- citations
Views, downloads and citations are aggregated across all versions of this paper published by eLife.
Citations by DOI
-
- 14
- citations for umbrella DOI https://doi.org/10.7554/eLife.97069
-
- 2
- citations for Reviewed Preprint v1 https://doi.org/10.7554/eLife.97069.1
Download links
A two-part list of links to download the article, or parts of the article, in various formats.
Downloads (link to download the article as PDF)
Open citations (links to open the citations from this article in various online reference manager services)
Cite this article (links to download the citations from this article in formats compatible with various reference manager tools)
Dysregulated Ca2+ signaling, fluid secretion, and mitochondrial function in a mouse model of early Sjögren’s disease
eLife 13:RP97069.
https://doi.org/10.7554/eLife.97069.3


