Evolution of histone 2A for chromatin compaction in eukaryotes
- University of California, Los Angeles, United States
- Eli and Edythe Broad Center of Regenerative Medicine and Stem Cell Research, David Geffen School of Medicine, University of California, Los Angeles, United States
Figures
Figure 1 with 2 supplements
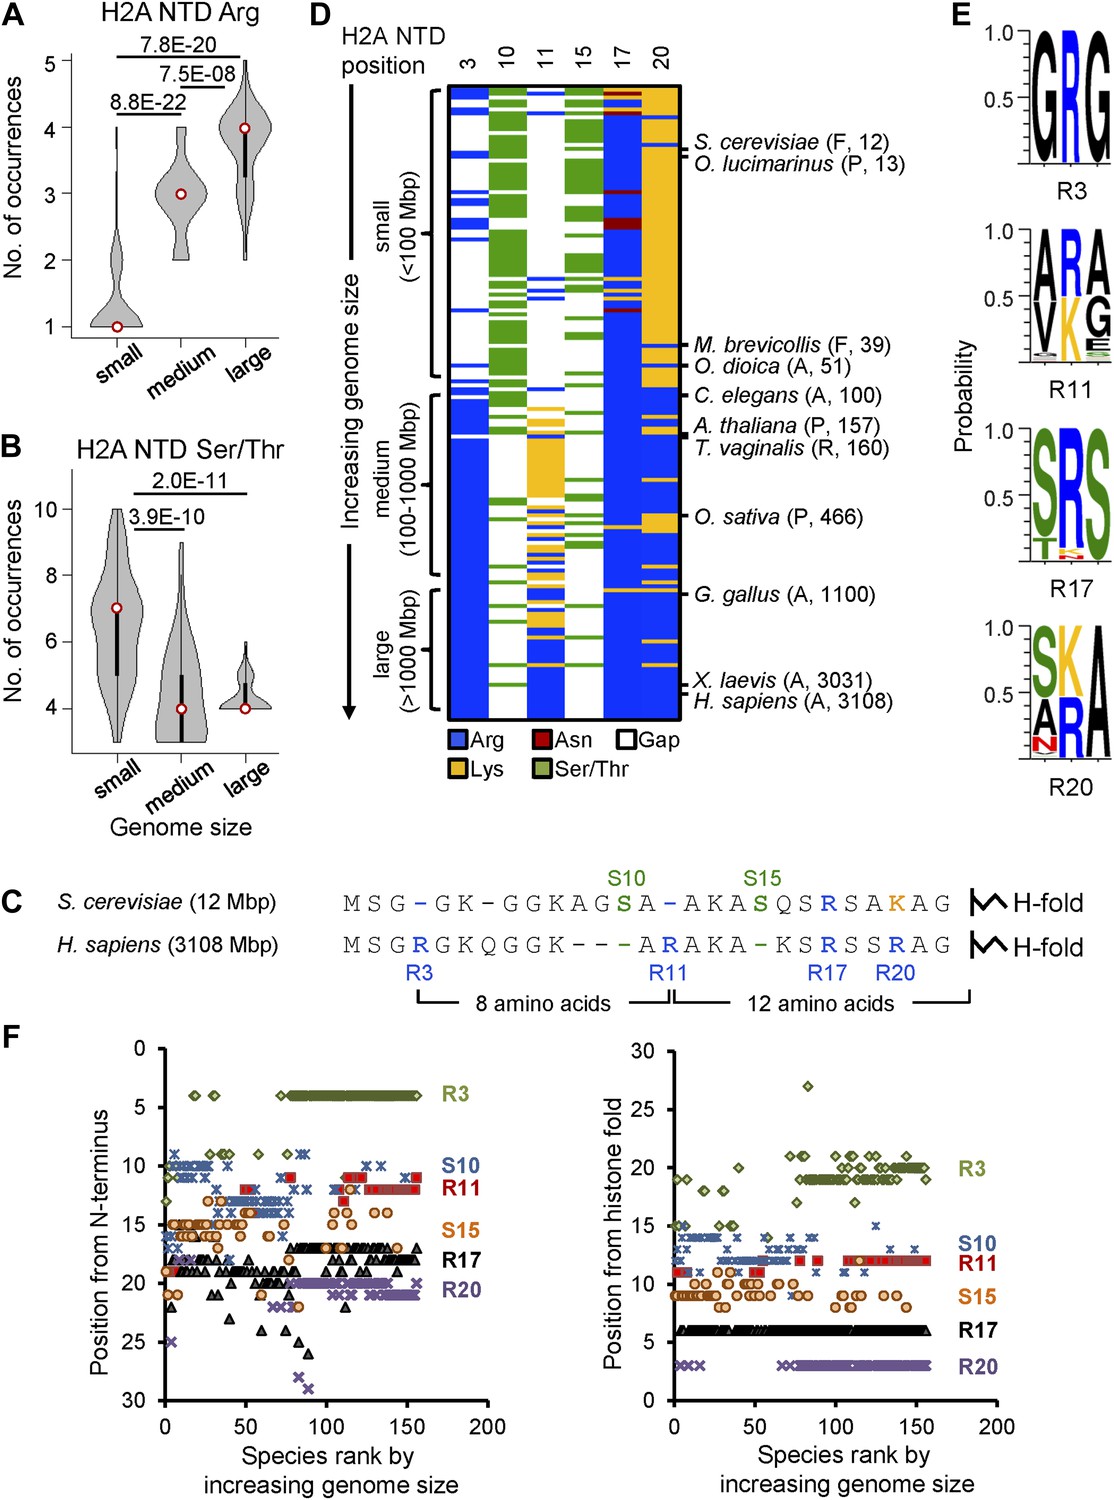
Histone H2A N-terminal sequence has co-evolved with genome size.
Violin plots of the number of (A) arginines or (B) serines/threonines in the H2A NTD for species with small, medium, and large genomes. Plot widths correspond to species frequency within each group. (C) H2A NTD sequences for S. cerevisiae and H. sapiens. (D) Heat map of H2A NTD residue composition at the indicated positions ordered by genome size. Example species are shown with kingdom and genome size information. (E) Protein sequence motifs surrounding the four H2A NTD arginine residues. (F) Positioning of evolutionarily variable residues relative to the H2A N-terminus (left) or histone fold (right). See also Figure 1—figure supplements 1 and 2.
-
Figure 1—source data 1
H2A multiple sequence alignments, heat map data, and canonical H2A isoforms.
- https://doi.org/10.7554/eLife.02792.004
Figure 1—figure supplement 1
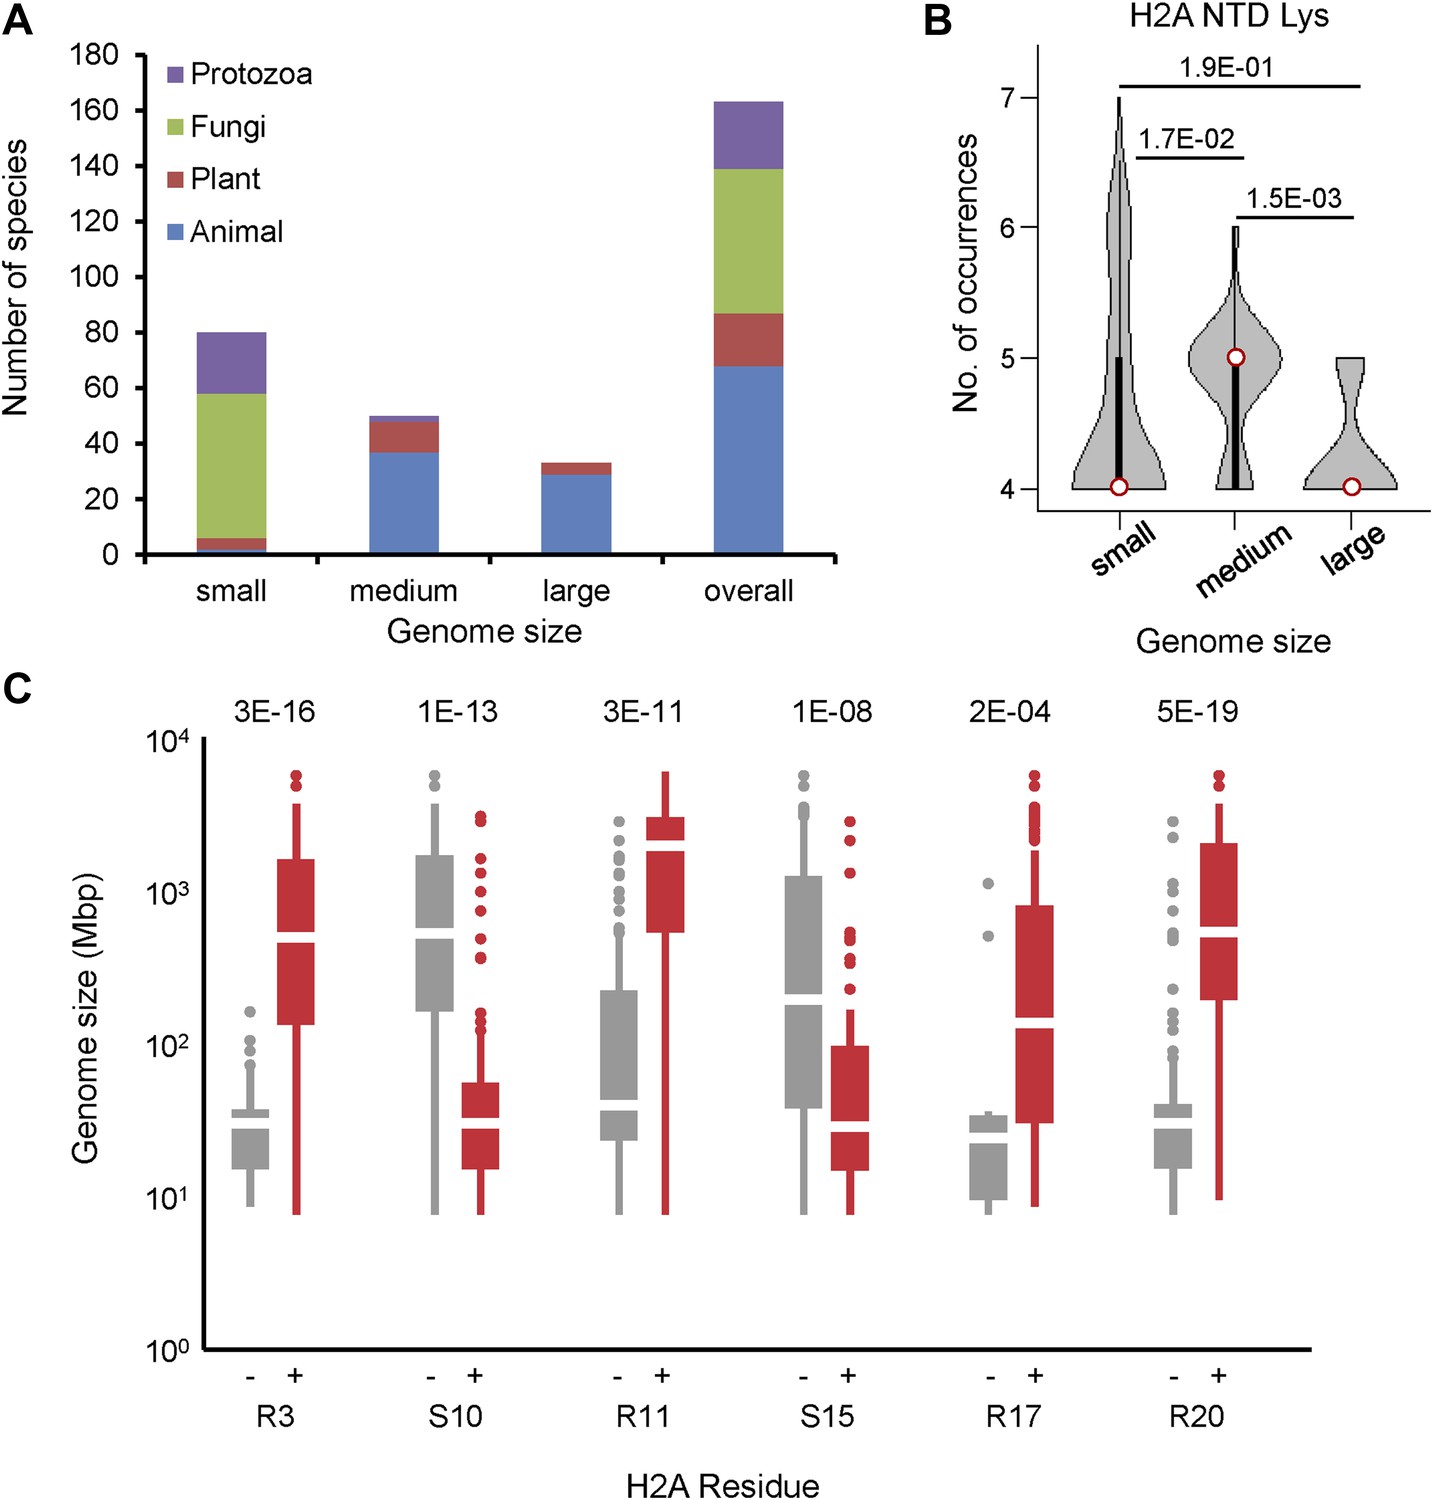
Phylogenetic distribution of species analyzed in this paper.
(A) The bar graph indicates the number and proportion of organisms in our data set that belong to the indicated phylogenetic kingdoms for each genome size category. (B) Violin plots of the number of lysines in the H2A NTD grouped by genome size as in Figure 1. (C) Boxplot of genome sizes of the organisms which have an H2A without (left) or with (right) the indicated residue. p-values (Mann–Whitney U test) of the difference in means between the absence or presence of the indicated residue are indicated.
Figure 1—figure supplement 2
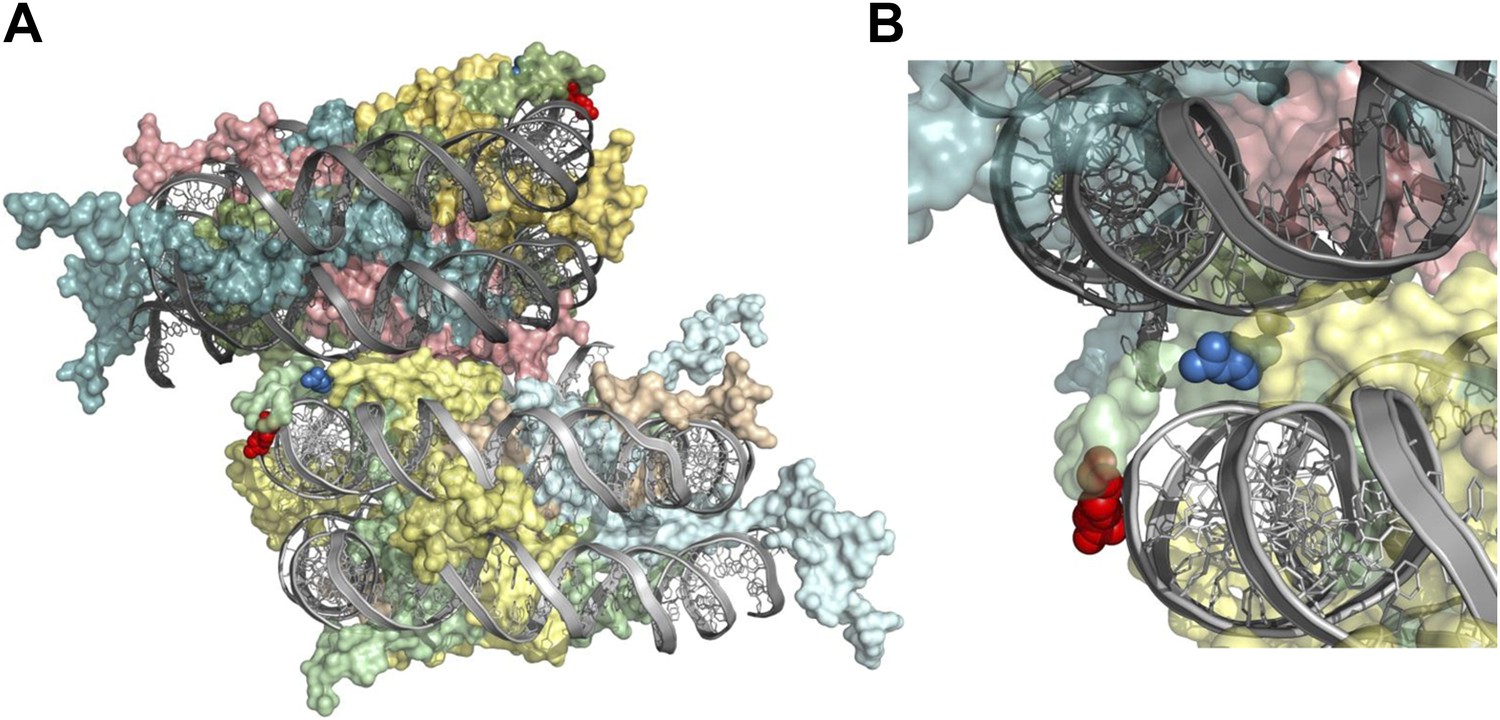
H2A arginines 3 and 11 are situated adjacent to DNA within the nucleosome.
Structure of a di-nucleosome obtained from the crystal lattice of a mono-nucleosome structure is shown from (A) the side or (B) close up highlighting potential intra- and inter-nucleosomal interactions between arginines and DNA backbones. Green is H2A, yellow is H2B, cyan is H3, and salmon is H4. The red and blue spheres are R3 and R11, respectively, both of which are in chain C (Davey et al., 2002).
Figure 2 with 1 supplement
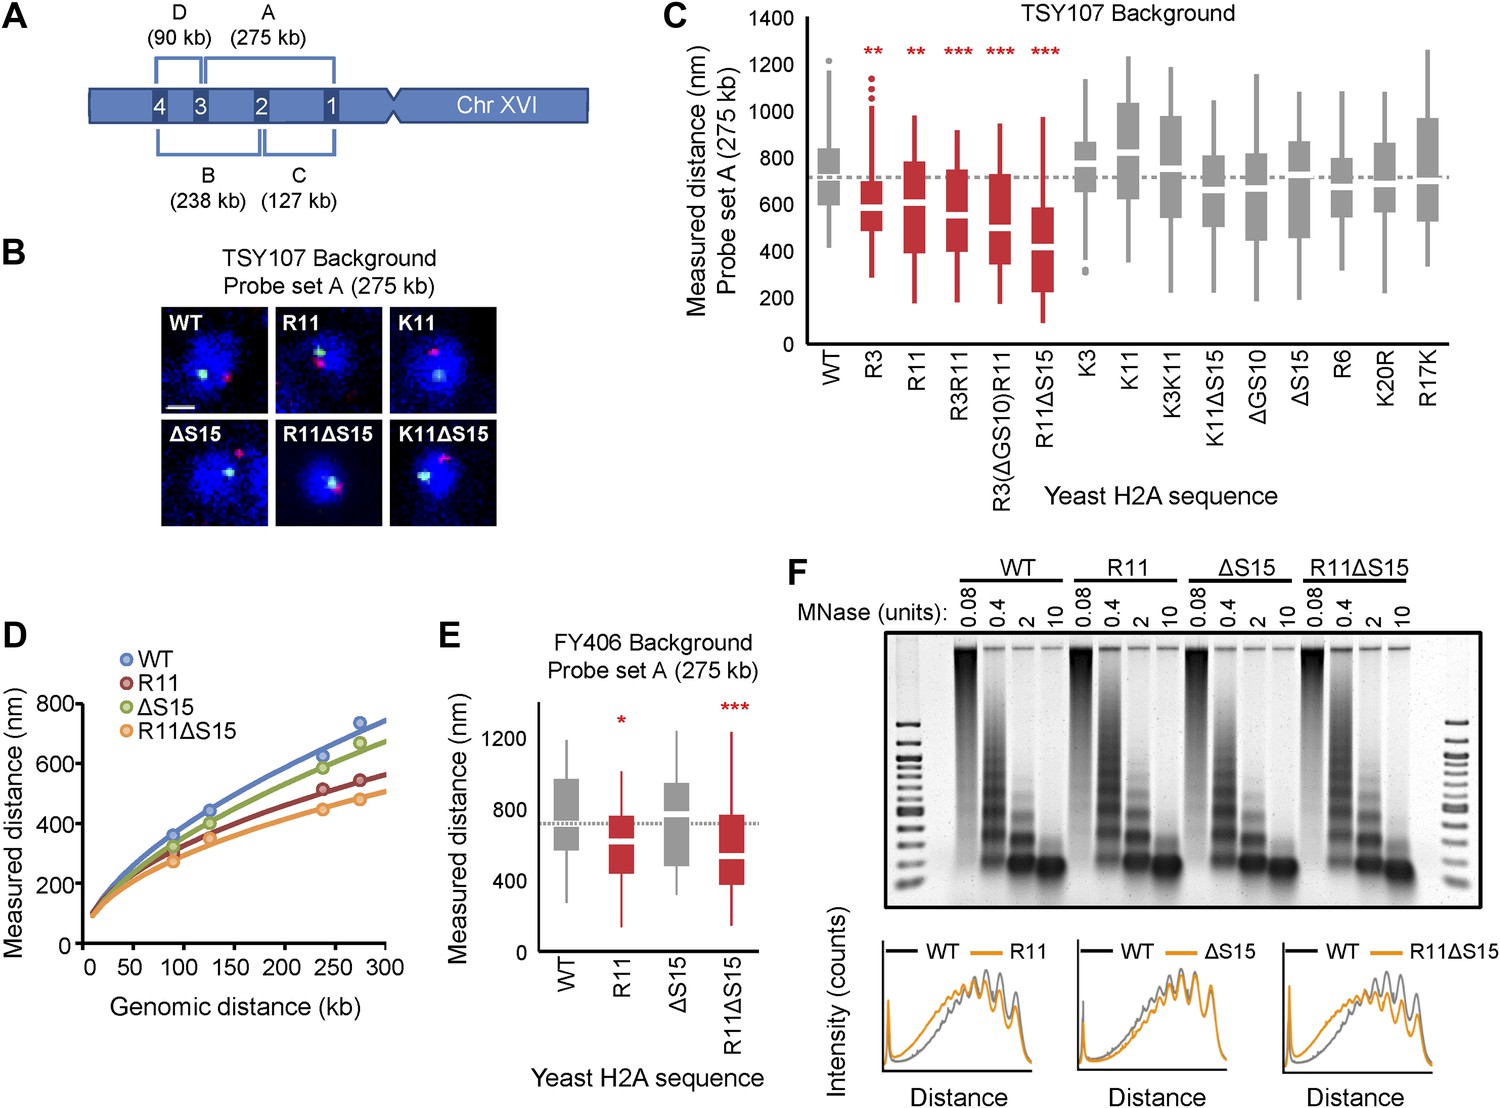
Ectopic expression of H2A NTD arginines causes compaction in yeast.
(A) Schematic position of probes on chromosome XVI that were used for FISH. The letters correspond to the probe sets. (B) FISH images and (C) boxplot of the distributions of interprobe distances for probe set A in the indicated strains. (D) The mean interprobe distances for the indicated yeast strains for probe sets A, B, C, and D are plotted as a function of genomic distance. Solid lines are best fit equations. (E) Boxplot of the distributions of interprobe distances for probe set A in the indicated strains. Dashed lines mark the median value for the WT strain. The boxplot whiskers contain 90% of the data. All scale bars are 1 µm. Boxes are colored if the mean of the indicated strain is significantly different from WT. Red stars denote level of significance: *p<0.01; **p<0.001; ***p<0.0001 (For exact values, see Supplementary file 2). (F) Agarose gel electrophoresis of MNase-digested chromatin in the indicated strains including the densitometric profiles comparing the WT to each of the mutant H2A strains for a given amount of enzyme. See also Figure 2—figure supplement 1.
Figure 2—figure supplement 1
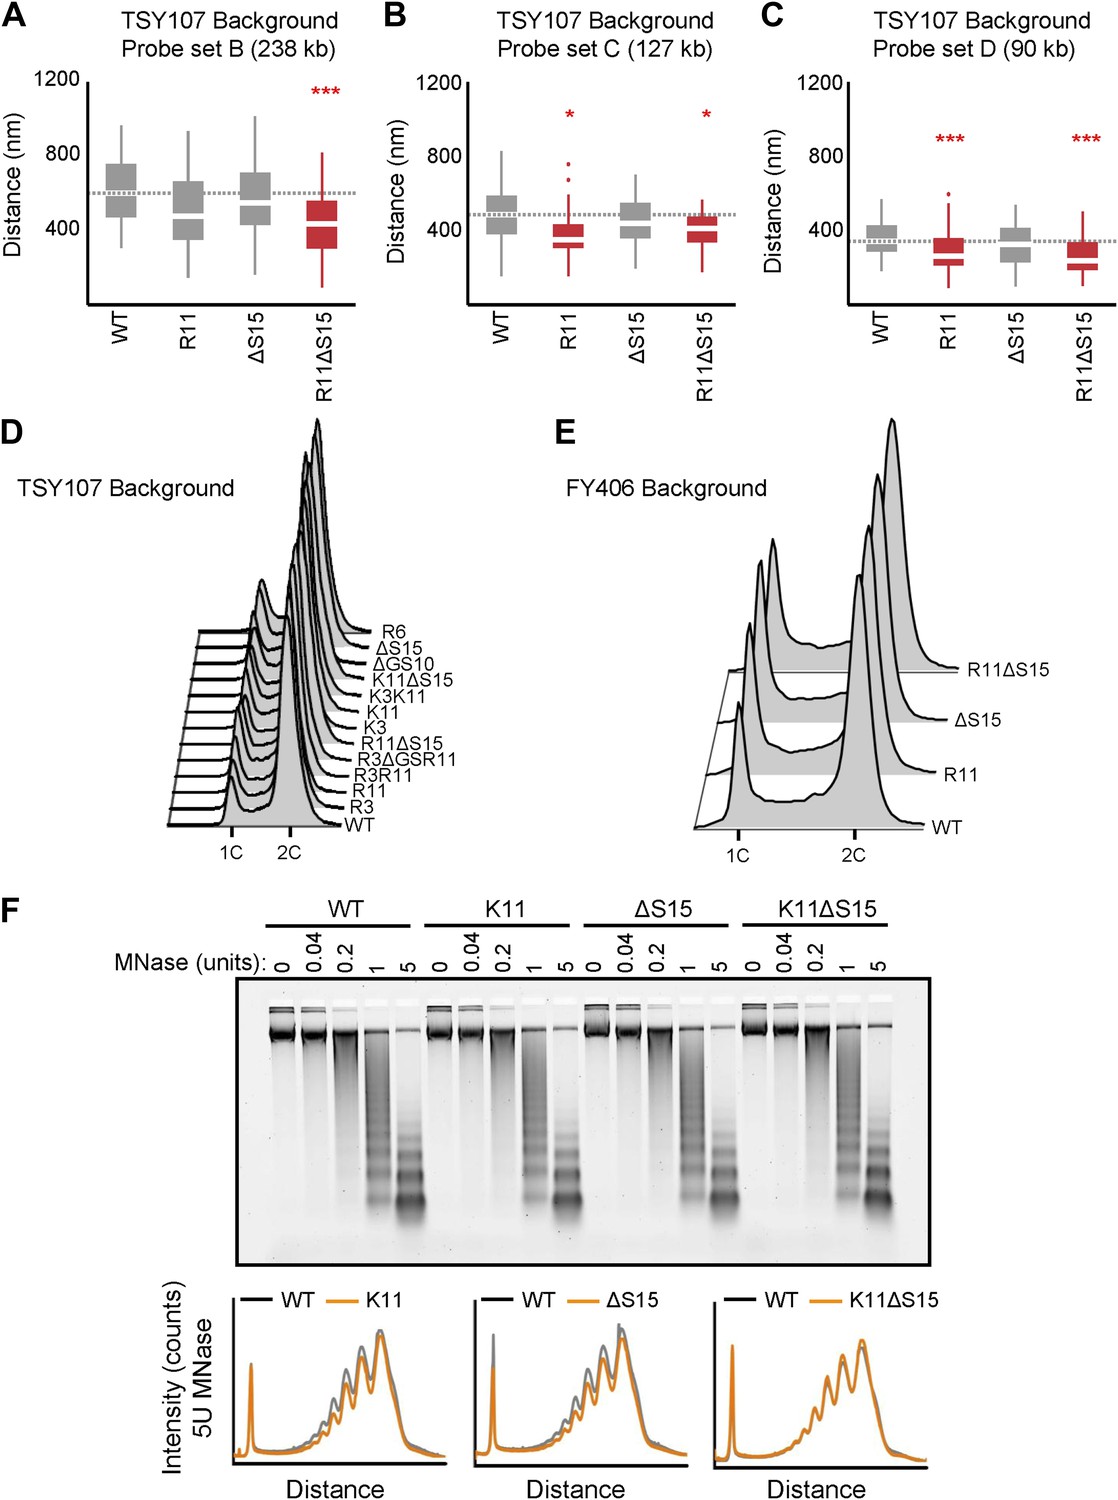
Ectopic expression of H2A NTD arginines causes compaction in yeast.
(A–C). Boxplot of the distributions of interprobe distances in the indicated H2A mutant strains for probe sets B, C, and D as shown in Figure 3A. Boxes are colored if the mean of the indicated strain is significantly different from WT. Red stars denote level of significance: *p<0.01; ***p<0.0001 (Supplementary file 2). Cell cycle analysis of yeast strains in the TSY107 (D) or FY406 (E) background. 1C and 2C refer to G1 and G2 DNA content, respectively. Note that the WT strains (TSY107, FY406) carry one copy of the H2A gene on a plasmid with the two chromosomal copies deleted (Schuster et al., 1986; Hirschhorn et al., 1995). Dosage alterations of the H2A protein cause G2/M arrest (Sopko et al., 2006) which is evident in our WT strains. Nonetheless, all the mutants display highly similar cell cycle profiles. (F) Agarose gel electrophoresis of MNase-digested chromatin in the indicated strains. The amount of enzyme used to digest chromatin is indicated. Also shown are the densitometric profiles of the agarose gel that compares WT to each of the indicated mutant H2A strains for a given amount of enzyme.
Figure 3 with 1 supplement
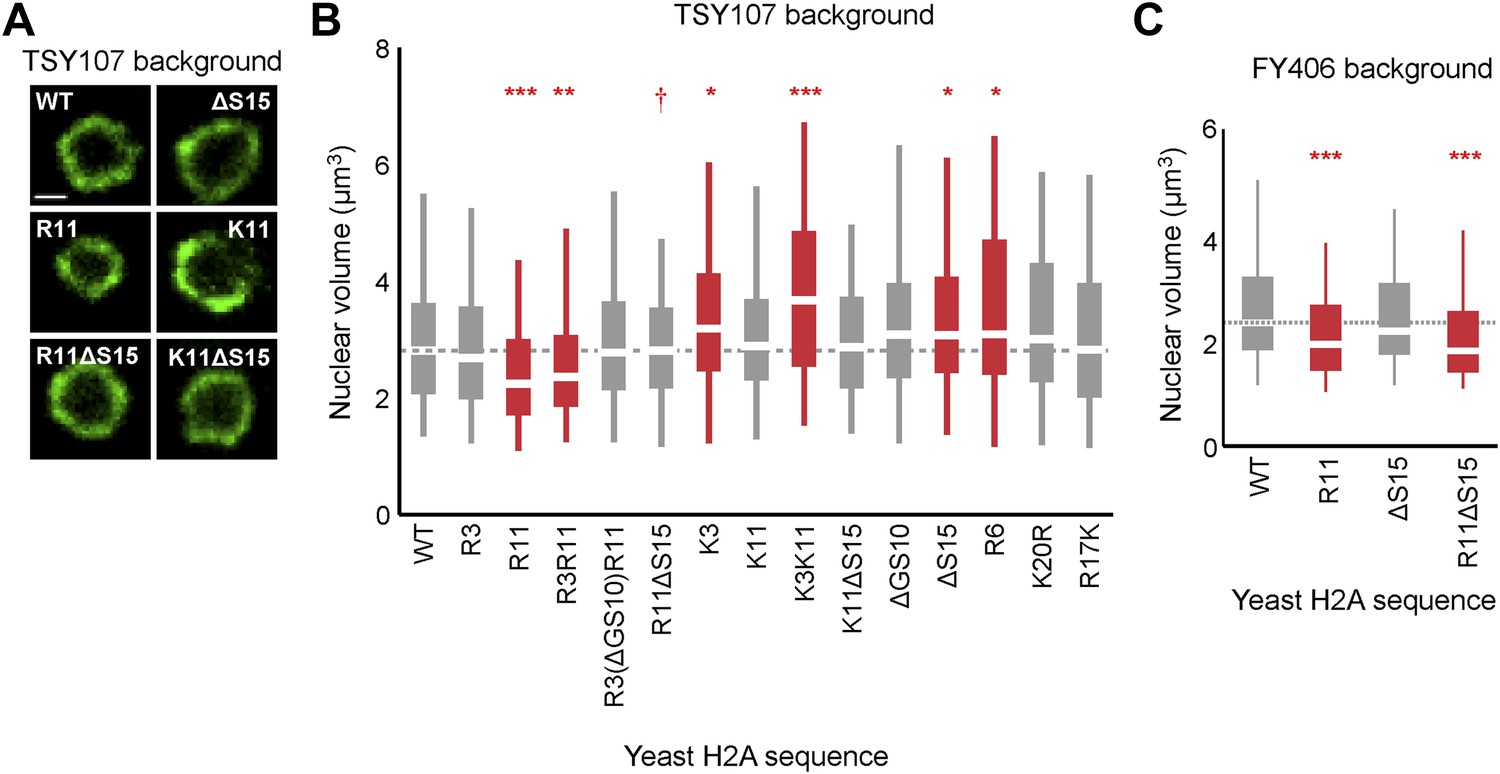
Ectopic expression of H2A NTD arginines decreases nuclear volume in yeast.
(A) Images of the nuclear envelope, as visualized by Nup49p-GFP, and boxplot of the distributions of nuclear volumes in the indicated strains in the TSY107 background (B) or the FY406 background (C). Dashed lines mark the median value for the WT strain. The boxplot whiskers contain 90% of the data. All scale bars are 1 µm. Boxes are colored if the mean of the indicated strain is significantly different from WT. Red stars denote level of significance: *p<0.01; **p<0.001; ***p<0.0001 (Supplementary file 3). Red dagger (†) indicates that mean nuclear volume of R11ΔS15 is significantly smaller than its isogenic WT strain (ΔS15; p<0.001). See also Figure 3—figure supplement 1.
Figure 3—figure supplement 1
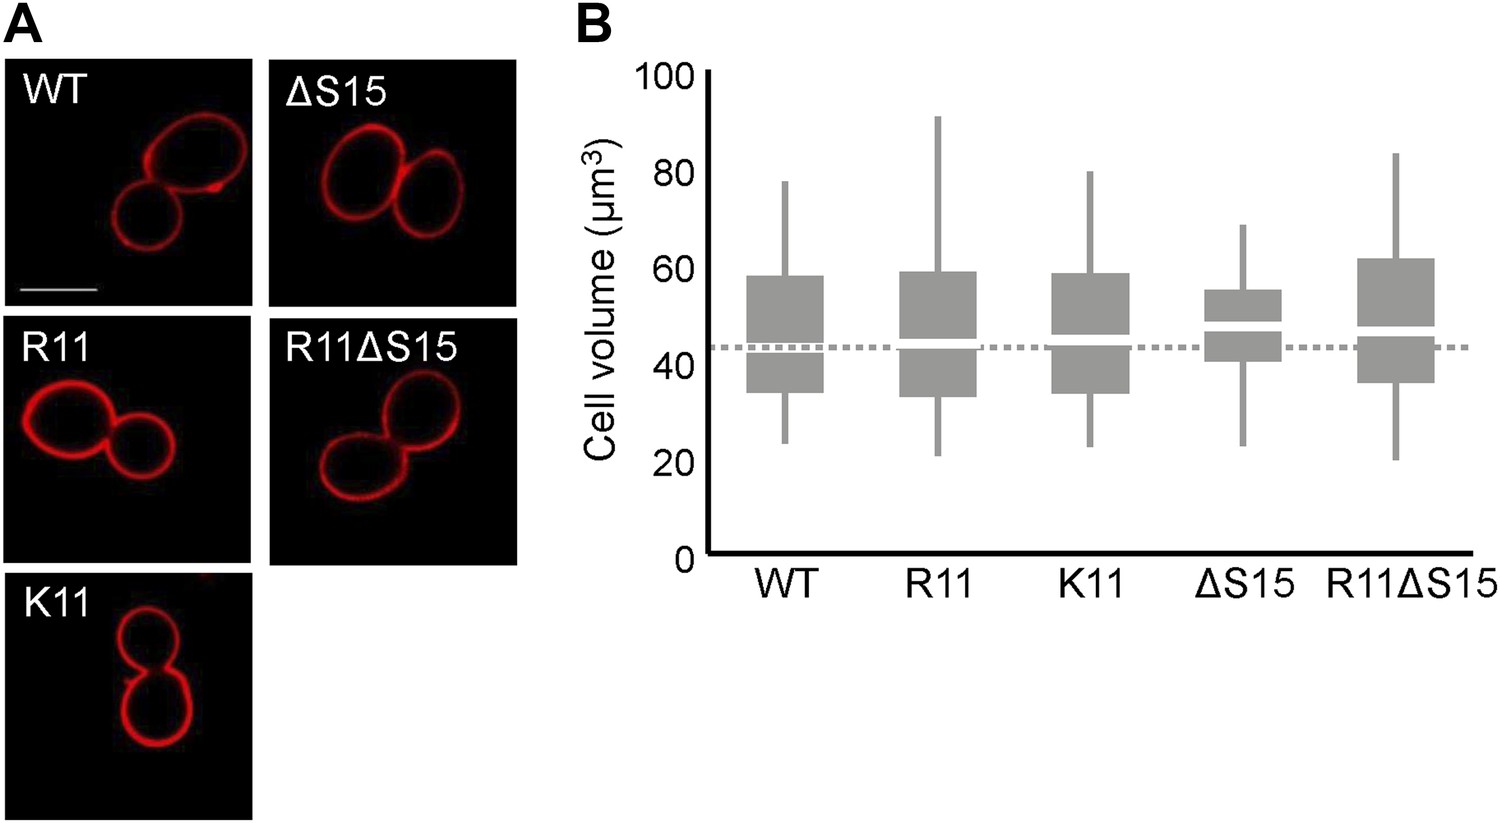
H2A arginines do not affect cell size.
(A) Images of the cell wall, as visualized by concanavalin A staining, and (B) boxplot of the distributions of cellular volumes in the indicated yeast strains. The scale bar is 5 µm.
Figure 4 with 1 supplement

Loss of H2A NTD arginines decreases chromatin compaction in human cells.
(A) FISH images of probes on chromosome 1 in normal primary IMR90 fibroblasts with HA-tagged WT or mutant H2A overexpressed as indicated. (B) Boxplot of the distributions of inter-probe distances. Note that R11K was only marginally significant at p=0.023. (C) Immunofluorescence images of IMR90 cells overexpressing HA-tagged WT or mutant H2A as indicated. (D) Top: boxplot of the distributions of largest nuclear cross-sectional areas in the indicated H2A overexpressing cells. Bottom: boxplot of the distributions of α-HA fluorescence intensities. (E) Left: FISH images, as in (A), of IMR90 cells expressing a C-terminal FLAG-tagged WT or tailless (Δ1–12) H2A. Right: boxplot of the distributions of inter-probe distances. (F) Top: immunofluorescence images of IMR90 cells overexpressing FLAG-tagged WT or tailless H2A. Bottom: boxplot of nuclear areas and fluorescence intensities, as indicated. Dashed lines mark the median value for the WT strain. All scale bars are 10 µm. Boxes are colored if the mean of the indicated strain is significantly different from WT. Red stars denote level of significance: *p<0.01; **p<0.001; ***p<0.0001 (Supplementary files 4 and 5). See also Figure 4—figure supplement 1.
Figure 4—figure supplement 1
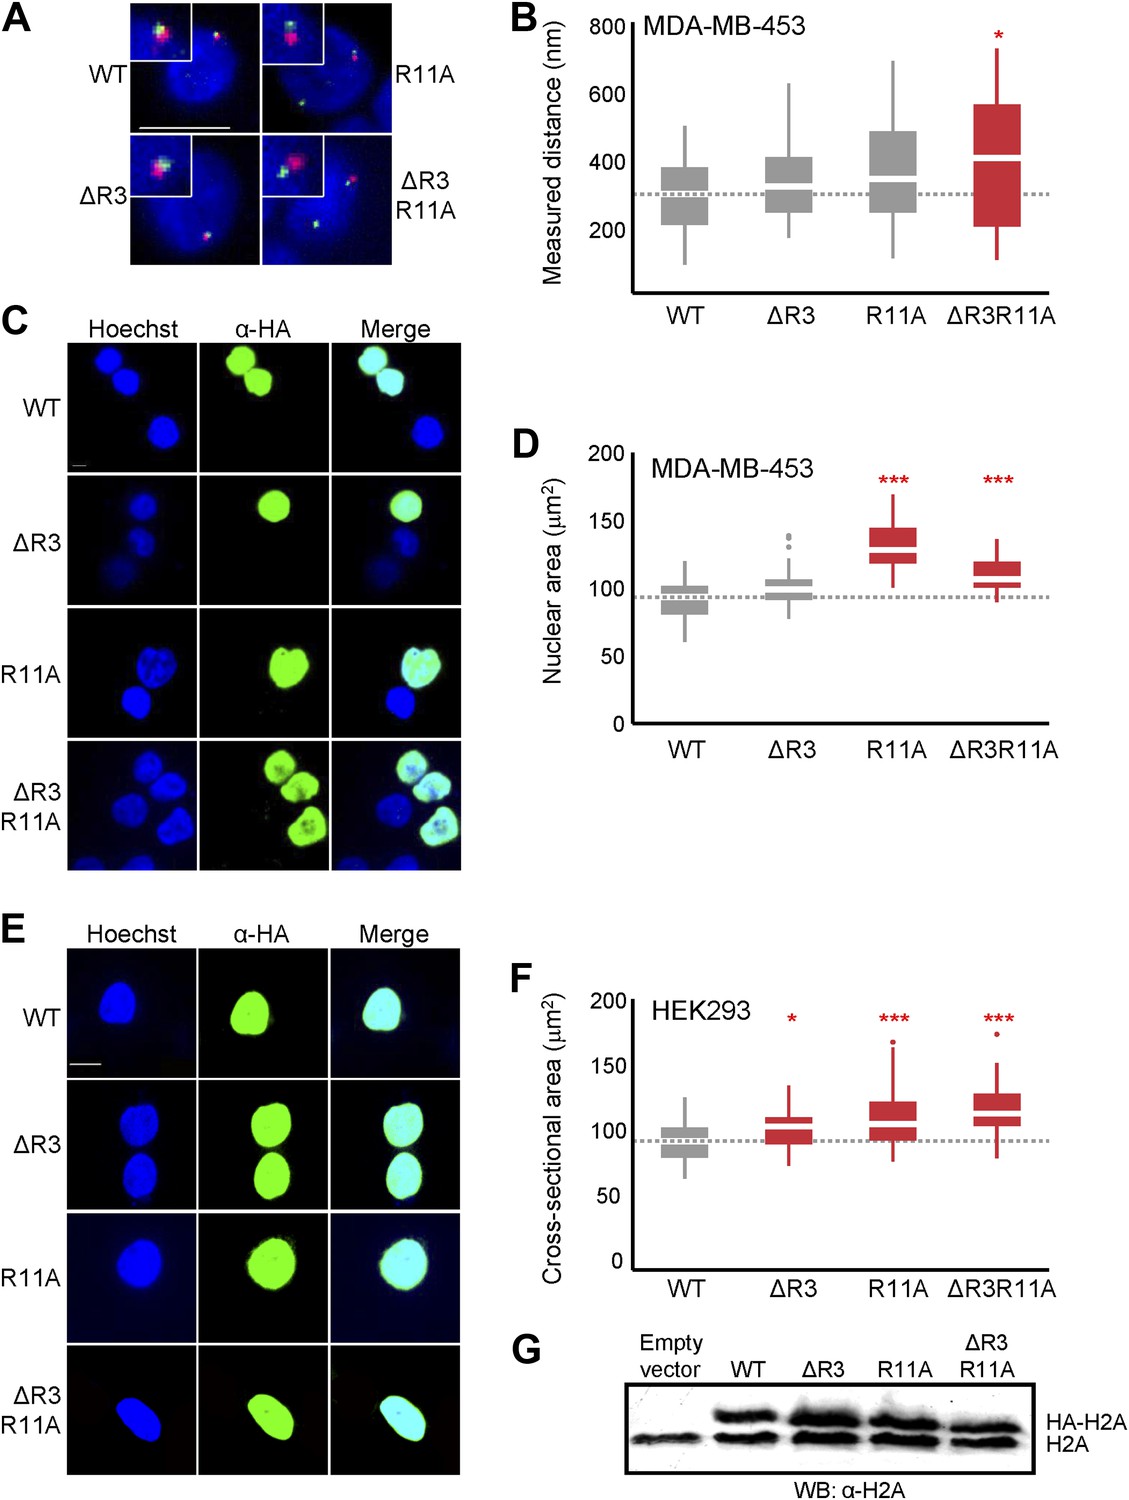
Loss of H2A NTD arginines decreases chromatin compaction in human cells.
(A) FISH images of probes on chromosome 1 in MDA-MB-453 cells with either WT or mutant HA-tagged H2A overexpressed. (B) Boxplot of the distributions of interprobe distances. Immunofluorescence images of (C) MDA-MB-453 or (E) HEK293 cells overexpressing WT or mutant HA-tagged H2A. Boxplot of the distributions of the largest nuclear cross-sectional areas in (D) MDA-MB-453 or (F) HEK293 for the indicated H2A over-expressing cells. (G) Western blot of lysates from HEK293 cells overexpressing the indicated WT or mutant HA-tagged H2A. All scale bars are 10 µm. Dashed lines mark the median value for the WT strain. Boxes are colored if the mean of the indicated strain is significantly different from WT. Red stars denote level of significance: *p<0.01; ***p<0.0001.
Figure 5 with 1 supplement
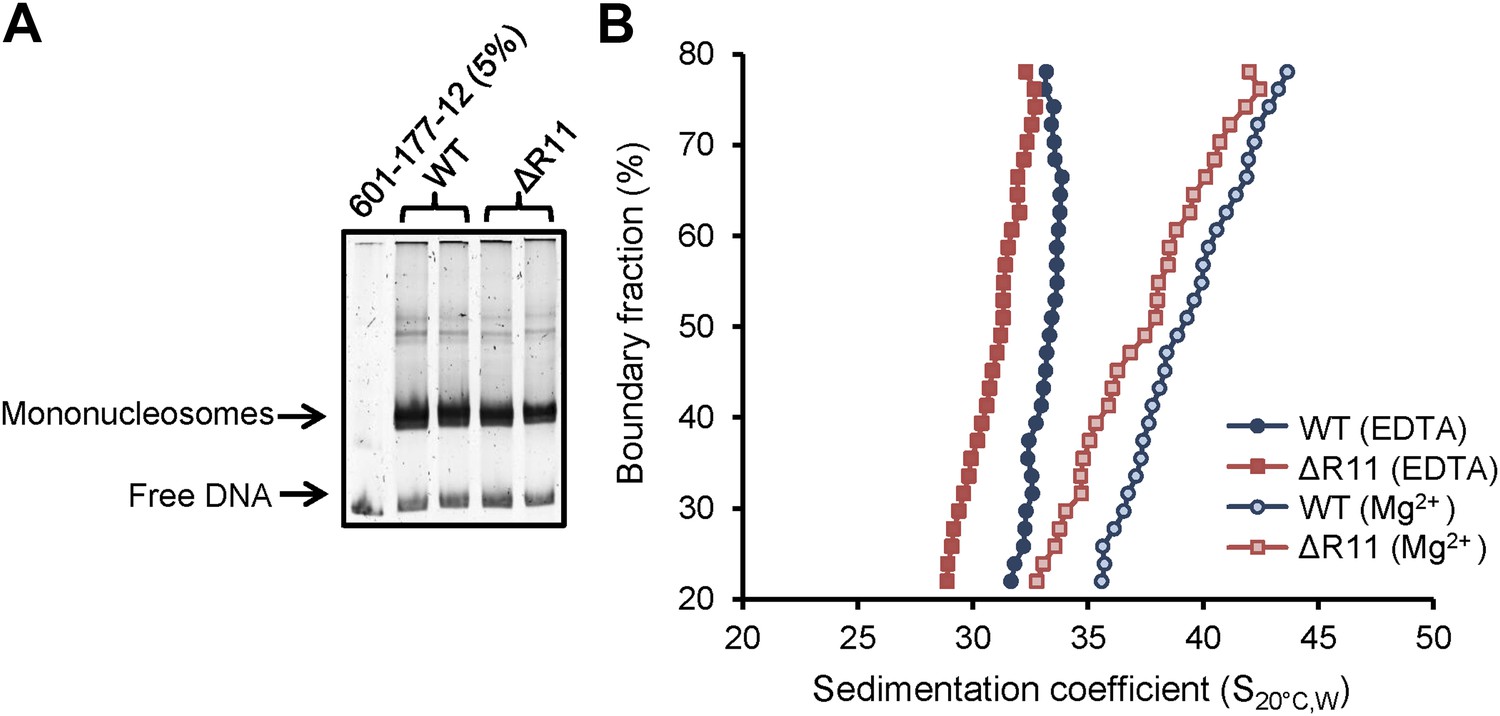
H2A NTD R11 directly modulates the compaction of chromatin fibers in vitro.
(A) Polyacrylamide gel electrophoresis (PAGE) of ScaI-digested 601-177-12 DNA template assembled with octamers containing recombinant WT or ΔR11 H2A. As a control, 5% of the 601-177-12 DNA without octamers was also digested. (B) The distribution of sedimentation coefficients determined by van Holde-Weischet analysis plotted against the percent boundary fraction in the absence or presence of 0.8 mM MgCl2 as indicated. S20°C,W is the sedimentation coefficient corrected to water at 20°C. See also Figure 5—figure supplement 1.
Figure 5—figure supplement 1
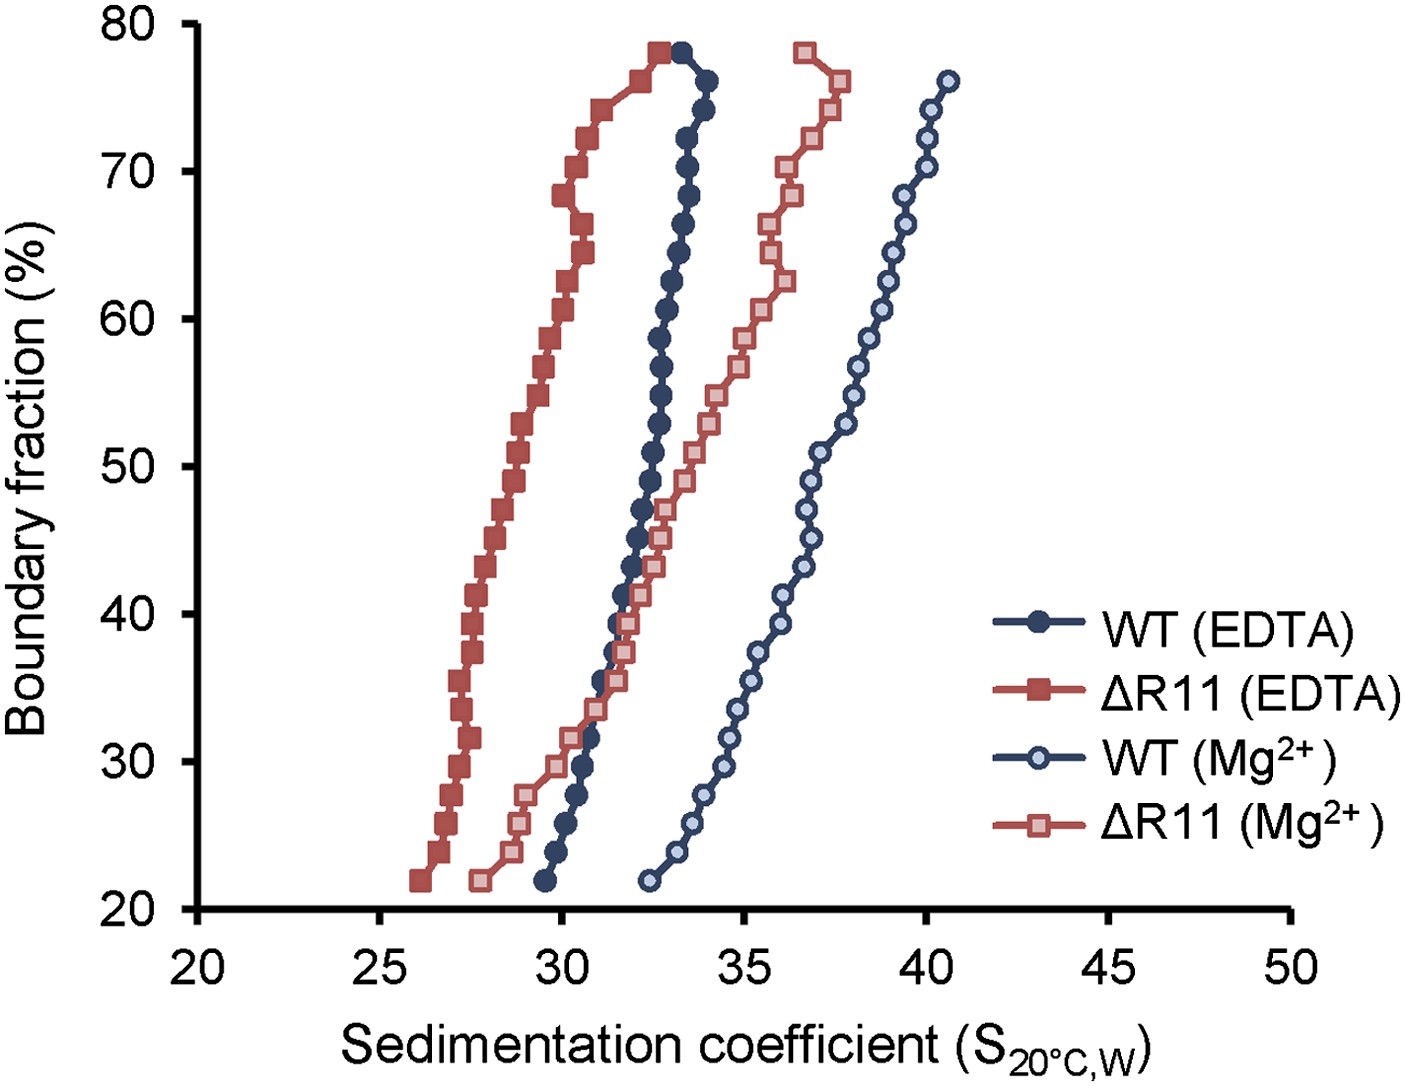
H2A NTD R11 directly modulates the compaction of chromatin fibers in vitro.
The distribution of sedimentation coefficients determined by van Holde-Weischet analysis plotted against the percent boundary fraction in the absence or presence of 0.6 mM MgCl2 as indicated. S20°C,W is the sedimentation coefficient corrected to water at 20°C.
Figure 6
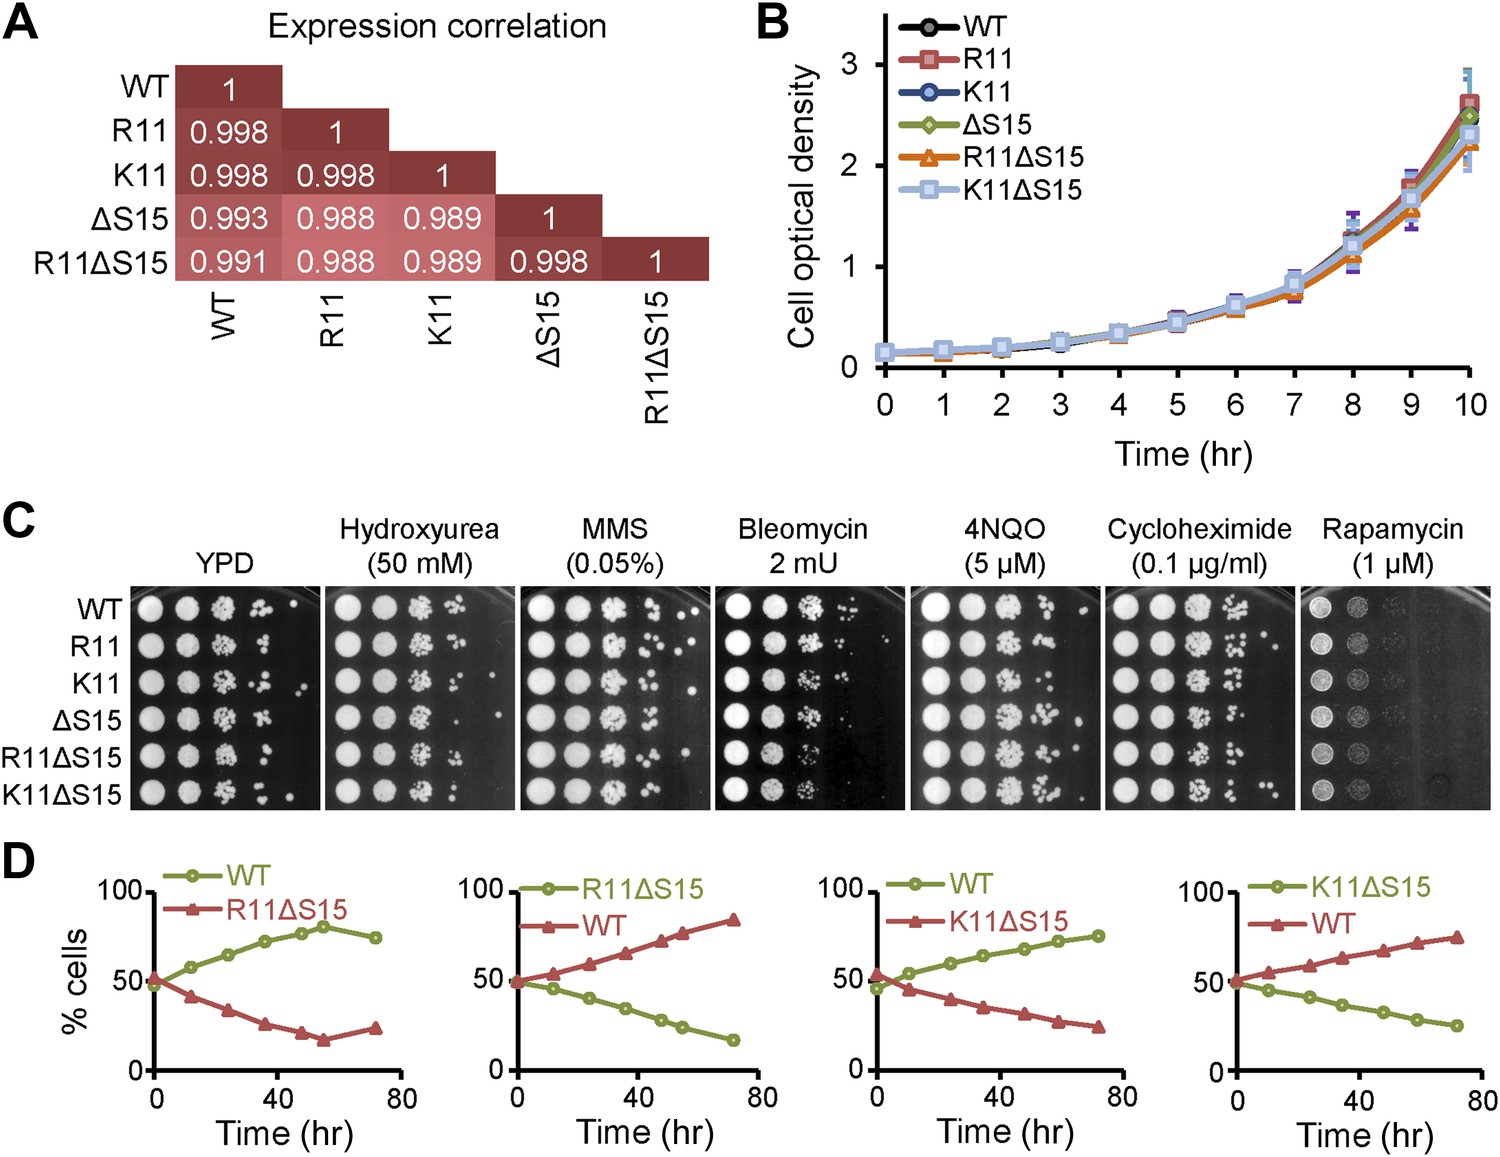
Mutations to H2A NTD decrease the fitness of yeast.
(A) Pearson correlations between the global gene expressions of the indicated strains grown in YPD. Correlations are calculated from an average of at least two experiments. (B) Growth curves of the indicated H2A yeast strains over 10 hr in YPD. (C) Spot tests with 10-fold serial dilutions for the indicated strains in the presence of different drugs. (D) The proportion of yeast cells in a co-culture of WT and the indicated mutant H2A carrying Pgk1 gene fusion to GFP (green) or RFP (red) as indicated by color.
Figure 7
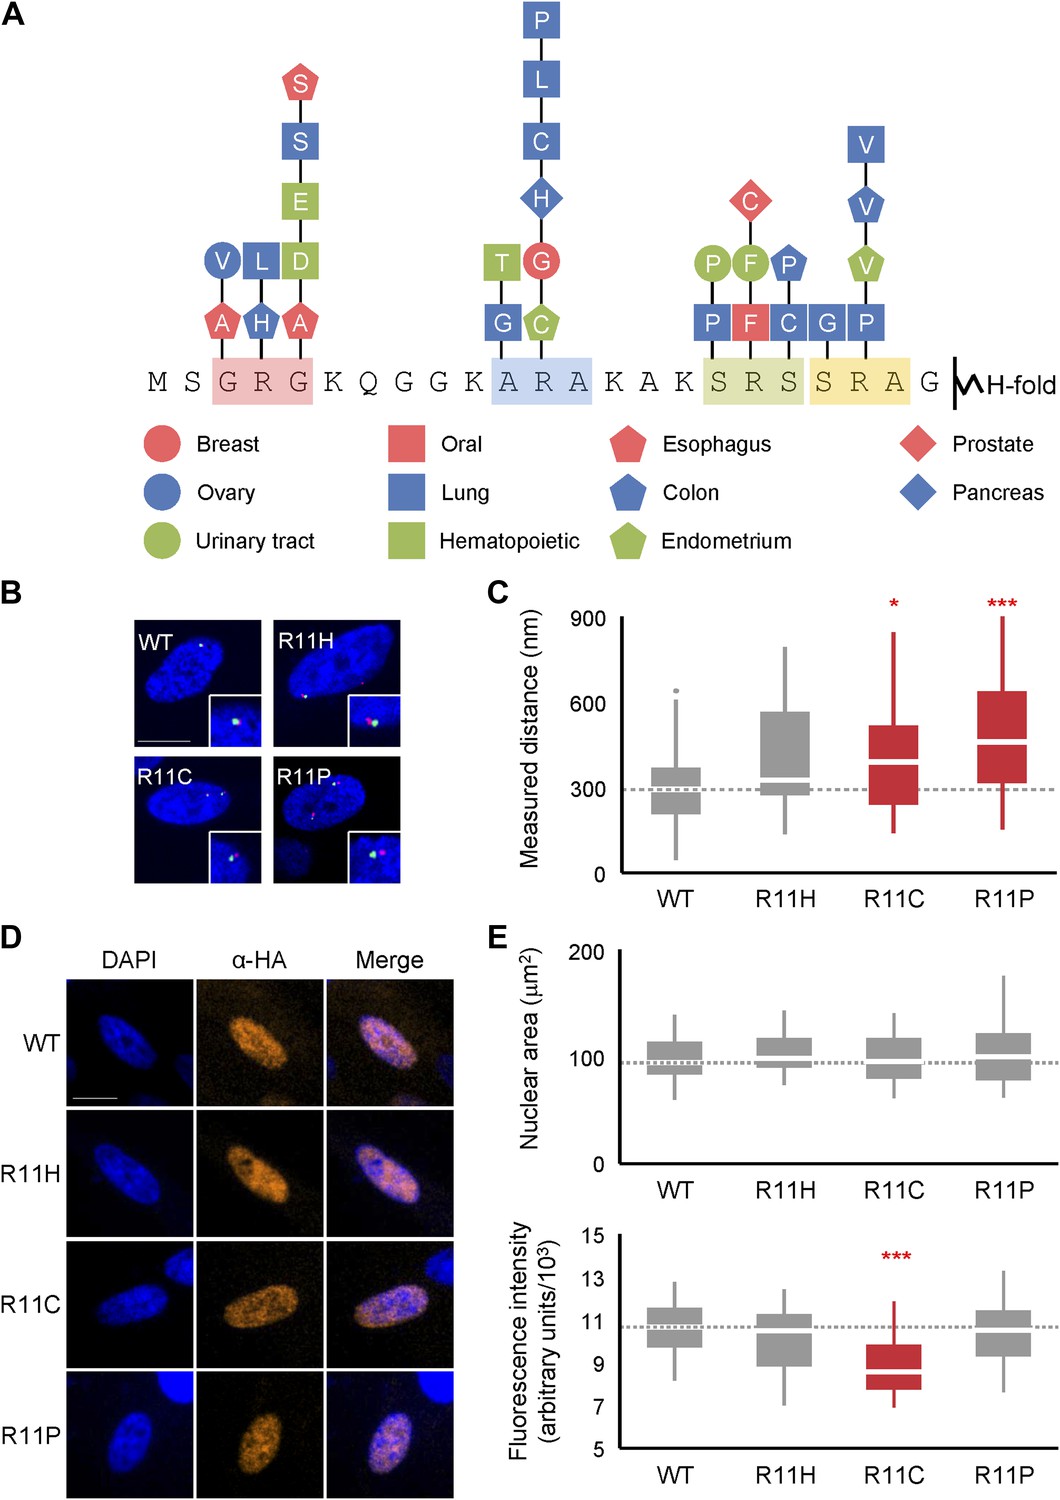
Mutations of H2A NTD found in cancers decreases chromatin compaction in human cells.
(A) Schematic of the H2A NTD showing only the mutations within the arginine motifs found in various cancers as indicated by the colored shapes (Forbes et al., 2011). The letter within each shape represents the mutated amino acid. (B) FISH images of probes on chromosome 1 in normal primary IMR90 fibroblasts with HA-tagged WT or mutant H2A overexpressed as indicated. (C) Boxplot of the distributions of inter-probe distances. (D) Immunofluorescence images of IMR90 cells overexpressing HA-tagged WT or mutant H2A as indicated. Anti-HA primary and Alexa Fluor 647-conjugated secondary antibodies were used to determine expression in FISH images and for measurement of nuclear areas. (E) Top: boxplot of the distributions of largest nuclear cross-sectional areas in the indicated H2A overexpressing cells. Bottom: boxplot of the distributions of α-HA fluorescence intensities. Dashed lines mark the median value for the WT strain. All scale bars are 10 µm. Boxes are colored if the mean of the indicated strain is significantly different from WT. Red stars denote level of significance: *p<0.01; ***p<0.0001 (Supplementary files 4 and 5).
Tables
Table 1
List of H2A mutations, sequence changes and their effects on chromatin compaction and nuclear volume
| FISH | Nuclear volume | ||||
|---|---|---|---|---|---|
| H2A mutant | H2A NTD Protein sequence | % Change | p-value | % Change | p-value |
| Yeast | |||||
| WT | SG–GKG–GKAGSA–AKASQSRSAKAG | – | 1.0E+00 | – | 1.0E+00 |
| R3 | SGRGKG–GKAGSA–AKASQSRSAKAG | −18 | 9.5E−04 | −5 | 4.1E−01 |
| R11 | SG–GKG–GKAGSARAKASQSRSAKAG | −15 | 8.6E−04 | −20 | 5.9E−05 |
| R3R11 | SGRGKG–GKAGSARAKASQSRSAKAG | −22 | 8.2E−06 | −16 | 3.0E−03 |
| R3(ΔGS10)R11 | SGRGKG–GKA··ARAKASQSRSAKAG | −30 | 2.1E−06 | +6 | 3.7E−01 |
| R11ΔS15 | SG–GKG–GKAGSARAKA·QSRSAKAG | −41 | 3.9E−08 | −9* | 4.7E−04 |
| K3 | SGKGKG–GKAGSA–AKASQSRSAKAG | +9 | 8.6E−01 | +13 | 9.4E−03 |
| K11 | SG–GKG–GKAGSAKAKASQSRSAKAG | +16 | 3.1E−01 | +3 | 2.6E−01 |
| K3K11 | SGKGKG–GKAGSAKAKASQSRSAKAG | +6 | 8.3E−01 | +31 | 5.4E−08 |
| K11ΔS15 | SG–GKG–GKAGSAKAKA·QSRSAKAG | −7 | 9.2E−02 | +2 | 6.6E−01 |
| ΔGS10 | SG–GKG–GKA··A–AKASQSRSAKAG | −6 | 3.2E−02 | +10 | 3.0E−02 |
| ΔS15 | SG–GKG–GKAGSA–AKA·QSRSAKAG | +3 | 9.4E−02 | +9 | 9.7E−03 |
| R6 | SG–GKGRGKAGSA–AKASQSRSAKAG | −5 | 5.6E−02 | +10 | 1.0E−03 |
| K20R | SG–GKG–GKAGSA–AKASQSRSARAG | −3 | 3.0E−01 | +7 | 1.5E−02 |
| R17K | SG–GKG–GKAGSA–AKASQSKSAKAG | −1 | 7.9E−01 | 0 | 2.7E−01 |
| Human—HA Tag | |||||
| WT | SGRGKQGGKTRAKAKSRSSRAG | – | 1.0E+00 | – | 1.0E+00 |
| ΔR3 | SG·GKQGGKTRAKAKSRSSRAG | +39 | 8.3E−03 | +42 | 1.3E−08 |
| R11K | SGRGKQGGKTKAKAKSRSSRAG | +20 | 2.3E−02 | +14 | 1.2E−03 |
| R11A | SGRGKQGGKTAAKAKSRSSRAG | +43 | 1.0E−05 | +21 | 5.7E−07 |
| ΔR3R11A | SG·GKQGGKTAAKAKSRSSRAG | +35 | 3.5E−03 | +18 | 5.9E−04 |
| Human—FLAG Tag | |||||
| WT | SGRGKQGGKARAKAKSRSSRAG | – | 1.0E+00 | – | 1.0E+00 |
| Δ1–12 | ············KAKSRSSRAG | +47 | 4.9E−03 | +18 | 2.8E−04 |
-
The -marks indicate spacing for sequence alignment purposes. The inserted residues are bold typed and underlined. Deletions are indicated by ·.
-
Percent (%) change refers to the difference in median values relative to WT unless otherwise indicated; the statistically significant differences are bold typed. p-values were calculated using the t-test (yeast) and Mann–Whitney U test (human).
-
*
percent change was calculated relative to isogenic WT control (ΔS15).
Additional files
-
Supplementary file 1
Tables of yeast strains, plasmids, and primers.
- https://doi.org/10.7554/eLife.02792.018
-
Supplementary file 2
Table of yeast FISH results.
- https://doi.org/10.7554/eLife.02792.019
-
Supplementary file 3
Table of yeast nuclear and cellular volumes.
- https://doi.org/10.7554/eLife.02792.020
-
Supplementary file 4
Table of human FISH results.
- https://doi.org/10.7554/eLife.02792.021
-
Supplementary file 5
Table of human nuclear area results.
- https://doi.org/10.7554/eLife.02792.022
Download links
A two-part list of links to download the article, or parts of the article, in various formats.
Downloads (link to download the article as PDF)
Open citations (links to open the citations from this article in various online reference manager services)
Cite this article (links to download the citations from this article in formats compatible with various reference manager tools)
Evolution of histone 2A for chromatin compaction in eukaryotes
eLife 3:e02792.
https://doi.org/10.7554/eLife.02792


