Method for identification of condition-associated public antigen receptor sequences

  1. Mikhail V Pogorelyy
  2. Anastasia A Minervina
  3. Dmitriy M Chudakov
  4. Ilgar Z Mamedov
  5. Yuri B Lebedev  Is a corresponding author
  6. Thierry Mora  Is a corresponding author
  7. Aleksandra M Walczak  Is a corresponding author
  1. Shemyakin-Ovchinnikov Institute of Bioorganic Chemistry of the Russian Academy of Sciences, Russia
  2. Skolkovo Institute of Science and Technology, Russia
  3. Central European Institute of Technology, Czech republic
  4. Moscow State University, Russia
  5. CNRS, Sorbonne University, Paris-Diderot University, École Normale Supérieure, France
  6. CNRS, Sorbonne University, École Normale Supérieure, France

Abstract

Diverse repertoires of hypervariable immunoglobulin receptors (TCR and BCR) recognize antigens in the adaptive immune system. The development of immunoglobulin receptor repertoire sequencing methods makes it possible to perform repertoire-wide disease association studies of antigen receptor sequences. We developed a statistical framework for associating receptors to disease from only a small cohort of patients, with no need for a control cohort. Our method successfully identifies previously validated Cytomegalovirus and type one diabetes responsive TCRβ sequences .

https://doi.org/10.7554/eLife.33050.001

Introduction

T-cell receptors (TCR) and B-cell receptors (BCR) are hypervariable immunoglobulins that play a key role in recognizing antigens in the vertebrate immune system. TCR and BCR are formed in the stochastic process of V(D)J recombination, creating a diverse sequence repertoire. These receptors consist of two hypervariable chains, the α and β chains in the case of TCR. Progress in high throughput sequencing now allows for deep profiling of TCRα and TCRβ chain repertoires, by establishing a near-complete list of unique receptor chain sequences, or ‘clonotypes’, present in a sample. Most sequencing data available correspond to TCRβ only, but the same principles discussed below apply to TCRα repertoires, or to paired αβ repertoires.

Comparison of sequenced repertoires has revealed that in any pair of individuals, large numbers of TCRβ sequences have the same amino acid sequence (Venturi et al., 2011). Several mechanisms leading to the repertoire overlap have been identified so far. The first mechanism is convergent recombination. Due to biases in V(D)J recombination process, the probability of generation of some TCRβ sequences is very high, making them appear in almost every individual multiple times and repeatedly sampled in repertoire profiling experiments (Britanova et al., 2014). This sharing does not result from a common specificity or function of T-cells corresponding to the shared TCRβ clonotypes, and may in fact correspond to cells from the naive compartment in both donors (Quigley et al., 2010), or from functionally distinct subsets such as CD4 and CD8 T-cells. The second possible reason for TCR sequence sharing is specific to identical twins, who may share T cell clones as a consequence of cord blood exchange in utero via a shared placenta (Pogorelyy et al., 2017). Note that in that scenario both the β and α chains are shared together. The third and most interesting mechanism for sharing the sequence of either the β or α or both chains is convergent selection in response to a common antigen. From functional studies, such as sequencing of MHC-multimer specific T-cells, it is known that the antigen-specific repertoire is often biased, and the same antigen-specific TCR β or α chain sequences can be found in different individuals (Miles et al., 2011; Dash et al., 2017; Glanville et al., 2017).

Reproducibility of a portion of the antigen-specific T-cell repertoire in different patients creates an opportunity for disease association studies using TCRβ repertoire datasets (Faham et al., 2017; Emerson et al., 2017). These studies analyse the TCRβ sequence overlap in large cohorts of healthy controls and patients to identify shared sequences overrepresented in the patient cohort. Here we propose a novel computational method to identify clonotypes which are likely to be shared because of selection for their response to a common antigen, instead of convergent recombination. Our approach is based on a mechanistic model of TCR recombination and is applicable to small cohorts of patients, without the need for a healthy control cohort.

Results

As a proof of concept, we applied our method to two large publicly available TCRβ datasets from Cytomegalovirus (CMV)-positive (Emerson et al., 2017) and type one diabetes (T1D) (Seay et al., 2016) patients. In both studies the authors found shared public TCRβ clonotypes that are specific to CMV-peptides or self-peptides, respectively. Specificity of these clonotypes was defined using MHC-multimers. We show that TCRβ chain sequences functionally associated with CMV and T1D in these studies are identified as outliers by our method.

The main ingredient of our approach is to estimate the probability of generation of shared clonotypes, and to use this probability to determine the source of sharing (see Figure 1). Due to the limited sampling depth of any TCR sequencing experiment, chances to sample the same TCRβ clonotype twice are low, unless this clonotype is easy to generate convergently, with many independent generation events with the same TCRβ amino acid sequence in each individual (convergent recombination), or if corresponding T-cell clone underwent clonal expansion, making its concentration in blood high (convergent selection). Thus, we reasoned that convergently selected clonotypes should have a lower generative probability than typical convergently recombined clonotypes. To test this, we estimated the generative probability of the TCRβ’s Complementarity Determining Region 3 (CDR3) amino-acid sequences that were shared between several patients. Since no algorithm exists that can compute this generative probability directly, our method relies on the random generation and translation of massive numbers of TCR nucleotide sequences using a mechanistic statistical model of V(D)J recombination (Murugan et al., 2012), as can be easily performed for example using the IGoR software (Marcou et al., 2017).

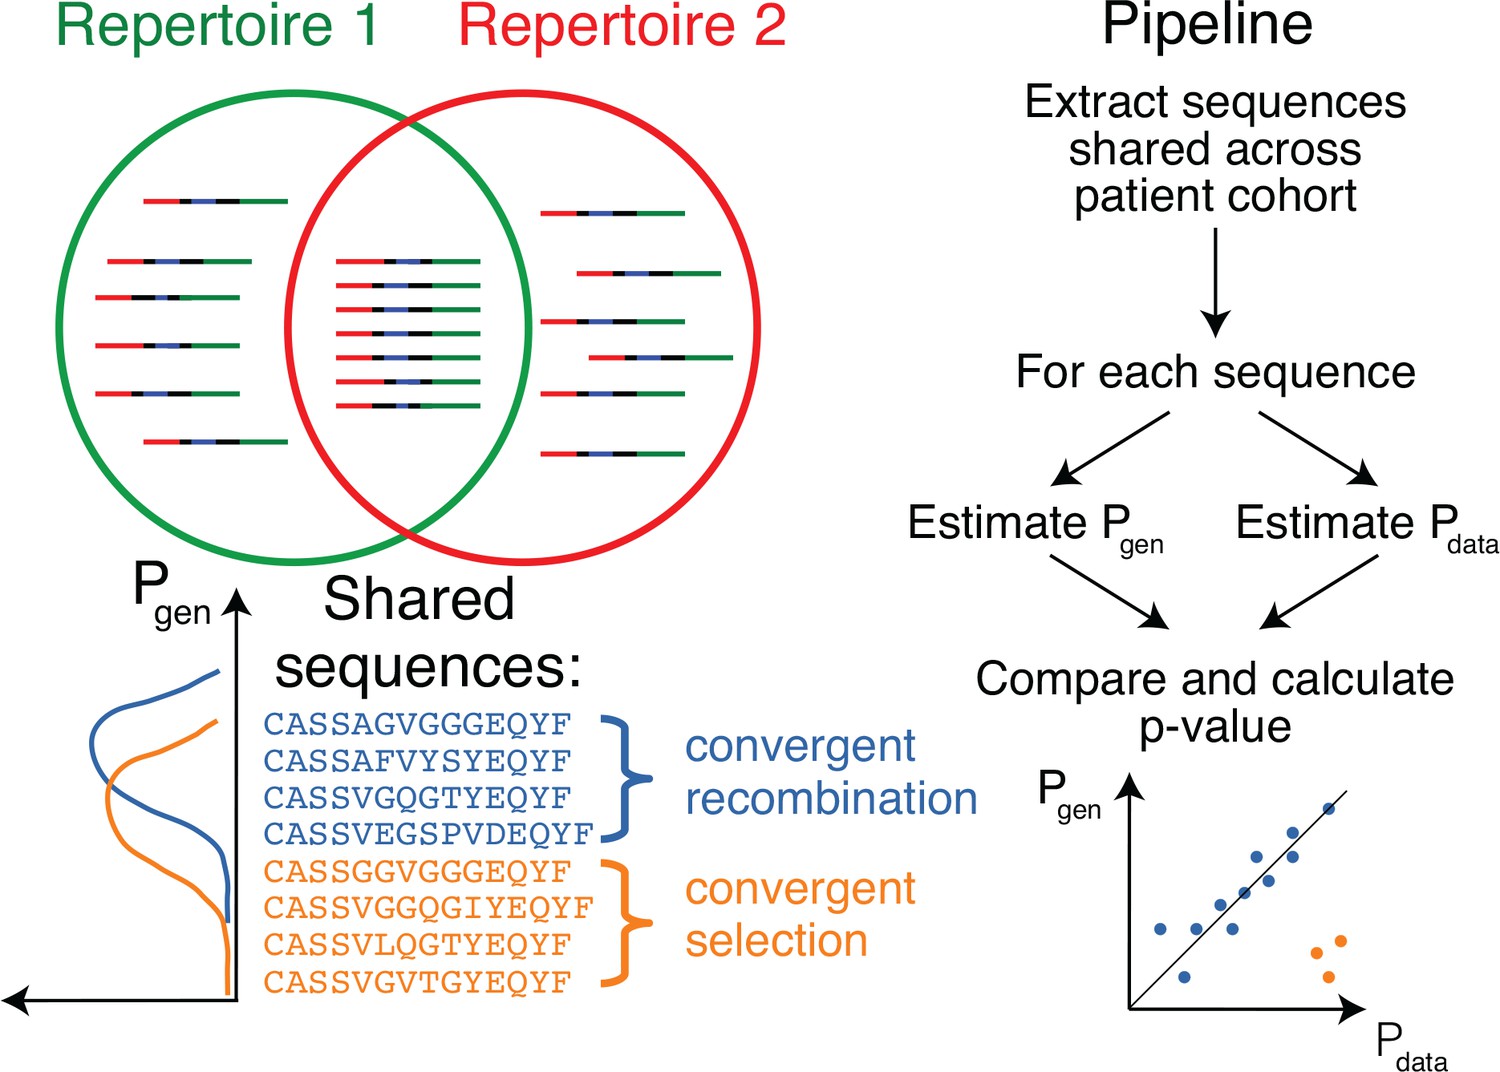
Method principle and pipeline.

(Top left) Sequence overlap between two TCR or BCR repertoires. (Bottom left) There are two major mechanisms for sequence sharing between two repertoires: convergent recombination and convergent selection. Because convergent recombination favors sequences with high generation probabilities, these two classes of sequences have different distributions of the generative probability, Pgen(σ). (Right) We estimate the theoretical Pgen(σ) for each sequence σ and compare it to Pdata(σ), which is empirically derived from the sharing pattern of that sequence in the cohort. Comparison of these two values allows us to calculate the analog of a p-value, namely the posterior probability that the sharing pattern is explained by the convergent recombination alone, with no selection for a common antigen.

https://doi.org/10.7554/eLife.33050.002

In Figure 2A we plot for each clonotype the number of donors sharing that clonotype against its generation probability. Disease-specific TCRβ variants validated by functional tests in source studies are circled in red. Note that validated disease-specific TCRβ sequences have a much lower generation probability than the typical sequences shared by the same number of donors. We developed a method of axis transformation (see Materials and methods) to compare the model prediction with data values on the same scale (Figure 2B), so that outliers can be easily identified by their distance to identity line. Our method can be used to narrow down the potential candidates for further experimental validation of responsive receptors. Additional information, like the expansion of the identified TCRβ clonotype in the inflammation site, the presence of the same clonotype in the repertoire of activated or memory T-cells, or absence in a cohort of healthy controls, could provide additional evidence for functional association of identified candidates with a given condition.

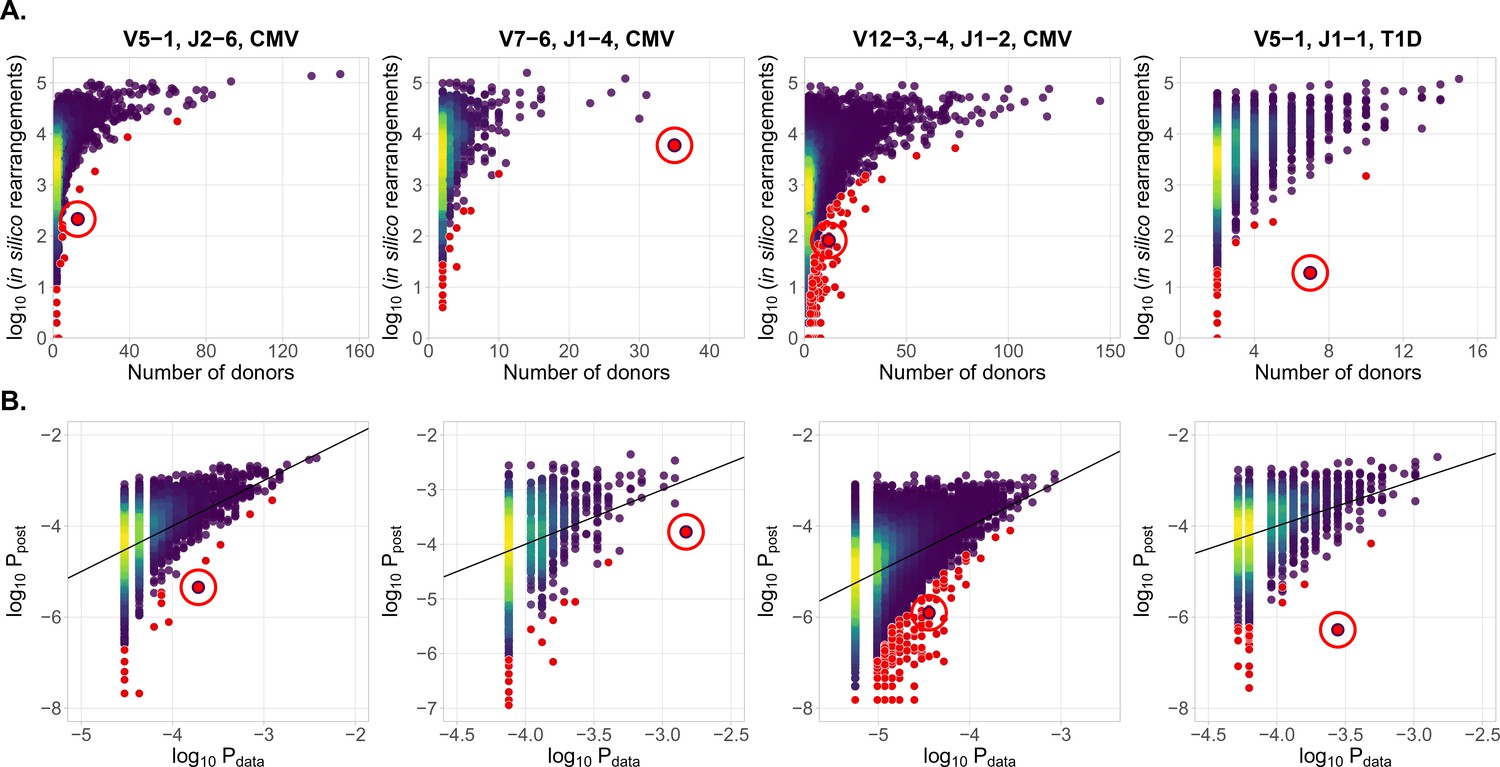
Identification of condition-associated clonotypes using generative probability

(A) CDR3aa of antigen specific clonotypes (red circles) have less generative probability than other clonotypes shared among the same number of donors. The number of in silico rearrangements obtained for each TCRβ sequence in our simulation (which is proportional to generation probability for each clonotype in a given VJ combination Ppost(σ)), plotted against the number of patients with that TCRβ clonotype. (B) Model prediction of generative probabilities agrees well with data. To directly compare Ppost(σ) to data, we estimate the empirical probability of occurrence of sequences, Pdata(σ), from its sharing pattern across donors (see Materials and methods). In A. and B. red dots indicate significant results (adjusted P<0.01, Holm’s multiple testing correction), while red circles point to the responsive clonotypes identified in the source studies.

https://doi.org/10.7554/eLife.33050.003

Our method also identifies other significant outliers than reported in the source studies (shown in red, and obtained after multiple-test correction – see Materials and methods), which may have three possible origins. First, they may be associated with the condition, but were missed by the source studies. Second, they may be due to other factors shared by the patients, such as features involved in thymic or peripheral selection, or reactivity to other common conditions than CMV (e.g. influenza infection). Third, they can be the result of intersample contamination. Our approach is able to diagnose the last explanation by estimating the likelihood of sharing at the level of nucleotide sequences (i.e. synonymously), as detailed in the Materials and methods section.

Discussion

Antigen receptor sequencing currently has little clinical applications. One of the most important ones is diagnostics and tracking of malignant T-cell and B-cell clones in lymphomas, where it allows for directly measuring the abundances of certain clones at different timepoints. Our method allows for a sequence-based theoretical prediction of T-cell abundances at the population level, and for the identification of T-cell clones associated with infectious and autoimmune conditions. Extensive databases of condition-associated clones can provide a means of disease diagnostics and extend the clinical utility of antigen receptor repertoire sequencing technologies.

This method may also be useful in the analysis of known antigen-specific TCR clonotypes. The typical source of such TCR sequences are MHC-multimer positive cells isolated from one or a few donors (Shugay et al., 2018; Tickotsky et al., 2017). Some of these antigen-specific clonotypes are private, and are hard to find in other patients, providing limited diagnostic value. Our method is able to distinguish these clones from publicly responding clonotypes that are likely to be shared by many patients using only their CDR3 amino acid sequences.

The cohort size necessary for the identification of antigen-specific clonotypes with our method varies (see ‘Designing the experiment’ subsection in Materials and methods). It depends on the strength and diversity of the response to the given antigen. CMV and other Herpesviridae (EBV, HSV), are able to cause a persistent infection, and a large fraction of the TCR repertoire of CMV-positive donors are believed to be specific to them—on average, up to 10% of CD8 +cells are specific to a single CMV epitope in elderly individuals (Khan et al., 2004). However, it was shown that in a human acute infection model of yellow fever vaccination, virus-specific T-cell clones are one of the most abundant in the TCR repertoire and occupy up to 12% of the CD8 +T cell repertoire. This response is short-lived and contracts significantly a month after immunization (Miller et al., 2008). So the peak of an immune response is the best timepoint to search for antigen-specific TCRs in acute infections using this method. T-cell response to herpesviruses is also not unique in terms of public clonotype involvement—in ankylosing spondylitis (Faham et al., 2017), 30–40% of patients share a certain TCRβ aminoacid sequence, which is more than the fraction of patients sharing CMV-specific clonotypes that we analysed in this study.

Our approach can be used on other hypervariable receptor chains (TCRα, BCR heavy and light chains), as well as other species (mice, fish, etc.). Both α and β chains contribute to T-cell receptor specificity. Single-cell or paired sequencing technologies (Zemmour et al., 2018) could identify partner receptor chains for condition-associated TCR α or β chain sequences identified with our approach. Antigenic peptides recognized by complete T-cell receptors could then be recovered in vitro using yeast-display libraries of peptide-MHC (Gee et al., 2018). As paired sequencing becomes more widespread, our method can be extended to the analysis of full paired TCR by applying the exact same analysis using the joint recombination probability of αβ clonotypes.

Recent advances in computational methods allow us to extract TCR repertoires from existing RNA-Seq data (Bolotin et al., 2017; Brown et al., 2015). Huge numbers of available RNA-Seq datasets from patients with various conditions can be used for analysis and identification of novel virus, cancer, and self reactive TCR variants using our method. The more immunoglobulin receptors with known specificity are found using this type of association mapping, the more clinically relevant information can be extracted from immunoglobulin repertoire data.

Materials and methods

Statistical analysis

Problem formulation

Request a detailed protocol

Our framework is applicable to analyze the outcome of a next generation sequencing experiment probing the immune receptor repertoires of n individuals with a given condition, for example CMV or Type one diabetes. We denote by Mi the number of unique amino acid TCR sequences in patient i, i=1,,N. For a given TCR amino acid sequence σ, we set xi=1 to indicate that σ is present in patient i’s repertoire, and xi=0 otherwise. For a given shared sequence σ, we want to know how likely its sharing pattern is under the null hypothesis of convergent recombination, correcting for the donors’ different sampling depths. In other words, is σ overrepresented in the population of interest? If σ is significantly overrepresented, we also want to quantify the size of this effect.

Overview

Under the null hypothesis, the presence of σ in a certain number of donors is explained by independent convergent V(D)J recombination events in each donor. Given the total number of recombination events that led to the sequenced sample of donor i, Ni, the presence of given amino acid sequence σ in donor is Bernoulli distributed with probability

(1) pi=xi=(1Ppost(σ))Ni,
(2) Ppost(σ)=Pgen(σ)×Q,

where Ppost(σ) is the model probability that a recombined product found in a blood sample has sequence σ under the null hypothesis. It is formed by the product of Pgen(σ), the probability to generate the sequence σ, estimated using a V(D)J recombination model (see the following subsection), and Q, a constant correction factor accounting for thymic selection (see Estimation of the correction factor Q subsection). The number of independent recombination events Ni leading to the observed unique sequences in a sample i is unknown, because of convergent recombination events within the sample, but it can be estimated from the number of unique sequences Mi, using the model distribution Ppost (see Estimation of Ni subsection).

We also calculate the posterior distribution of Pdata(σ), corresponding to the empirical counterpart of Ppost(σ) in the cohort, inferred from the sharing pattern of σ across donors. We use information about the presence of σ in our donors, x1,,xn and the sequencing depth for each donor, N1,,Nn (see Estimation of Pdata(σ) subsubsection), yielding the posterior density: ρ(Pdata|x1,,xN).

Finally, we estimate the probability, given the observations, that the true value of Pdata is smaller than the theoretical value Ppost predicted using V(D)J recombination model, analogous to a p-value and used to identify significant effects:

(3) P(Ppost>Pdata)=0Ppostρ(Pdata|x1,,xn)dPdata.

To estimate the effect size q(σ) we compare Pdata to Ppost,

(4) q(σ)=Pdata(σ)Ppost(σ).

Estimation of Pgen, the probability of generation of a TCR CDR3 amino acid sequence

Request a detailed protocol

To procedure outlined above requires to calculate Pgen(σ), the probability to generate a given CDR3 amino acid sequence. Methods exist to calculate the probability of TCR and BCR nucleotide sequences from a given recombination model (Murugan et al., 2012; Marcou et al., 2017), but are impractical to calculate the probability of amino acid sequences, because of the large number of codon combinations that can lead to the same amino acid sequence, a=1Lncodons(σ(a)), where L is the sequence length, and ncodons(τ) the number of codons coding for amino acid τ. The number is about 1.4×10⁷ for a typical CDR3 length of 15 amino acid.

Instead, we estimated Pgen(σ) using a simple Monte-Carlo approach. We randomly generated a massive number (Nsim=2×10⁹) of recombination scenarios according to the validated recombination model (Murugan et al., 2012):

(5) Prearrβ=P(V)P(D,J)P(delV|V)P(insVD)×P(delDl,delDr|D)P(insDJ)P(delJ|J).

The resulting sequences were translated, truncated to only keep the CDR3, and counted. Pgen(σ) was approximated by the fraction of events thus generated that led to sequence σ. This approximation becomes more accurate as Nsim increases, with an error on Pgen(σ) scaling as (Pgen(σ)/Nsim)1/2.

Estimation of the correction factor Q

Request a detailed protocol

Not all generated sequences pass selection in the thymus. Pgen systematically underestimates the frequency of recombination event that eventually make it into the observed repertoire. To correct for this effect, we estimate a correction factor Q, as was suggested in (Elhanati et al., 2014):

(6) Ppost(σ)=Pgen(σ)×Q.

Contrary to (Elhanati et al., 2014), which learned a sequence-specific factor for each individual, here we assume that all observed sequences passed thymic selection. Q is a normalization factor accounting for the fact that just a fraction Q-1 of sequences pass thymic selection. This factor is determined for each VJ-combination as an offset when plotting logPgen against logPdata* (see the following subsection for definition of Pdata*), using least squares fitting.

Estimation of Pdata(σ), the probability of sequence occurrence in data

Request a detailed protocol

The variable xi indicates the presence or absence of a given TCR amino acid sequence σ in the ith dataset with Ni recombination events per donor. We want to estimate Pdata(σ), which is a fraction of recombination events leading to σ in the population of interest. According to Bayes’ theorem, for a given σ, the probability density function of Pdata reads:

(7) ρ(Pdata|x1,,xn)=P(x1,,xn|Pdata)ρprior(Pdata)01P(x1,,xn|Pdata)ρprior(Pdata)dPdata.

The likelihood is given by a product of Bernouilli probabilities:

(8) P(x1,,xn|Pdata)=i=1N[1-(1-Pdata)Ni]xi[(1-Pdata)Ni]1-xi,

and a flat prior ρprior(Pdata)=const is used.

We estimate Pdata* (shown in Figure 2B) as the maximum of the posterior distribution:

(9) Pdata=argmaxPdata ρ(Pdata|x1,,xn).

Estimation of Ni, the number of recombination events

Request a detailed protocol

The total number Ni of recombination events in ith dataset is unknown, but we can count the number of unique CD3 acid sequences Mi observed in the sequencing experiment. For a typical TRB experiment, convergent recombination is relatively rare and one could use NiMi as an approximation. However, for less diverse loci (e.g TRA), or for much higher sequencing depths, one should correct for convergent recombination, as the the observed number of unique aminoacid sequences could be much lower than the actual number of corresponding recombination events.

The average number of unique sequences resulting from Ni recombination events is, in theory:

(10) Mi=σT(1-Ppost(σ))Ni.

where T is the set of sequences that can pass thymic selection. To estimate that number, we generate a very large number Nsim of recombinations, leading to Nuni unique CDR3 amino acid sequences for which Pgen is estimated as explained above. We take T to be a random subset of unique sequences, T{σ1,,σNuni}, of size |T|=Nuni/Q, and we apply Equation 8.

Using this equation we plot the calibration curve for the TRBV5-1 TRBJ2-6 VJ datasets in Figure 3. For comparison the case of no thymic selection (Q=1) is shown in red. The inversion of this curve yields Ni as a function of Mi.

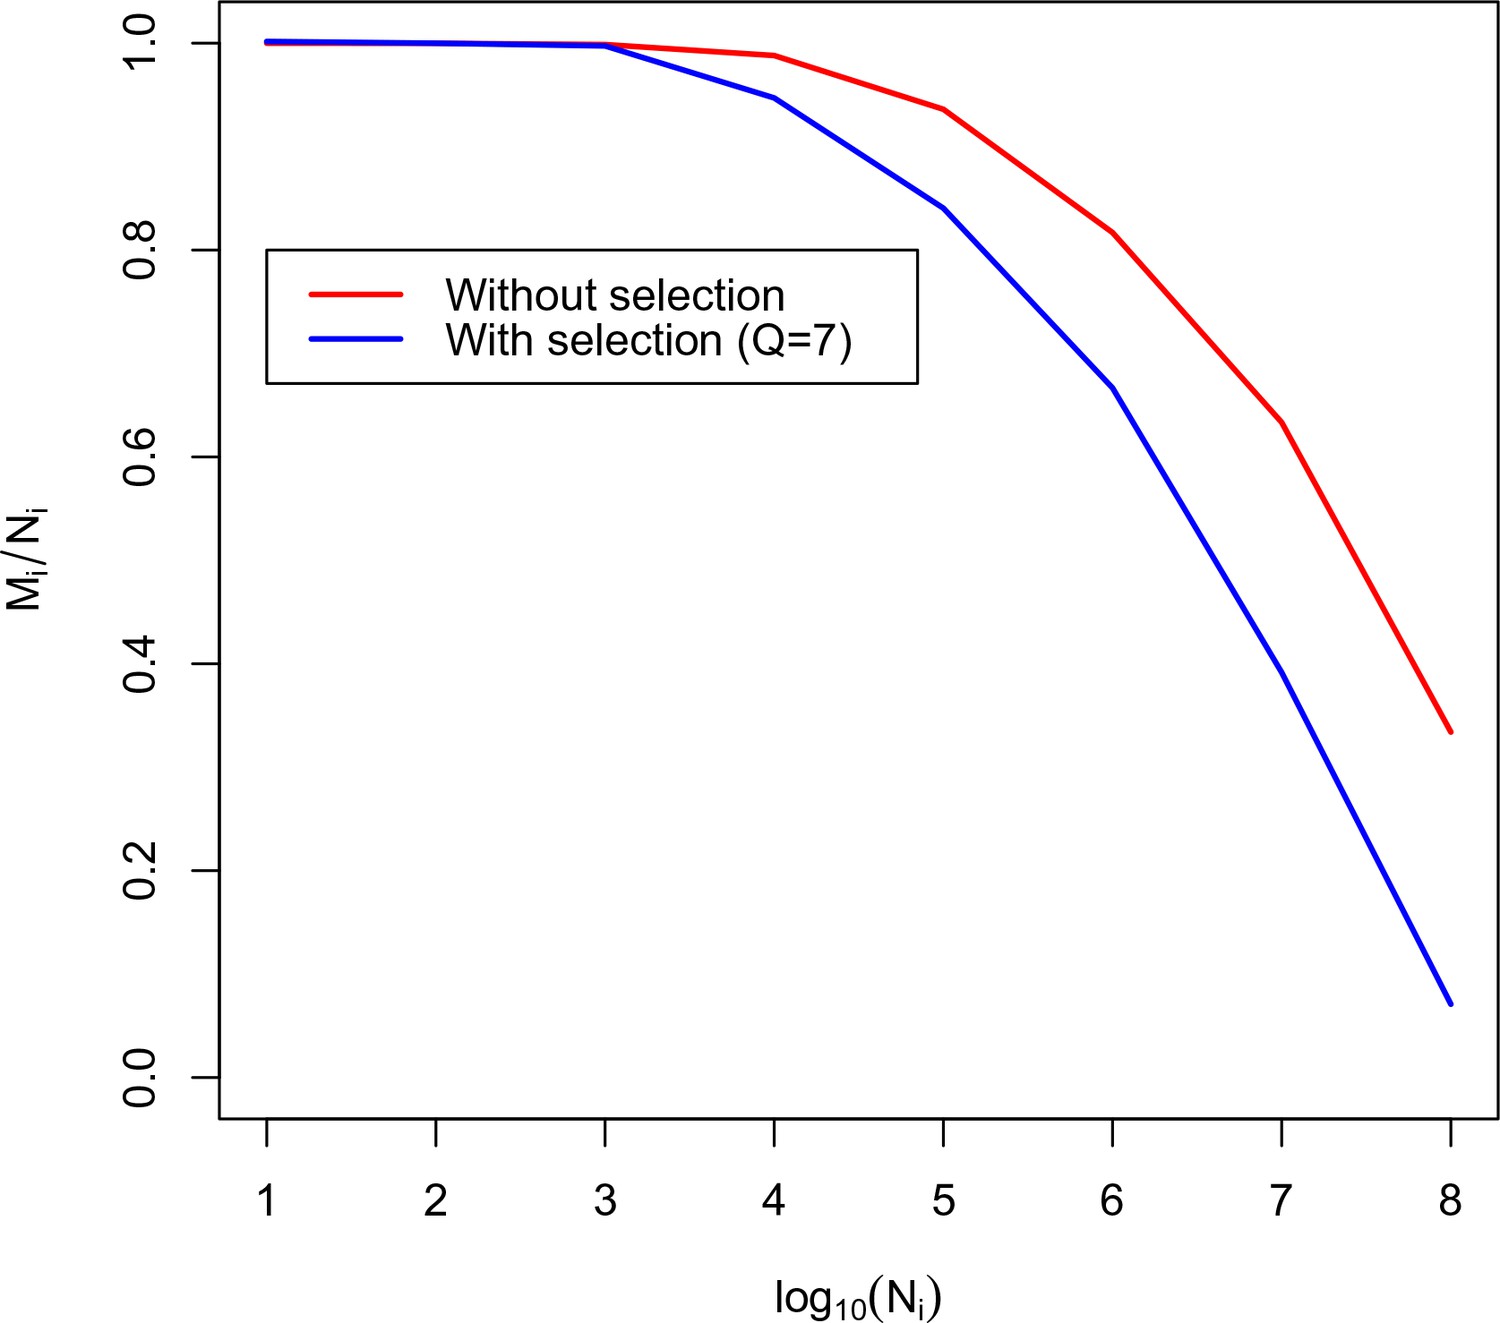
Calibration curve for TRBV5-1 TRBJ2-6 combination.

Here we plot the fraction of unique amino acid sequences to recombination events against the logarithm of the number of recombination events. The blue line corresponds to the theoretical solution with selection, the red line corresponds to the theoretical solution without selection.

https://doi.org/10.7554/eLife.33050.004

Pipeline description

Request a detailed protocol

In this section we describe how to apply our algorithm to real data. All the code and data necessary to reproduce our analysis is available online on github (https://github.com/pogorely/vdjRec/; copy archived at https://github.com/elifesciences-publications/vdjRec/).

We start with annotated TCR datasets (CDR3 amino acid sequence, V-segment, J-segment), one per donor. Such datasets are produced by MiXCR (Bolotin et al., 2015), immunoseq (http://www.adaptivebiotech.com/immunoseq) and most other software for NGS repertoire data preprocessing. Data we used was in immunoseq format, publicly available from https://clients.adaptivebiotech.com/immuneaccess database.

We proceed as follows:

  1. Split datasets by VJ combinations. The resulting datasets correspond to lists of unique CDR3 amino acid sequences for each donor and VJ combination. All following steps should be done independently for each VJ combination.

  2. (Optional). Filter out sequences present in only one donor to speed up the downstream analysis.

  3. Generate a large amount of simulated nucleotide TCR sequences for a given VJ combination. Extract and translate their CDR3, and count how many times each sequence appears in the simulated set (restricting to sequences actually observed in donors for better efficiency). The resulting number divided by the total number of simulated sequences is an estimate of Pgen.

  4. Estimate Pdata* for each sequence in the dataset, see Estimation of Pdata(σ) subsection.

  5. Using Pdata* and Pgen, estimate for each VJ combination the normalization Q by minimizing j=1n(logPdata*(σj)-logPgen(σj)-logQ)2, see Estimation of the correction factor Q subsection, where σj, j=1,,n are the shared sequences.

  6. Calculate Ppost=Q×Pgen. Calculate the p-value (Equation 1) and effect size (Equation 2).

Usage example

Data sources

Request a detailed protocol

Data from (Emerson et al., 2017) and (Seay et al., 2016) is publicly available from the immuneaccess database: https://clients.adaptivebiotech.com/immuneaccess. For our analysis, we only considered VJ combinations for which the authors identified condition-associated clonotypes with MHC-multimer proved specificity. CDR3 aminoacid sequences and V and J segment of these TCR clonotypes are given in Table 1.

Table 1
Published antigen-specific clonotypes used to test the algorithm.
https://doi.org/10.7554/eLife.33050.005
CDR3aaV-segmentJ-segmentAntigen sourceRef.
CASSLAPGATNEKLFFTRBV07-06TRBJ1-4CMV(Emerson et al., 2017)
CASSPGQEAGANVLTFTRBV05-01TRBJ2-6CMV(Emerson et al., 2017)
CASASANYGYTFTRBV12-3,−4TRBJ1-2CMV(Emerson et al., 2017)
CASSLVGGPSSEAFFTRBV05-01TRBJ1-1self(Seay et al., 2016; Gebe et al., 2009)

Analysis results

Request a detailed protocol

We applied our pipeline to identify CMV-specific and self-specific TCR sequences listed in Table 1. For our analysis we used only case cohorts, without controls. For each dataset we followed our pipeline described in Pipeline description subsection. We found that sequences reported in the source studies as being both significantly enriched in the patient cohort, and antigen-specific according to MHC-multimers, were the most significant in 3 out of 4 datasets (See Table 2). In the remaining TRBV12 dataset, the sequence of interest was the top 40 most significant out of 27,699 sequences present in at least two CMV-positive donors.

Table 2
Output of the algorithm for sequences from Table 1.
https://doi.org/10.7554/eLife.33050.006
CDR3aaVJAg.source .p-value rankp-valueEffect size
CASSLAPGATNEKLFF07–061–4CMV1/16371.2×10-178.8
CASSPGQEAGANVLTF5–012–6CMV1/55491.8×10-1742.3
CASASANYGYTF12–3,−41–2CMV40/276692.5×10-1428.8
CASSLVGGPSSEAFF5–011–1self1/26469.5×10-19524

Identifying contaminations

Request a detailed protocol

Intersample contamination may complicate high-throughput sequencing data analysis in many ways. It could occur both during library preparation or the sequencing process itself (Sinha et al., 2017). Contaminations have the same nucleotide and amino acid sequence in all datasets, and so our method identifies them as outliers, because their sharing cannot be explained by a high recombination probability.

Our method provides a tool to diagnose contamination. Given an amino-acid sequence present in many donors, we measure its theoretical nucleotide diversity using the same simulation approach we used to calculate the generative probability Pgen of the amino acid sequence (see Estimation of Pgen subsection). If the diversity of the simulated nucleotide sequences is much larger than observed in the data, it is a sign of contamination.

We applied this approach to the CDR3 sequence CASSLVGGPSSEAFF associated to Type one diabetes, and found 19 recombination events consistent with that amino acid sequence out of our simulated dataset. We found 18 different nucleotide variants out of the 19 total possible. In contrast, in the data this clononotype had the same nucleotide variant in all of the eight donors in which it was present. That variant was absent from the simulated set. A one-sided Fisher exact test gives a p<10-6 probability of this happening by chance, indicating contamination as a likely source of sharing.

Designing the experiment

Request a detailed protocol

Our approach also allows us to obtain important estimates for experiment design. A number of variables affect detection of an antigen-specific clone using our approach: the abundance of the clone in the general population (represented by Pdata in our approach), the cohort size, the sequencing depth Ni in each donor in the cohort, and also the effect size. Fixing any two of these variables results in a constraint between the other two and the affects the probability to detect an antigen-specific clonotype, which translates into the statistical power of the method. As an example of such an analysis, we fix the cohort size at 10, 30 or 100 donors (see Figure 4A–C respectively) and the sequencing depth at Ni=1000 unique clones sequenced per repertoire for a given VJ-combination in each donor in the cohort. We ask how frequently a disease specific clone with P~data abundance in the population and effect size q=P~data/Ppost is detected with our method. To address this question for each value P~data we perform a simulation: we simulate x1,x2,,xn Bernoulli variables, each with a pi=1-e-NiP~data success probability. For a given value of P~data and q there is a single value of Ppost=P~data/q. Then we calculate

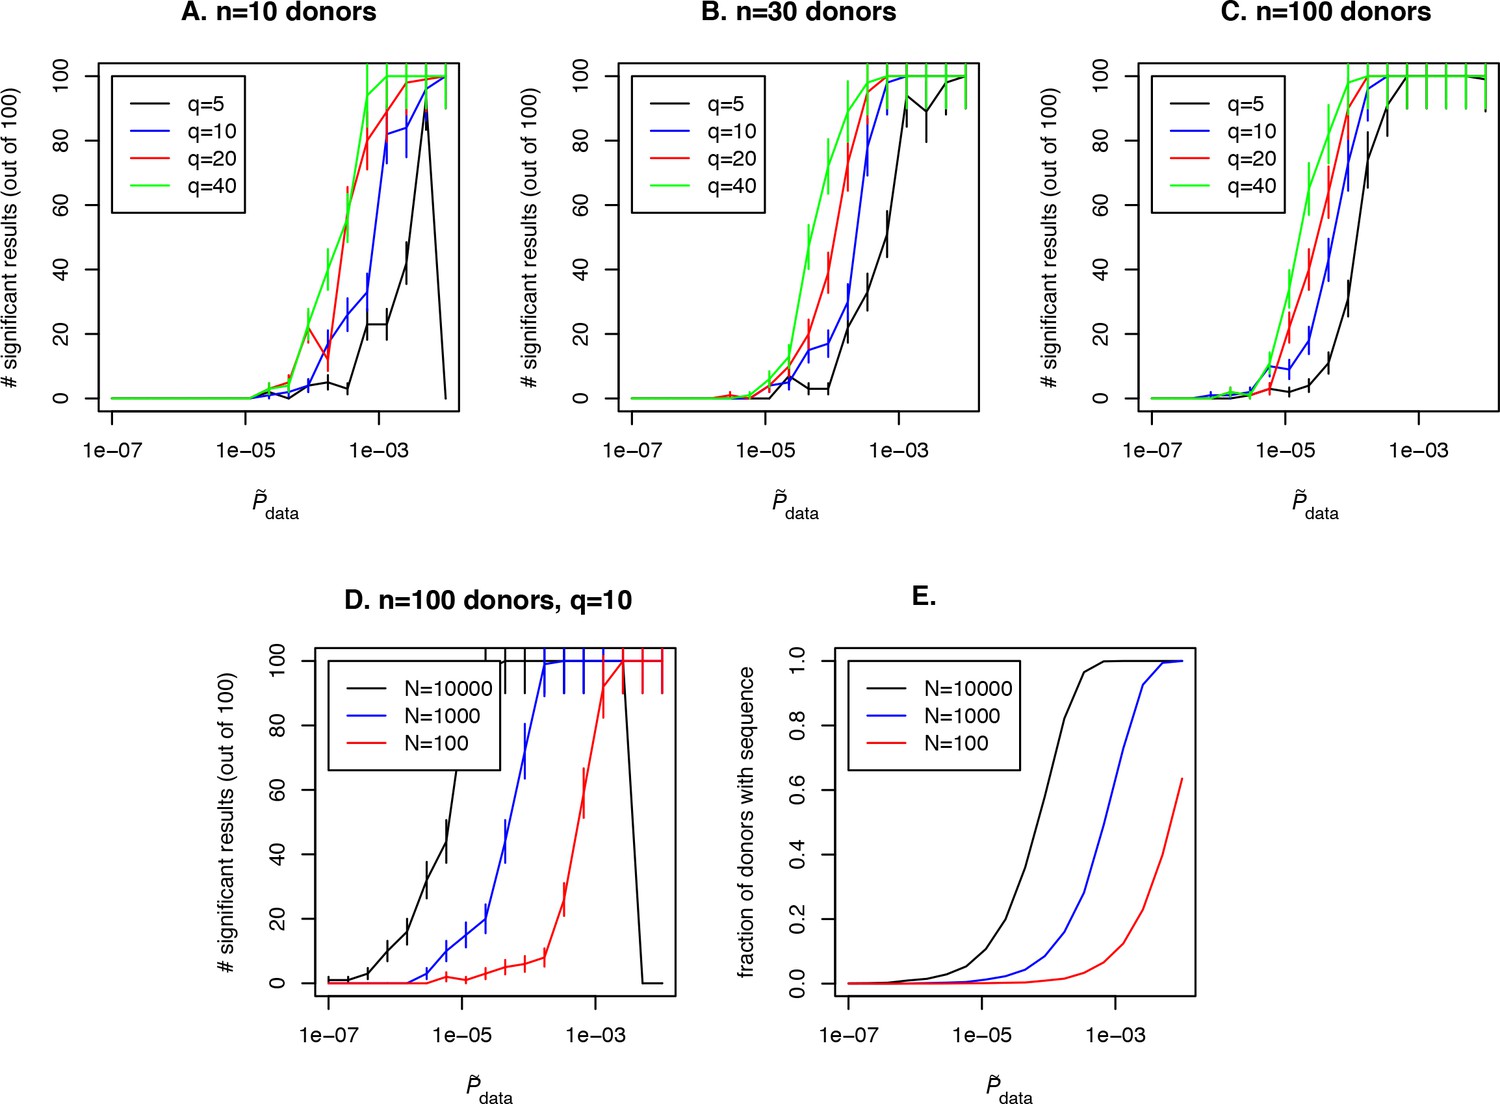
Simulation of the method performance with different cohort sizes, sequencing depths, effect sizes and target clone abundances in population.

In panels (A. B. C) we plot the number of simulations (out of 100) where a clone with a given effect size q (line color, see legend) and P~data (x-axis) is found to be significant using our approach, for cohort sizes of 10, 30 and 100 donors respectively. Larger cohort sizes and effect sizes make it possible to resolve clonotypes with lower abundance in the population. In panel (D) we show the effect of sequencing depth for fixed q=10: larger numbers of clonotypes sequenced per donor allow us to resolve less frequent clones, since a clone of a given P~data is detected in a larger fraction of donors (panel E).

https://doi.org/10.7554/eLife.33050.007
(11) P(Ppost>Pdata)=0Ppostρ(Pdata|x1,,xn)dPdata,

where ρ(Pdata|x1,,xn) is the posterior density, and check if P(Ppost>Pdata) is below a significance threshold of 0.0001. Such a low significant threshold in this example is chosen to take into account the multiple testing correction: we assume that about 1000 shared clones would be tested in a such analysis and p¡0.01 after multiple testing is chosen as the significance threshold in this study, which gives p¡0.0001 before the Bonferroni multiple testing correction. Then we plot the number of simulations in which a significant result was obtained for given effect size q and P~data for the clone of interest and the fraction of donors with this sequence in the simulated cohort (see Figure 4E, blue curve). Unsurprisingly, the effect size plays a role in the probability to detect an antigen specific clone, and the detection is not possible at all if the clone is not shared between several donors in the cohort (in our example this happens for P~data<10-5) irrespective to the effect size. Larger cohort sizes can help to resolve clones with lower abundances, but sequencing depth also has a strong effect on the power of the approach. In Figure 4D and E we show simulation results for a fixed q=10 and different sequencing depths Ni of 100, 1000 or 10000 clones per donor in a given VJ combination. Interestingly, a large sequencing depth (black curve) can lead to a situation when an abundant and frequently generated clone will not be detected by the algorithm, because it will be found in all donors in the cohort. An additional test that checks the predictions by lowering the sequencing depth in silico by downsampling can solve this problem.

Another complicated question is how Pdata is related to the number of clones and the fraction of the repertoire involved in the response to the infection in a given donor. If the same antigen-specific clone is present in every donor, Pdata is close to the average abundance of this clone in the repertoire. However one can imagine an opposite situation where the response is so diverse and private that different clones respond to a given antigen in each donor. It was previously shown that the diversity and publicness of responding T-cell clonotypes varies a lot across antigens (Dash et al., 2017). Our approach is restricted to the identification of public antigen-specific clonotypes, which may not exist for all antigens.

Data availability

The following previously published data sets were used

References

Decision letter

  1. Arup K Chakraborty
    Reviewing Editor; Massachusetts Institute of Technology, United States

In the interests of transparency, eLife includes the editorial decision letter and accompanying author responses. A lightly edited version of the letter sent to the authors after peer review is shown, indicating the most substantive concerns; minor comments are not usually included.

Thank you for submitting your article "Method for identification of condition-associated public antigen receptor sequences" for consideration by eLife. Your article has been reviewed by two peer reviewers, and the evaluation has been overseen by a Reviewing Editor and Arup Chakraborty as the Senior Editor. The reviewers have opted to remain anonymous.

The reviewers have discussed the reviews with one another and the Reviewing Editor/Senior Editor has drafted this decision to help you prepare a revised submission.

Your manuscript describes a computational pipeline that identifies particular TCR sequences that are over represented in groups of individuals. In effect, it identifies the outlier TCR sequences populations from a computationally determined normal distribution. You go on to show that, based on TCR deep sequencing datasets, this method can retrospectively identify TCRβ chains that are over represented following CMV infections, and TCRβ sequences that have reactivity to defined autoantigens in type 1 diabetes. The manuscript is theoretically interesting, useful, timely, and clearly written. However, we have some significant concerns about the general applicability of this tool and its value for prospective, rather than retrospective, studies. These concerns are listed below and need to be addressed in a revision.

1) Methods to identify outlier populations are understood and statistical approaches to achieve this goal are available. Indeed, a related approach to this question is the basis for lymphoid tumor diagnostic methodologies being pursued by several companies. In what ways is your tool different/better compared to the available methods?

2) Your work is based on small cohorts of patients. HCMV can be responsible for a disproportionate number of TCR clonotypes and can have a stable profile over many years, even by the standards of other chronic infections. So, we wonder whether an attractive feature of this tool, which is its ability to glean information from data on small cohorts will carry over beyond the HCMV setting. Would one need a larger cohort for most disease applications? Is there a theoretical way to estimate what part of the repertoire (in terms of unique clones and their frequencies) has to be devoted to an infectious disease in order for it to be resolved in a given cohort size (maybe a scaling rule)?

3) A general concern is whether this tool will have broad impact. You used TCR sequence data sets of HLA-matched patients, which had already been shown to have T cell expansion to a defined peptide/HLA combination. The approach works if one has HLA-matched subjects, because one would assume in general that different HLA alleles will present a different spectrum of peptides, and that TCR Vgene – HLA interactions impact ligand specificity. Further, a significant element to the approach only works retrospectively; without prior knowledge of the TCR specificity one does not know whether the identified outlier populations are disease-relevant. For example, in Figure 2, there are many outlier sequences (red), which may be noise, may be disease relevant or may be consequences of HLA-biased selection that was not accounted for by the authors computationally-defined normal TCRb distribution. Can the method be useful for prospective studies, or learn new biology in retrospective studies? Perhaps one way to address this question is the following:

Is there any other viral infection for which comparable data is available? For instance, it would be nice if data on viruses like HSV or EBV were available along with data related to acute infection or vaccination (where a method such as this, if applicable, would be incredibly valuable).

[Editors' note: further revisions were requested prior to acceptance, as described below.]

Thank you for resubmitting your work entitled "Method for identification of condition-associated public antigen receptor sequences" for further consideration at eLife. Your revised article has been favorably evaluated by Arup Chakraborty (Senior editor), a Reviewing editor, and 1 reviewer.

You present an important statistical tool for analyzing TCR sequence diversity. We will soon get to a point where entire human TCR repertoires will be sequenced and then the question is how do we understand this data to assess immune health – your method is an advance that allows us to take steps toward this goal, and is therefore a valuable resource/tool. However, you often confuse TCR with clonotype in the writing of your paper. A TCR β chain sequence is not a TCR clonotype. Throughout the manuscript, you describe what you are analyzing as TCR clonotypes when you are actually referring to independent TCR β sequences. An independent TCR α chain or a TCR β chain sequence is NOT a receptor. Once this point is consistently clarified in the manuscript, your paper will be accepted.

Reviewer #1:

Re-review:

The major concern I have with the method, writing and the inability of this platform to provide a framework for prospective studies is the author's miss-statements (I assume they know better) that a TCR β chain sequence is not a TCR clonotype. Throughout the manuscript, they authors describe what they are analyzing as TCR clonotypes when they are actually referring to independent TCR β sequences. An independent TCRa chain or a TCRb chain sequence is NOT a receptor. The CDR3beta sequence does not equal or even mark a particular T cell clone.

Problem statement that this creates:

Example in the Introduction: the authors argue that there are "Several mechanisms leading to the repertoire overlap. The first mechanism is convergent recombination[…]" This first statement or option is a product of sequencing just the TCRb chain, i.e., there are common rearrangements that occur do to V-J or V-D-J rearrangements that have no or few N-region additions. The second and third "options" are indeed TCRa + TCRb clonotypes, comparing the first possibility to 2 and 3 is comparing apples to oranges.

Due to biases in V(D)J recombination process, the probability of generation of some receptors is very high, making them appear in almost every individual multiple times and repeatedly sampled in repertoire profiling experiments Britanova et al., (2014). This sharing does not result from a common specificity or function of the shared clonotypes and may in fact correspond to cells from the naive compartment in both donors Quigley et al., (2010), or from functionally distinct subsets such as CD4 and CD8 T-cells.

The second possible reason for TCR sequence sharing is specific to identical twins, who may share T cell clones as a consequence of cord blood exchange in utero via a shared placenta Pogorelyy et al., (2017). The third and most interesting mechanism for sharing receptor sequences is convergent selection, in response to a common antigen.

- The terminology makes these types of statements nonsensical. Identical TCR clonotypes will absolutely have the identical antigen-specificity.

Issues that miss-representing TCRb sequences for TCR clonotypes in the general approach being promoted:

The incorrect use of TCR clonotype leads to some particularly difficult to imagine scenarios. For examples, in the reviewer response and within the manuscript, "our method can be used to narrow down the potential candidates for further experimental validation of responsive receptors." (i.e., identify the antigen being recognized). Their idea regarding this approach is to use: "Functional tests (like cultivation with peptides, or cytokine secretion assays) are the ultimate way to confirm specificity of these predicted clonotypes."

Within the cover letter: "We also are careful to note that this method should be used to identify antigen-specific candidates that need to be further verified by other methods. Nevertheless, we believe that identifying candidates for these experiments is extremely useful."

- However, the sequencing and analyses method of the manuscript does not identify the V α chain, with only half of the receptor there is nothing to study further. Thus, there is no method provided that one could identify interesting receptors for prospective studies.

In summary, this is a method to identify outlier populations, for which retrospective data can be superimposed to create a snapshot of an immune response that has already been described using for example pMHC tetramers or other methods.

https://doi.org/10.7554/eLife.33050.014

Author response

Your manuscript describes a computational pipeline that identifies particular TCR sequences that are over represented in groups of individuals. In effect, it identifies the outlier TCR sequences populations from a computationally determined normal distribution. You go on to show that, based on TCR deep sequencing datasets, this method can retrospectively identify TCRβ chains that are over represented following CMV infections, and TCRβ sequences that have reactivity to defined autoantigens in type 1 diabetes. The manuscript is theoretically interesting, useful, timely, and clearly written. However, we have some significant concerns about the general applicability of this tool and its value for prospective, rather than retrospective, studies. These concerns are listed below and need to be addressed in a revision.

1) Methods to identify outlier populations are understood and statistical approaches to achieve this goal are available. Indeed, a related approach to this question is the basis for lymphoid tumor diagnostic methodologies being pursued by several companies. In what ways is your tool different/better compared to the available methods?

Current approaches for lymphoid tumor and minimal residual disease (MRD) diagnostics rely on longitudinal tracking of certain malignant rearrangements before and after treatment. These technologies use the abundance of the malignant clones in the organism before and after the treatment, which is measured directly with NGS, qPCR or flow cytometry. The sequences of the malignant clones are not linked to a known function. In our method we use a sequence-based theoretical estimate of a TCR clone’s abundance in the population to identify candidates for functional receptors that are convergently selected in different patients in response to a specific disease, which is a different task than the direct longitudinal tracking of clonotypes. However, there is a possible lesson to be learned from the overlap between the two methods: tracking malignant clones that have a high recombination probability may not be reliable because one could find an independently recombined healthy clone with the same sequence and interpret it as malignant. Conversely, the TCR recombination probability may be used to identify malignant TCR clones not suitable for longitudinal tracking due to their high probability to be recombined multiple times (Nazarov et al., 2016). If such clonotypes are found after chemotherapy in lymphoma patients, they could be surviving malignant clonotypes as usually assumed, but alternatively they could be different healthy clones with exactly the same independently recombined TCR sequence. In this case it is better to use different MRD markers and the antigen receptor generation probability could help to identify this situation.

We added the following text to clarify the features of our method (Discussion section):

“Antigen receptor sequencing currently has little clinical applications. One of the most important ones is diagnostics and tracking of malignant T-cell and B-cell clones in lymphomas, where it allows for directly measuring the abundances of certain clones at different timepoints. Our method allows for a sequence-based theoretical prediction of T-cell abundances at the population level, and for the identification of T-cell clones associated with infectious and autoimmune conditions. Extensive databases of condition-associated clones can provide a means of disease diagnostics and extend the clinical utility of antigen receptor repertoire sequencing technologies.”

2) Your work is based on small cohorts of patients. HCMV can be responsible for a disproportionate number of TCR clonotypes and can have a stable profile over many years, even by the standards of other chronic infections. So, we wonder whether an attractive feature of this tool, which is its ability to glean information from data on small cohorts will carry over beyond the HCMV setting. Would one need a larger cohort for most disease applications?

Data from published studies suggests that CMV is not a unique condition both in terms of the response magnitude and the number of donors sharing disease specific clones. Faham et al., have shown that 30–40 percent of donors with ankylosing spondylitis share a certain aminoacid TCR sequence, which is absent in healthy controls. This sharing number is larger than the fraction of donors sharing a CMV-specific clone in our current study. We would have liked to analyze different datasets, but we could not access other datasets with suitable cohort sizes and sequencing depth (see below for a discussion of this point).

One can also extend this method to acute infections. It is known that CMV-related clonotypes can occupy a large fraction of the repertoire for a long time [Khan et al., 2004]. However, in an acute viral infection model of yellow fever immunization it was shown that YF-reactive clones that are undetected in the repertoire before immunization can occupy up to 10 percent of the repertoire at the peak of the response (Miller et al., 2008, DeWitt et al., 2015). The response to acute infections is much less stable and strongly decreases on short timescales, but one may overcome this limitation by collecting samples at the peak of the immune response to an infection.

We added the following sentences into the text to clarify this point (Discussion section):

“The cohort size necessary for the identification of antigen-specific clonotypes with our method varies (see “Designing the experiment” subsection in Methods). It depends on the strength and diversity of the response to the given antigen. […] T-cell response to herpesviruses is also not unique in terms of public clonotype involvement – in ankylosing spondylitis (Faham et al., 2017), 30–40 percent of patients share a certain TCR aminoacid sequence, which is more than the fraction of patients sharing CMV-specific clonotypes that we analysed in this study.”

Is there a theoretical way to estimate what part of the repertoire (in terms of unique clones and their frequencies) has to be devoted to an infectious disease in order for it to be resolved in a given cohort size (maybe a scaling rule)?

This is a very interesting question, which we now address with a new section and discussion. In short, the answer depends on both the cohort size and the sequencing depth. To simplify the experiment design, we added an additional pipeline into the software, which is able to tell if a clone of given abundance in the population of patients would be resolved in a given cohort size.

We added an additional subsection in the Materials and methods section (“Designing the experiment”) and a new figure (see Figure 4), demonstrating examples of such analysis.

3) A general concern is whether this tool will have broad impact. You used TCR sequence data sets of HLA-matched patients, which had already been shown to have T cell expansion to a defined peptide/HLA combination. The approach works if one has HLA-matched subjects, because one would assume in general that different HLA alleles will present a different spectrum of peptides, and that TCR Vgene – HLA interactions impact ligand specificity. Further, a significant element to the approach only works retrospectively; without prior knowledge of the TCR specificity one does not know whether the identified outlier populations are disease-relevant. For example, in Figure 2, there are many outlier sequences (red), which may be noise, may be disease relevant or may be consequences of HLA-biased selection that was not accounted for by the authors computationally-defined normal TCRb distribution. Can the method be useful for prospective studies, or learn new biology in retrospective studies?

Our study may seem retrospective, because we chose examples where the right answer (public clonotypes with proved specificity) is known. This was necessary to validate the output of the algorithm. In 3 experiments out of 4 the correct (meaning validated in the source study) clonotype was the most significant signal in our analysis. We also are careful to note that this method should be used to identify antigen-specific candidates that need to be further verified by other methods. Nevertheless, we believe that identifying candidates for these experiments is extremely useful.

Functional tests (like cultivation with peptides, or cytokine secretion assays) are the ultimate way to confirm specificity of these predicted clonotypes. Clonal expansion of identified clonotypes at the inflammation site, presence in the repertoire of activated/memory T-cells, or absence in the control cohort repertoire, may provide additional evidence for condition-association of a given candidate clone.

We added the following sentence into the main text (Results section):

“Additional information, like the expansion of the identified clone in the inflammation site, the presence of the same clonotype in the repertoire of activated or memory T-cells, or absence in a cohort of healthy controls, could provide additional evidence for functional association of identified candidates with a given condition.”

Additionally, there is an interest in purely retrospective studies. In retrospective studies (where the specificity of TCR clones is already defined using, for example, MHC-multimers) it may be useful to predict the abundance of the known antigen-specific clones in the general population. For instance, if a researcher isolated and sequenced antigen-specific T-cells from a patient, some of these T-cell clones could be private and may not be found in other people, while some of them may be public, and easily found in many more yet unstudied patients. Such public clones are much more valuable for diagnostics, and they can be identified using only their TCR aminoacid sequence in such retrospective studies.

We added the following sentences to the main text to clarify this point (Discussion section):

“This method may also be useful in the analysis of known antigen-specific TCR clonotypes. The typical source of such TCR sequences are MHC-multimer positive cells isolated from one or a few donors (Shugay et al., 2017., Tickotsky et al., 2017). Some of these antigen-specific clonotypes are private, and are hard to find in other patients, providing limited diagnostic value. Our method is able to distinguish these clones from publicly responding clonotypes that are likely to be shared by many patients using only their CDR3 amino acid sequence.”

Perhaps one way to address this question is the following:

Is there any other viral infection for which comparable data is available? For instance, it would be nice if data on viruses like HSV or EBV were available along with data related to acute infection or vaccination (where a method such as this, if applicable, would be incredibly valuable).

To our knowledge, only one study on response to acute infection is available: DeWitt et al., 2015. We have tried to analyze this dataset but unfortunately, only 9 donors are available in this study, which is not enough to get significant results with our method. The authors also do not report sequences of significantly expanded clonotypes, so it is not possible to validate the output of the algorithm.

As a rule of thumb, assuming currently used typical sequencing depth, our method is applicable for identification of shared TCR sequences in vaccination and acute infection data, but cohorts of at least 20–30 donors are required for such analysis.

[Editors' note: further revisions were requested prior to acceptance, as described below.]

You present an important statistical tool for analyzing TCR sequence diversity. We will soon get to a point where entire human TCR repertoires will be sequenced and then the question is how do we understand this data to assess immune health – your method is an advance that allows us to take steps toward this goal, and is therefore a valuable resource/tool. However, you often confuse TCR with clonotype in the writing of your paper. A TCR β chain sequence is not a TCR clonotype. Throughout the manuscript, you describe what you are analyzing as TCR clonotypes when you are actually referring to independent TCR β sequences. An independent TCR α chain or a TCR β chain sequence is NOT a receptor. Once this point is consistently clarified in the manuscript, your paper will be accepted.

We agree that our terminology was not specific enough and may confuse the readers. We have updated the manuscript to be more specific about single α or β chains and complete α/β TCR clonotypes. See our point-by-point response and implemented change below

Reviewer #1:

Re-review:

The major concern I have with the method, writing and the inability of this platform to provide a framework for prospective studies is the author's miss-statements (I assume they know better) that a TCR β chain sequence is not a TCR clonotype. Throughout the manuscript, they authors describe what they are analyzing as TCR clonotypes when they are actually referring to independent TCR β sequences. An independent TCRa chain or a TCRb chain sequence is NOT a receptor. The CDR3beta sequence does not equal or even mark a particular T cell clone.

We completely agree with the reviewer and have updated the manuscript to clarify this point.

We have edited the first paragraph of the Introduction:

“These receptors consist of two hypervariable chains, the α and β chains in the case of TCR. Progress in high throughput sequencing now allows for deep profiling of TCRalpha and TCRbeta chain repertoires, by establishing a near-complete list of unique receptor chain sequences, or ‘’clonotypes’’, present in a sample. Most sequencing data available corresponds to TCRbeta, but the same principles discussed below apply to TCRalpha repertoires or to paired α β repertoires.”

We also specified when we talk about single T-cell receptor chains specifically throughout the text.

Problem statement that this creates:

Example in the Introduction: the authors argue that there are "Several mechanisms leading to the repertoire overlap. The first mechanism is convergent recombination…" This first statement or option is a product of sequencing just the TCRb chain, i.e., there are common rearrangements that occur do to V-J or V-D-J rearrangements that have no or few N-region additions. The second and third "options" are indeed TCRa + TCRb clonotypes, comparing the first possibility to 2 and 3 is comparing apples to oranges.

Due to biases in V(D)J recombination process, the probability of generation of some receptors is very high, making them appear in almost every individual multiple times and repeatedly sampled in repertoire profiling experiments Britanova et al., (2014). This sharing does not result from a common specificity or function of the shared clonotypes and may in fact correspond to cells from the naive compartment in both donors Quigley et al., (2010), or from functionally distinct subsets such as CD4 and CD8 T-cells.

The second possible reason for TCR sequence sharing is specific to identical twins, who may share T cell clones as a consequence of cord blood exchange in utero via a shared placenta Pogorelyy et al., (2017). The third and most interesting mechanism for sharing receptor sequences is convergent selection, in response to a common antigen.

- The terminology makes these types of statements nonsensical. Identical TCR clonotypes will absolutely have the identical antigen-specificity.

We agree with the reviewer that case 2 (physical sharing of cells) implies the sharing of complete α/β TCR sequence. In case 3 (selection by affinity to the same antigen), the situation varies for different epitopes and in some cases tetramer-sorted T-cells of the same specificity have been reported to have the same TCRbeta but very different TCRalpha, and vice versa (see examples of paired sequences from (Dash et al., 2017), deposited to vdjdb.cdr3.net)). Therefore, the sharing of single receptor chain sequences due to selection by affinity to the same antigen is generally more likely than sharing of complete α/β TCR.

We have edited the second paragraph of the introduction to clarify these points in the following way:

“Comparison of sequenced repertoires has revealed that in any pair of individuals, large numbers of TCRbeta sequences have the same amino acid sequence Venturi et al., (2011). […] From functional studies, such as sequencing of MHC-multimer specific T-cells, it is known that the antigen-specific repertoire is often biased, and the same antigen-specific TCR β or α chain sequences can be found in different individuals Miles et al., (2011); Dash et al., (2017); Glanville et al., (2017).”

Issues that miss-representing TCRb sequences for TCR clonotypes in the general approach being promoted:

The incorrect use of TCR clonotype leads to some particularly difficult to imagine scenarios. For examples, in the reviewer response and within the manuscript, "our method can be used to narrow down the potential candidates for further experimental validation of responsive receptors." (i.e., identify the antigen being recognized). Their idea regarding this approach is to use: "Functional tests (like cultivation with peptides, or cytokine secretion assays) are the ultimate way to confirm specificity of these predicted clonotypes."

Within the cover letter: "We also are careful to note that this method should be used to identify antigen-specific candidates that need to be further verified by other methods. Nevertheless, we believe that identifying candidates for these experiments is extremely useful."

We agree with reviewer that the mere TCR β chain or the mere TCR α chain does not determine complete receptor specificity. The TCRbeta sequence is definitely not enough to determine receptor specificity in vitro. However, if a β-chain or an α-chain shared in patient cohort is identified as significant by our approach it is likely to be a part of T-cell receptor with the same specificity in each patient. T-cells from patients with the largest expansion of identified TCRbeta or TCRalpha clonotypes could then be used for single cell RNA sequencing to identify partner receptor chains or for various functional assays with candidate antigens.

We added sentences to the Discussion section on the contribution of both receptor chains to TCR specificity and possible assays to identify second receptor chain and possible antigen, see below.

- However, the sequencing and analyses method of the manuscript does not identify the V α chain, with only half of the receptor there is nothing to study further. Thus, there is no method provided that one could identify interesting receptors for prospective studies.

We agree that complete antigen-specific α/β T-cell receptor sequences would be much more informative and practically useful for prospective studies. Unfortunately, technologies for paired sequencing of α and β TCR chains (i.e. single-cell RNAseq) are still relatively low-throughput and expensive, comparing to the conventional RepSeq study targeting only single receptor chains. TCRalpha and TCRbeta pairing information is also impossible to retrieve from the bulk RNA-seq data. There are no published large datasets of complete paired α/β TCR sequences for cohorts of patients with the same condition. However, if such datasets were to become available in the future, our approach could be used directly to identify candidate complete receptor sequences there. The idea would be the same: the presence of shared TCR α chains, or β chains, or paired α β clonotypes with low recombination probability in many patients is the consequence of clonal expansion after recognition of the same antigenic peptide, and paired TCRbeta-TCRalpha datasets would allow us to retrieve the partner α chain (for TCRbeta condition-associated clonotypes, and vice versa for TCRalpha analysis) from each donor, yielding several complete α/β candidate receptors.

We also believe that even single condition-associated TCRbeta or TCRalpha chain sequences could be useful for diagnostic purposes, as was demonstrated by (Emerson et al., 2017) for CMV-associated TCRbeta clonotypes.

We have added the following text to the Discussion section to emphasize that single receptor chain does not fully determine TCR specificity. We also reference recently emerged methods to identify the second receptor chain, and to determine specificity of the complete α/β TCR, which might be useful in combination with our approach:

“Our approach can be used on other hypervariable receptor chains (TCR α, BCR heavy and light chains), as well as other species (mice, fish, etc.). […] As paired sequencing becomes more widespread, our method can be extended to the analysis of full paired TCR by applying the exact same analysis using the joint recombination probability of α β clonotypes.”

In summary, this is a method to identify outlier populations, for which retrospective data can be superimposed to create a snapshot of an immune response that has already been described using for example pMHC tetramers or other methods.

https://doi.org/10.7554/eLife.33050.015

Article and author information

Author details

  1. Mikhail V Pogorelyy

    Department of Genomics of Adaptive Immunity, Shemyakin-Ovchinnikov Institute of Bioorganic Chemistry of the Russian Academy of Sciences, Moscow, Russia
    Contribution
    Conceptualization, Data curation, Software, Formal analysis, Validation, Investigation, Visualization, Methodology, Writing—original draft, Writing—review and editing
    Competing interests
    No competing interests declared
    ORCID icon "This ORCID iD identifies the author of this article:" 0000-0003-0773-1204
  2. Anastasia A Minervina

    Department of Genomics of Adaptive Immunity, Shemyakin-Ovchinnikov Institute of Bioorganic Chemistry of the Russian Academy of Sciences, Moscow, Russia
    Contribution
    Data curation, Software, Investigation
    Competing interests
    No competing interests declared
  3. Dmitriy M Chudakov

    1. Department of Genomics of Adaptive Immunity, Shemyakin-Ovchinnikov Institute of Bioorganic Chemistry of the Russian Academy of Sciences, Moscow, Russia
    2. Center for Data-Intensive Biomedicine and Biotechnology, Skolkovo Institute of Science and Technology, Moscow, Russia
    3. Central European Institute of Technology, Brno, Czech republic
    Contribution
    Conceptualization, Resources, Supervision, Funding acquisition, Investigation, Methodology, Project administration, Writing—review and editing
    Competing interests
    No competing interests declared
    ORCID icon "This ORCID iD identifies the author of this article:" 0000-0003-0430-790X
  4. Ilgar Z Mamedov

    Department of Genomics of Adaptive Immunity, Shemyakin-Ovchinnikov Institute of Bioorganic Chemistry of the Russian Academy of Sciences, Moscow, Russia
    Contribution
    Conceptualization, Resources, Supervision, Funding acquisition, Investigation, Methodology, Project administration, Writing—review and editing
    Competing interests
    No competing interests declared
  5. Yuri B Lebedev

    1. Department of Genomics of Adaptive Immunity, Shemyakin-Ovchinnikov Institute of Bioorganic Chemistry of the Russian Academy of Sciences, Moscow, Russia
    2. Biological Faculty, Moscow State University, Moscow, Russia
    Contribution
    Conceptualization, Resources, Supervision, Funding acquisition, Investigation, Methodology, Project administration, Writing—review and editing
    Contributed equally with
    Thierry Mora and Aleksandra M Walczak
    For correspondence
    lebedev_yb@mx.ibch.ru
    Competing interests
    No competing interests declared
  6. Thierry Mora

    Laboratoire de Physique Statistique, CNRS, Sorbonne University, Paris-Diderot University, École Normale Supérieure, Paris, France
    Contribution
    Conceptualization, Resources, Formal analysis, Supervision, Funding acquisition, Investigation, Methodology, Writing—original draft, Project administration, Writing—review and editing
    Contributed equally with
    Yuri B Lebedev and Aleksandra M Walczak
    For correspondence
    tmora@lps.ens.fr
    Competing interests
    No competing interests declared
    ORCID icon "This ORCID iD identifies the author of this article:" 0000-0002-5456-9361
  7. Aleksandra M Walczak

    Laboratoire de Physique Theorique, CNRS, Sorbonne University, École Normale Supérieure, Paris, France
    Contribution
    Conceptualization, Resources, Supervision, Funding acquisition, Investigation, Methodology, Writing—original draft, Project administration, Writing—review and editing
    Contributed equally with
    Yuri B Lebedev and Thierry Mora
    For correspondence
    awalczak@lpt.ens.fr
    Competing interests
    Reviewing editor, eLife
    ORCID icon "This ORCID iD identifies the author of this article:" 0000-0002-2686-5702

Funding

Russian Science Foundation (15-15-00178)

  • Dmitriy M Chudakov
  • Ilgar Z Mamedov
  • Yuri B Lebedev

European Research Council (724208)

  • Aleksandra M Walczak

The funders had no role in study design, data collection and interpretation, or the decision to submit the work for publication.

Acknowledgements

This work was supported by Russian Science Foundation grant 15-15-00178, and partially supported by European Research Council Consolidator Grant 724208.

Reviewing Editor

  1. Arup K Chakraborty, Massachusetts Institute of Technology, United States

Version history

  1. Received: October 24, 2017
  2. Accepted: March 12, 2018
  3. Accepted Manuscript published: March 13, 2018 (version 1)
  4. Version of Record published: March 28, 2018 (version 2)

Copyright

© 2018, Pogorelyy et al.

This article is distributed under the terms of the Creative Commons Attribution License, which permits unrestricted use and redistribution provided that the original author and source are credited.

Metrics

  • 2,933
    Page views
  • 534
    Downloads
  • 34
    Citations

Article citation count generated by polling the highest count across the following sources: Crossref, Scopus, PubMed Central.

Download links

A two-part list of links to download the article, or parts of the article, in various formats.

Downloads (link to download the article as PDF)

Open citations (links to open the citations from this article in various online reference manager services)

Cite this article (links to download the citations from this article in formats compatible with various reference manager tools)

  1. Mikhail V Pogorelyy
  2. Anastasia A Minervina
  3. Dmitriy M Chudakov
  4. Ilgar Z Mamedov
  5. Yuri B Lebedev
  6. Thierry Mora
  7. Aleksandra M Walczak
(2018)
Method for identification of condition-associated public antigen receptor sequences
eLife 7:e33050.
https://doi.org/10.7554/eLife.33050

Further reading

    1. Computational and Systems Biology
    2. Neuroscience
    Marjorie Xie, Samuel P Muscinelli ... Ashok Litwin-Kumar
    Research Article Updated

    The cerebellar granule cell layer has inspired numerous theoretical models of neural representations that support learned behaviors, beginning with the work of Marr and Albus. In these models, granule cells form a sparse, combinatorial encoding of diverse sensorimotor inputs. Such sparse representations are optimal for learning to discriminate random stimuli. However, recent observations of dense, low-dimensional activity across granule cells have called into question the role of sparse coding in these neurons. Here, we generalize theories of cerebellar learning to determine the optimal granule cell representation for tasks beyond random stimulus discrimination, including continuous input-output transformations as required for smooth motor control. We show that for such tasks, the optimal granule cell representation is substantially denser than predicted by classical theories. Our results provide a general theory of learning in cerebellum-like systems and suggest that optimal cerebellar representations are task-dependent.

    1. Computational and Systems Biology
    2. Neuroscience
    George Zacharopoulos, Francesco Sella ... Roi Cohen Kadosh
    Research Article

    Previous research has highlighted the role of glutamate and gamma-aminobutyric acid (GABA) in perceptual, cognitive, and motor tasks. However, the exact involvement of these neurochemical mechanisms in the chain of information processing, and across human development, is unclear. In a cross-sectional longitudinal design, we used a computational approach to dissociate cognitive, decision, and visuomotor processing in 293 individuals spanning early childhood to adulthood. We found that glutamate and GABA within the intraparietal sulcus (IPS) explained unique variance in visuomotor processing, with higher glutamate predicting poorer visuomotor processing in younger participants but better visuomotor processing in mature participants, while GABA showed the opposite pattern. These findings, which were neurochemically, neuroanatomically and functionally specific, were replicated ~21 mo later and were generalized in two further different behavioral tasks. Using resting functional MRI, we revealed that the relationship between IPS neurochemicals and visuomotor processing is mediated by functional connectivity in the visuomotor network. We then extended our findings to high-level cognitive behavior by predicting fluid intelligence performance. We present evidence that fluid intelligence performance is explained by IPS GABA and glutamate and is mediated by visuomotor processing. However, this evidence was obtained using an uncorrected alpha and needs to be replicated in future studies. These results provide an integrative biological and psychological mechanistic explanation that links cognitive processes and neurotransmitters across human development and establishes their potential involvement in intelligent behavior.