Quantification of anti-parasite and anti-disease immunity to malaria as a function of age and exposure

  1. Isabel Rodriguez-Barraquer  Is a corresponding author
  2. Emmanuel Arinaitwe
  3. Prasanna Jagannathan
  4. Moses R Kamya
  5. Phillip J Rosenthal
  6. John Rek
  7. Grant Dorsey
  8. Joaniter Nankabirwa
  9. Sarah G Staedke
  10. Maxwell Kilama
  11. Chris Drakeley
  12. Isaac Ssewanyana
  13. David L Smith
  14. Bryan Greenhouse
  1. San Francisco General Hospital, University of California, San Francisco, United States
  2. Infectious Diseases Research Collaboration, Uganda
  3. Stanford University, United States
  4. Makerere University College of Health Sciences, Uganda
  5. London School of Hygiene and Tropical Medicine, United Kingdom
  6. University of Washington, United States

Abstract

Fundamental gaps remain in our understanding of how immunity to malaria develops. We used detailed clinical and entomological data from parallel cohort studies conducted across the malaria transmission spectrum in Uganda to quantify the development of immunity against symptomatic P. falciparum as a function of age and transmission intensity. We focus on: anti-parasite immunity (i.e. ability to control parasite densities) and anti-disease immunity (i.e. ability to tolerate higher parasite densities without fever). Our findings suggest a strong effect of age on both types of immunity, not explained by cumulative-exposure. They also show an independent effect of exposure, where children living in moderate/high transmission settings develop immunity faster as transmission increases. Surprisingly, children in the lowest transmission setting appear to develop immunity more efficiently than those living in moderate transmission settings. Anti-parasite and anti-disease immunity develop in parallel, reducing the probability of experiencing symptomatic malaria upon each subsequent P. falciparum infection.

https://doi.org/10.7554/eLife.35832.001

eLife digest

Malaria kills around 500,000 children every year. The disease occurs when an infected mosquito bites a human and passes on a Plasmodium parasite. One parasite in particular, Plasmodium falciparum, is responsible for most malaria-related deaths across the globe. A person can be infected by P. falciparum many times throughout their life. However, after children have had multiple infections, they become less likely to develop symptoms of malaria, such as high fever. In other words, they gradually acquire immunity.

This immunity to malaria can come in two forms: “anti-parasite immunity”, where the body fights the parasites and keeps their numbers low; and “anti-disease immunity”, where the body is more likely to tolerate an infection without developing a fever. To date, scientists do not fully understand how either kind of immunity arises in children. Is it because they have simply been exposed to more malaria? Or does being older and having a more mature immune system also help?

Now, Rodriguez-Barraquer et al. have followed more than 1,000 children living in places with high, moderate and low rates of malaria infection in Uganda. Over three years, regular blood samples were taken to see if the children were infected with P. falciparum. Mosquitoes were also collected from their houses to estimate how often the children were being bitten and infected. Using this information, Rodriguez-Barraquer et al. studied the different factors that affect how children develop anti-parasite and anti-disease immunity.

Both types of immunity develop differently in places with high, moderate and low rates of infection, so being infected multiple times is important. Yet, the findings also show that growing older itself contributes to the development of immunity regardless of how often a child is infected.

Children who get infected most often – in other words, those living in houses with the most mosquitoes – develop immunity faster than those who get infected at a moderate rate. Unexpectedly, however, children living in places with low rates of infection also develop immunity faster than those living in places with moderate rates.

Understanding how children acquire immunity to malaria is important for people trying to control the disease. These results suggest that reducing rates of infection to very low levels may not interfere with development of immunity and may even improve it. However, future research should see if these findings apply to other parts of the world as well, and, if so, why children develop immunity faster in places with lower rates of malaria infection.

https://doi.org/10.7554/eLife.35832.002

Introduction

The last decades have seen substantial declines in malaria transmission in sub-Saharan Africa that are largely attributable to increased access to effective control measures, including insecticide-treated bednets, indoor residual spraying of insecticide and artemisinin-based combination therapy (Bhatt et al., 2015; World Health Organization, 2016). In settings where transmission has been low, increased access to effective control interventions opens the possibility for malaria elimination. In highly endemic settings, however, there are concerns around the potential impact of failing to sustain interventions that reduce but do not stop transmission. Short-term decreases in malaria incidence due to reductions in transmission could be offset over time by reductions in population immunity to malaria resulting from lower exposure to parasites (Filipe et al., 2007; Smith et al., 2001; Snow et al., 1997).

Gradual acquisition of immunity against symptomatic malaria (also referred to as clinical immunity) is a key driver of the epidemiology of malaria in endemic settings, where the incidence of disease typically peaks in early childhood and then declines, while the prevalence of detectable asymptomatic parasitemia increases throughout childhood before declining in adulthood (Griffin et al., 2015; Reyburn et al., 2005; Okiro et al., 2009; Carneiro et al., 2010; Idro et al., 2006; Roca-Feltrer et al., 2010; Rodriguez-Barraquer et al., 2016). While these epidemiologic patterns have been described across the transmission spectrum, there are still many fundamental gaps in our understanding of the factors driving the development of immunity, and of the independent roles of age and repeated infection. One reason it has been challenging to study immunity to malaria is that there are currently no agreed upon reliable and quantifiable immune correlates of protection that can be measured in epidemiological studies (Valletta and Recker, 2017; Fowkes et al., 2010). In addition, there are few available datasets that include both detailed clinical data and independent metrics of exposure at the individual level.

Here, we use data from three parallel cohort studies conducted across the spectrum of malaria transmission in Uganda to model and quantify the development of immunity against symptomatic malaria as a function of transmission intensity and age. A key strength of these studies is that they involved detailed clinical and entomological surveillance of all study households. We focus on two specific types of immunity: anti-parasite immunity (i.e. the ability to control parasite densities upon infection) and anti-disease immunity (i.e. the ability to tolerate higher parasite infections without developing objective fever), as they have been described as independent components of clinical immunity (Struik and Riley, 2004).

Results

The three cohorts enrolled a total of 1021 children aged 6 months to 10 years from 331 randomly chosen households across the three study sites. This analysis was limited to data from 773 children who experienced at least one patent P. falciparum infection between August 2011 and November 2014. Table 1 summarizes the general characteristics of the participants included in this analysis.

Table 1
Characteristics of the study participants.
https://doi.org/10.7554/eLife.35832.003
CharacteristicNagongeraKihihiWalukuba
Number of households10610076
Number of children329305139
Female, n (%)151(46)150 (49)66 (47)
Mean age at enrollment, years (sd)4.4 (2.7)4.6 (2.6)4.3 (2.6)
Mean follow up time, months (range)23.5 (0, 38.8)24.4 (0.8, 38.8)22.1 (2.3, 3.9)
Symptomatic malaria
Symptomatic Malaria episodes, n24471555207
Median number of symptomatic malaria episodes/child, n (range)6 (0, 29)4 (0, 30)1 (0. 12)
Median incidence of symptomatic malaria episodes ppy (range)2.6 (0, 10)1.6 (0, 15.2)0.6 (0, 5.1)
Asymptomatic parasitemia
Asymptomatic parasitemia episodes, n955331145
Median number of asymptomatic parasitemia episode/child, n (range)2 (0, 12)0 (0, 11)1 (0, 10)
Median prevalence of asymptomatic parasitemia (range)0.12 (0.07–0.17)0.05 (0.02–0.10)0.07 (0.03–0.11)
Household malaria exposure
Household aEIR, median (range)51 (10–582)7.7 (3.6–47)2.1 (1.5–8.1)

Participants living in Nagongera experienced the highest incidences of symptomatic malaria (median 2.6 episodes per person year), followed by those living in Kihihi (median 1.6 episodes per person year) and Walukuba (median 0.6 episodes per person year) (Table 1 and Figure 1). These incidences were consistent with results from monthly entomological surveys conducted in all cohort households, with significantly higher annual entomological inoculation rates (aEIR) recorded in Nagongera (median 51 infectious bites per year, range 10–582) as compared to Kihihi (median 8 infectious bites per year, range 4–47) and Walukuba (median 2 infectious bites per year, range 1–8). Interestingly, prevalence of asymptomatic parasitemia did not follow this same relationship; the prevalence of asymptomatic parasitemia was highest in Nagongera, and prevalences in the lower transmission sites were similar.

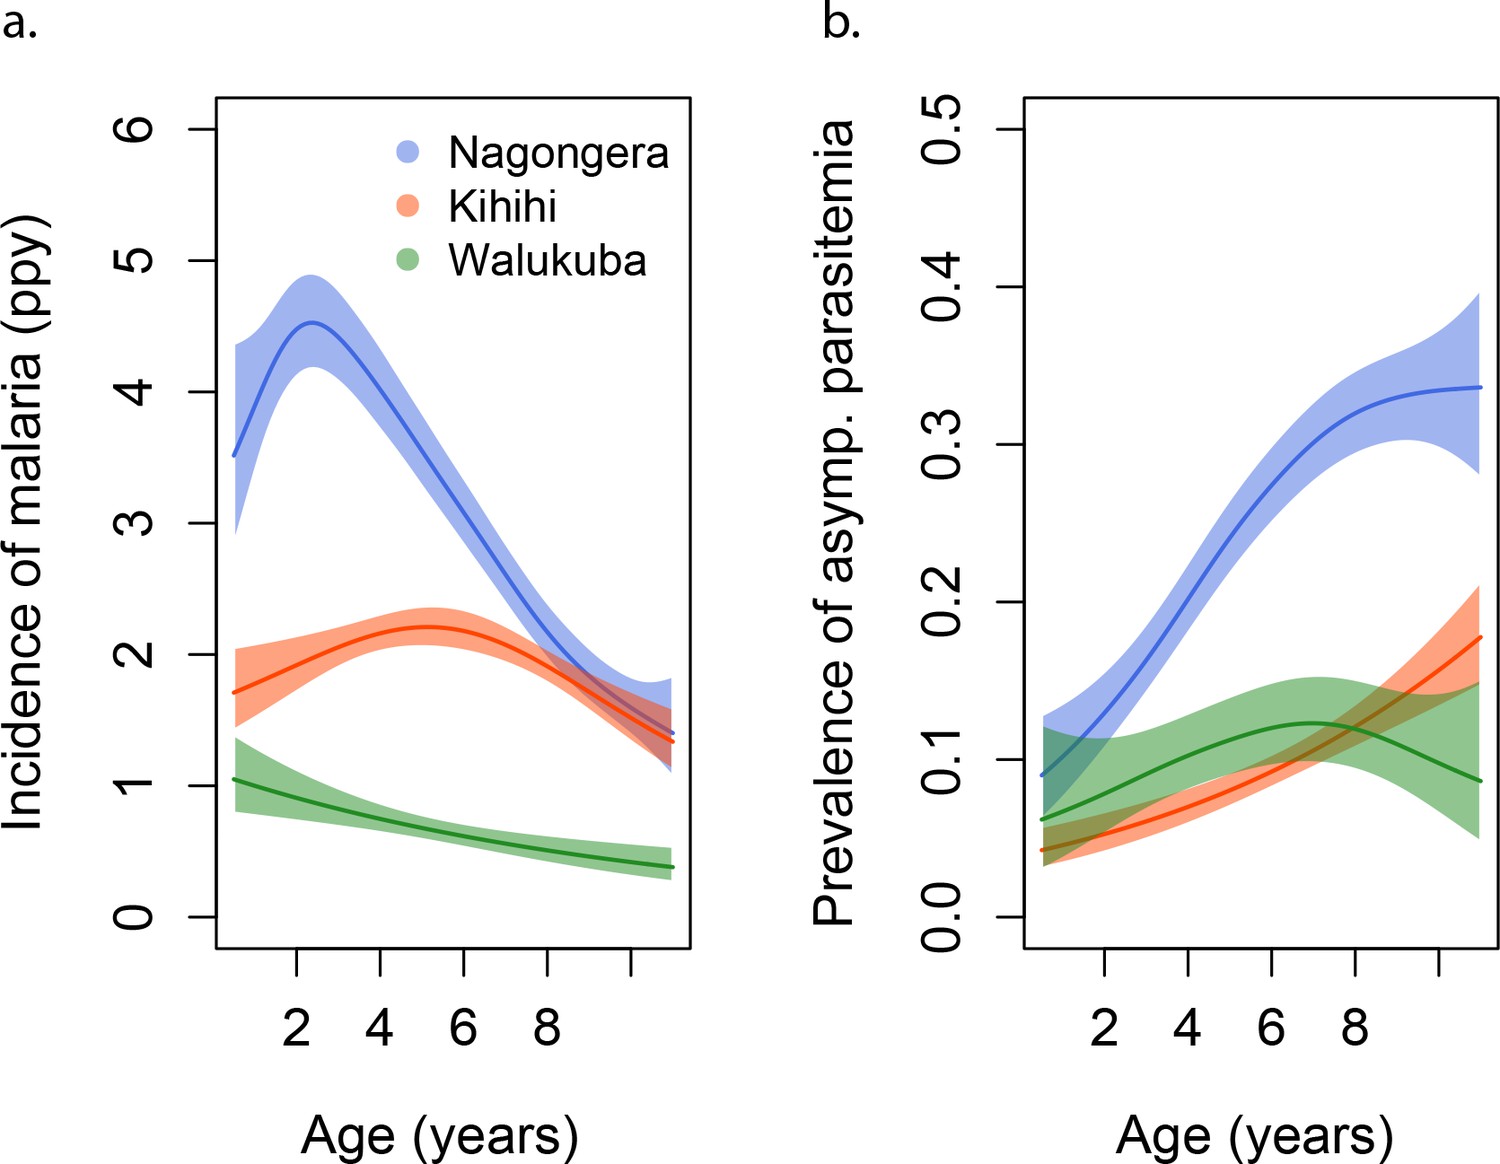
Incidence and prevalence of malaria as a function of age.

(a) and prevalence of asymptomatic parasitemia (b) in the three study sites as a function of age, modeled using generalized additive models (GAMS). Shaded areas represent 95% confidence bounds.

https://doi.org/10.7554/eLife.35832.004

aEIR as a metric of individual exposure

To assess whether entomological metrics were a good indicator of individual exposure to P. falciparum, we correlated the measured annual EIRs (aEIR) for each household (Figure 2a) with estimates of the average individual hazard of infection (Figure 2b). Individual hazards were estimated by fitting time-to-event models to the incidence data from each site. We found a significant correlation between these two independent metrics of exposure across sites (R2 = 0.47, p<0.001). aEIR explained less of the variance between individuals within each site: Nagongera (R2 = 0.03, p=0.004); Kihihi (R2 = 0.12, p<0.001); Walukuba (0.01, p=0.05).

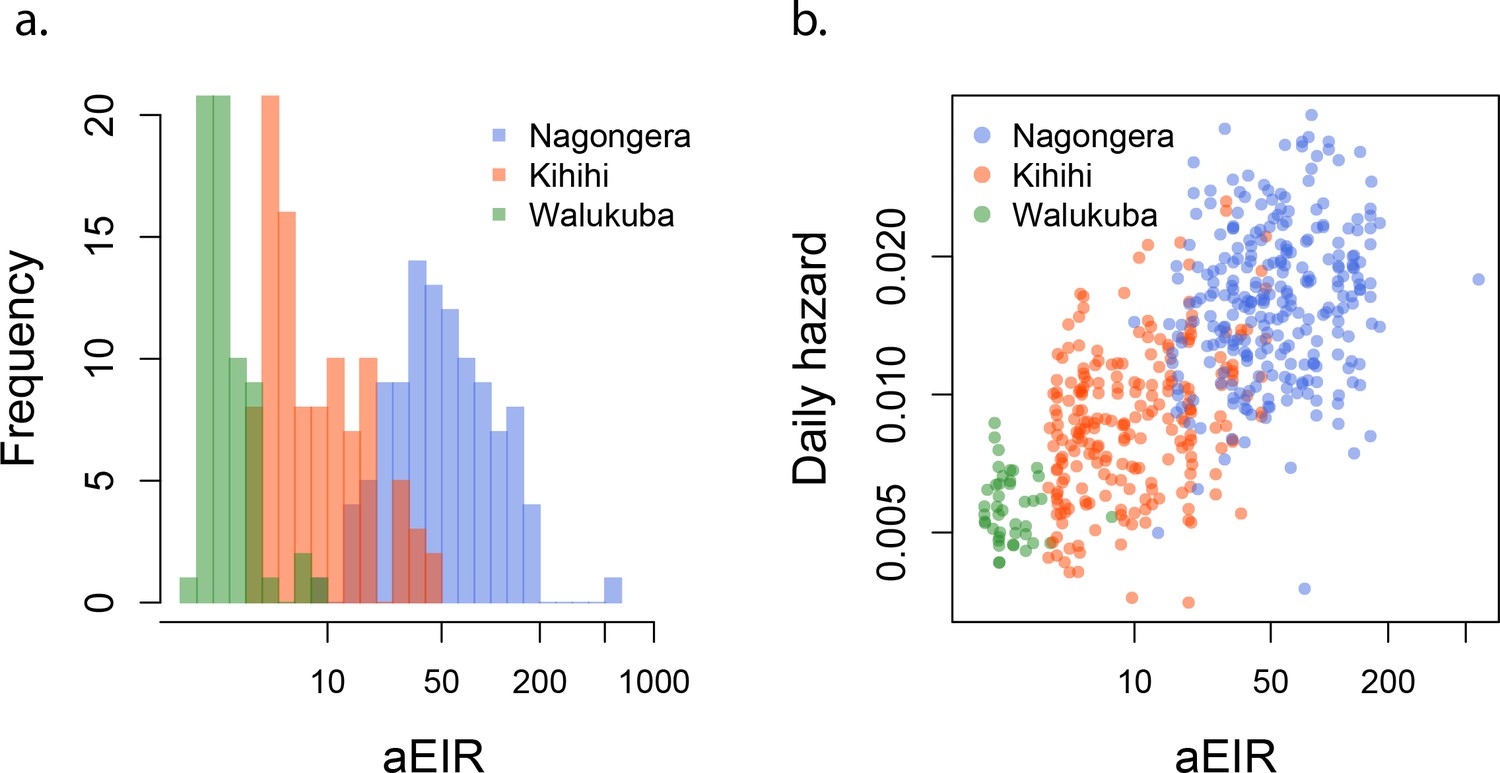
aEIR as a metric of individual exposure.

(a) Distribution of the average annual entomological inoculation rate (aEIR) experienced by the study households in the three study sites. (b) Correlation between the measured aEIRs and the estimated individual hazards of infection.

https://doi.org/10.7554/eLife.35832.005

Anti-parasite immunity

Parasite densities developed upon infection decreased with increasing age in all settings and for both symptomatic (passive detection) and asymptomatic (detected during routine visits) infections. Despite the large variability in parasite densities recorded within and between individuals, this trend is evident in the raw data (Figure 3a). A trend toward lower parasite densities was also observed among individuals living in settings with higher aEIRs (Nagongera), as compared to settings with lower aEIR (Kihihi and Walukuba).

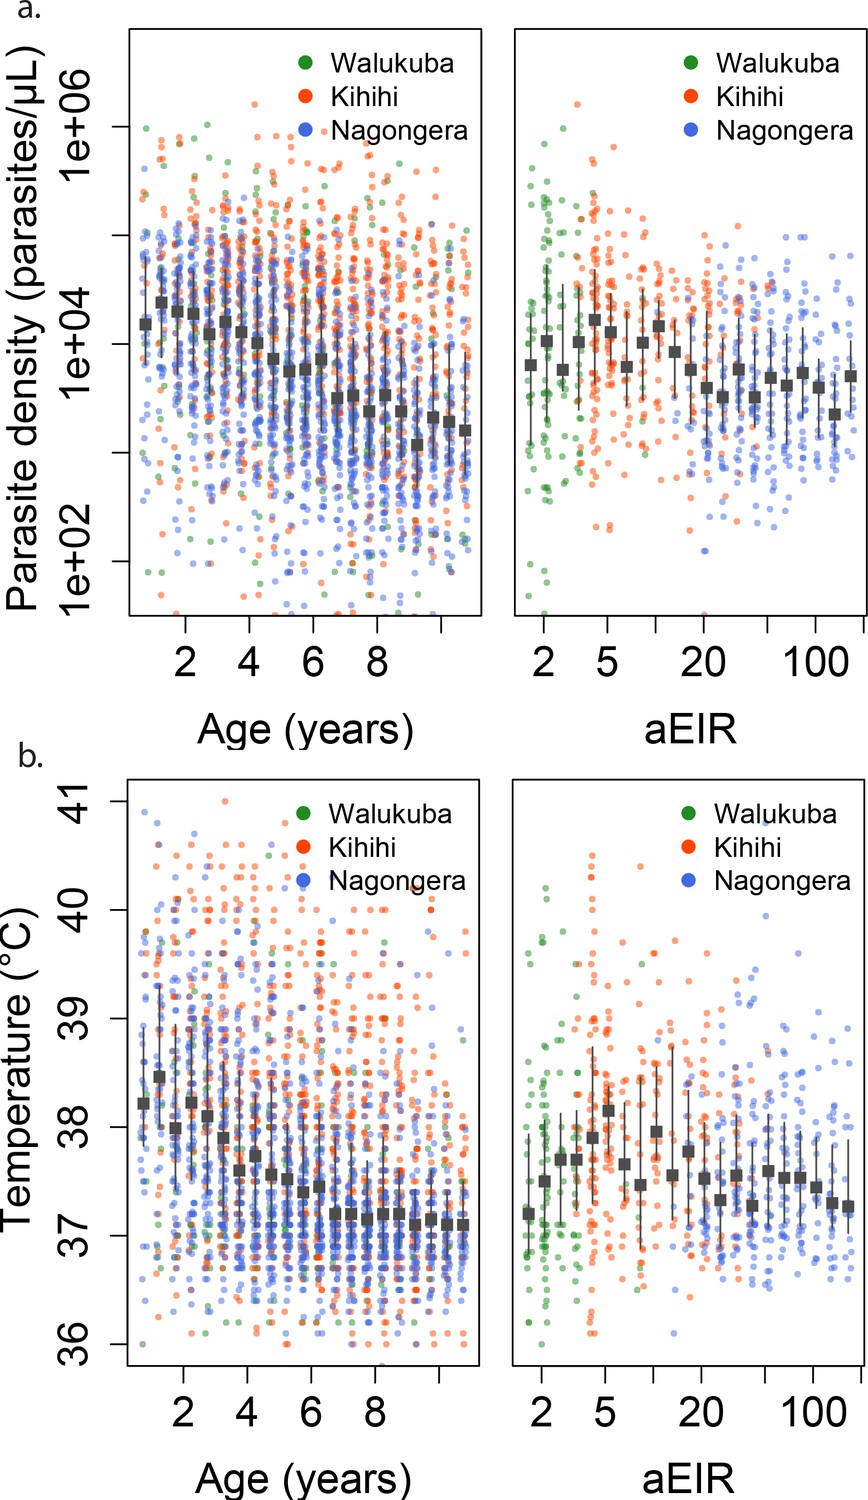
Changes in parasite densities and objective temprature as a function of age and exposure.

Trends in parasite densities. (a) recorded during symptomatic (passive surveillance) infections and routine (active surveillance) visits as a function of age (left) and aEIR (right); and trends in the objective temperature (b) recorded during visits in which participants were found to have a parasite density between 50,000 parasites/μL and 200,000 parasites/μL, as a function of age (left) and aEIR (right). Each point represents a measurement obtained during a study visit. The median and interquartile range are shown in black.

https://doi.org/10.7554/eLife.35832.006

We considered multiple candidate models to describe the association between parasite density, age and aEIR (Appendix 1). Models allowing smooth (non-linear) relationships with aEIR best fit the data. Models allowing for two-way interactions between age and aEIR also outperformed models that did not include interactions.

In moderate and high transmission settings (households with aEIR >5), increasing age and increasing exposure were independently and linearly associated with decreases in the parasite densities (Table 2). On average, parasite densities decreased by a factor of 0.76 (95%CI 0.75–0.77) for each additional year of age and by a factor of 0.73 (95%CI 0.70–0.76) for each two-fold increase in the aEIR. The relationship was less evident for the lower transmission households (aEIR <5). In these settings, there continued to be a decreasing (although smaller) association with age, but the expected parasite densities at any given age were equal or lower to those observed in the higher exposure (aEIR >10) settings.

Table 2
Results of linear models quantifying the association between age, aEIR and immunity outcomes.
https://doi.org/10.7554/eLife.35832.007
All dataaEIR ≥ 5 (n = 5047)aEIR < 5 (n = 593)
Anti-parasite immunityFold change in parasite density (95% CI)
Age (years)0.78 (0.77, 0.79)0.76 (0.75, 0.77)0.87 (0.83, 0.90)
Log2 aEIR0.82 (0.79, 0.84)0.73 (0.69, 0.77)1.92 (1.69, 2.15)
Anti-disease immunity*Change in objective temperature C (95% CI)
Age (years)−0.07 (–0.06, –0.08)−0.08 (–0.07, –0.1)−0.04 (–0.07, –0.01)
Log2 aEIR−0.02 (–0.04, 0.0)−0.07 (–0.05, –0.1)0.27 (0.11, 0.44)
Overall immunity against symptomatic malariaOdds ratio of symptomatic disease (95% CI)
Age (years)0.78 (0.75, 0.82)0.77 (0.74, 0.80)0.90 (0.83, 0.99)
Log2 aEIR0.91 (0.74, 1.13)0.62 (0.48, 0.80)3.83 (1.39, 10.6)
  1. *Model adjusted as well for Log parasite density.

Figures 4a and 5a present the predicted parasite densities, as a function of age and aEIR, according to the best fitting model. While an individual aged 1 year exposed to an aEIR of 10 is expected to develop a parasite density of 14,610 parasites/μL (95% CI 5924–36,031 parasites/μL) upon infection, the expected parasite density goes down to 3237 parasites/μL (95% CI 1381–7586 parasites/μL) by age 10 years. In contrast, the expected parasite density in an individual living in a setting with aEIR of 150 will be similar at age 1 year (13,071 parasites/μL (95% CI 5256–32,503 parasites/μL)), but significantly lower by age 10 years (999 parasites/μL (95% CI 398–2508 parasites/μL)).

Results of best fitting models quantifying immunity.

(a), anti-disease immunity (b) and overall immunity against symptomatic malaria (c). Each plot shows, for specific ages and aEIRs, the expected parasite density (/μL) (a), objective temperature given a density of 40,000 parasites/μL (b) and the probability of developing symptomatic malaria upon infection (c), estimated using the best fitting model. 95% confidence intervals of the estimates are also shown.

https://doi.org/10.7554/eLife.35832.008
Figure 5 with 13 supplements see all
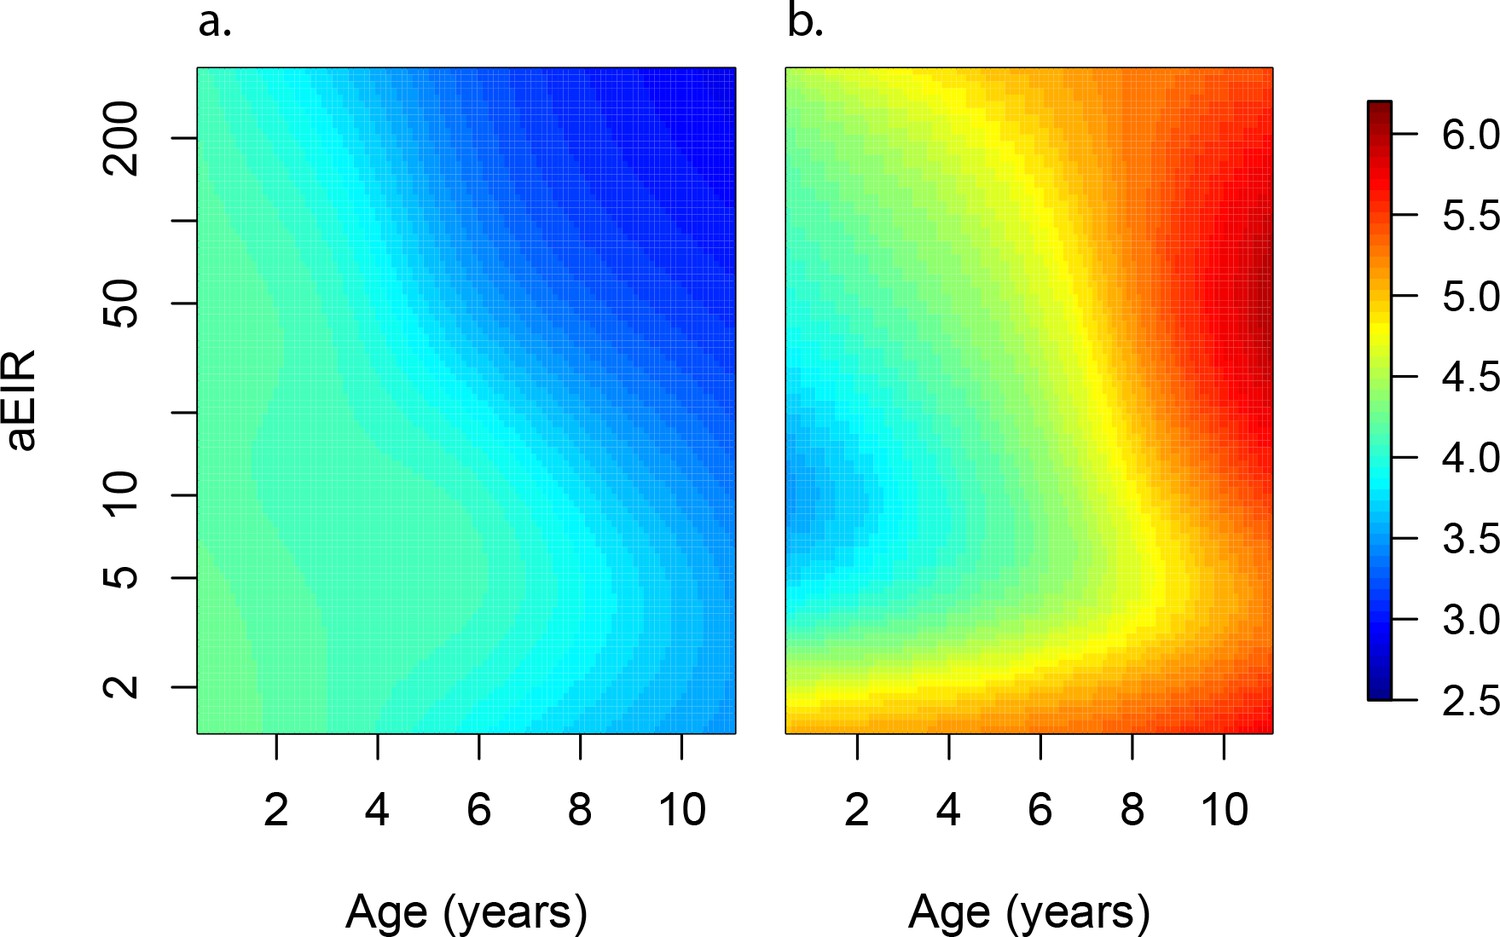
Anti-parasite and Anti-disease immunity as a function of age and exposure.

(a) and anti-disease immunity (b). These results are similar to those presented in Figure 4, but for the full range of ages and aEIRs included in the data. Panel (a) shows expected parasite densities (parasites/μL, log 10) upon infection for different ages and levels of exposure (aEIR). Panel (b) shows the ‘fever threshold’ or ‘pyrogenic density’, the minimum parasite densities (parasites/μL, log 10) associated with fever (temperature 38°C or greater), again as a function of age and exposure.

https://doi.org/10.7554/eLife.35832.009

To test whether the observed associations with age could be explained by the cumulative exposure over a life time, we also fit models where, instead of adjusting for the aEIR, we adjusted for the cumulative number of infectious bites (i.e. the product of age and aEIR) (Figure 5—figure supplement 2). Results from these models are consistent with a smaller, yet independent effect of age on the development of anti-parasite immunity; for any given level of cumulative exposure, each additional year of life was associated with decreases in parasite densities by a factor of 0.82 (95%CI 0.81–0.85).

Anti-disease immunity

We define anti-disease immunity as the ability to tolerate a given parasite density without developing objective fever. Thus, we were interested in modeling temperatures recorded at specific parasite densities, as a function of age and aEIR. Consistent with models characterizing anti-parasite immunity, models including smooth effects and interactions fitted the data significantly better than simpler models.

As expected, we found a strong association between parasite densities and objective temperature (Figure 6—figure supplement 1). Increases in parasite densities above 1000 parasites/μL were associated with higher expected temperatures across ages and transmission settings. In addition, we found a negative association between objective temperature at a given parasite density and age (Figures 3b, 4b and 6). In moderate and high transmission settings (aEIR >5), the objective temperature at a given parasite density decreased on average by 0.08°C (95% CI 0.07–0.10°C) for each additional year of life (Table 2). Thus, while the expected temperature for a child aged 1 year living in a setting with aEIR of 10 with a parasite density of 40,000 would be 38.8°C (95% CI 38.5–39.2°C), the expected temperature would decrease to 37.6°C (95% CI 37.3–38.0°C) if the same child experienced the infection at age 10 years (Figures 4b and 6). This association was similar even when adjusting for cumulative exposure and for the differences in incidence of non-malarial fever across age-groups (Figure 5—figure supplement 5).

Figure 6 with 2 supplements see all
Anti-disease immunity as a function of age and exposure.

Each panel shows how the expected objective temperature (°C) varies as a function of age and parasite density, for different transmission settings. (a) aEIR = 2; (b) aEIR = 10; (c) aEIR = 50; (d) aEIR = 200. Contours indicating the fever threshold (38°C) are also shown. Confidence bounds for these plots are presented in Figure 6—figure supplement 1.

https://doi.org/10.7554/eLife.35832.023

Similar to the anti-parasite immunity results described above, the observed association between exposure level and anti-disease immunity was less evident than the association with age (Figures 3b, 4b and 6). For moderate and high transmission settings (aEIR 5 to 300), there was a linear negative association between objective temperature at a given parasite density and aEIR. The objective temperature decreased by 0.07°C (95% CI 0.05–0.10°C) for each two-fold increase in aEIR. However, the relationship did not follow this trend for lower transmission settings (Table 2). Children living in the lowest transmission settings (aEIR 1 to 5) appeared to tolerate higher parasite densities than children living in moderate transmission settings (aEIR 5 to 10).

As an alternative way to characterize anti-disease immunity, we used our best fitting model to predict the fever threshold, defined as the minimum parasite density associated with objective fever (temperature >38°C), across levels of age and aEIR (Figure 5b). This quantity is often referred to as the ‘pyrogenic density’. Results from this analysis show that, for settings with moderate and high transmission (aEIR >5), the fever threshold increases both with age and increasing exposure. Thus, while a 1-year-old child living in a setting with aEIR of 10 presenting with a parasite density as low as 3747 parasites/μL (95% CI 777–11,129 parasites/μL) will be expected to be febrile, children older than 6 years of age exposed to very high transmission (aEIR 150) might be afebrile even with parasite densities higher than 60,000 parasites/μL.

Overall immunity against symptomatic malaria

Finally, to characterize the association between age and aEIR on the overall risk of developing symptomatic malaria upon infection (i.e. the combined effect of anti-parasite and anti-disease immunity), we fit a series of models where the outcome of each independent microscopically detectable infection (i.e. symptomatic malaria or asymptomatic parasitemia) was modeled as a function of age and aEIR. Models allowing smooth relationships, with or without two-way interactions, fit the data equally well.

Results from this analysis are consistent with results from the anti-parasite and anti-disease models (Figure 7). While young children living in low transmission settings (aEIR = 5) develop symptomatic malaria in most their infections, the probability that an infection results in symptomatic malaria decreases as a function of age and exposure. The expected probability of symptomatic disease for a child aged 1 year living in a setting with aEIR of 50 is 0.92 (95% CI 0.79–0.97), but it decreases to 0.51 (95% CI 0.29–0.73) by age 10 years.

Figure 7 with 1 supplement see all
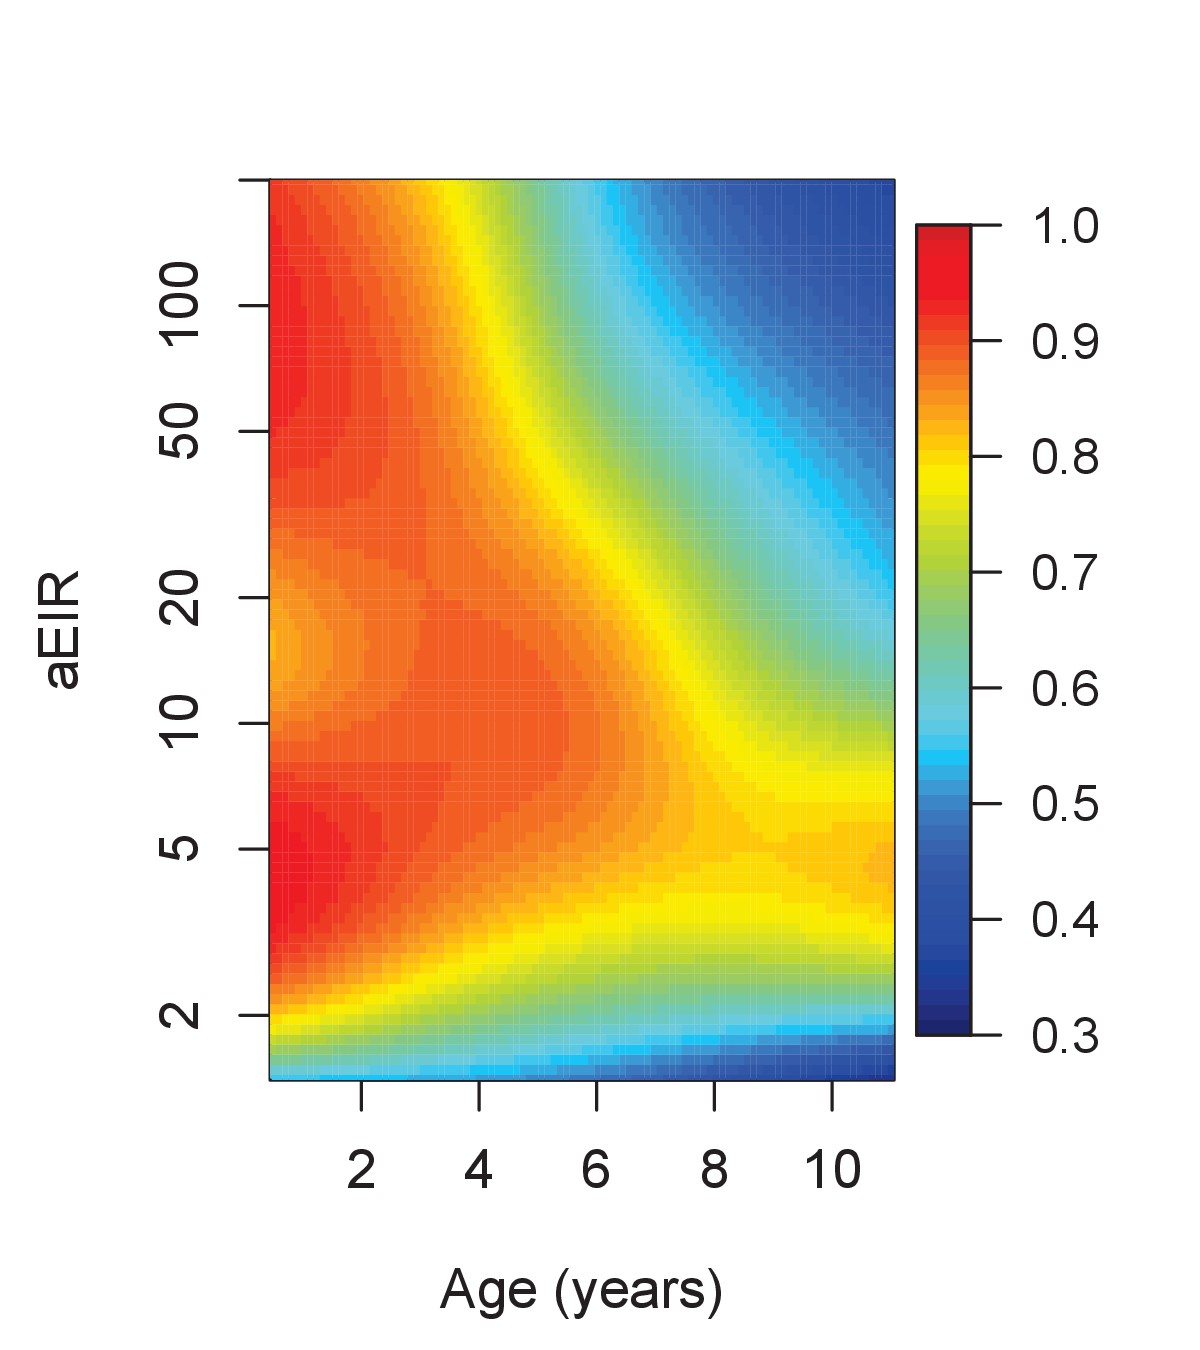
Results of the best model quantifying overall immunity against symptomatic malaria (upon microscopically detectable infection), as a function of age and exposure (aEIR).

Colors represent the expected probability of developing symptomatic malaria upon infection. Confidence bounds for these plots are presented in Figure 7—figure supplement 1.

https://doi.org/10.7554/eLife.35832.026

Impact of recent infection on immunity

To assess whether recent P. falciparum infection was associated with different levels of anti-parasite and anti-disease immunity, we used data on the recent malaria history of each individual to fit models adjusted for number of P.falciparum positive visits in the past 3 and 6 months. We found no association between the number of recent malaria infections and our outcomes of interest (Appendix 2, figure 5—figure supplement 3).

Development of anti-parasite and anti-disease immunity at the individual level

Models that included random effects at the individual and household levels outperformed models that assumed independence of observations, consistent with large heterogeneity between individuals in the development of anti-parasite, anti-disease and overall immunity against symptomatic malaria. To illustrate this heterogeneity, we used the best fitting model to predict the trajectories of a subset of individuals with respect to anti-parasite and anti-disease immunity, as a function of age and aEIR (Figure 5—figure supplement 12).

Sensitivity analyses

Our main analyses include data from all visits regardless of their type (routine vs passive case detection). Thus, the expected values modeled here may be biased by the frequency of active vs passive episodes detected. In particular, it is possible that we have under-sampled the instances of asymptomatic infection, and thus, our estimates of the expected parasite densities may be an over-estimate of those present in the population. Similarly, it is also possible that consecutive asymptomatic infections represent persistent, rather than new infections. To address these limitations, we performed sensitivity analyses where we (a) up-weighted the episodes of asymptomatic parasitemia, to account for potentially unobserved asymptomatic infections and (b) included only ‘incident’ asymptomatic infections, under the assumption that subsequent asymptomatic samples represented persistent (rather than new) infections. Results from these analyses were qualitatively identical to the main analysis reported here and are presented in the supplementary material (Figure 5—figure supplements 6 and 7).

To explore whether differences in the prevalence of certain host genetic polymorphisms between sites could be driving some of our findings, we also performed sensitivity analyses limiting the dataset to those subjects without the sickle hemoglobin mutation (β globin E6V), known to protect against malaria (Lopera-Mesa et al., 2015; Taylor et al., 2012). Even though the sample size of these analyses was smaller (observations from 155/773 individuals were excluded), results were unchanged qualitatively (Figure 5—figure supplement 8). Similarly, restricting the dataset to children without two other known polymorphisms (the α-thalassemia 3.7 kb deletion or glucose-6-phosphate dehydrogenase deficiency caused by the common African variant (G6PD A-)), had little effect on the results.

Discussion

Our findings illustrate how anti-parasite and anti-disease immunity develop gradually and in parallel, complementing each other in reducing the probability of experiencing symptomatic disease upon infection with P. falciparum. While anti-parasite immunity acts to restrict the parasite densities that develop upon each subsequent infection, anti-disease immunity increases the tolerance to high parasite densities. Thus, older children are less likely to develop symptomatic malaria upon infection both because they tolerate parasite densities better without developing fever, and because they are less likely to develop high parasite densities.

Our results indicate independent effects of age on the acquisition of both anti-parasite and anti-disease immunity. These independent age effects may reflect maturation of the immune system as well as other physiological changes that decrease the propensity to fever (Struik and Riley, 2004; Baird, 1998). Furthermore, our findings are consistent with independent effects of transmission intensity on the acquisition of these two types of immunity. While the results obtained for moderate and high transmission settings (aEIR >5) are consistent and expected, and suggest that immunity develops faster in settings where individuals get infected by P. falciparum more often, the results obtained for the lowest transmission settings are harder to reconcile. These results were largely driven by observations collected in the Walukuba site, and as such it is possible that site-specific characteristics may have driven them. Walukuba was previously a relatively high transmission rural area, but substantial decreases in transmission intensity have been observed since 2011, likely due to urbanization. While our sensitivity analyses suggested that differences in the prevalence of three well characterized host-genetic polymorphisms between sites do not explain these discrepant results, it is still possible that other unmeasured site-specific characteristics may have driven them. Lower complexity of infection coupled with lower parasite diversity in Walukuba, for example, could cause this difference, as developing an effective immune response against fewer parasite strains may be much easier than developing immunity against a more diverse pool (Hviid, 1998; Bull et al., 1998). Testing this hypothesis would require careful characterization of the complexity and diversity of infections in each of our cohort settings.

While site-specific characteristics may underlie the observed high levels of clinical immunity against malaria in the low transmission setting, it is also possible that this finding reflects biologically relevant differences in how immunity against malaria develops. For example, it has been hypothesized that immunity may develop optimally in individuals that are exposed at a low rate, and that more frequent infections may interfere with the development of robust immune responses (Wipasa et al., 2010; Langhorne et al., 2008). Answering this question will require further detailed studies across transmission settings, with careful characterization of both exposure and infection outcomes.

There are several limitations to this study. With a study design including routine visits every 3 months, we are likely to have missed several asymptomatic infections, particularly in the moderate and high transmission settings. Moreover, since infections were detected using microscopy, we were unable to detect sub-patent infections, and we lack knowledge about the genetic complexity of each infection. While it is possible that the expected values modeled here (expected parasite density and fever threshold) were biased by these sources of measurement error, sensitivity analyses suggest that the relationships observed were robust. Secondly, while we found an independent association between the average household aEIR and both anti-parasite and anti-disease immunity, it is not clear that this is the most relevant metric of exposure for the development of clinical immunity to malaria. Alternative metrics such as the number of discrete infections, the number of ‘strains’ seen or the total parasite-positive time might be more relevant, but require the collection of additional data, including more frequent sampling. Finally, while this study provides very detailed insight into how two types of clinical immunity to malaria develop in endemic settings as a function of age and repeated exposure, it says nothing about the duration of immunity.

Prior studies have tried to model the processes driving acquisition of clinical immunity against malaria. However, these models have been generally informed by aggregated epidemiological data (age-incidence and age-prevalence) which limits their capacity to isolate the contributions of age and repeated exposure (Filipe et al., 2007; Griffin et al., 2015, 2014). Our results quantify how anti-parasite and anti-disease immunity develop in children across the malaria transmission spectrum, and they support strong independent effect of age and a perhaps paradoxical effect of exposure. The methods proposed here to model anti-parasite and anti-disease immunity may also provide a framework to select individuals with immune and non-immune phenotypes for evaluations of immune correlates of protection.

Materials and methods

Ethics statement

Request a detailed protocol

The study protocol was reviewed and approved by the Makerere University School of Medicine Research and Ethics Committee (Identification numbers 2011–149 and 2011–167, the London School of Hygiene and Tropical Medicine Ethics Committee (Identification numbers 5943 and 5944), the Durham University School of Biological and Biomedical Sciences Ethics Committee (PRISM Entomology Uganda), the University of California, San Francisco, Committee on Human Research (Identification numbers 11–05539 and 11–05995) and the Uganda National Council for Science and Technology (Identification numbers HS-978 and HS-1019). All parents/guardians were asked to provide written informed consent at the time of enrollment.

Data

We used data from three parallel cohort studies conducted in Uganda in sub-counties chosen to represent varied malaria transmission (Kamya et al., 2015). Walukuba, in Jinja district, is a peri-urban area near Lake Victoria that has the lowest transmission among the three (annual entomological inoculation rate (aEIR) estimated to be 2.8 [Kamya et al., 2015]). Kihihi, in Kanungu district, is a rural area in southwestern Uganda characterized by moderate transmission (aEIR = 32). Nagongera, Tororo district, is a rural area in southeastern Uganda with the highest transmission (aEIR = 310) (Kamya et al., 2015; Kilama et al., 2014). Details on how the study households and participants were selected has been described elsewhere (Kamya et al., 2015). Briefly, all households were enumerated, and then approximately 100 households were selected at random from each site. Between August and September 2011, all children from these households aged between 6 months and 10 years who met eligibility criteria were invited to participate. As the cohorts were dynamic, additional children from participating households were invited to participate if they became eligible while the study was ongoing. Unless participants were withdrawn from the study either voluntarily or because they failed to comply with study visits, they were followed-up until they reached 11 years of age. Children from 31 randomly selected additional households were enrolled between August and October 2013 to replace households in which all study participants had been withdrawn. For this analysis, we used data collected from visits between August 2011 and November 2014.

The studies included passive and active follow-up of participants. Parents/guardians were encouraged to bring their children to designated study clinics for any illness. All medical care was provided free of charge, and participants were reimbursed for transportation costs. All children who reported fever in the previous 24 hr or were febrile at the time of the visit (tympanic temperature >38.0°C) were tested for malaria infection with a thick blood smear. Light microscopy was performed by an experienced laboratory technician who was not involved in direct patient care and verified by a second technician. Parasite density was calculated by counting the number of asexual parasites per 200 leukocytes (or per 500 leukocytes, if the count was <10 asexual parasites/200 leukocytes), assuming a leukocyte count of 8,000/μl. A blood smear was considered negative when no asexual parasites were found after examination of 100 high-power fields.

If the smear was positive, the patient was diagnosed with symptomatic malaria and received treatment with artemether-lumefantrine (AL), the recommended first-line treatment in Uganda. Episodes of complicated or recurrent malaria occurring within 14 days of therapy were treated with quinine. In addition, routine evaluations were performed every 3 months, including testing for asymptomatic parasitemia using thick blood smears.

Entomological surveys were also conducted every month at all study households. During these surveys, mosquitoes were collected using miniature CDC light traps (Model 512; John W. Hock Company). Established taxonomic keys were used to identify female Anopheles mosquitoes. Individual mosquitoes were tested for sporozoites using an ELISA technique (Kilama et al., 2014). All female Anopheles mosquitoes captured in Walukuba and Kihihi were tested; in Nagongera testing was limited to 50 randomly selected female Anopheles mosquitoes per household per night due to the large numbers collected. Therefore, for each household and/or site it was possible to calculate multiple entomological metrics, including the average human biting rate (average number of female Anopheles mosquitoes caught in a household per day), the average sporozoite rate (the average proportion of mosquitos that tested positive for Plasmodium falciparum) and the entomological inoculation rate (EIR, the product of the household human biting rate and the site sporozoite rate).

Statistical analyses

Request a detailed protocol

The purpose of these analyses was to model and quantify the development of immunity against symptomatic malaria, as a function of age and exposure, measured by the household EIR.

We modeled two specific types of immunity that have been previously described as components of immunity to malaria. We defined anti-parasite immunity as the ability to control parasite densities upon infection and anti-disease immunity as the ability to tolerate parasite infections without developing objective fever. Thus, for models of anti-parasite immunity, the outcome of interest was the parasite density recorded (using thick blood smear) at each parasite-positive study visit. For models of anti-disease immunity, the outcome of interest was the objective temperature recorded during parasite positive visits, conditional on the parasite density. In addition, we also modeled overall immunity against symptomatic malaria. For these analyses, the outcome of interest was the probability of presenting with fever given infection (parasite positivity).

In order to model the association between the outcomes and covariates of interest we used generalized additive models (gams). Gams provide a good framework, as they allow for smooth non-linear relationships. Details on the specific models explored are provided in the supplementary material (Appendix 1). In summary, the models followed the following form.

(1) Anti-parasite immunity

Log10(Parasite density)ijk=f(ageijk, Log2aEIRj)+ui+γj

(2) Anti-disease immunity

Temperatureijk=f(ageijk, Log2aEIRj, Log10Parasite densityijk)+ui+γj

(3) Overall immunity against symptomatic malaria

P(symptomatic malaria upon infection)ijk=f(ageijk, Log2aEIRj)+ui+γj

where i is an index for individuals, j for households and k for specific visits. Thus, ageijk represents the age of child i from household j during visit k, and aEIRj represents the average annual EIR recorded for household j. We included the EIR as an average (time-invariant) covariate, as we were interested in modeling the impact of the average exposure to malaria over time on the development of clinical immunity. Therefore, our model implicitly assumes that malaria transmission has been relatively stable at these three sites. To account for lack of independence, all models included random effects at the individual (ui) and household (γi) levels.

All our primary analyses included the full dataset. However, since results were consistent with a non-monotonic relationship between aEIR and the outcomes of interest, we also fit models stratified by aEIR (aEIR ≥5 vs. aEIR <5). All models were fitted in the R statistical framework using package mgcv (R Core Team, 2016). Best fitting models were selected based on Akaike’s Informaiton Criterion, but changes in the percent deviance explained are also presented.

Code and data availability

Request a detailed protocol

All the data used for these analyses as well as the R code used to reproduce the main study findings are available at https://github.com/isabelrodbar/immunity (Rodriguez-Barraquer, 2018; (copy archived at https://github.com/elifesciences-publications/immunity). Complete data from the 3 cohort studies are available in the ClinEpiDB website (https://clinepidb.org/ce/app).

Confidence bounds are presented in Figure 5—figure supplement 1.

Appendix 1

Detailed description of the models

Anti-parasite immunity

Models

To explore the association between age, exposure (aEIR) and parasite density upon infection, we fit the following models.

AP1: Log10(Parasite density)ijk= ageijk+ Log2aEIRj+ui+γj

AP2: Log10(Parasite density)ijk= f(ageijk)+ f(Log2aEIRj)+ui+γj

AP3: Log10(Parasite density)ijk= ageijk: aEIRj+ui+γj

AP4: Log10(Parasite density)ijk= f(ageijk, Log2aEIRj) +ui+γj

Where i is an index for individuals, j for households and k for specific visits. Thus, ageijk represents the age of child i from household j during visit k, and aEIRj represents the average annual EIR recorded for household j. ui and γj denote the individual and household random effects, respectively, assumed to be normally distributed with mean 0. Tensor interactions were used for interaction models (AP4).

Appendix 1—table 1
Anti-parasite immunity Model fit.
https://doi.org/10.7554/eLife.35832.030
ModelDF% Deviance ExplainedAIC
AP1418.733.214052
AP2414.233.114048
AP34083314046
AP44043314032

Anti-disease immunity

Models

To explore the association between age, exposure (aEIR), parasite density and objective temperature, we fit the following models

AD1: Temperatureijk=ageijk+ Log2aEIRj+ Log10Parasite densityijk+ui+γj

AD2: Temperatureijk=f(ageijk)+ f(Log2aEIRj)+f(Log10Parasite densityijk)+ui+γj

AD3:Temperatureijk=ageijk: aEIRj: Log10Parasite densityijk+ui+γj:

AD4: Temperatureijk= f(ageijk, Log2aEIRj, Log10Parasite densityijk)+ui+γj

Where i is an index for individuals, j for households and k for specific visits. Thus, ageijk represents the age of child i from household j during visit k, and aEIRj represents the average annual EIR recorded for household j. ui and γj denote the individual and household random effects, respectively, assumed to be normally distributed with mean 0. Tensor interactions were used for interaction models (AD4).

Fever threshold

In order to estimate the fever threshold, defined as the minimum parasite density associated with fever (temperature greater than 38°C) we first used the best fitting model (AD3) to predict the expected temperature across levels of parasite density, age and exposure (aEIR) (as shown in Figure 6). For each level of age and aEIR, we then extracted the minimum parasite density that predicted a temperature >38°C. This was possible since the association between parasite density and temperature is positive (Figure 6—figure supplement 1).

Appendix 1—table 2
Anti-disease immunity Model fit.
https://doi.org/10.7554/eLife.35832.031
ModelDF% Deviance ExplainedAIC
AD131537.714946
AD228539.014774
AD331438.314894
AD429639.414758

Overall immunity against symptomatic malaria

Models

To explore the association between age, exposure (aEIR), and the odds of symptomatic malaria upon infection, we fit the following models.

SM1: Log Odds(symptomatic malaria)ijk=ageijk+ Log2aEIRj+ui+γj

SM2: Log Odds(symptomatic malaria)ijk=f(ageijk)+f( aEIRj)+ui+γj

SM3: Log Odds(symptomatic malaria)ijk=ageijk: Log2aEIRj+ui+γj

SM4: Log Odds(symptomatic malaria)ijk=f(ageijk, Log2aEIRj)+ui+γj

Where i is an index for individuals, j for households and k for specific visits. Thus, ageijk represents the age of child i from household j during visit k, and aEIRj represents the average annual EIR recorded for household j. ui and γj denote the individual and household random effects, respectively, assumed to be normally distributed with mean 0. Tensor interactions were used for interaction models (SM4).

Appendix 1—table 3
Overall immunity against symptomatic malaria Model fit.
https://doi.org/10.7554/eLife.35832.032
ModelDF% Deviance ExplainedAIC
SM1399.8285382
SM2385.3285373
SM3385.527.85380
SM4362.627.35369

Appendix 2

Models adjusted for recent exposure

To assess whether recent exposure to malaria was associated with different levels of anti-parasite and anti-disease immunity we fit models adjusted for number of P.falciparum positive visits in different windows of time (3 and 6 months). We fit models where the association was assumed to be linear, as well as models that allowed for a smooth relationship (for 6 months only). Data from the visits that occurred in the first 3 and 6 months since enrollment were excluded from these analyses, respectively. See Figure 5—figure supplement 3.

Appendix 2—table 1
Anti-parasite immunity.
https://doi.org/10.7554/eLife.35832.034
Time windowFunctional formCoefficient (95% CI)p-value
3 monthsLinear−0.003 (−0.03–0.03)0.83
6 monthsLinear0.003 (−0.02–0.02)0.75
6 monthsSmooth-0.77
Appendix 2—table 2
Anti-disease immunity.
https://doi.org/10.7554/eLife.35832.035
Time windowFunctional formCoefficient (95% CI)p-value
3 monthsLinear−0.01 (−0.04–0.02)0.38
6 monthsLinear−0.01 (−0.03–0.01)0.15
6 monthsSmooth-0.15

Data availability

All the data used for these analyses as well as the R code used to reproduce the main study findings are available at https://github.com/isabelrodbar/immunity (copy archived at https://github.com/elifesciences-publications/immunity). Complete data from the 3 cohort studies are available at the CliEpiDB website (https://clinepidb.org/ce/app/record/dataset/DS_0ad509829e).

The following previously published data sets were used
    1. Grant Dorsey
    (2017) PRISM cohort study
    Publicly available at ClinEpiDB (https://clinepidb.org/ce/app).

References

  1. Software
    1. R Core Team
    (2016) R: A language and environment for statistical computing
    R Foundation for Statistical Computing, Vienna, Austria.
  2. Report
    1. World Health Organization
    (2016)
    World Malaria Report 2016
    Geneva Switzerland: WHO.

Decision letter

  1. Ben Cooper
    Reviewing Editor; Mahidol Oxford Tropical Medicine Research Unit, Thailand
  2. Prabhat Jha
    Senior Editor; Saint Michael's Hospital, Canada

In the interests of transparency, eLife includes the editorial decision letter and accompanying author responses. A lightly edited version of the letter sent to the authors after peer review is shown, indicating the most substantive concerns; minor comments are not usually included.

[Editors’ note: a previous version of this study was rejected after peer review, but the authors submitted for reconsideration. The first decision letter after peer review is shown below.]

Thank you for submitting your work entitled "Quantification of anti-parasite and anti-disease immunity to malaria as a function of age and exposure" for consideration by eLife. Your article has been reviewed by three peer reviewers, including Ben Cooper as the Reviewing Editor and Reviewer #1, and the evaluation has been overseen by a Senior Editor.

Our decision has been reached after consultation between the reviewers. Based on these discussions and the individual reviews below, we regret to inform you that your work will not be considered further for publication in eLife.

All reviewers thought the work presented some very detailed and interesting data. However, following consultation, the consensus was that by failing to account for individual exposure history in the data the work fell short of what was possible with these data, and also made implicit independence assumptions that seem hard to justify. If these limitations could be addressed in future work, the journal would be interested in considering a new manuscript looking at the same data.

Reviewer #1:

This manuscript presents an elegant application of generalised additive models to a rich longitudinal malaria data-set from 773 children across three study sites in Uganda. The authors use this statistical modelling approach to investigate how both anti-parasite immunity to P. falciparum and anti-disease immunity change with age and transmission intensity.

As the authors argue, this works represents a substantial advance over previous attempt to model processes driving malaria immunity which have been informed by aggregated data. The individual level data makes it possible to disentangle the effects of age and exposure history, and demonstrate an independent effect of age (i.e. beyond that which would be expected if exposure alone were driving acquisition of immunity).

Generally the manuscript is very well written, easy to read, clearly presented, and the findings accompanied with appropriate caveats. This work seems to make an important and worthwhile contribution to the literature. The sensitivity analysis in the supplementary material also considerably strengthens the work.

Reviewer #2:

This study analyses data from three longitudinal cohort studies from regions of Uganda with varying transmission intensity. The analysis is based on very detailed epidemiological data sets with data collected on P. falciparum parasite density, temperature, clinical episodes of malaria and EIR. In order to assess the statistical methods it is worthwhile to consider this analysis in the context of a previous analysis of Ugandan data by the same authors in an excellent paper published last year in The Journal of Infectious Diseases. The data utilised in this analysis is superior to that utilised in the previous paper in a number of ways: more participants; household measurements of EIR; individual level measurements of temperature and parasite density, etc. The absence of data on low density PCR-detectable infections however is a limitation. Although the statistical models utilised in this analysis are justifiable and robust, I feel that the methods have taken a step back compared to their previous methods.

In their previous analysis the authors captured how previous exposure to malaria affects the probability that an infection will lead to a clinical episode (e.g. individuals with a greater number of episodes in the past have greater levels of clinical immunity and thus a lower probability that a new infection progresses to an episode of clinical malaria). It appears to me that in this analysis that the rich data on an individuals' exposure history is not accounted for – and with a mean of 2 years' follow-up (over 3 years in some case) this is quite substantial data. Instead, the authors' models for temperature, parasite density and symptomatic malaria for visit k, depend only on measurements at visit k, and not on the individuals' malaria history at previous visits. I would like to see the authors utilise a method that accounts for malaria history at visits before k (e.g. such as the method used in their previous analysis).

Reviewer #3:

This article using 3 very interesting longitudinal data sets from Uganda to investigate how the acquisition of immunity is influenced by exposure and age. These are very pertinent questions. Unfortunately, the authors do not make good use of the excellent longitudinal data they have nor is the way they combine active and passive case detection samples in the definitions of anti-parasite and anti-disease very clear.

The authors treat all infections within a child as statistically independent. This is not strictly speaking correct.

Firstly, infections within the same child are controlled by the same immune system and thus reflective of the same immune status. Appropriate analyses of these data would thus need to take into account the non-independence of samples within the same individual.

Secondly, asymptomatic P. falciparum may last for up to 1 year or more. Therefore, it is likely that in particular in at low transmission household 2 or more consecutive infection may represent a single P. falciparum infection. In low transmission settings where few infections are acquired asymptomatic infections are likely to be longer lasting both the more limited number of treatments and the lack of superinfections that will result in higher parasitaemias and clinical symptoms in their early (exponential) growth phase. This factor could explain the overall higher proportion of asymptomatic infections and the lower parasitaemia at a given in age at low transmission.

The authors have defined anti-disease immunity as difference in the mean objective temperature at a given parasitaemia. This may again be potentially impacted by the quite different numbers of observed symptomatic vs. asymptomatic detection samples. From the Materials and methods section it is not clear how author dealt with children that reports having been febrile in the last 24hrs but did not have an objective fever. Were there many such children (and how to the relate to listed asymtomatic infections) and how were they treated in the analysis. Also did the proportion of such children differ with age and exposure in similar ways that the proportion of asymptomatic infections differs (i.e. highest a low transmission, lowest at moderate transmission).

[Editors’ note: what now follows is the decision letter after the authors submitted for further consideration.]

Thank you for submitting your article "Quantification of anti-parasite and anti-disease immunity to malaria as a function of age and exposure" for consideration by eLife. Your article has been reviewed by three peer reviewers, including Ben Cooper as the Reviewing Editor and Reviewer #1, and the evaluation has been overseen by Prabhat Jha as the Senior Editor. The following individual involved in review of your submission has agreed to reveal their identity: James Watson (Reviewer #2).

The reviewers have discussed the reviews with one another and the Reviewing Editor has drafted this decision to help you prepare a revised submission.

Summary:

The authors sought to describe how both age and transmission intensity affect the dynamics of the development of immunity against symptomatic Plasmodium falciparum infection. They used data from 773 children in three cohort studies in Uganda (2011-2014), in settings with a wide range of transmission intensity (measured by the annual entomological inoculation rate (aEIR) is estimated from monthly mosquito household catch surveys). They used age and number of infectious bites per year to characterise how immunity develops over time. Immunity was assessed in two ways: anti-parasite immunity (measured by parasite density) and anti-disease immunity (measured by the parasite density which causes fever). The data were analysed using generalised additive models, which allow for complex relationships between aEIR, age and immunity. The results quantified how both age and exposure had important influences on immunity and suggested a surprising (and hard-to-explain) non-linear relationship where children living in the lowest transmission settings appeared to develop immunity faster than those in higher transmission settings.

Essential revisions:

This is a uniquely rich data set, that has the potential to yield important insights.

However, all reviewers were highly skeptical about some of the findings (as outlined in the reviews) which challenge most current thinking about malaria and immunity. Some of these findings are so surprising that we think more effort to check their robustness is needed.

One of the biggest concerns was the grouping of active and passive case detection data without regard to the different data generating mechanisms. In particular there may be important biases operating (particularly in the passive data, which accounts for the majority of the data).

For these reasons we would like to see the following revisions:

1a) Repeat the analysis just with the active case detection data (this should provide the basis for the most reliable inference).

1b) Compare 1a with the same analysis on passive case detection data.

If 1a and 1b give essentially the same results this provides a useful confirmation – if the same results can been shown with data collected in two different ways that should lead to more confidence in the results. If results are different, then some thought about the reasons why are needed (though this in itself could be an interesting finding).

2) The current models use a mean aEIR, but EIR can vary substantially over time (and there is clear evidence that it does vary greatly in this data set]. This means that the model is implicitly assuming that a person's immunity at one time point depends on what happens (to the EIR) in the future. This doesn't make a lot of sense. It should not be difficult to account for this temporal variation in the EIR in the analysis (i.e. considering cumulative EIR), and we consider this an essential revision.

3) All non-linear models should be compared to their linear counterpart. In the current submission AP1 is the linear version of AP2, but there is no linear version of AP3 with the age/EIR interaction (similarly for the ADx models that consider temperature).

4) Additional checking of model adequacy is needed e.g. plots of scaled residuals and predictive checks (see, for example, https://people.maths.bris.ac.uk/~sw15190/mgcv/check-select.pdf).

5) The evidence for the surprising non-monotonic relationships for acquired immunity predicted by the model would be greatly strengthened if the authors could present a plot clearly showing this signal in the data (i.e. without a statistical model).

Reviewer #1:

I reviewed an earlier submission of this manuscript which was rejected largely because of the consensus (following consultation between reviewers) that the analysis was not making the best of use of the data. In particular, not accounting for individual-level malaria history from previous visits was felt to be a big limitation.

There have been a number of changes in the current submission which have undoubtedly improved the manuscript and addressed many substantive concerns. First, the provision of the code and data needed for the analysis is very welcome and helps clarify exactly what was done and makes it possible for others to verify the findings.

Second, the revision has clarified that dependencies were accounted for (with a random effects term), and explained why more explicitly accounting for individual histories was not done (because the data did not come from a birth cohort and only limited windows of time were observed for each individual). It has also clarified that individual exposure histories are being implicitly accounted for through adjustment for age, aEIR and through the random effects terms. In light of these clarifications, the modelling decisions seem more understandable.

In addition to these clarifications there is some new material including individual immunity trajectories (output from original model), additional models which did use data on recent exposure (models adjusted for number of P. falciparum positive visits in the previous 3 and 6 months periods), but found no evidence that this recent exposure was associated with either anti-parasite or anti-disease immunity (when already adjusting for age, aEIR and random effects).

There is also some additional sensitivity analysis e.g. adjusting for cumulative aEIR (rather than just aEIR) which suggests an effect of age independent of exposure.

Finally, the authors have added figures showing confidence bounds for age and EIR-specific anti-parasite and anti-disease immunity. This were omitted from the original submission and are also a welcome addition.

As the rebuttal letter makes clear, the authors do not have a clear explanation for the "provocative finding" that children exposed to the lowest transmission are developing immunity more effectively than those in more moderate transmission settings (although the parasite diversity hypothesis at least sounds plausible). Clearly, this finding goes against most preconceptions about how immunity in malaria works and I think the authors are therefore right to spend a lot of effort in sensitivity analyses to show that this is a robust finding and not an artefact. While the fact that same effect is seen for two different measures of immunity strengthens the case for this being a real effect, I am concerned that there are other possible reasons why this could still be an artefact which have not yet been ruled out. Two possibilities I can think of are:

i) Is there a possibility that differences in measuring aEIR at different sites could account for this? The sensitivity analysis excluding Walukuba helps here (Figure 5—figure supplement 5). What about looking at Kihihi/Kanungu alone? This seems to have a big enough range of aEIRs that the effect should be seen if present. [note: following consultation this was not considered to be an essential revision].

ii) Is there a possibility that there are edge effects in fitting that GAMs that introduce these effects? This could be checked, for example, by fitting the same models to simulated data under different assumptions. Is it possible get similar results (showing immunity developing faster at high and low aEIRs than at intermediate values) even when data are simulated under the assumption of a monotonic relationship between aEIR and the rate at which immunity develops? [note: following consultation this was not considered an essential revision].

When comparing the model fits (Supplementary file 1), the flexible GAM models (which allow for non-monotonic relationships between aEIR & immunity) are compared with a single mixed model expressing a monotonic relationship (with temperature and log parasite density varying linearly with age and with log(aEIR)). Why not also consider other functional monotonic relationships between these measures of immunity and age and aEIR? [note: following consultation this was not considered an essential revision]

Finally, the mgcv packages allows a lot of flexibility when fitting GAMS/GAMMs including allowing for autocorrelated errors. Without diving into the code (which I haven't done) it is not clear what choices were made and why form the supplementary material alone. Are key results robust to modelling decisions made, and what diagnostics checks have been done?

Reviewer #2:

This is a data analysis exercise using cohort studies taken across the spectrum of Pf transmission in Africa. They use age and number of infectious bites per year to characterise how immunity develops over time. This is a very nice dataset and overall the paper is well written, and the plots are informative and clear. Code and data were provided online in order to reproduce the results.

I have a few concerns in the following paragraphs.

“aEIR as a metric of individual exposure”:

The annual entomological inoculation rate (aEIR) is estimated from monthly mosquito household catch surveys. This estimated quantity is then plugged into the models (on the log scale) as the proxy for the total number of infectious bites per year. Given that in the lowest transmission setting, the median number of infectious bites is 2 per year, this implies that a median of 2 infectious mosquitoes were captured over the course of one year. What is the median denominator here, e.g. how many mosquitoes were captured? The uncertainty on these aEIR estimates must be much larger for the low transmission settings vs high transmission settings. This may explain why the R2 is also much lower when correlating log(aEIR) and hazard of infection (as calculated from a time-to-event model). This may also explain the trends observed in Figure 3 (top right panel), where the individuals with lowest aEIR have lower parasite densities that those with medium aEIR.

This potentially indicates that the aEIR is not a good estimate of the true number of infectious bites at very low transmission? If so, this means the conclusions drawn from the models cannot be taken at face value. [note: following consultation the consensus was that EIR is not thought to be problematic, though models in which future values of EIR influence the present are considered to be unjustifiable (since events in the future shouldn't influence the present)]

Model comparison:

The online code was broken in parts and I had to spend an hour debugging it. This is quite annoying!

My main question was to understand whether the more complex non-linear models (GAMs) were truly better than their linear counterparts. In particular whether the pattern shown in Figure 5B was not the result of over-fitting. If I understand Figure 5B correctly (probably the most important plot in the paper), a 2 year old with an aEIR of 2 infectious bites per year has on average the same anti-disease immunity as a 5 year old with an aEIR of ~200 infectious bites per year. This is very hard to believe and my prior on this being true would be very low. I believe this may be an artefact due to the problem highlighted above for the extremely low aEIRs.

I ran a series of 50 random 10-fold cross-validation experiments in order to characterize the out-of-sample mean squared error of each of the models 1-3 and a fourth model: the linear equivalent of model 3 (interaction between age and log(aEIR) with random effects at the individual and household level). The author's model 2 (GAM, no interaction term) performs best on average but the effect is very small. The fact that the non-linear model fits best the data is driving the surprising conclusions and I remain skeptical regarding the following line of the Abstract:

"Our findings suggest a strong effect of age on both types of immunity, that is not explained by cumulative exposure. They also show a non-linear effect of transmission intensity, where children living in the lowest transmission intensity setting appear to develop immunity faster than those experiencing higher transmission."

Even if the underlying relationship is truly non-linear, it would be useful to report the conclusions of a linear model which are likely to be generalisable. This would be similar to what the authors have done (subsection “Anti-parasite immunity”, fourth paragraph), but for instance reported as: for a twofold increase in yearly inoculation, the pyrogenic densities decrease by X amount.

Reviewer #3:

It's tough to come out against this one as the authors have used some great data sets and innovative statistical modelling approaches to tackle a very hard question, namely how is immunity to malaria acquired in moderate to high transmission settings. My concern is that the design of the data, and the design of the model don't fit well together leading to some hard to explain results.

Hard to explain results:

There are at least two results which I would put in the 'hard to explain' category.

Firstly, the authors have proposed biologically and epidemiologically well-informed hypotheses to explain the non-monotonic relationship with aEIR in Figure 7. However a simpler hypothesis is that this is an artefact of combining this particular model and this particular data set.

The second result is from Figure 6 where the fever threshold for 39C comes in and out of view as we increase from (a) aEIR = 2; (b) aEIR = 10; (c) aEIR = 50; to (d) aEIR = 200. This result would imply that a 2 year old with parasite density of 1e6 parasites/uL has fever > 39C when aEIR = 2; tolerates parasites better by having fever < 39C at aEIR = 10; then tolerates parasites worse by having fever > 39C when aEIR = 50; before finally switching back to better toleration of parasites with fever < 39C when aEIR = 200.

"They also show a non-linear effect of transmission intensity, where children living in the lowest transmission intensity setting appear to develop immunity faster than those experiencing higher transmission."

In an Abstract, one has little choice but to read a statement literally. This implies that children living in the lowest transmission setting appear to develop immunity faster than those experiencing higher transmission. This flies in the face of conventional malaria epidemiology. Perhaps the authors are trying to say something more subtle like there is a diminishing contribution to the acquisition of immunity with subsequent infections.

Model:

The authors have provided a change in notation to emphasise the utilisation of random effects, but otherwise left the model and results unchanged. The random effects at the individual and household level will account for a substantial degree of the variation between children. However, within an individual the only piece of longitudinal information included is age, incremented by the index k for visit. Otherwise, incidence of symptomatic episodes are independent (and there can be up to 30 of them). For example, the probability of symptomatic malaria is the same for a child on their 1st and 10th episodes.

It is notable that although age is updated at each visit, aEIR is not – instead being averaged over the duration of follow-up. Looking at Figure 5 of the original publication by Kamya et al., we see that there is a lot of time-dependent variation. For example, in Kihihi there is a huge spike in aEIR in 2013 towards the end of the study.

Some of the 'hard to explain' results could be arising from non-linearities and tensor interactions in the generalised additive models. Looking at models AP1-3, I note very little change in% deviance explained despite changes in the AIC. Looking at models SM1-3, I note that as model complexity increases, the% deviance explained actually decreases, despite the AIC appearing to favouring the more complex models.

Data:

I am concerned that the passively detected cases and routinely (every 3 months) detected cases are fundamentally incompatible.

If I interpret things correctly, a passively detected case will by definition contribute 1 count of a symptomatic episode and 1 light-microscopy measurement of parasite density. These data provide no discriminatory power on whether an infection (upon becoming microscopically detectable) becomes symptomatic, and no information on temperatures < 38°C.

By not having the precondition of treatment-seeking behaviour and fever >38°C, routinely detected cases arguably provide richer information. Although the majority of these measurements are parasite negative (by microscopy) and presumably excluded.

In Table 1 there are reported to be 2447 + 1555 + 207 = 4209 symptomatic episodes versus 955 + 331 + 145 = 1431 asymptomatic parasitaemia episodes. This suggests that the passively detected cases are provided far more data points.

[Editors' note: further revisions were requested prior to acceptance, as described below.]

Thank you for resubmitting your work entitled "Quantification of anti-parasite and anti-disease immunity to malaria as a function of age and exposure" for further consideration at eLife. Your revised article has been favorably evaluated by Prabhat Jha (Senior Editor), and three reviewers, one of whom is a member of our Board of Reviewing Editors.

The reviewers noted that the authors have worked hard to address the raised concerns, generating new sensitivity analyses that lend supporting evidence to their conclusions and providing new presentations of the data to better visualise the non-monotonic relationships.

The authors have now adequately addressed all but one of the reviewers' main concerns.

The one last point, which reviewer 3 noted the authors did not address in their previous response, was related to the unexpected result of% Deviance Explained as the complexity increases for the nested models for anti-parasite immunity and overall immunity against symptomatic malaria. From the previous review:

"Looking at models AP1-3, I note very little change in% deviance explained despite changes in the AIC. Looking at models SM1-3, I note that as model complexity increases, the% deviance explained actually decreases, despite the AIC appearing to favouring the more complex models."

This is an important point that requires a response.

Reviewer 2 also made the comment that It would be useful if the authors provided an extra variable in their data on github: passive versus active detection.

https://doi.org/10.7554/eLife.35832.044

Author response

[Editors’ note: the author responses to the first round of peer review follow.]

We would like to submit a new version of our manuscript “Quantification of anti- parasite and anti-disease immunity to malaria as a function of age and exposure” for publication in eLife.

This manuscript was previously submitted to eLife and rejected due to specific concerns from the reviewers and editors. In particular, reviewers thought that our analysis failed to account properly for individual exposure history, and that it made certain unjustifiable assumptions. We have now revised our analysis to address these and other concerns expressed in the reviews and to clarify our assumptions and rationale for the analyses presented.

In summary, the major changes made were:

We have performed additional analyses where we use the rich data on recent exposure to P. falciparum to assess whether recent exposure is associated with different levels of anti-parasite and anti-disease immunity;

To show that our analysis captures individual heterogeneity in immunity, we have added a figure showing the predicted trajectories of anti-parasite and anti- disease immunity for a subset of individuals, as a function of age;

We have modified the Materials and methods section to make clear that our analyses do explicitly consider the longitudinal nature of the data. All our models include random effects at the individual and household levels to account for the lack of independence at both levels;

We have added extensive sensitivity analyses to show that our main findings are robust to the assumptions made;

We have made all the data used for these analyses, as well as the R code used to reproduce the main study findings available in our Github repository.

We want to underscore that we believe that the metric of individual exposure used in this analysis (annual entomological inoculation rate, aEIR) is a major, unique strength of this study. While no metric of natural exposure is perfect, our frequent, household level mosquito captures could be considered the most proximal feasible metric to the ideal when modeling the effect of exposure (transmission intensity) on malaria immunity. It directly quantifies the extent of environmental exposure to malaria, it is completely independent from the outcome of interest (immunity), and is strongly correlated with the individual hazard of infection.

As stated in our initial submission, we think that our paper should be considered for publication in eLife because it represents a major advance in our understanding of how immunity to malaria develops across a broad transmission spectrum. Improved understanding of the factors driving anti-malarial immunity is fundamental to investigate underlying biological mechanisms and to anticipate the impact of malaria control interventions. Careful analyses of longitudinal datasets, like this one, are required to fill existing gaps. Given its broad readership, we feel that eLife is the ideal forum for publication of these findings.

Reviewer #2:

This study analyses data from three longitudinal cohort studies from regions of Uganda with varying transmission intensity. The analysis is based on very detailed epidemiological data sets with data collected on P. falciparum parasite density, temperature, clinical episodes of malaria and EIR. In order to assess the statistical methods it is worthwhile to consider this analysis in the context of a previous analysis of Ugandan data by the same authors in an excellent paper published last year in The Journal of Infectious Diseases. The data utilised in this analysis is superior to that utilised in the previous paper in a number of ways: more participants; household measurements of EIR; individual level measurements of temperature and parasite density, etc. The absence of data on low density PCR-detectable infections however is a limitation. Although the statistical models utilised in this analysis are justifiable and robust, I feel that the methods have taken a step back compared to their previous methods.

In their previous analysis the authors captured how previous exposure to malaria affects the probability that an infection will lead to a clinical episode (e.g. individuals with a greater number of episodes in the past have greater levels of clinical immunity and thus a lower probability that a new infection progresses to an episode of clinical malaria). It appears to me that in this analysis that the rich data on an individuals' exposure history is not accounted for – and with a mean of 2 years' follow-up (over 3 years in some case) this is quite substantial data. Instead, the authors' models for temperature, parasite density and symptomatic malaria for visit k, depend only on measurements at visit k, and not on the individuals' malaria history at previous visits. I would like to see the authors utilise a method that accounts for malaria history at visits before k (e.g. such as the method used in their previous analysis).

We thank the reviewer for their thoughtful comments. There are significant differences between the previous (JID) and current datasets that guided the choice made around each analysis.

First, the dataset used in the previous analysis involved data from a birth cohort that followed participants between 6 months and 5 years of age. This cohort was characterised by extremely frequent follow-up, with blood smears performed at least every month on every trial participant (and every week during the first month after each malaria treatment). Thus, in this dataset we were confident that we had observed nearly all symptomatic malaria infections experienced by these children since birth (as well as a fraction of asymptomatic infections), which allowed us to use the observed prior malaria history as a metric of prior malaria exposure. In contrast, the PRISM cohorts used in this analysis are not birth cohorts (children aged 6 months to 10 years were enrolled) and regular visits occurred every 3 months. For each individual we only observe a limited window of time, (that varies depending on the age at enrollment) and we therefore lack the full malaria history for most individuals.

Second, a limitation of the approach used in the previous analysis is that as immunity develops, incidence of symptomatic malaria becomes a poor metric of past exposure, as a larger proportion of infections remain asymptomatic. Thus, the outcome of interest (immunity) directly affects the metric of exposure. This is particularly important in the PRISM study, as children were followed up to age 11 and had developed substantial immunity by then. An important strength of the PRISM study, used in the current analysis, is that it includes monthly mosquito collections, thus providing a metric of individual exposure (annual entomological inoculation rate) that is fully independent from the outcome of interest (immunity). The average entomological inoculation rate is the metric of exposure that we used for the analysis presented here.

Third, while the dataset from the previous analysis only included data on 100 children living in a single district, the PRISM cohort followed over 900 kids across settings with different transmission. The richness of the PRISM dataset allowed us to go beyond simply modeling the probability of symptomatic disease upon infection (as done in the JID paper) and model anti-parasite and anti- disease immunity independently. Furthermore, we were able to model non-linear relationships between the predictors and outcomes of interest. Thus, the present analysis is a significant advance over our previous analysis.

While it is true that in the current analysis we do not adjust directly for the cumulative number of episodes experienced by each individual (because as stated above, we don’t have such information), it does account for individual exposure histories in two ways:

The models are adjusted for age, aEIR, and their interaction (the product of age and EIR can be thought of as a metric of cumulative exposure), and therefore explicitly allow for greater immunity in children that have been exposed more;

The models contain random effects at the individual level, thus accounting for correlation between multiple observations of an individual.

We want to underscore that we believe that the annual entomological inoculation rate (aEIR), used as the metric of individual exposure in this analysis is actually a major, unique strength of this study. While no metric of natural exposure is perfect, our frequent, household level mosquito captures could be considered the most proximal feasible metric to the ideal when modeling the effect of exposure (transmission intensity) on malaria immunity. It directly quantifies the extent of environmental exposure to malaria, it is completely independent from the outcome of interest (immunity), and has been shown to be correlated with the individual hazard of infection (Figure 2).

Changes made:

To show that the model does capture individual trajectories in immunity (in a similar way as the JID paper did), we have added a paragraph to the Results section and a supplementary figure showing the predicted trajectories of anti-parasite and anti-disease immunity for a subset of individuals (Figure 5—figure supplement 12).

Furthermore, we have also performed an additional analysis where we use the rich data on recent exposure to malaria to assess whether recent exposure to malaria was associated with different levels of anti-parasite and anti-disease immunity, after adjusting for age and aEIR. These results are now presented in the Supplementary file 2 and Figure 5—figure supplement 3). We found no association between the number of recent P. falciparum infections and our outcomes of interest.

Finally, we have included an additional figure to the supplement showing the output of models adjusted for age and cumulative aEIR (instead of just aEIR) (Figure 5—figure supplement 2). As stated in the text, these results are consistent with a strong effect of age that is independent of exposure.

Reviewer #3:

This article using 3 very interesting longitudinal data sets from Uganda to investigate how the acquisition of immunity is influenced by exposure and age. These are very pertinent questions. Unfortunately, the authors do not make good use of the excellent longitudinal data they have nor is the way they combine active and passive case detection samples in the definitions of anti-parasite and anti-disease very clear.

We regret that the reviewer feels this way about our analysis but feel that they have not fully understood our methods. We have made efforts (detailed further below) to add clarity and reduce the probability that readers will have similar concerns. The analyses all explicitly consider that the datasets are longitudinal and include random effects at the individual and household levels. Furthermore, we were explicitly concerned about how to properly combine active and passive case detection samples and performed sensitivity around this (adjusting for the probability of observation). Below, we provide answers to their specific concerns.

The authors treat all infections within a child as statistically independent. This is not strictly speaking correct.

Firstly, infections within the same child are controlled by the same immune system and thus reflective of the same immune status. Appropriate analyses of these data would thus need to take into account the non-independence of samples within the same individual.

We fully agree with the reviewer that samples of the same individual can’t be treated as independent and apologize if this is not clear in the paper. All of our models include a random effect for each individual to account for the lack of independence. Furthermore they also include a random effect for each household to account for potential lack of independence at this level.

Changes made:

We have changed the text both in the Materials and methods section and in the supplementary material to make this more clear. The equations now include both individual and household random effects. Furthermore, the text now reads “To account for lack of independence, all models included random effects at the individual (ui) and household (γi) levels”.

Secondly, asymptomatic P. falciparum may last for up to 1 year or more. Therefore, it is likely that in particular in at low transmission household 2 or more consecutive infection may represent a single P. falciparum infection.

We agree with the reviewer that we can’t distinguish whether consecutive asymptomatic infection represent persistent infections, new infections or a combination. That is why we performed sensitivity analyses, where we accounted for the probability of observation (see Figure 5—figure supplement 6).

To further address this point, we have now performed an additional sensitivity analysis, were we only include “incident” asymptomatic infections, under the assumption that all subsequent asymptomatic samples represent a persistent (rather than a new infection) (Figure 5—figure supplement 7).

Changes made:

We have changed the text in the sensitivity analysis section as follows:

“Our main analyses include data from all visits regardless of their type (routine vs. passive case detection). […] Results from these analyses were qualitatively identical to the main analysis reported here and are presented in the supplementary material (Figure 5—figure supplements 6 and 7).”

We have included the results of the additional sensitivity analysis in the main text.

In low transmission settings where few infections are acquired asymptomatic infections are likely to be longer lasting both the more limited number of treatments and the lack of superinfections that will result in higher parasitaemias and clinical symptoms in their early (exponential) growth phase. This factor could explain the overall higher proportion of asymptomatic infections and the lower parasitaemia at a given in age at low transmission.

We agree with the reviewer that a lower rate of superinfections could explain why we observe higher “immunity” in lower transmission setting, particularly if coupled with lower parasite diversity. This is one of the hypothesis that we consider in our Discussion. To formally assess how the duration and complexity of infection affects clinical immunity, in our current studies we are genotyping all infections to follow them at the level of the individual strain.

Changes made:

For clarity, we have modified the paragraph discussing potential hypothesis surrounding this finding as follows:

“Lower complexity of infection coupled with lower parasite diversity in Walukuba, for example, could cause this difference, as developing an effective immune response against fewer parasite strains may be much easier than developing immunity against a more diverse pool (19,20). Testing this hypothesis would require careful characterization of the complexity and diversity of infections in each of our cohort settings.”

The authors have defined anti-disease immunity as difference in the mean objective temperature at a given parasitaemia. This may again be potentially impacted by the quite different numbers of observed symptomatic vs. asymptomatic detection samples.

The reviewer is right in stating that the different numbers of observed symptomatic/asymptomatic infections may have an impact on our results. To explore this potential source of bias, we performed sensitivity analyses where we weighted each asymptomatic infection based on the expected number of infections for a given period of time. These weights were calculated using a time-to-event model that estimated hazards of infection for each individual. Details of the method used and results are provided in the text.

From the Materials and methods section it is not clear how author dealt with children that reports having been febrile in the last 24hrs but did not have an objective fever. Were there many such children (and how to the relate to listed asymtomatic infections) and how were they treated in the analysis.

All of the children captured through the passive surveillance system who reported fever in the last 24h hours were tested for malaria, but only a fraction had objective fever when the temperature was measured.

The anti-disease model used objective temperature as the outcome, regardless of whether the child reported fever. While it is known that both parasite densities and temperature vary substantially over a 24h period, there is a very strong association between parasite density and temperature (as shown in Figure 6—figure supplement 1) and therefore we consider this to be a novel and appropriate outcome to assess anti-disease immunity.

We do acknowledge that by not taking into account the history of fever, whilst allowing a more specific and objective definition, we are losing some information on subjective symptoms. That’s why we also fit the “overall immunity model”, that does take into account all symptomatic malaria episodes, independent of the objective temperature recorded at the time of the visit (Figure 7).

Also did the proportion of such children differ with age and exposure in similar ways that the proportion of asymptomatic infections differs (i.e. highest a low transmission, lowest at moderate transmission).

We apologize but we do not fully understand the reviewer’s question. The prevalence of asymptomatic infections was highest in high transmission (nagongera) and lowest in moderate transmission as shown in Table 1 and Figure 1. Consistently, the proportion of smear positive children that had objective fever (at the time of the visit) was lowest in high transmission settings and highest in moderate transmission settings.

The prevalence of asymptomatic infection and the proportion of children with objective fever were higher and lower, respectively in children living in low transmission than in those in moderate transmission. These findings are consistent with higher levels of “anti-parasite” and “anti-disease” immunity as suggested by Figures 4-6 in the paper.

[Editors' note: the author responses to the re-review follow.]

Essential revisions:

This is a uniquely rich data set, that has the potential to yield important insights.

However, all reviewers were highly skeptical about some of the findings (as outlined in the reviews) which challenge most current thinking about malaria and immunity. Some of these findings are so surprising that we think more effort to check their robustness is needed.

We thank the reviewers and editors for their thorough and thoughtful review of our manuscript. When we planned this analysis, our main objective was to quantify the effects of age and exposure on the different types of immunity and we were also expecting to find a monotonic relationship between our exposures and outcomes of interest. We were equally (or more) surprised as the reviewers by the finding of the non-linearity uncovered by the analyses.

Even though we don’t have any conclusive evidence to determine what is driving this observed non-linearity, we are confident that it is not an artifact of our analysis. Children living in the lowest transmission setting (aEIR <5), and particularly children living in Walukuba, present with lower parasite densities and tolerate higher parasite densities than children living in higher transmission settings. This is evident both in the raw data (see response to Essential revision # 5) and in the results from the model.

While we are confident that this non-linearity exists in our data, as stated in the discussion we can’t rule out whether this finding reflects unmeasured differences between sites, as most of the observations of aEIR <5 come from a single site. Thus, it is possible, for example, that a lower parasite diversity in Walukuba could create this non-linearity. It is also possible that the children in the lowest transmission intensity are consistently experiencing less complex infections, that are ultimately easier to control than the more complex infections experienced in higher transmission settings. Additional potential explanations are presented in the Discussion.

We want to underscore that while this non-linearity is certainly counterintuitive and intriguing, the main purpose of our paper was to quantify the independent association between age, exposure and the different types of immunity. These rich datasets, from three cohorts conducted in parallel, provide a unique opportunity to address this question. In an effort to emphasize these results (and as suggested by reviewer #2), we have added a table (Table 2) summarizing the results of linear models. We report results from models fitted to the full dataset as well as models fit to observations from settings in which aEIR ≥5, where the relationship does seem to be linear, and for aEIR <5.

One of the biggest concerns was the grouping of active and passive case detection data without regard to the different data generating mechanisms. In particular there may be important biases operating (particularly in the passive data, which accounts for the majority of the data).

For these reasons we would like to see the following revisions:

1a) Repeat the analysis just with the active case detection data (this should provide the basis for the most reliable inference).

We disagree that the active case detection data provides the basis for the most reliable inference. Most malaria infections are symptomatic in this young population, and symptomatic infections are largely (>90%) captured by the passive surveillance system. The active surveillance system only captures symptomatic infections when the malaria episode happens to coincide with the already planned visit. Therefore, by excluding data from the passive surveillance system we would be excluding the vast majority of infections, and the most relevant outcomes for a study that aims to characterize immunity against symptomatic disease. Excluding the data from passive case detection would imply excluding >75% of observed infections in children <5 years and would bias our results towards lower density infections (i.e.; greater anti-parasite immunity).

It is true that an “ideal” study design would capture all infections soon after they occur and ascertain their outcome (symptomatic or not) by following them through time. However, this would probably require daily/weekly “active” sampling, particularly in the high transmission settings, which is not feasible. Our study design, by involving both passive and active case detection, aims to recreate this as closely as possible. Passive case detection is likely to capture the vast majority of infections that are symptomatic (>95% by self-report), while the active case detection captures whether an asymptomatic infection is present at the end of the period (this is more relevant as children develop immunity).

We agree that, given the differences in the two systems, we are more likely to observe a symptomatic than an asymptomatic infection and this could generate some bias in our results. That’s why we have performed sensitivity analyses (Figure 5—figure supplement 6) where we weight the observations from the active vs. passive systems to compensate for differences in the observation probabilities. We have also performed sensitivity analysis that is restricted to “incident” infections (Figure 5—figure supplement 7), to assess bias potentially introduced by persistent (rather than new) asymptomatic infections. None of these sensitivity analyses changed our inference substantially.

The reviewers suggest repeating the analyses with just the active and passive data. However, the fact that the two systems capture different types of infections (symptomatic vs. asymptomatics) also means that this is not possible for several of the analyses presented here. For example, we can’t fit the model on “overall immunity against symptomatic malaria” with just the passive data because by definition all of these infections are symptomatic. Similarly, we can’t estimate the fever threshold (anti-disease immunity) using just active data because there are essentially no objective fevers (temperature >38oC) captured by this system.

Where possible, we have fit the models with data from the active/passive system and results are shown below.

Author response image 1
Anti-parasite immunity.

Results of models quantifying anti-parasite immunity. Left panel shows result when models are fit to data from routine visits only (Active) while right panel shows result when models are fit to non-routine (Passive) visits.

https://doi.org/10.7554/eLife.35832.037
Author response image 2
Anti-disease immunity.

Results of models quantifying disease immunity when fit to data from non-routine (Passive) visits only. It is not possible to fit this model using only data from routine visits as the majority (~95%) of participants are asymptomatic during these visits and therefore it is not possible to estimate a fever threshold.

https://doi.org/10.7554/eLife.35832.038

As stated above, it is not possible to fit the overall immunity against malaria models using just the active or passive data, because by definition these visits capture symptomatic and asymptomatic infections respectively.

1b) Compare 1a with the same analysis on passive case detection data.

If 1a and 1b give essentially the same results this provides a useful confirmation – if the same results can been shown with data collected in two different ways that should lead to more confidence in the results. If results are different, then some thought about the reasons why are needed (though this in itself could be an interesting finding).

It is only possible to repeat the analysis with just the active and just the passive data for the “anti-parasite” immunity models (Author response image 1). As expected, the “passive” results are consistent with the results of models including all data. In contrast, the “active” results show the strong association with age but not the association with aEIR. It is unclear whether these differences are a consequence of the reduced power of this restricted dataset or of the bias introduced by censoring most of the higher density infections that are detected by the passive detection system as discussed above.

We want to underscore that the active and passive surveillance systems do not represent two distinct data collection mechanisms. Passive and active case detection are complementary systems to ensure that we capture as many of the infections (both symptomatic and asymptomatic) as possible.

2) The current models use a mean aEIR, but EIR can vary substantially over time (and there is clear evidence that it does vary greatly in this data set]. This means that the model is implicitly assuming that a person's immunity at one time point depends on what happens (to the EIR) in the future. This doesn't make a lot of sense. It should not be difficult to account for this temporal variation in the EIR in the analysis (i.e. considering cumulative EIR), and we consider this an essential revision.

For our analysis, we wanted to use a metric of exposure that could capture the “average” exposure to P. falciparum that participants have experienced over their life-time (and not just during the study period). Since we have no information about exposure prior to study enrollment, we chose to use the mean aEIR over the study period as a proxy for mean life-time yearly exposure. Thus, our analysis implicitly assumes that aEIR has been stable in the three study settings, beyond seasonal fluctuations. While this assumption seems to be reasonable for Nagongera and Kihihi, it is more questionable for Walukuba, where transmission declined considerably after 2011 (this is stated in the Discussion). Nevertheless, under this stability assumption, including “future” observations is not problematic and in fact improves our exposure metric, by accounting for the seasonal variation of aEIR over three calendar years.

We fully agree that if we knew what the true cumulative exposure of each of the participants was at the time of enrollment, it would make sense to use the observed cumulative exposure in the analyses (rather than the average over the entire period) as suggested by the reviewers. However, in the absence of this data, using just the observed cumulative aEIR would imply making arguably stronger assumptions. For example, if we model the data from the beginning of the study (August-December 2011) only considering the aEIRs measured during this period, we would implicitly be assuming that these (more noisy) aEIRs represent the exposure experienced by participants prior to August 2011.

We want to emphasize that the main objective of our analysis was to characterize the independent effects of exposure and age on the development of anti-parasite and anti-disease immunity. In the absence of information about the exposure experienced by participants prior to study enrollment, we believe that using the average aEIR is the closest approximation to our metric of interest.

Changes made:

We have added a sentence to the Materials and methods section to explicitly state that our model (and our chosen metric of exposure) assumes that transmission has been stable at the three study sites. The text now reads:

“We included the EIR as an average (time-invariant) covariate, as we were interested in modeling the impact of the average exposure to malaria over time on the development of clinical immunity. Therefore, our model implicitly assumes that malaria transmission has been relatively stable at these three sites.”

As suggested by the reviewers, we have included an additional sensitivity analysis where, instead of using the average aEIR for the whole study period, we use the average up to the observation time-point (to avoid including future observations) (Figure 5—figure supplement 11).

3) All non-linear models should be compared to their linear counterpart. In the current submission AP1 is the linear version of AP2, but there is no linear version of AP3 with the age/EIR interaction (similarly for the ADx models that consider temperature).

We thank the reviewers for this suggestion. We have included a model with the linear interaction between age/EIR (now models AP3, AD3 and SM3).

4) Additional checking of model adequacy is needed e.g. plots of scaled residuals and predictive checks (see, for example, https://people.maths.bris.ac.uk/~sw15190/mgcv/check-select.pdf).

We thank the reviewers for this suggestion. We have included some supplementary figures checking model adequacy (Figures 5—figure supplements 2 and 3).

5) The evidence for the surprising non-monotonic relationships for acquired immunity predicted by the model would be greatly strengthened if the authors could present a plot clearly showing this signal in the data (i.e. without a statistical model).

We thank the reviewers for their observation. The non-monotonic relationship for acquired immunity captured by the model is certainly evident in the raw data, and this is one of the reasons why we are confident that this result is not an artifact of the analysis. Evidence for this signal is currently presented in one of the tables and two of the figures in the manuscript that summarize the raw data:

- Table 1 shows that the prevalence of asymptomatic parasitemia was greater among children living in the lowest transmission setting (Walukuba) than in children living in the medium transmission setting (Kihihi).

- Figure 1 is consistent with Table 1 and shows that the prevalence of asymptomatic parasitemia was greater in children 1-6 years old living in Walukuba (lowest transmission) than in children of the same age living in Kihihi.

- Figure 3 (bottom right panel) shows the non-monotonicity most clearly. This figure shows that for a given parasite density, children living settings with the lowest aEIRs tend to develop lower objective temperatures than children living in slightly higher transmission setting. This is consistent with the non-monotonicity observed for anti-disease immunity. A similar trend is observed for parasite densities (anti-parasite immunity, top right).

To further show that the signal is present in the raw data, we have produced two additional figures to complement those presented in the manuscript. Author response image 3 is an adaptation of Figure 3 (left upper and lower panels) from the manuscript and shows that both anti-parasite (left) and anti-disease (right) immunity seem to develop faster in the lowest transmission setting (Walukuba) than in Kihihi. Author response image 4 is a recreation of Figure 4 from the manuscript, but summarizing the raw data rather than the model output. In it, it is evident that participants from the lowest transmission setting (aEIR <5) tend to develop lower parasite densities (anti-parasite immunity) and lower objective temperatures (anti-disease immunity) than children living in settings with higher aEIR (aEIR 8-20). These results are highly consistent with estimates from the best fitting model.

Author response image 3
Trends in parasite densities recorded during symptomatic (passive surveillance) infections and routine (active surveillance) visits as a function of age; and trends in the objective temperature recorded during visits in which participants were found to have a parasite density between 50,000 parasites/μL and 200,000 parasites/μL, as a function of age Each point represents a measurement obtained during a study visit.

Dark squares represent the mean of the observations from each site.

https://doi.org/10.7554/eLife.35832.039
Author response image 4
Figure summarizing evidence for anti-parasite immunity (left) and anti-disease immunity (right) in the raw data.

Each plot shows, for specific ages and aEIRs, the mean parasite density (/μL) (left), and the mean objective temperature given a parasite density between 10,000 to 80,000 parasites/μL (right). Means and 95% confidence intervals are shown. This plot corresponds to Figure 4 in the manuscript but was created using raw data (rather than model output).

https://doi.org/10.7554/eLife.35832.040

Reviewer #1:

I reviewed an earlier submission of this manuscript which was rejected largely because of the consensus (following consultation between reviewers) that the analysis was not making the best of use of the data. In particular, not accounting for individual-level malaria history from previous visits was felt to be a big limitation.

There have been a number of changes in the current submission which have undoubtedly improved the manuscript and addressed many substantive concerns. First, the provision of the code and data needed for the analysis is very welcome and helps clarify exactly what was done and makes it possible for others to verify the findings.

Second, the revision has clarified that dependencies were accounted for (with a random effects term), and explained why more explicitly accounting for individual histories was not done (because the data did not come from a birth cohort and only limited windows of time were observed for each individual). It has also clarified that individual exposure histories are being implicitly accounted for through adjustment for age, aEIR and through the random effects terms. In light of these clarifications, the modelling decisions seem more understandable.

In addition to these clarifications there is some new material including individual immunity trajectories (output from original model), additional models which did use data on recent exposure (models adjusted for number of P. falciparum positive visits in the previous 3 and 6 months periods), but found no evidence that this recent exposure was associated with either anti-parasite or anti-disease immunity (when already adjusting for age, aEIR and random effects).

There is also some additional sensitivity analysis e.g. adjusting for cumulative aEIR (rather than just aEIR) which suggests an effect of age independent of exposure.

Finally, the authors have added figures showing confidence bounds for age and EIR-specific anti-parasite and anti-disease immunity. This were omitted from the original submission and are also a welcome addition.

As the rebuttal letter makes clear, the authors do not have a clear explanation for the "provocative finding" that children exposed to the lowest transmission are developing immunity more effectively than those in more moderate transmission settings (although the parasite diversity hypothesis at least sounds plausible). Clearly, this finding goes against most preconceptions about how immunity in malaria works and I think the authors are therefore right to spend a lot of effort in sensitivity analyses to show that this is a robust finding and not an artefact. While the fact that same effect is seen for two different measures of immunity strengthens the case for this being a real effect, I am concerned that there are other possible reasons why this could still be an artefact which have not yet been ruled out. Two possibilities I can think of are:

i) Is there a possibility that differences in measuring aEIR at different sites could account for this? The sensitivity analysis excluding Walukuba helps here (Figure 5—figure supplement 5). What about looking at Kihihi/Kanungu alone? This seems to have a big enough range of aEIRs that the effect should be seen if present. [note: following consultation this was not considered to be an essential revision].

We do not think that differences in measuring aEIR could account for the difference, as all study procedures were standardized at all sites. The reviewer is right in pointing out that the non-linearity should be evident if the model is fit to just the data from Kihihi and Walukuba. Please see Author response image 5.

Author response image 5
Results of models quantifying anti-parasite and anti-disease immunity.

This figure is similar to figure 5 in the manuscript, but with the analysis limited to 2238/5640 observations from Walukuba and Kihihi (thus the limited aEIR range).

https://doi.org/10.7554/eLife.35832.041

ii) Is there a possibility that there are edge effects in fitting that GAMs that introduce these effects? This could be checked, for example, by fitting the same models to simulated data under different assumptions. Is it possible get similar results (showing immunity developing faster at high and low aEIRs than at intermediate values) even when data are simulated under the assumption of a monotonic relationship between aEIR and the rate at which immunity develops? [note: following consultation this was not considered an essential revision].

We thank the reviewer for their observation. As stated above (Essential revision #5) the fact that children in the lowest transmission setting are more immune is evident in the raw data and in all analyses. Therefore, we do not think it is an edge effect.

When comparing the model fits (Supplementary file 1), the flexible GAM models (which allow for non-monotonic relationships between aEIR & immunity) are compared with a single mixed model expressing a monotonic relationship (with temperature and log parasite density varying linearly with age and with log(aEIR)). Why not also consider other functional monotonic relationships between these measures of immunity and age and aEIR? [note: following consultation this was not considered an essential revision]

We thank the reviewer for their observation. We have now included a model that includes a linear interaction between age and log(aEIR) (Models AP3, AD3 and SM3). The models allowing for non-linear relationships consistently fit the data better.

Finally, the mgcv packages allows a lot of flexibility when fitting GAMS/GAMMs including allowing for autocorrelated errors. Without diving into the code (which I haven't done) it is not clear what choices were made and why form the supplementary material alone. Are key results robust to modelling decisions made, and what diagnostics checks have been done?

We thank the reviewer for their observation. As described above (Essential revision #5) we are confident that our finding is not an artifact of the analyses. The non-monotonicity in the association between aEIR and the outcomes of immunity is evident in the raw data and is also in the simplest of models (linear models stratified by aEIR).

We have added some diagnostic plots to the supplementary figures.

Reviewer #2:

This is a data analysis exercise using cohort studies taken across the spectrum of Pf transmission in Africa. They use age and number of infectious bites per year to characterise how immunity develops over time. This is a very nice dataset and overall the paper is well written, and the plots are informative and clear. Code and data were provided online in order to reproduce the results.

I have a few concerns in the following paragraphs.

“aEIR as a metric of individual exposure”:

The annual entomological inoculation rate (aEIR) is estimated from monthly mosquito household catch surveys. This estimated quantity is then plugged into the models (on the log scale) as the proxy for the total number of infectious bites per year. Given that in the lowest transmission setting, the median number of infectious bites is 2 per year, this implies that a median of 2 infectious mosquitoes were captured over the course of one year. What is the median denominator here, e.g. how many mosquitoes were captured? The uncertainty on these aEIR estimates must be much larger for the low transmission settings vs high transmission settings. This may explain why the R2 is also much lower when correlating log(aEIR) and hazard of infection (as calculated from a time-to-event model). This may also explain the trends observed in Figure 3 (top right panel), where the individuals with lowest aEIR have lower parasite densities that those with medium aEIR.

This potentially indicates that the aEIR is not a good estimate of the true number of infectious bites at very low transmission? If so, this means the conclusions drawn from the models cannot be taken at face value.

[note: following consultation the consensus was that EIR is not thought to be problematic, though models in which future values of EIR influence the present are considered to be unjustifiable (since events in the future shouldn't influence the present)]

See response above (Essential revision #2)

Model comparison:

The online code was broken in parts and I had to spend an hour debugging it. This is quite annoying!

My main question was to understand whether the more complex non-linear models (GAMs) were truly better than their linear counterparts. In particular whether the pattern shown in Figure 5B was not the result of over-fitting. If I understand Figure 5B correctly (probably the most important plot in the paper), a 2 year old with an aEIR of 2 infectious bites per year has on average the same anti-disease immunity as a 5 year old with an aEIR of ~200 infectious bites per year. This is very hard to believe and my prior on this being true would be very low. I believe this may be an artefact due to the problem highlighted above for the extremely low aEIRs.

I ran a series of 50 random 10-fold cross-validation experiments in order to characterize the out-of-sample mean squared error of each of the models 1-3 and a fourth model: the linear equivalent of model 3 (interaction between age and log(aEIR) with random effects at the individual and household level). The author's model 2 (GAM, no interaction term) performs best on average but the effect is very small. The fact that the non-linear model fits best the data is driving the surprising conclusions and I remain skeptical regarding the following line of the Abstract:

"Our findings suggest a strong effect of age on both types of immunity, that is not explained by cumulative exposure. They also show a non-linear effect of transmission intensity, where children living in the lowest transmission intensity setting appear to develop immunity faster than those experiencing higher transmission."

We are extremely thankful with the reviewer for taking the time to run our code and perform this cross-validation and apologize for the bugs in the code. As stated in our response to the Essential revisions (particularly #5) we are confident that the signal is present in the data. However, we agree that this finding is surprising and that’s why we have devoted a significant part of the discussion presenting different hypotheses that may explain this finding.

Changes made:

We have changed the wording of the Abstract as follows:

“Our findings also show an independent effect of exposure, where children living in moderate and high transmission settings tend to develop immunity faster as transmission increases. Surprisingly, children living in the lowest transmission intensity setting appear to develop immunity more efficiently than those living in the moderate transmission setting.”

Even if the underlying relationship is truly non-linear, it would be useful to report the conclusions of a linear model which are likely to be generalisable. This would be similar to what the authors have done (subsection “Anti-parasite immunity”, fourth paragraph), but for instance reported as: for a twofold increase in yearly inoculation, the pyrogenic densities decrease by X amount.

We thank the reviewer for their observation. We fully agree that results from the linear model are useful and more interpretable. We have now included a table in the main text (Table 2) summarizing the results of the linear models (anti-disease, anti-parasite and overall immunity). While a linear model makes the most sense for aEIR ≥5, we also report coefficients estimated when using the full dataset (and, for completeness, when aEIR <5).

Reviewer #3:

It's tough to come out against this one as the authors have used some great data sets and innovative statistical modelling approaches to tackle a very hard question, namely how is immunity to malaria acquired in moderate to high transmission settings. My concern is that the design of the data, and the design of the model don't fit well together leading to some hard to explain results.

Hard to explain results:

There are at least two results which I would put in the 'hard to explain' category.

Firstly, the authors have proposed biologically and epidemiologically well-informed hypotheses to explain the non-monotonic relationship with aEIR in Figure 7. However a simpler hypothesis is that this is an artefact of combining this particular model and this particular data set.

Please see response to Essential revision #5.

The second result is from Figure 6 where the fever threshold for 39C comes in and out of view as we increase from (a) aEIR = 2; (b) aEIR = 10; (c) aEIR = 50; to (d) aEIR = 200. This result would imply that a 2 year old with parasite density of 1e6 parasites/uL has fever > 39C when aEIR = 2; tolerates parasites better by having fever < 39C at aEIR = 10; then tolerates parasites worse by having fever > 39C when aEIR = 50; before finally switching back to better toleration of parasites with fever < 39C when aEIR = 200.

We thank the reviewer for their observation. The main result that we want to highlight on Figure 6 is how the fever threshold (temperature of 38oC) changes as a function of aEIR. Children living in a setting with aEIR=2 seem to tolerate higher parasite densities than children living in settings with aEIR of 10, 50 or 200 without developing objective temperature >38oC.

We really don’t have enough data to properly estimate the parasite densities associated with a temperature of 39oC or greater. As such, the “hard to explain result” that the reviewer highlights is probably driven by the large variance of the predictions, particularly around the edges (Figure 6—figure supplement 2A, B).

Changes made:

To avoid confusion we have removed the 39°C contour from the plot.

"They also show a non-linear effect of transmission intensity, where children living in the lowest transmission intensity setting appear to develop immunity faster than those experiencing higher transmission."

In an Abstract, one has little choice but to read a statement literally. This implies that children living in the lowest transmission setting appear to develop immunity faster than those experiencing higher transmission. This flies in the face of conventional malaria epidemiology. Perhaps the authors are trying to say something more subtle like there is a diminishing contribution to the acquisition of immunity with subsequent infections.

We thank the reviewer for their comment. We have modified the wording of the Abstract as follows:

“Our findings also show an independent effect of exposure, where children living in moderate and high transmission settings tend to develop immunity faster as transmission increases. Surprisingly, children living in the lowest transmission intensity setting appear to develop immunity more efficiently than those living in the moderate transmission setting.”

Model:

The authors have provided a change in notation to emphasise the utilisation of random effects, but otherwise left the model and results unchanged. The random effects at the individual and household level will account for a substantial degree of the variation between children. However, within an individual the only piece of longitudinal information included is age, incremented by the index k for visit. Otherwise, incidence of symptomatic episodes are independent (and there can be up to 30 of them). For example, the probability of symptomatic malaria is the same for a child on their 1st and 10th episodes.

While it is true that age is the main longitudinal variable, the model includes an interaction between our metric of exposure (aEIR) and age, which implicitly accounts for cumulative exposure (a function of time exposed (or age in endemic settings) and aEIR). Thus, the probability of symptomatic malaria would not be the same for a child on their 1st and 10th episodes unless they occurred on the same day.

Furthermore, we did consider models that explicitly account for cumulative exposure and for recent exposure. These results are presented in Figure 5—figure supplements 2 and 3.

It is notable that although age is updated at each visit, aEIR is not – instead being averaged over the duration of follow-up. Looking at Figure 5 of the original publication by Kamya et al., we see that there is a lot of time-dependent variation. For example, in Kihihi there is a huge spike in aEIR in 2013 towards the end of the study.

Please see response to Essential revision #2.

Some of the 'hard to explain' results could be arising from non-linearities and tensor interactions in the generalised additive models. Looking at models AP1-3, I note very little change in% deviance explained despite changes in the AIC. Looking at models SM1-3, I note that as model complexity increases, the% deviance explained actually decreases, despite the AIC appearing to favouring the more complex models.

Data:

I am concerned that the passively detected cases and routinely (every 3 months) detected cases are fundamentally incompatible.

If I interpret things correctly, a passively detected case will by definition contribute 1 count of a symptomatic episode and 1 light-microscopy measurement of parasite density. These data provide no discriminatory power on whether an infection (upon becoming microscopically detectable) becomes symptomatic, and no information on temperatures < 38°C.

Please see response to Essential revision #1. The reviewer is right in saying that a passively detected case will, by definition, contribute 1 count of a symptomatic episode and 1 measurement of parasite density. However, it is not true that the data provide no information on temperatures <38°C. 1946/3788 passive visits had objective temperatures <38°C.

By not having the precondition of treatment-seeking behaviour and fever >38°C, routinely detected cases arguably provide richer information. Although the majority of these measurements are parasite negative (by microscopy) and presumably excluded.

Please see response to Essential revision #1. While it is true that routine visits do not have the pre-condition of treatment-seeking behavior, fever >38oC is not a pre-condition of non-routine visits (at the time of the visit, when the sample is taken).

It is not right to think either that routine visits are unbiased or provide richer information. In this pediatric population, most of the malaria infections are symptomatic (particularly in children < 5 years), and these are largely captured by the passive system (>95% of febrile illnesses are captured by the passive system). Routine visits only capture symptomatic malaria when (by coincidence) the person becomes sick the day of the visit. Thus, by including only routine visits we would be excluding the majority of the data and of the outcomes of interest.

In Table 1 there are reported to be 2447 + 1555 + 207 = 4209 symptomatic episodes versus 955 + 331 + 145 = 1431 asymptomatic parasitaemia episodes. This suggests that the passively detected cases are provided far more data points.

The reviewer is right. As stated above and in response to Essential revision #1, the passive surveillance system captures most malaria infections in this populations, as the majority of infections are symptomatic.

[Editors' note: further revisions were requested prior to acceptance, as described below.]

The authors have now adequately addressed all but one of the reviewers' main concerns.

The one last point, which reviewer 3 noted the authors did not address in their previous response, was related to the unexpected result of% Deviance Explained as the complexity increases for the nested models for anti-parasite immunity and overall immunity against symptomatic malaria. From the previous review:

"Looking at models AP1-3, I note very little change in% deviance explained despite changes in the AIC. Looking at models SM1-3, I note that as model complexity increases, the% deviance explained actually decreases, despite the AIC appearing to favouring the more complex models."

This is an important point that requires a response.

We thank the reviewer for their comment and apologize for not addressing this point before.

While it is expected that AIC should correlate well with the% deviance explained, the correlation is not perfect particularly when the change in model fit is small. As the reviewer points out, when comparing models SM2 and SM4, the% deviance explained decreases while the AIC changes very little (from 5373 to 5369). This suggests that SM4 (the more complex model) is not really an improvement over SM2 (the model without the interaction). When comparing models AP1-AP4 the% deviance explained does not change much, while the changes in AIC are larger (from 14052 to 14032) and we interpret this as evidence of a better fit of the more complex model. Larger changes in both AIC and% deviance explained, as those observed comparing models AD1-AD4, do provide stronger support in favor of the more complex model for this particular outcome.

Since the non-linear interaction models seem to fit the data better for both anti-disease and anti-parasite immunity models, we decided to present results from this model for all outcomes of interest in the paper. However, the main study findings are robust to model choice. The main results are presented in (Figures 5A and 7) for models AP2 and SM2.

Changes made:

Since our model choice relied on AIC more than on percent deviance explained, we have changed the text in the Materials and methods as follows:

“Best fitting models were selected based on Akaike’s Information Criterion, but changes in the percent deviance explained are also presented.”

In addition, we have added some text to the section “Overall immunity against symptomatic malaria” stating that model fit was similar for models SM2 and SM4.

“Models allowing smooth relationships, with or without for two-way interactions, fit the data equally well.”

Reviewer 2 also made the comment that It would be useful if the authors provided an extra variable in their data on github: passive versus active detection.

We apologize if this is not clear in the data. All visits where the “visittype” variable is “Not routine” are from passive case detection. All other values (“Enrollment”, “Routine” and “T-cell visit”) correspond to active detection.

We have added this information to the data dictionary.

https://doi.org/10.7554/eLife.35832.045

Article and author information

Author details

  1. Isabel Rodriguez-Barraquer

    Department of Medicine, San Francisco General Hospital, University of California, San Francisco, San Francisco, United States
    Contribution
    Conceptualization, Data curation, Formal analysis, Investigation, Visualization, Methodology, Writing—original draft, Writing—review and editing
    For correspondence
    isabel.rodriguez-barraquer@ucsf.edu
    Competing interests
    No competing interests declared
    ORCID icon "This ORCID iD identifies the author of this article:" 0000-0001-6784-1021
  2. Emmanuel Arinaitwe

    Infectious Diseases Research Collaboration, Kampala, Uganda
    Contribution
    Investigation, Project administration, Writing—review and editing
    Competing interests
    No competing interests declared
  3. Prasanna Jagannathan

    Department of Medicine, Stanford University, Stanford, United States
    Contribution
    Formal analysis, Investigation, Writing—review and editing
    Competing interests
    No competing interests declared
    ORCID icon "This ORCID iD identifies the author of this article:" 0000-0001-6305-758X
  4. Moses R Kamya

    Department of Medicine, Makerere University College of Health Sciences, Kampala, Uganda
    Contribution
    Supervision, Investigation, Methodology, Writing—review and editing
    Competing interests
    No competing interests declared
  5. Phillip J Rosenthal

    Department of Medicine, San Francisco General Hospital, University of California, San Francisco, San Francisco, United States
    Contribution
    Conceptualization, Funding acquisition, Investigation, Writing—review and editing
    Competing interests
    No competing interests declared
  6. John Rek

    Infectious Diseases Research Collaboration, Kampala, Uganda
    Contribution
    Supervision, Investigation, Writing—review and editing
    Competing interests
    No competing interests declared
  7. Grant Dorsey

    Department of Medicine, San Francisco General Hospital, University of California, San Francisco, San Francisco, United States
    Contribution
    Conceptualization, Funding acquisition, Investigation, Writing—review and editing
    Competing interests
    No competing interests declared
  8. Joaniter Nankabirwa

    Infectious Diseases Research Collaboration, Kampala, Uganda
    Contribution
    Investigation, Project administration, Writing—review and editing
    Competing interests
    No competing interests declared
  9. Sarah G Staedke

    London School of Hygiene and Tropical Medicine, London, United Kingdom
    Contribution
    Supervision, Investigation, Writing—review and editing
    Competing interests
    No competing interests declared
  10. Maxwell Kilama

    Infectious Diseases Research Collaboration, Kampala, Uganda
    Contribution
    Data curation, Investigation, Writing—review and editing
    Competing interests
    No competing interests declared
  11. Chris Drakeley

    London School of Hygiene and Tropical Medicine, London, United Kingdom
    Contribution
    Conceptualization, Funding acquisition, Investigation, Writing—review and editing
    Competing interests
    No competing interests declared
    ORCID icon "This ORCID iD identifies the author of this article:" 0000-0003-4863-075X
  12. Isaac Ssewanyana

    Infectious Diseases Research Collaboration, Kampala, Uganda
    Contribution
    Investigation, Writing—review and editing
    Competing interests
    No competing interests declared
  13. David L Smith

    Institute of Health Metrics and Evaluation, University of Washington, Seattle, United States
    Contribution
    Conceptualization, Formal analysis, Writing—original draft
    Competing interests
    No competing interests declared
    ORCID icon "This ORCID iD identifies the author of this article:" 0000-0003-4367-3849
  14. Bryan Greenhouse

    Department of Medicine, San Francisco General Hospital, University of California, San Francisco, San Francisco, United States
    Contribution
    Conceptualization, Formal analysis, Funding acquisition, Methodology, Writing—original draft, Writing—review and editing
    Competing interests
    No competing interests declared

Funding

National Institutes of Health (2U19AI089674)

  • Isabel Rodriguez-Barraquer
  • Emmanuel Arinaitwe
  • Prasanna Jagannathan
  • Moses R Kamya
  • Phillip J Rosenthal
  • John Rek
  • Grant Dorsey
  • Joaniter Nankabirwa
  • Sarah G Staedke
  • Maxwell Kilama
  • Chris Drakeley
  • Isaac Ssewanyana
  • David L Smith
  • Bryan Greenhouse

Bill and Melinda Gates Foundation (OPP1110495)

  • David L Smith

The funders had no role in study design, data collection and interpretation, or the decision to submit the work for publication.

Acknowledgements

We thank all study participants who participated in this study and their families. We also thank the study team and the Makerere University–UCSF Research Collaboration and the Infectious Diseases Research Collaboration for administrative and technical support.

Ethics

Human subjects: The study protocol was reviewed and approved by the Makerere University School of Medicine Research and Ethics Committee (Identification numbers 2011-149 and 2011-167), the London School of Hygiene and Tropical Medicine Ethics Committee (Identification numbers 5943 and 5944), the Durham University School of Biological and Biomedical Sciences Ethics Committee (PRISM Entomology Uganda), the University of California, San Francisco, Committee on Human Research (Identification numbers 11-05539 and 11-05995) and the Uganda National Council for Science and Technology (Identification numbers HS350 and HS-1019). All parents/guardians were asked to provide written informed consent at the time of enrollment.

Senior Editor

  1. Prabhat Jha, Saint Michael's Hospital, Canada

Reviewing Editor

  1. Ben Cooper, Mahidol Oxford Tropical Medicine Research Unit, Thailand

Version history

  1. Received: February 10, 2018
  2. Accepted: July 15, 2018
  3. Accepted Manuscript published: July 25, 2018 (version 1)
  4. Version of Record published: August 21, 2018 (version 2)

Copyright

© 2018, Rodriguez-Barraquer et al.

This article is distributed under the terms of the Creative Commons Attribution License, which permits unrestricted use and redistribution provided that the original author and source are credited.

Metrics

  • 3,341
    Page views
  • 578
    Downloads
  • 69
    Citations

Article citation count generated by polling the highest count across the following sources: Scopus, PubMed Central, Crossref.

Download links

A two-part list of links to download the article, or parts of the article, in various formats.

Downloads (link to download the article as PDF)

Open citations (links to open the citations from this article in various online reference manager services)

Cite this article (links to download the citations from this article in formats compatible with various reference manager tools)

  1. Isabel Rodriguez-Barraquer
  2. Emmanuel Arinaitwe
  3. Prasanna Jagannathan
  4. Moses R Kamya
  5. Phillip J Rosenthal
  6. John Rek
  7. Grant Dorsey
  8. Joaniter Nankabirwa
  9. Sarah G Staedke
  10. Maxwell Kilama
  11. Chris Drakeley
  12. Isaac Ssewanyana
  13. David L Smith
  14. Bryan Greenhouse
(2018)
Quantification of anti-parasite and anti-disease immunity to malaria as a function of age and exposure
eLife 7:e35832.
https://doi.org/10.7554/eLife.35832

Further reading

    1. Biochemistry and Chemical Biology
    2. Epidemiology and Global Health
    Takashi Sasaki, Yoshinori Nishimoto ... Yasumichi Arai
    Research Article

    Background: High levels of circulating adiponectin are associated with increased insulin sensitivity, low prevalence of diabetes, and low body mass index (BMI); however, high levels of circulating adiponectin are also associated with increased mortality in the 60-70 age group. In this study, we aimed to clarify factors associated with circulating high-molecular-weight (cHMW) adiponectin levels and their association with mortality in the very old (85-89 years old) and centenarians.

    Methods: The study included 812 (women: 84.4%) for centenarians and 1,498 (women: 51.7%) for the very old. The genomic DNA sequence data were obtained by whole genome sequencing or DNA microarray-imputation methods. LASSO and multivariate regression analyses were used to evaluate cHMW adiponectin characteristics and associated factors. All-cause mortality was analyzed in three quantile groups of cHMW adiponectin levels using Cox regression.

    Results: The cHMW adiponectin levels were increased significantly beyond 100 years of age, were negatively associated with diabetes prevalence, and were associated with SNVs in CDH13 (p = 2.21 × 10⁻²²) and ADIPOQ (p = 5.72 × 10⁻⁷). Multivariate regression analysis revealed that genetic variants, BMI, and high-density lipoprotein cholesterol (HDLC) were the main factors associated with cHMW adiponectin levels in the very old, whereas the BMI showed no association in centenarians. The hazard ratios for all-cause mortality in the intermediate and high cHMW adiponectin groups in very old men were significantly higher rather than those for all-cause mortality in the low level cHMW adiponectin group, even after adjustment with BMI. In contrast, the hazard ratios for all-cause mortality were significantly higher for high cHMW adiponectin groups in very old women, but were not significant after adjustment with BMI.

    Conclusions: cHMW adiponectin levels increased with age until centenarians, and the contribution of known major factors associated with cHMW adiponectin levels, including BMI and HDLC, varies with age, suggesting that its physiological significance also varies with age in the oldest old.

    Funding: This study was supported by grants from the Ministry of Health, Welfare, and Labour for the Scientific Research Projects for Longevity; a Grant-in-Aid for Scientific Research (No 21590775, 24590898, 15KT0009, 18H03055, 20K20409, 20K07792, 23H03337) from the Japan Society for the Promotion of Science; Keio University Global Research Institute (KGRI), Kanagawa Institute of Industrial Science and Technology (KISTEC), Japan Science and Technology Agency (JST) Research Complex Program 'Tonomachi Research Complex' Wellbeing Research Campus: Creating new values through technological and social innovation (JP15667051), the Program for an Integrated Database of Clinical and Genomic Information from the Japan Agency for Medical Research and Development (No. 16kk0205009h001, 17jm0210051h0001, 19dk0207045h0001); the medical-welfare-food-agriculture collaborative consortium project from the Japan Ministry of Agriculture, Forestry, and Fisheries; and the Biobank Japan Program from the Ministry of Education, Culture, Sports, and Technology.

    1. Epidemiology and Global Health
    Charumathi Sabanayagam, Feng He ... Ching Yu Cheng
    Research Article Updated

    Background:

    Machine learning (ML) techniques improve disease prediction by identifying the most relevant features in multidimensional data. We compared the accuracy of ML algorithms for predicting incident diabetic kidney disease (DKD).

    Methods:

    We utilized longitudinal data from 1365 Chinese, Malay, and Indian participants aged 40–80 y with diabetes but free of DKD who participated in the baseline and 6-year follow-up visit of the Singapore Epidemiology of Eye Diseases Study (2004–2017). Incident DKD (11.9%) was defined as an estimated glomerular filtration rate (eGFR) <60 mL/min/1.73 m2 with at least 25% decrease in eGFR at follow-up from baseline. A total of 339 features, including participant characteristics, retinal imaging, and genetic and blood metabolites, were used as predictors. Performances of several ML models were compared to each other and to logistic regression (LR) model based on established features of DKD (age, sex, ethnicity, duration of diabetes, systolic blood pressure, HbA1c, and body mass index) using area under the receiver operating characteristic curve (AUC).

    Results:

    ML model Elastic Net (EN) had the best AUC (95% CI) of 0.851 (0.847–0.856), which was 7.0% relatively higher than by LR 0.795 (0.790–0.801). Sensitivity and specificity of EN were 88.2 and 65.9% vs. 73.0 and 72.8% by LR. The top 15 predictors included age, ethnicity, antidiabetic medication, hypertension, diabetic retinopathy, systolic blood pressure, HbA1c, eGFR, and metabolites related to lipids, lipoproteins, fatty acids, and ketone bodies.

    Conclusions:

    Our results showed that ML, together with feature selection, improves prediction accuracy of DKD risk in an asymptomatic stable population and identifies novel risk factors, including metabolites.

    Funding:

    This study was supported by the National Medical Research Council, NMRC/OFLCG/001/2017 and NMRC/HCSAINV/MOH-001019-00. The funders had no role in study design, data collection and analysis, decision to publish, or preparation of the manuscript.