Evolutionary and functional insights into the mechanism underlying body-size-related adaptation of mammalian hemoglobin
- Ben-Gurion University of the Negev, Israel
Figures
Figure 1
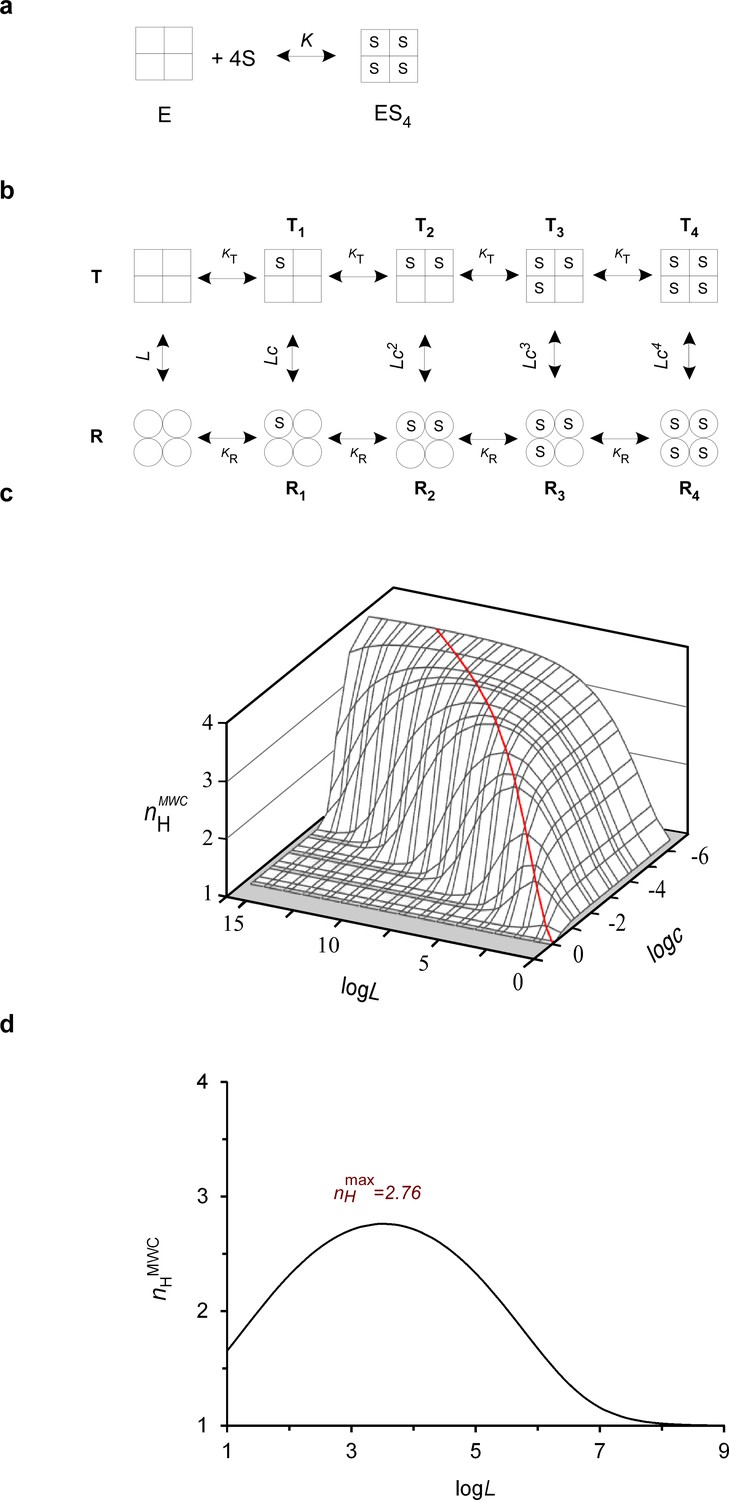
The biophysical Hill landscape of a tetrameric MWC protein.
(a) Schematic representation of the all-or-none Hill binding mode by a tetrameric protein (E), with K referring to the substrate (S) dissociation equilibrium constant. (b) Schematic representation of the MWC model applied to a tetrameric allosteric protein. Square and round symbols represent the tense (T) and relaxed (R) subunit conformations, respectively. L, KT and KR denote the T to R transition equilibrium constant in the absence of substrate and substrate affinity to the T and R conformations, respectively. The parameter c corresponds to the ratio of substrate affinity to the R and T conformations (=KR/KT). (c) The theoretical three-dimensional Hill landscape describing the dependence of nHMWC at half-saturation on both the L and c parameters (calculated based on Equation 5). The red ridge line trajectory corresponds to parameter value pairs giving rise to maximum cooperativity. (d) Dependence of the Hill coefficient at half-saturation (nHMWC) on the allosteric constant L, as determined according to Equation 5. The curve was plotted assuming a c value of ~ 0.01, typical for the ratio of oxygen affinity to the R and T conformations of human Hb. The saddle point of the bell-shaped curve corresponds to a Hill value of ~ 2.8 (as observed for human Hb), fulfilling the L = c-2 criterion giving rise to maximum cooperativity.
Figure 2
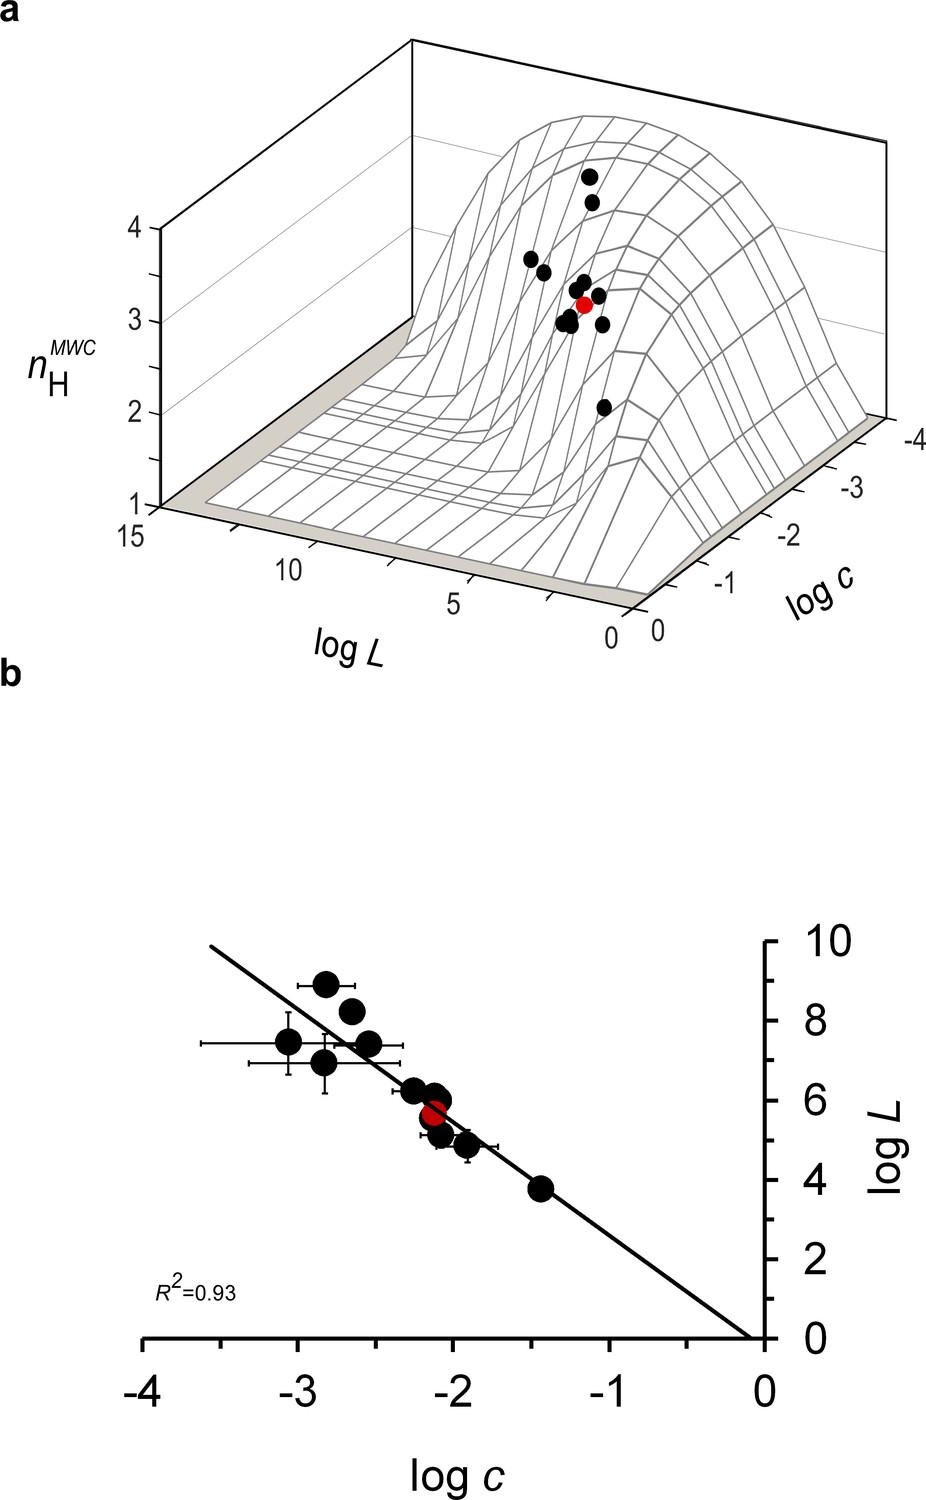
Mammalian hemoglobins exhibit maximum cooperativity nH values.
(a) values of the different mammal Hbs from the evolutionary dataset, calculated based on derived values for the L, KT and KR elementary MWC parameters, reside close to the ridge line of the three-dimensional biophysical Hill landscape. (b) Correlation plot relating the logarithms of the relative affinity (c) and conformational ratio (L) of the T and R quaternary MWC states of different mammalian Hbs comprising the evolutionary dataset (Supplementary file 1). The solid curve corresponds to a linear regression with a R2 correlation coefficient of 0.93, a slope of -2.7 (± 0.3) and an intercept at logL of -0.2, very close to the 0 value expected based on the Lc2=1 criterion. In both panels, the red data point corresponds to the values for human Hb.
Figure 3

A buffering of cooperativity physiological regime is observed for human hemoglobin around its maximum cooperativity value.
(a) Mapping of the Hill coefficient and the logarithm of the apparent allosteric constant (L) values for all human oxygen saturation curves of the pH, CO2 and BPG physiological datasets (Supplementary file 2) onto the theoretical nH-logL curve of human Hb. The nH values for all physiological dataset curves were calculated using the derived apparent L value for each curve and assuming a common c value. The theoretical nH-logL curve was calculated assuming a c value of 0.007 (±0.001), corresponding to the averaged c value of all human physiological datasets (Supplementary file 2). Black circles, squares and diamonds correspond to pH, CO2 and BPG data points, respectively. Gray symbols represent pairs of logL-nH values for Hb mutantS reported in the literature and assuming no change in c upon mutation (Baldwin, 1976). (b) Dependence of the Hill coefficient at half-saturation on the apparent allosteric constant for all oxygen saturation curves of the dog and bovine physiological datasets (squares and circles, respectively). For each species, the appropriate c value (Supplementary file 1) was used to calculate the theoretical curve, onto which the actual logL-nH data points were mapped.
Figure 4 with 1 supplement
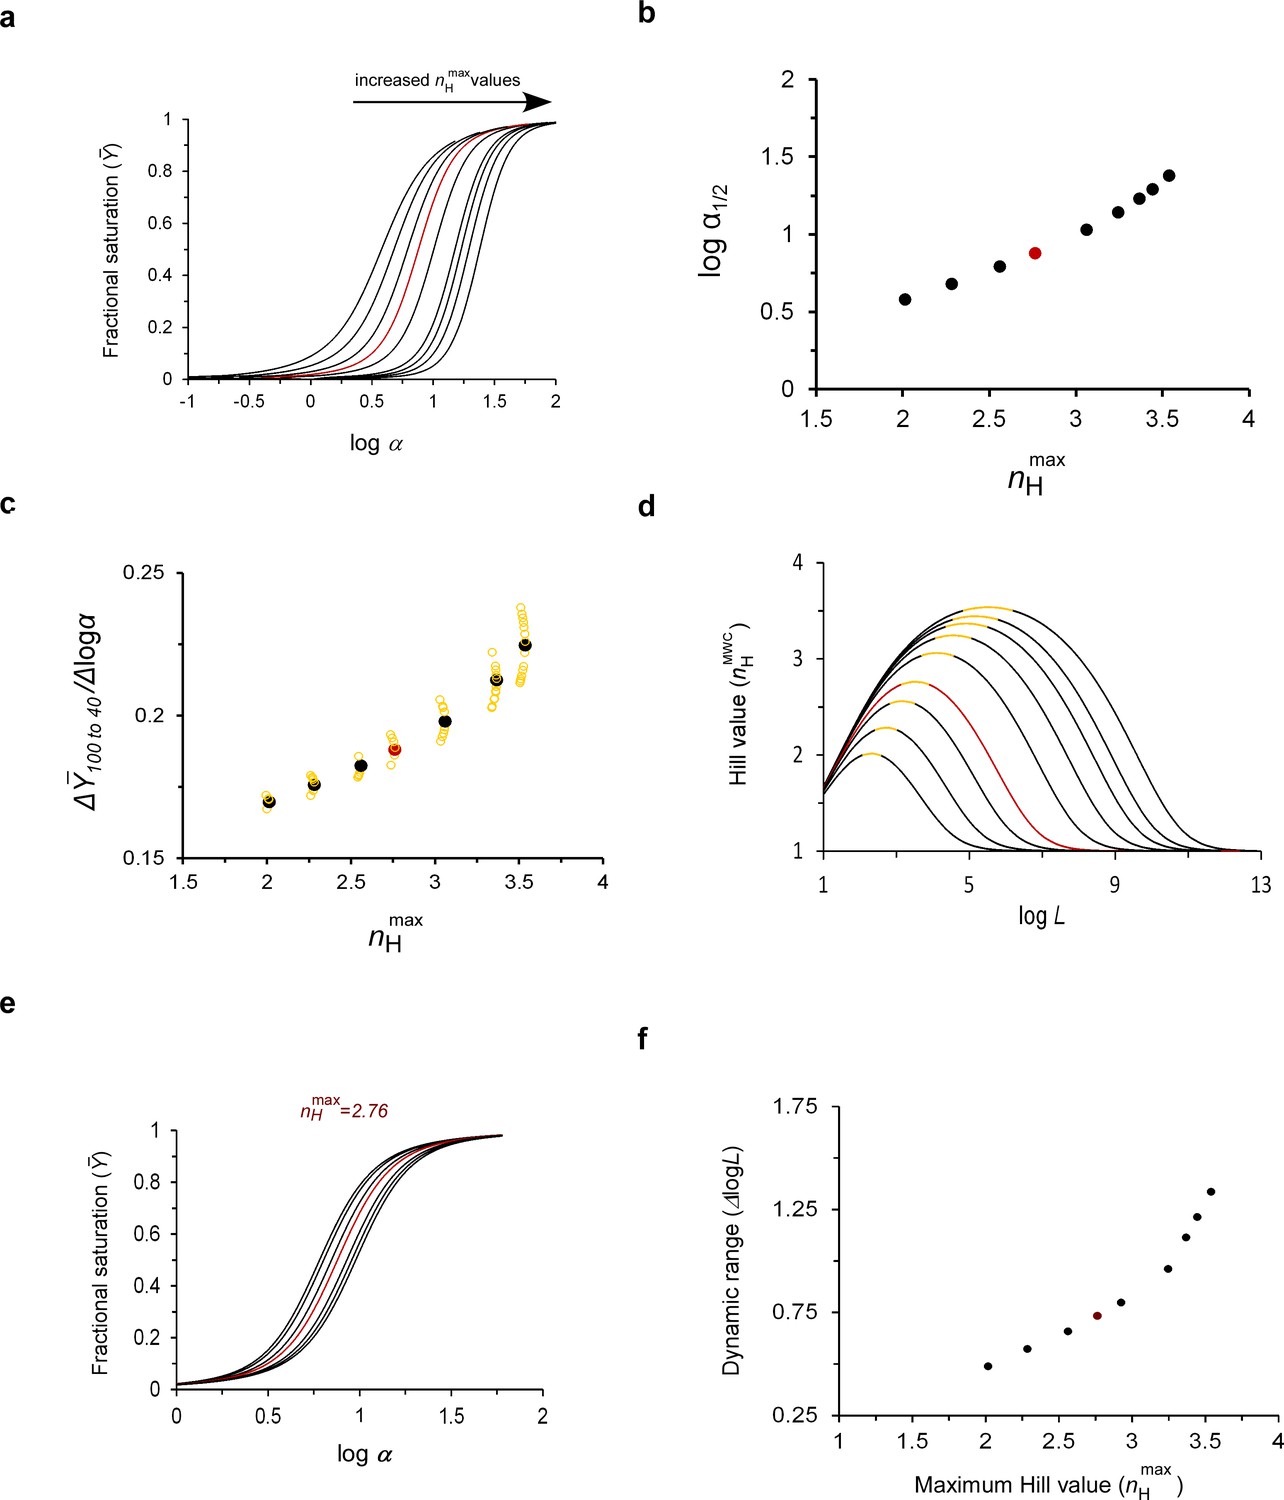
The maximum cooperativity point determines MWC protein substrate unbinding sensitivity and the dynamic range of physiological adaptation.
(a) Fractional saturation binding curves of a MWC protein as a function of the logarithm of the scaled concentration α, with parameter values that give rise to systematically higher maximum cooperativity nH values. The pairs of L and c values for all curves obey the maximum cooperativity criterion and are listed in Table 1. (b) Dependence of the logarithm of the scaled affinity (logα1/2) of the curves presented in (a) on the maximum cooperativity Hill value (nHmax). (c) Dependence of the substrate unbinding sensitivity (Δ/Δlogα) of a tetrameric MWC protein on nHmax (filled black symbols). The array of open yellow symbols decorating each maximum cooperativity point corresponds to changes in the Y axis values due to changes in L that reside within the correspondingly encoded buffering of cooperativity regime (see text) (d) Dependence of on the logarithm of the allosteric constant L around the different maximum cooperativity points indicated in (a) and Table 1 (and assuming their different c values). For each curve, the portion highlighted in yellow corresponds to the logL range fulfilling the ‘buffering of cooperativity’ regime, that is the L range around the maximum Hill point that gives rise to fractional saturation curves all exhibiting less than 1% change in the maximum Hill coefficient value. Such a physiological dataset is observed for the maximum point of ~2.8, characteristic of human Hb in panel (e) (calculated using its appropriate c value; see Supplementary file 1). Similar data for different maximum cooperativity values are presented in Figure 4—figure supplement 1. In each physiological dataset, the curve indicated in red corresponds to the maximum cooperativity curve (f) Dependence of the broadness of the ‘buffering of cooperativity’ regime (the dynamic range), as defined above, on the maximum cooperativity Hill value. In all figure panels, the curves indicated in red were calculated using the experimental values for human Hb reported in the literature. The red data points in several of the panels represent approximated values of human Hb.
Figure 4—figure supplement 1
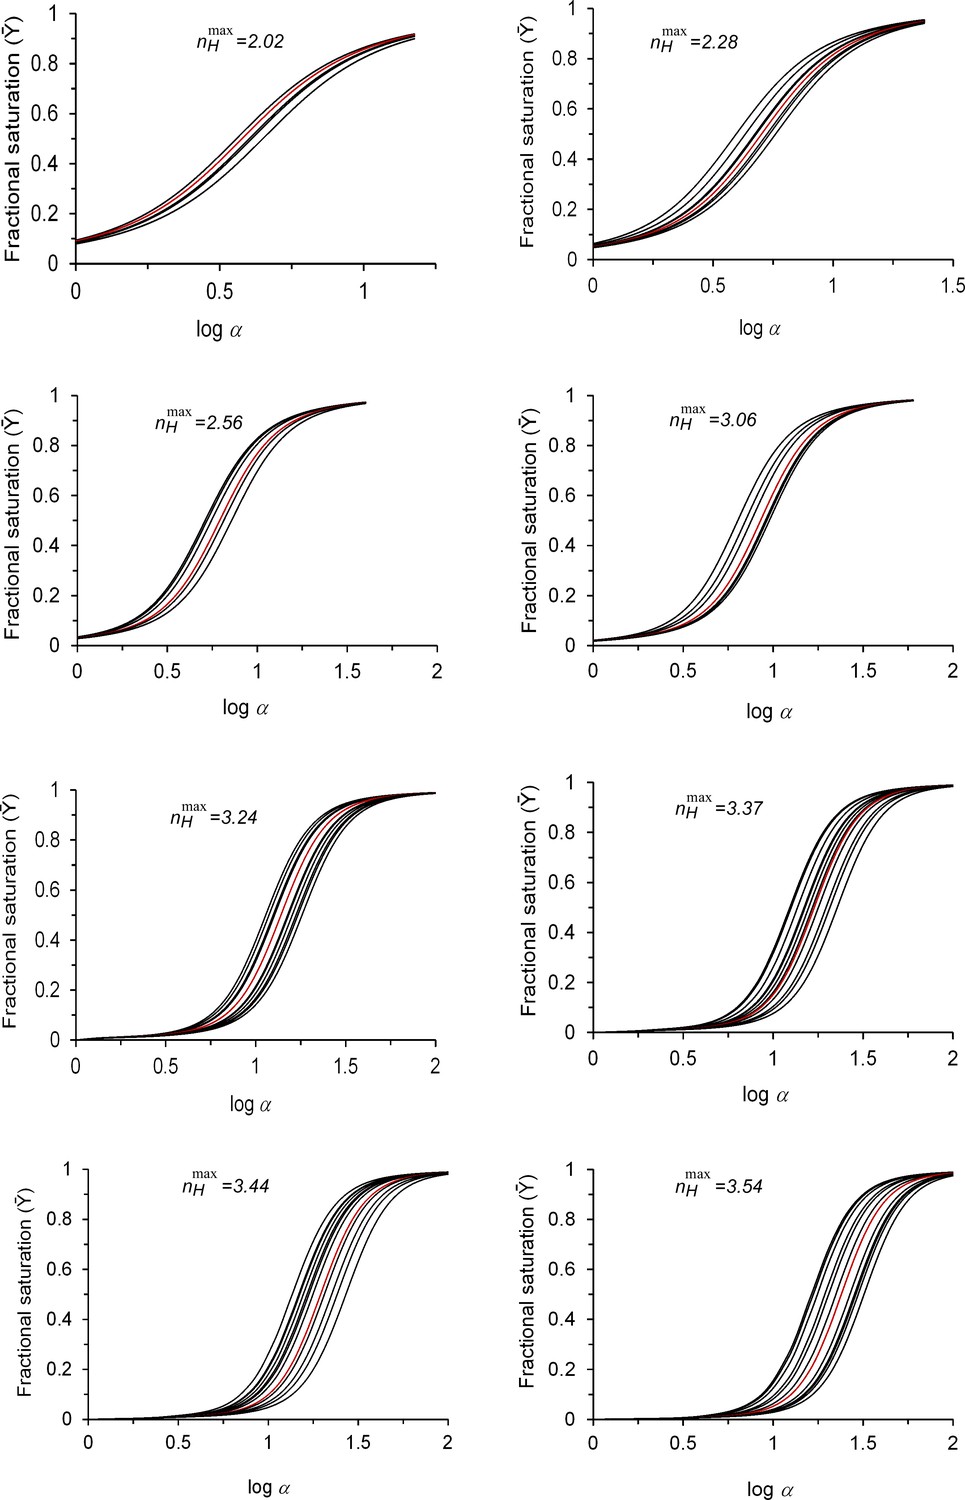
Simulated MWC-based physiological saturation data around different maximum cooperativity nH values.
MWC-based simulated fractional saturation curves generated by changing the L value around different maximum cooperativity points, as indicated above each panel. These values are identical to those used to generate the saturation curves presented in Figure 4a. For each dataset, the reference saturation curve of the maximum cooperativity point is indicated in red. For each maximum cooperativity point, L values were chosen such that the nH value of any curve in the physiological dataset would not differ from the maximum nH point by more than 1%, and would thus still be contained within the ‘buffering of cooperativity’ regime. The logL range fulfilling this requirement is highlighted in yellow on the nH-logL bell-shaped plots appropriate for each maximum cooperativity point, as described in the legend to Figure 4d.
Figure 5
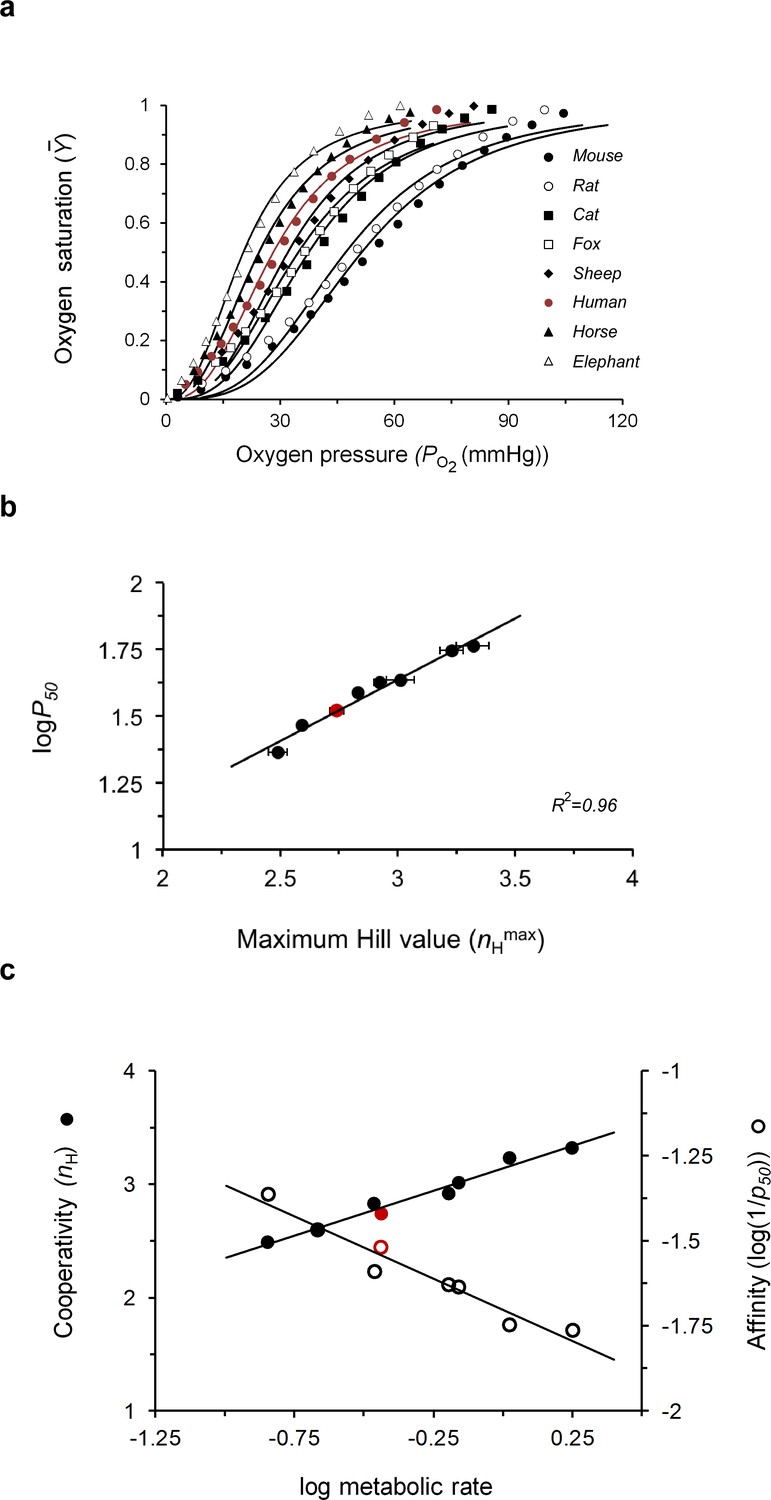
Evolutionary tuning of the maximum cooperativity and affinity points of mammalian hemoglobins underlies physiological adaptation.
(a) Dependence of the fractional oxygen saturation of animal blood sample Hbs on partial oxygen pressure, as reported by Schmidt-Neilsen and Larimer (1958), Schmidt-Nielsen (1970). Solid curves represent data fitting to the Hill equation (Equation 1). p50 and nH values for oxygen binding to the different mammalian Hb datasets are reported in Table 2. (b) Correlation plot relating the maximum nH and logp50 values of the curves shown in a. (c) Dependence of the values for both cooperativity (filled symbols) and affinity (open symbols) properties of different animal Hbs on normalized metabolic rates in that animal (relative to body weight). A linear trend is observed in both cases, with R2 values of 0.97 and 0.9 for the cooperativity and affinity correlations, respectively. Values for animal metabolic rates were taken from Schmidt-Neilsen and Larimer (1958). The red curve or data points presented in panels 5a-c correspond to the values for human Hb.
Tables
Table 1
Values for the L and c MWC parameters giving rise to systematically higher maximum cooperativity Hill valuesa
https://doi.org/10.7554/eLife.47640.008| c | L | Maximum Hill value (nHmax) |
|---|---|---|
| 0.07071 | 200 | 2.02 |
| 0.04472 | 500 | 2.28 |
| 0.02582 | 1500 | 2.56 |
| 0.01741 | 3300 | 2.76 |
| 0.01222 | 6700 | 3.06 |
| 0.00524 | 36400 | 3.24 |
| 0.0035 | 81800 | 3.37 |
| 0.00262 | 145400 | 3.44 |
| 0.00175 | 327200 | 3.54 |
-
aValues for the c and L parameters giving rise to the maximum Hill slopes (indicated in the right-most column), characteristic of the binding saturation curves analyzed in Figure 4a. All parameter sets meet the Lc2 = 1 criterion. The parameter set giving rise to the maximum cooperativity of human Hb, as reported in the literature and in Supplementary file 1, is indicated in bold. The different c values indicated were obtained by varying the KR affinity parameter while assuming a constant KT value of 143 (see Supplementary file 1).
Table 2
Values for the affinity and cooperativity parameters of animal blood hemoglobin binding curvesa
https://doi.org/10.7554/eLife.47640.010| Animal | P50 (mmHg) | nH |
|---|---|---|
| Elephant | 23.03 ± 0.32 | 2.49 ± 0.04 |
| Horse | 29.26 ± 0.16 | 2.59 ± 0.01 |
| Human | 33.02 ± 0.29 | 2.74 ± 0.03 |
| Sheep | 38.82 ± 0.11 | 2.83 ± 0.01 |
| Fox | 42.36 ± 0.22 | 2.92 ± 0.02 |
| Cat | 43.22 ± 0.62 | 3.01 ± 0.06 |
| Rat | 55.63 ± 0.57 | 3.23 ± 0.05 |
| Mouse | 57.86 ± 0.76 | 3.32 ± 0.07 |
-
aValues for the point of half-saturation (P50) and the Hill coefficient at half-saturation (nH) were derived by fitting blood sample animal Hb oxygen saturation curves (Schmidt-Neilsen and Larimer, 1958; Schmidt-Nielsen, 1970) to the Hill equation.
Additional files
-
Supplementary file 1
MWC allosteric parameters of the hemoglobin evolutionary dataset oxygen saturation curves.
aThe MWC allosteric parameters for Hb evolutionary datasets reported in this table were obtained as described in Rapp and Yifrach (2017). The KT and KR parameters correspond to the affinity of oxygen to the T and R Hb MWC quaternary states, respectively, whereas c and L correspond to the relative affinity (c = KR/KT) and conformational ratio (L = [T]/[R]) of the T and R states, respectively. bThe mammalian Hb species analyzed in the current analysis, as reported in Milo et al. (2007). cHill coefficient at half-saturation calculated based on Equation 5 and using the KR, KT, and L MWC parameters of the different mammalian Hb binding curves (see Rapp and Yifrach, 2017). dHill coefficients at half-saturation obtained upon fitting Hb oxygen saturation data to the Hill equation (Equation 1), as reported in Milo et al. (2007).
- https://doi.org/10.7554/eLife.47640.011
-
Supplementary file 2
MWC allosteric parameters of the hemoglobin physiologydataset oxygen saturation curves.
aThe table is adopted from Rapp and Yifrach (2017). The MWC allosteric parameters for the Hb pH, CO2 and 2,3-BPG physiological datasets were obtained using global fitting analysis, as described in Rapp and Yifrach (2017). The analysis was carried out assuming a single c value for each dataset curve. bThe values for L are apparent, as they were determined in the presence of varying concentrations of the same effector. cHill coefficients at half-saturation calculated based on based on Equation 5 and using the KR, KT, and L MWC parameters of each physiological dataset curve.
- https://doi.org/10.7554/eLife.47640.012
-
Transparent reporting form
- https://doi.org/10.7554/eLife.47640.013
Download links
A two-part list of links to download the article, or parts of the article, in various formats.
Downloads (link to download the article as PDF)
Open citations (links to open the citations from this article in various online reference manager services)
Cite this article (links to download the citations from this article in formats compatible with various reference manager tools)
Evolutionary and functional insights into the mechanism underlying body-size-related adaptation of mammalian hemoglobin
eLife 8:e47640.
https://doi.org/10.7554/eLife.47640


