The hippocampus encodes delay and value information during delay-discounting decision making

  1. Akira Masuda  Is a corresponding author
  2. Chie Sano
  3. Qi Zhang
  4. Hiromichi Goto
  5. Thomas J McHugh
  6. Shigeyoshi Fujisawa
  7. Shigeyoshi Itohara  Is a corresponding author
  1. Laboratory for Behavioral Genetics, Center for Brain Science, RIKEN, Japan
  2. Organization for Research Initiatives and Development, Doshisha University, Japan
  3. Faculty of Human Science, University of Tsukuba, Japan
  4. Laboratory for Circuit and Behavioral Physiology, Center for Brain Science, RIKEN, Japan
  5. Laboratory for Systems Neurophysiology, Center for Brain Science, RIKEN, Japan

Abstract

The hippocampus, a region critical for memory and spatial navigation, has been implicated in delay discounting, the decline in subjective reward value when a delay is imposed. However, how delay information is encoded in the hippocampus is poorly understood. Here, we recorded from CA1 of mice performing a delay-discounting decision-making task, where delay lengths, delay positions, and reward amounts were changed across sessions, and identified subpopulations of CA1 neurons that increased or decreased their firing rate during long delays. The activity of both delay-active and -suppressed cells reflected delay length, delay position, and reward amount; but manipulating reward amount differentially impacted the two populations, suggesting distinct roles in the valuation process. Further, genetic deletion of the N-methyl-D-aspartate (NMDA) receptor in hippocampal pyramidal cells impaired delay-discount behavior and diminished delay-dependent activity in CA1. Our results suggest that distinct subclasses of hippocampal neurons concertedly support delay-discounting decisions in a manner that is dependent on NMDA receptor function.

Introduction

Animals faced with multiple options optimize their decisions through a complex cost-benefit valuation. The introduction of a time delay decreases preference for the delayed option (delay discounting) (Ainslie, 1992; Ainslie, 1975), with the discount rate varying on an individual basis. People who are considered patient exhibit lower discount rates, whereas impatient (or impulsive) people exhibit higher discount rates. Further, higher discount rates have been shown to be related to various neuropsychological disorders (Bickel and Marsch, 2001; Chesson et al., 2006; Epstein et al., 2008; Luman et al., 2010; Odum et al., 2000; Weller et al., 2008). Although lesion studies have revealed a critical role for the hippocampus in delay discounting (Figner et al., 2010; Kalivas and Volkow, 2005; Peters and Büchel, 2011; Cheung and Cardinal, 2005; Mariano et al., 2009; McHugh et al., 2008), how this is reflected in hippocampal activity remains poorly understood.

Decades of study point to a critical role for the hippocampus in episodic memory (Scoville and Milner, 1957; Squire, 1992) and spatial navigation (Burgess et al., 2002; Ekstrom et al., 2003). Although much of the rodent hippocampal physiology literature has focused on the spatial code present in hippocampal place cell activity (Jung and McNaughton, 1993; O'Keefe and Dostrovsky, 1971; Wilson and McNaughton, 1993), subsequent work has demonstrated that the circuit is capable of encoding a variety of spatiotemporal features beyond the animal’s current position, including past and future trajectories (Ambrose et al., 2016; Foster and Wilson, 2006; Johnson et al., 2007; Johnson and Redish, 2007; Pfeiffer and Foster, 2013; Skaggs and McNaughton, 1996), the location of other animals or objects (Danjo et al., 2018; Omer et al., 2018), internal time (Kraus et al., 2013; MacDonald et al., 2011; Manns et al., 2007; Pastalkova et al., 2008), and various physical scales (Aronov et al., 2017; Terada et al., 2017).

When trying to understand the links between behavior and physiological data, several factors must be considered, including the variable(s) correlated with the activity, the regions or cell assemblies engaged and the mechanisms of representation on both the single-cell and population levels. To this end, studies combining imaging and recording with optogenetic manipulation and identification suggest that subsets of CA1 neurons can encode distinct features of a task (Cembrowski et al., 2016; Danielson et al., 2016). Consistent with these data, Gauthier and Tank (2018) recently identified a unique population of neurons that are active at reward sites, serving as ‘reward cells’. Although the modulation of reward-based activity has been well-investigated in relation to spatial context (Hölscher et al., 2003; Lee et al., 2012; Murty and Adcock, 2014; Ólafsdóttir et al., 2015; Peters and Büchel, 2010; Singer and Frank, 2009) or probability discounting (Tryon et al., 2017), the impact of delay (length/location) and reward amount, which both alone and together constitute the core computation for delay-based decision making, has not been examined. Further, since delay and reward both modulate value, the most important parameter for decision making, neurons encoding value information should respond in similar ways to changes in delay length increment/decrement and reward amount loss/gain, as can be seen in dopaminergic neurons in the ventral tegmental area (VTA) (Roesch et al., 2007).

There are at least two dissociable schemes of hippocampal coding for delay length. One is on the population level, with time cells (MacDonald et al., 2011; Pastalkova et al., 2008) — which are a series of neurons that separately represent distinct temporally receptive fields that tile the delay period — forming sequences that correspond with different delay lengths. The other is rate coding, where individual neurons change their firing rate according to the delay length variations.

Here, we designed experiments to identify and characterize hippocampal neurons that are engaged during the delay of a delay-discounting task and to probe their sensitivity to changes in delay length, delay position, and reward amount. We recorded single-unit activity in CA1 of mice performing a delay-discounting version of the T-maze task (Zhang et al., 2018), and assessed changes in neural activity related to delay length, delay position, and reward size. We first examine the two schemes for encoding delay length: population coding and rate coding, and found that both schemes were employed by a significant fraction of CA1 neurons, including two populations that demonstrated increased or decreased delay-period activity. The activity of these distinct populations reflected delay length, delay positions, and/or reward size, however manipulation of reward size resulted in these populations' having opposite responses. Finally, we were able to identify a specific population of neurons that fit the criteria of value coding. These results suggest that distinct subpopulation of neurons in the hippocampus can have unique contributions to the valuation processes that are required for delay-based decisions.

Results

Behavioral profiling

We conducted a delay-based decision-making task in mice using the T-maze, in which mice chose between right or left goal arms, with each arm containing a small reward or large reward, and with or without delay, respectively (Figure 1A). In total, we employed five behavioral conditions, with each session consisting of about 10 trials within 30 min, with a 20 s inter-trial interval at the start zone.

Figure 1 with 2 supplements see all
Task design of the delay-based decision making in the T-maze.

(A) Schematic diagram for the experimental setup. Mice can choose the right or left arms assigned to obtain the small reward without delay or the large reward with delay, respectively. (B) Flow of the extension conditions. The delay lengths were extended sequentially. Red circles indicate the number of sugar pellets. (C) Percentages of large-reward choices as a function of delay length. Error bars indicate the standard error of the means (SEM).

To examine the impact of delay on decision making, we changed the delay length sequentially. Once mice showed a preference for the large reward arm (>80%) we increased the length of delay in a stepwise fashion (e.g., 0, 5, 10, 20, and 40 s; Figure 1B; Figure 1—figure supplement 1). With the inclusion of a delay, preference for the large reward arm decreased as a function of delay length (Figure 1C). The whole schedule of experiments is shown in Figure 1—figure supplement 2.

Delay-dependent neuronal activity in CA1

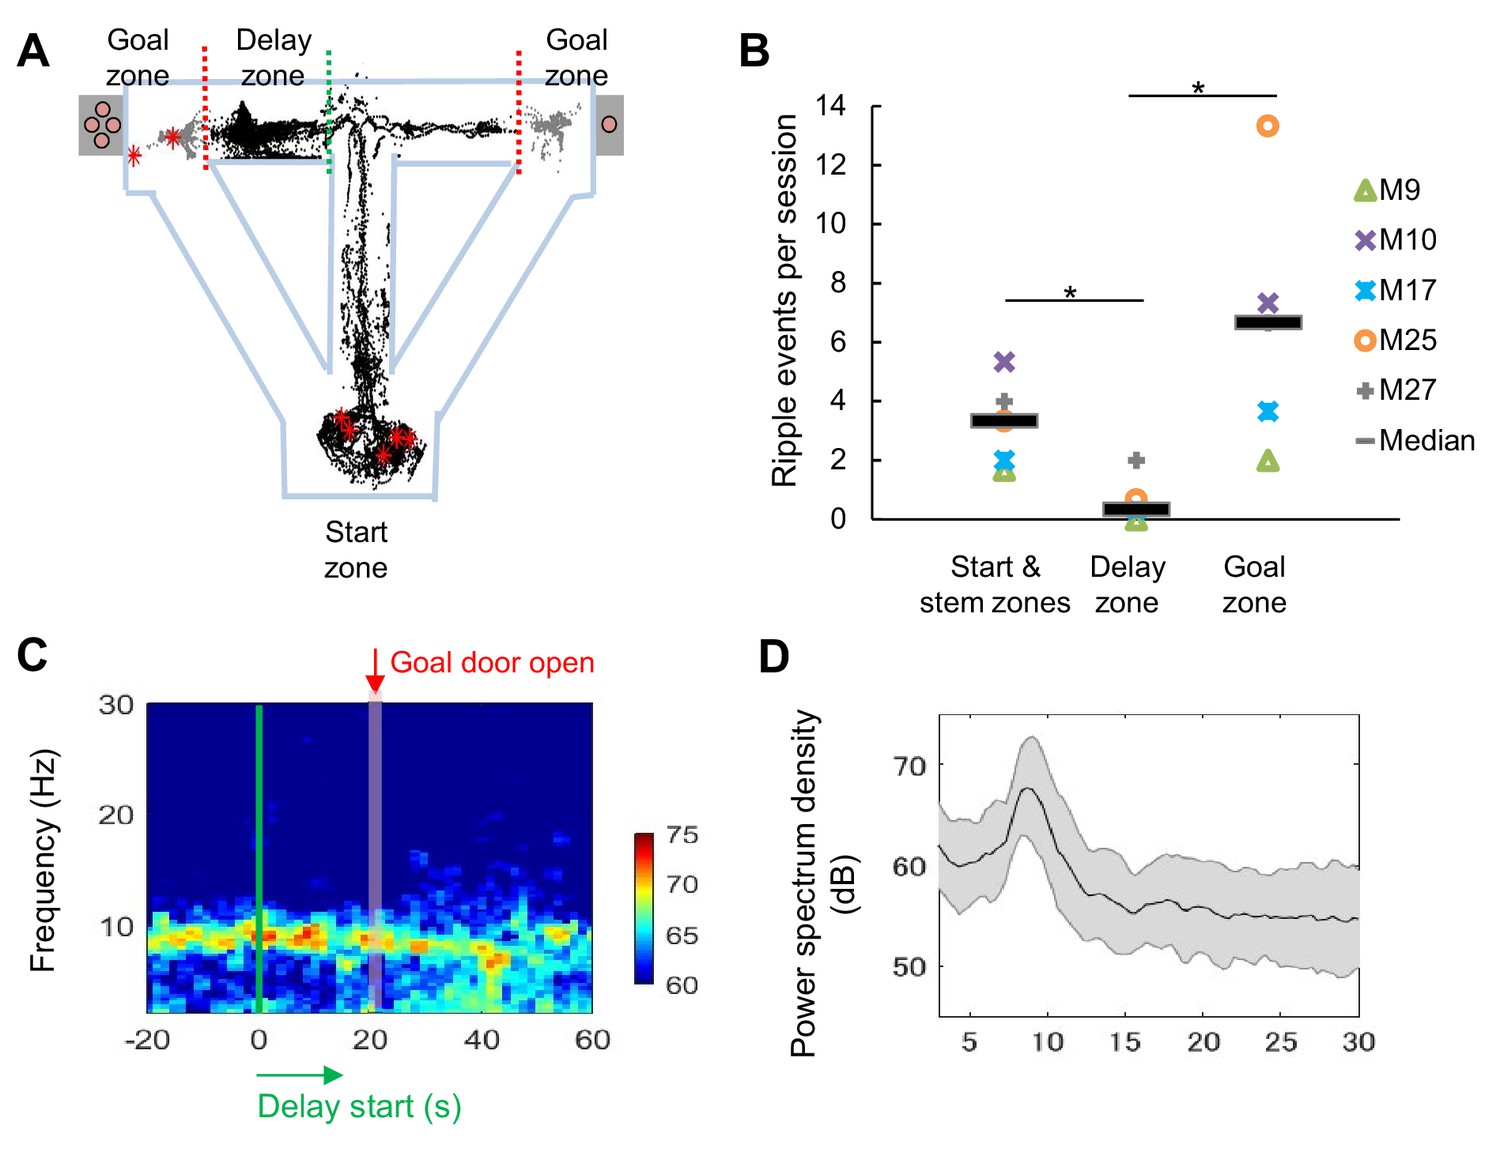
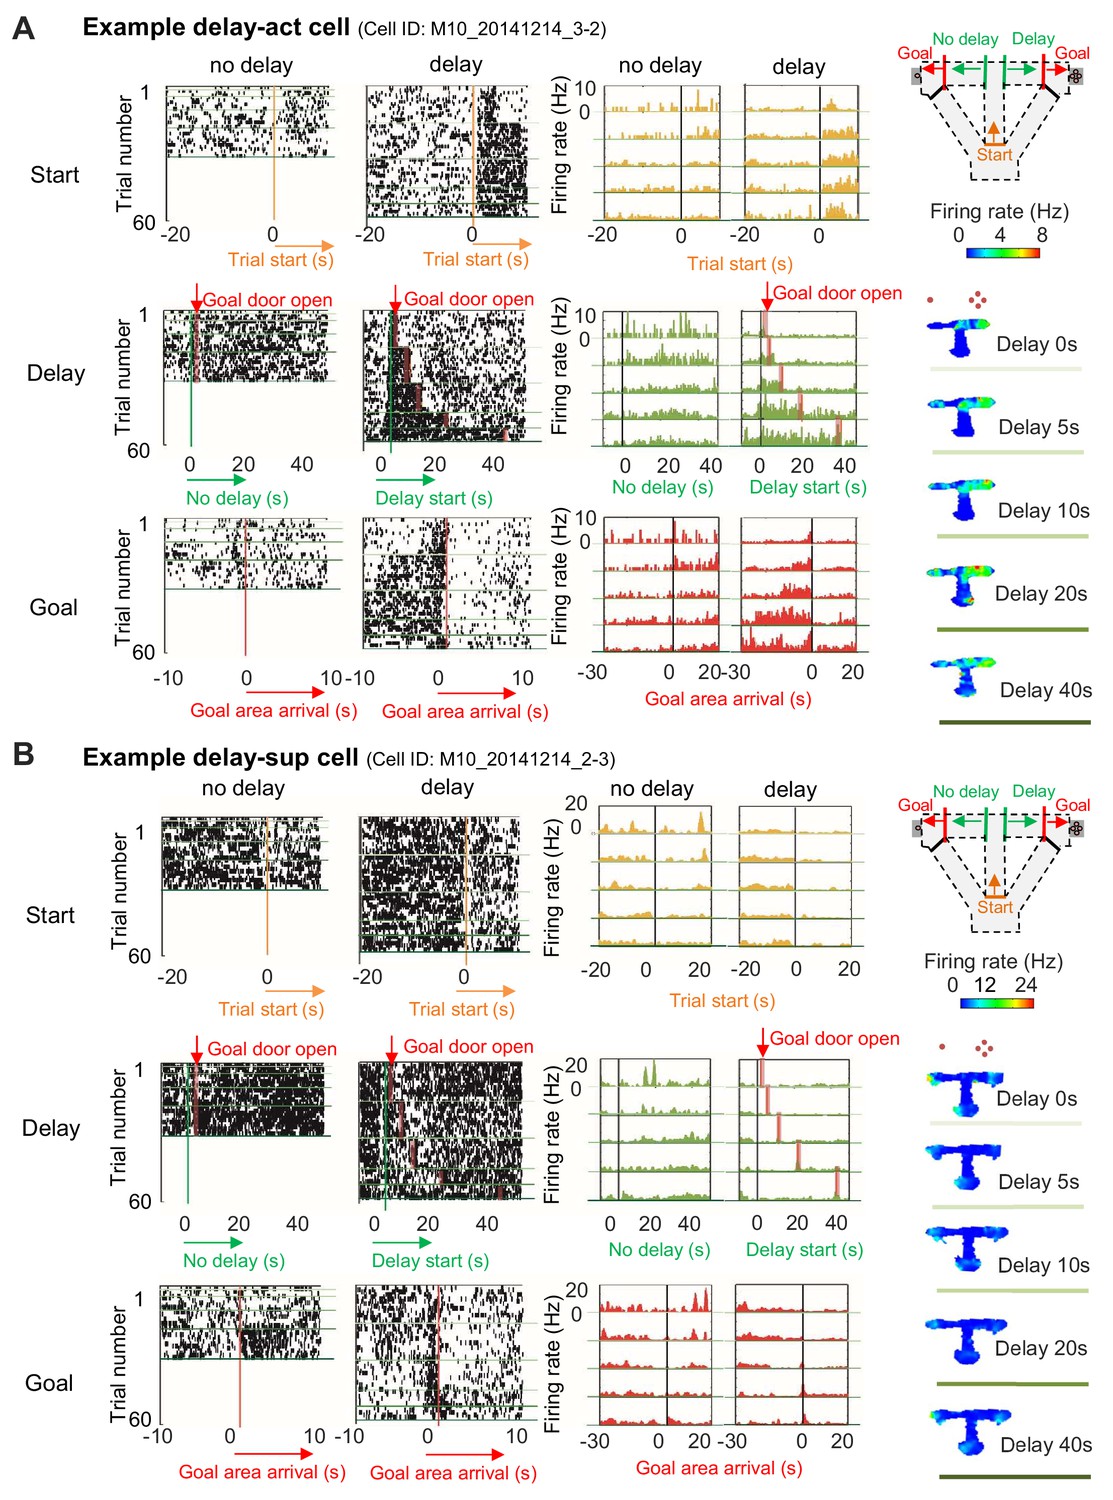
We recorded extracellular single units and local-field potentials (LFPs) from the CA1 region in a total of 28 mice (Figure 2—figure supplement 1) during delay-discount behavior, and classified cells as putative excitatory neurons or inhibitory neurons on the basis of the characteristics of their extracellular waveform (Figure 2—figure supplement 2; see 'Materials and methods'). We first analyzed LFP signals in the CA1 region during delay periods. Consistent with the active movement of the mice, sharp-wave/ripples (SWRs) were rarely observed (Z=2.19, p=0.03, for start and stem zones vs delay zone; Z=2.40, p=0.02, for delay zone vs goal zone; Mann-Whitney U Test; Figure 2A and B) and the LFP was dominated by theta-range (7–11 Hz) activity (Figure 2C and D), suggesting that the circuit remained engaged during this phase. We then examined the activity of excitatory neurons (Table 1) during specific task events, the exit from the start zone (start), the entrance/exit of the delay zone (delay), and the entrance to the goal zone (goal). In CA1, a subset of neurons exhibited delay-related activity, with firing rate rising during longer delays (>20 s) (Figure 3A), whereas a distinct subset fired only under short delay conditions, decreasing their firing rate as the delay length increased (Figure 3B).

Figure 2 with 2 supplements see all
LFP signals during the long delay were characterized by strong theta power and lack of SWRs.

(A) Sharp-wave/ripple events (SWRs) rarely occurred during the delay in the task (data from one session of delay 20 s extension conditions). Red asterisks indicate the locations of SWRs. Black and gray dots indicate the path of animal movements before (black) and after arriving at the goal (gray), respectively. (B) SWRs per session in specific experimental zones. The total number of SWRs for each zone was counted and color-coded according to individual animals (the average number of events acquired from 3 sessions of delay 20 s extension conditions). *, p<0.05, Mann-Whitney’s U-test. (C) Spectrogram of the hippocampal CA1 region during the peri-delay period (averaged from three mice, total six sessions of delay 20 s extension conditions) Green line: delay-onset; red line: estimated goal-onset. (D) Power spectrum density during 2 s at the beginning of the delay. Shaded area indicates ± SD.

Increased or decreased neuronal activity of CA1 cells during delay.

(A) An example of CA1 delay-active (delay-act) cells, which showed an increment in the firing rate as a function of delay length. Left, raster plots of the firing activity of the cells aligned with start-onset (top), delay-onset (middle) and goal-onset (bottom). Orange lines indicate start-onset. Green lines indicate delay-onset. Pale red lines indicate expected delay-offset. Red lines indicate goal-onset. Center, peristimulus time histograms (PSTHs) of the firing activity of the cells aligned with start-onset (top), delay-onset (middle) and goal-onset (bottom). Right, color-coded rate maps. The delayed arm was assigned to the right side with a large reward for this recording session. Red dots indicate the number of sugar pellets. (B) An example of CA1 delay-suppressed cells, which showed a decrement in the firing rate during delay. The delayed arm was assigned to the right side with a large reward for this recording session.

Table 1
The number of delay-active and delay-suppressed CA1 excitatory and inhibitory neurons recorded from all sessions.
Cell typeDelay-activeDelay-suppressedOtherTotal
Excitatory neurons24331383639
Inhibitory neurons4310026169

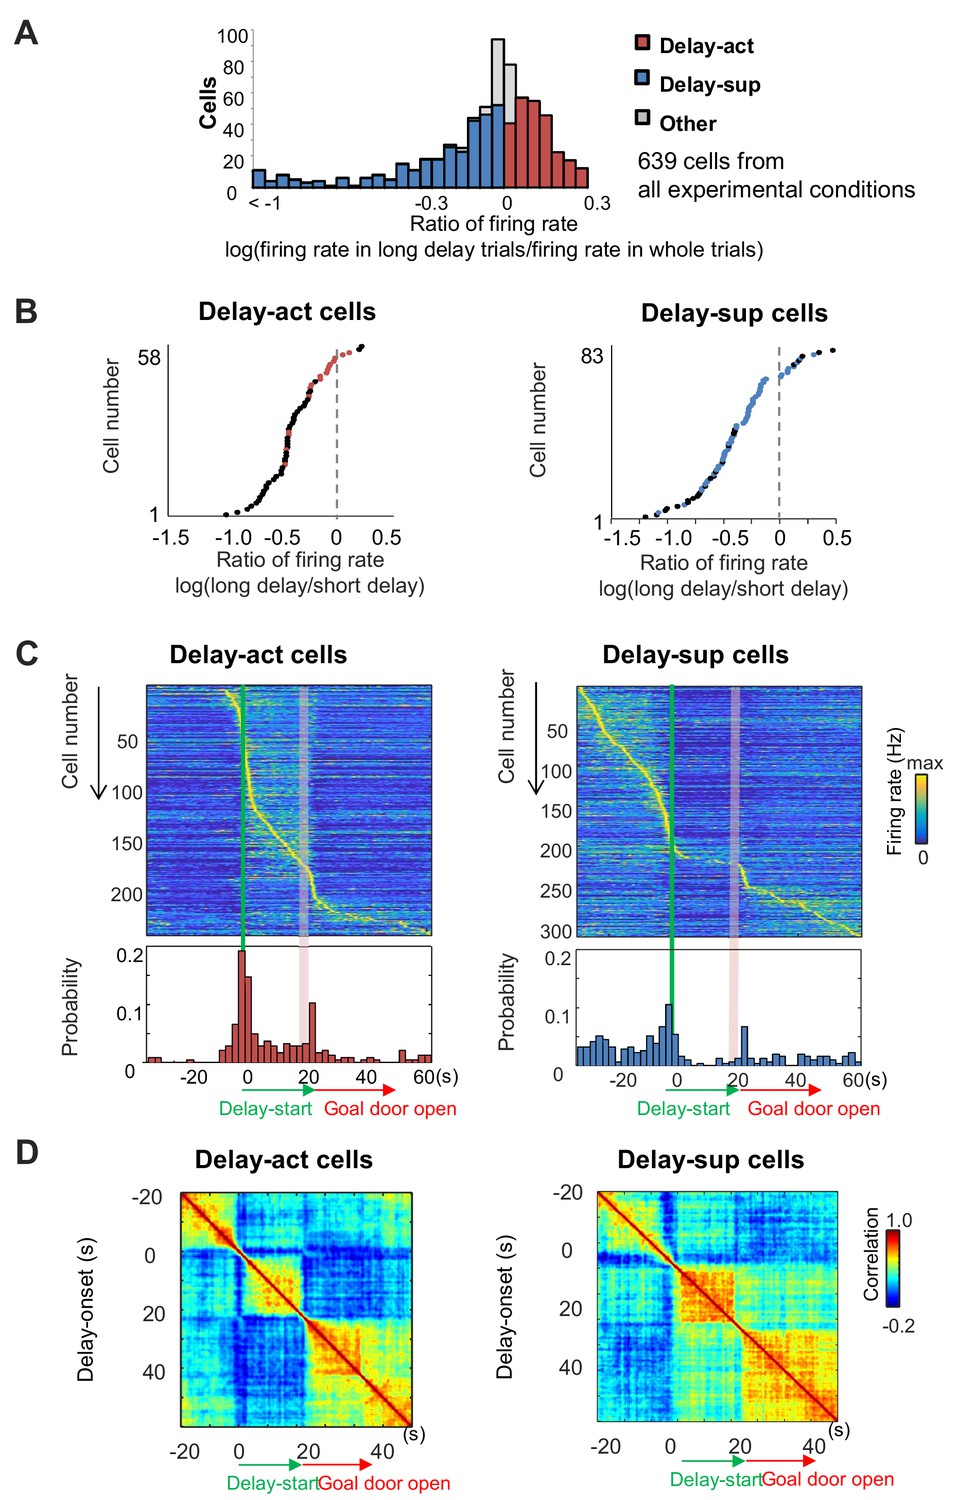
We next asked whether neurons significantly altered their firing rate during long delays compared with other phases of the task (see 'Materials and methods'). We found that across all task conditions, large numbers of neurons exhibited significant increases (CA1: 243/639 units: 38.0%) or decreases (CA1: 313/639: 48.9%) in their firing rates during the delay (Table 1). We termed these delay-active (delay-act) and delay-suppressed (delay-sup) neurons, respectively (Figure 4A). Comparison between the firing rates for short delays (5 s) and those for long delays (20–40 s) revealed that some delay-act and delay-sup cells exhibited significant elevation or reduction of firing rates for specific delay lengths (Figure 4B). At the population level, peak firing times of both CA1 delay-act and delay-sup cells were highly distributed across the time spent in the delay zone (Figure 4C). To assess the population activity of CA1 cells during the task, we examined the autocorrelation of the population vectors under long-delay conditions (Figure 4D). The population activity of both delay-act and delay-sup cells was clearly segmented into three periods — start, delay and goal — with differential patterns of sustained activity in each. Similar population codes were found in inhibitory CA1 neurons (Figure 4—figure supplement 1). We next analyzed the population codes across the individual experimental conditions. We found a uniform-like distribution only under the both-side condition (Kolmogorov–Smirnov test; Salz et al., 2016; p=0.46 for the both-side condition; p<0.05 for all other conditions; Figure 4—figure supplement 2), while the remaining three protocols found activity biased towards the early part of the delay.

Figure 4 with 2 supplements see all
Delay-dependent firing patterns of CA1 delay-active and delay-suppressed cells.

(A) The distribution of delay-active and delay-suppressed cells aligned with the ratio of firing rate in the long delay period and in whole trials. (B) The ratio of mean firing rate during long delays (20 or 40 s) to that during short delay (5 s) for all neurons (base-10 log-transformed). Each dot indicates an individual neuron. Black dots indicate neurons that had a statistically significant difference in firing rate between short and long delay conditions (p<0.001). (C) Temporal patterns of firing rates in CA1 delay-active and delay-suppressed cells during delay. Top, color-coded temporal firing patterns. Neurons were ordered by the time of their peak firing rates. Bottom, temporal distribution of the peak firing rates of the neurons. Green lines indicate delay-onset. Pale red lines indicate expected delay-offset. (D) Correlation matrix of population vectors as a function of time for CA1 delay-active and delay-suppressed cells.

When we examined the activity of neurons sequentially recorded under all possible delays, we found that lengthening the delay dynamically altered activity, with a substantial fraction of units demonstrating a significant correlation between firing rate and delay length (mean firing rate, 20/58 [34.5%], peak firing rate, 46/58 [79.3%] for delay-act; mean firing rate 31/83 [37.3%], peak firing rate, 60/83 [72.3%] for delay-sup; p=0.01, permutation test, for percentages; Table 2, Figure 5). This indicates that the hippocampus may encode delay length at the level of individual neurons. Peak firing rates may be a better indicator, as mean firing rates at different delay lengths will result in deformative normalization. Further, decoding analysis using support vector machine (SVM) confirmed that the population codes of firing pattern can also predict delay length (classification into five different delay conditions) (Figure 5—figure supplement 1; see 'Decoding of delay length from population spike activity' in 'Materials and methods'). Taken together, the hippocampus may encode delay length using dual coding schemes.

Figure 5 with 3 supplements see all
Delay-dependent firing patterns of CA1 delay-active and delay-suppressed cells.

(A) Scatter plots show correlations between firing rate during delay (upper, peak firing rate; lower, mean firing rate) and the delay length of five representative delay-act cells. Cells A and B show positive correlations in both peak and mean firing rate; on the other hand, cell C shows either. Cells D and E show negative correlations. (B) Distribution of correlation coefficients between firing rate (left, peak firing rate; right, mean firing rate) and delay length in delay-act cells. Dark color bars indicate statistically significant neurons (p<0.05), whereas bright color bars indicate neurons do not reach statistical significance. (C) Scatter plots show correlations between firing rate during delay (upper, peak firing rate; lower, mean firing rate) and delay length for five representative delay-suppressed cells. (D) Distribution of correlation coefficients between firing rate (left, peak firing rate; right, mean firing rate) and delay length in delay-suppressed cells. Dark color bars indicate statistically significant neurons (p<0.05), whereas bright color bars indicate that neurons do not reach statistical significance.

Table 2
Full distribution of CA1 excitatory neurons for all of the tested conditions.
Test conditionsDelay responsivenessNeuron number
ExtensionDelay-active58
Delay-suppressed83
Other36
Switched or both-sideDelay-active155
Delay-suppressed191
Other34
Reward loss or gainDelay-active30
Delay-suppressed39
Other13

Given the learning-dependent development of hippocampal firing during delay period (Gill et al., 2011), we also examined the time shift of firing by delay changes. At the beginning of the daily recording session, about 10% (4/33) of delay-act cells initially fired after the animal reached the goal in the 0 s delay condition, then shifted their firing to the delay period once a delay was introduced (Figure 5—figure supplement 2). Interestingly, subsequent elimination of the delay did not result in return to goal-related activity (Figure 5—figure supplement 2A). When we compared the firing of CA1 delay-act cells under identical short delay trials occurring before and after long-delay trial blocks (Figure 5—figure supplement 2B), we found about 10% of neurons shifted positively or negatively (Figure 5—figure supplement 2C), indicating that the onset of firing in the CA1 neurons was influenced by the experience of waiting and/or learning of the delay.

Place-specific delay information is encoded in the majority of CA1 neurons

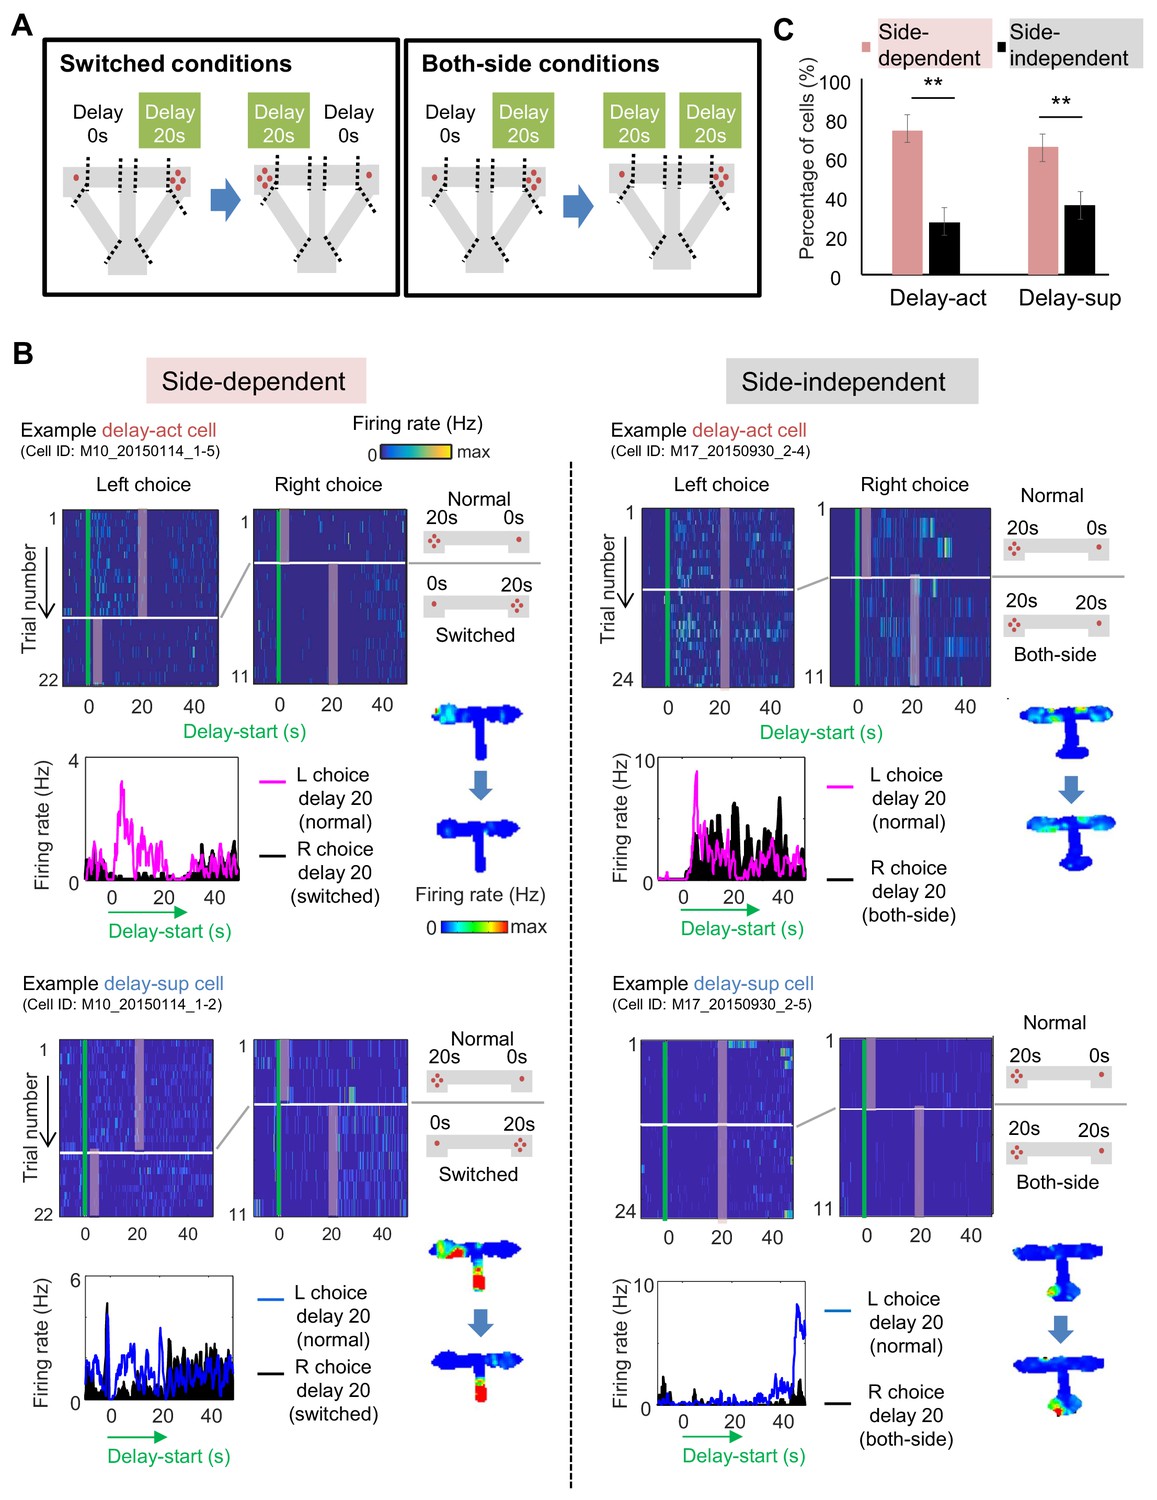
Given the robust place code present in the hippocampus, we next asked whether CA1 delay-act neurons were spatially selective. To this end, we switched the location of the delay and no-delay arms (switched conditions) or replicated the delay on the other side (both-side conditions) (Figure 6A, Figure 6—figure supplement 1), with corresponding changes in reward size. Under both conditions, the mice changed their behavior within several trials, with the preference for the large reward arm reaching about 70%. We then evaluated side-selectivity of the delay activity, adding location as a variable under three-way ANOVA (side, delay-length, and timing; see 'Materials and methods') during switched and both-side trials (Figure 6A). Representative side-selective and -unselective excitatory neurons in the CA1 are shown in Figure 6B. The percentage of side-selective neurons was high in both CA1 delay-act (114/155: 73.5%) and delay-sup(124/191: 64.9%) neurons (Figure 6C and Tables 2 and 3), however more than a quarter of the neurons of both groups encoded delay independent of location.

Figure 6 with 1 supplement see all
Spatial-selective delay coding in CA neurons.

(A) Experimental conditions to investigate the location selectivity in delay-active neurons. The location of the delay zone was switched to the other side (switched conditions) or doubled to both sides (both-side conditions). (B) Example CA1 delay-active and delay-suppressed cells. Side-dependent and side-independent neurons are shown as left and right rows, respectively. Top left, colored raster plots expressing relative firing rates. Green lines indicate delay-onset. Pale red lines indicate expected delay-offset. Top right, information of conditions corresponded to the raster plots on the left. Red dots indicate the number of sugar pellets. Bottom left, Peri-event time histograms showing the averaged firing rates. Magenta lines indicate the firing rate of the left choice with a 20 s delay. Black-filled histograms indicate the firing rate of the right choice with a 20 s delay. Bottom right, color-coded rate maps for the two conditions (normal delay and switch or both-side conditions). (C) Percentage of place-dependent and -independent CA1 delay-active and delay-suppressed neurons. Error bars indicate 95% Clopper-Pearson’s confidence intervals. **: p<0.01, Mann-Whitney’s U-test.

Table 3
Distribution of side-dependent and side-independent, delay-active and delay-suppressed, CA1 excitatory and inhibitory neurons.
Delay responsibilitySide-dependencyCell typesN%
Delay-activeSide-dependentExcitatory neuron11473.5
Inhibitory neuron1260.0
Side-independentExcitatory neuron4126.5
Inhibitory neuron840.0
Delay-suppressedSide-dependentExcitatory neuron12464.9
Inhibitory neuron4571.4
Side-independentExcitatory neuron6735.1
Inhibitory neuron1828.6

Value-coding in CA1 neurons

We next asked how subjective value influenced the activity of the delay-act and delay-sup neurons in CA1. As mentioned above, delay and reward are common factors that modulate subjective value. To examine whether the changes of delay period firing patterns in delay increment were correlated with changes in reward size, we first lengthened the delay length and subsequently decreased the reward for the delayed option (reward loss conditions) and followed this by restoration of reward. In addition, we manipulated the reward size in the opposite direction to avoid order-dependent confounds arising from decreased hunger or motivation of the animals in later trials (reward gain conditions; Figure 7A, Figure 7—figure supplement 1). The majority of delay-act cells decreased their firing rate in response to reward loss, whereas delay-sup neurons had the opposite response, increasing their activity (Figure 7B and C). As a result, the log ratio of the firing rates (large reward/small reward) under both reward loss and gain conditions was significantly different between delay-act and delay-sup cells (Z = −2.6, p=0.007 for reward loss; Z = 2.1, p=0.03 for reward gain, Mann-Whitney’s U-test). In total, the ratio was negatively skewed in the delay-act cells (T = −2.5, p=0.01, one-sample t-test) but positively skewed in delay-sup cells (T = 2.7, p=0.01, one-sample t-test, Figure 7D). These results suggest that firing during the delay independently reflected positive and negative outcomes in these different subpopulations of CA1 neurons. Finally, we examined the relation between firing rate changes ‘by delay extension’ and ‘by reward manipulations’ to explore whether value, a more general concept of information, may be neutrally encoded. In both delay-act and delay-sup cells, there was no global trend, but a subset of neurons, plotted around the line of ‘delay effect = reward effect’ (Figure 7E), can be interpreted as value-coding neurons.

Figure 7 with 2 supplements see all
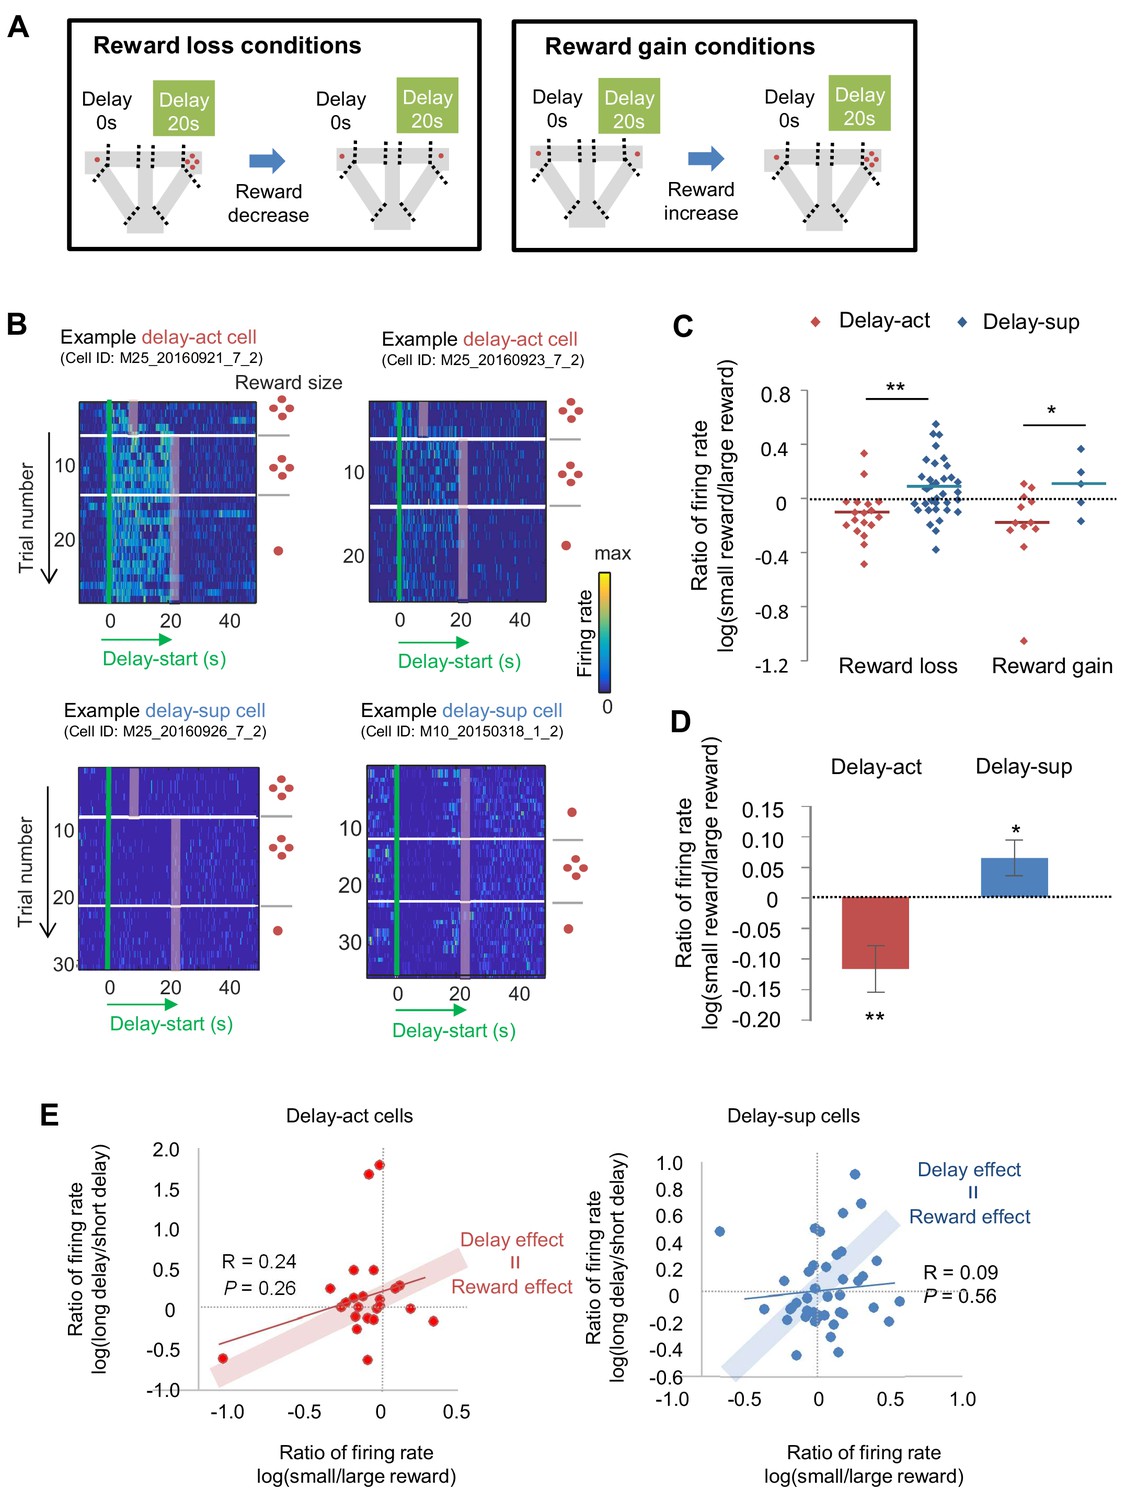
The firing of CA1 delay-active and delay-suppressed cells is distinctly changed by reward size manipulations.

(A) Left, experimental reward loss conditions: the reward size was changed from 4 to 1 (or 0) pellets. Right, experimental reward gain conditions: the reward size was changed from 1 (or 0) to 4 pellets. (B) Example CA1 delay-active (top) and delay-suppressed cells (bottom) fired during delay in reward loss conditions. Green lines indicate delay-onset. Red lines indicate expected delay-offset. Red dots indicate the number of sugar pellets. (C) Ratio of firing rates of delay-active and -suppressed cells in reward loss and gain conditions. Dots indicate individual data for delay-active cells (red) and delay-suppressed cells (blue). Central bars indicate the medians. *, p<0.05; **, p<0.01, Mann-Whitney’s U-test. (D) Ratio of firing rates of delay-active and -suppressed cells in mixed population. Error bars indicate SEM. *, p<0.05; **, p<0.01, One-sample t-test. (E) Scatter plots of firing rate ratios between small/large reward conditions and between long delay/short delay conditions. The computed correlation coefficient R and p value are indicated.

We next focused on the relationship between the behavioral shift during reward loss sessions and the firing patterns of delay-act cells. If CA1 activity is dependent on the animals’ choice preference, the activity should be dynamically changed after the elimination of preference. However, across the session, animals avoided the delayed option, making it difficult to observe CA1 activity under this condition. To eliminate the preference for the delayed options, we designed an ‘unequal conditions’ (long delay + no pellet vs long delay + four pellets, with the latter being the better option). Animals then quickly reduced their preference to the delayed option with no reward. To record the activity for the less-preferred or adverse choice, we forced mice to choose the less-preferred option with an obstacle set at the entrance of the opposite arm. When faced with an unrewarded delayed option, CA1 neurons indicating choice preference were silent (Figure 7—figure supplement 2). These results suggest that the firing of delay-act neurons in the CA1 region represents the animal’s subjective value of the chosen options.

NMDAR deficiency in hippocampus disrupted delay-discounting and populational delay coding in CA1

Finally, we took advantage of a mutant mouse, the CaMK2-Cre; NR1-flox/flox mouse, which lacks CA1 pyramidal cell N-methyl-D-aspartate (NMDA) receptors (NMDARs) (CA1-NR1cKO mouse; McHugh et al., 1996; Tsien et al., 1996a), RRID:MGI:3581524), to assess the role of synaptic plasticity in task performance. Consistent with previous reports of hippocampus-dependent learning deficits in these mice (Bannerman et al., 2012; Rondi-Reig et al., 2001; Tsien et al., 1996b), they exhibited impaired delay discounting (Figure 8A), demonstrating a significant bias for the larger reward even when the delay was extended (F1 = 14.4, p<0.001, genotype (CA1-NR1cKO vs NR1 f/f); F4 = 23.0, p<0.001, interaction between delay length x genotype, F1,4 = 1.07, p=0.37, two-way ANOVA, p=0.61 on delay 0 s, p=0.04 on delay 5 s, p=0.04 on delay 10 s, p=0.002 on delay 20 s, p=0.005 on delay 40 s, multiple comparisons on each delay length).

Figure 8 with 1 supplement see all
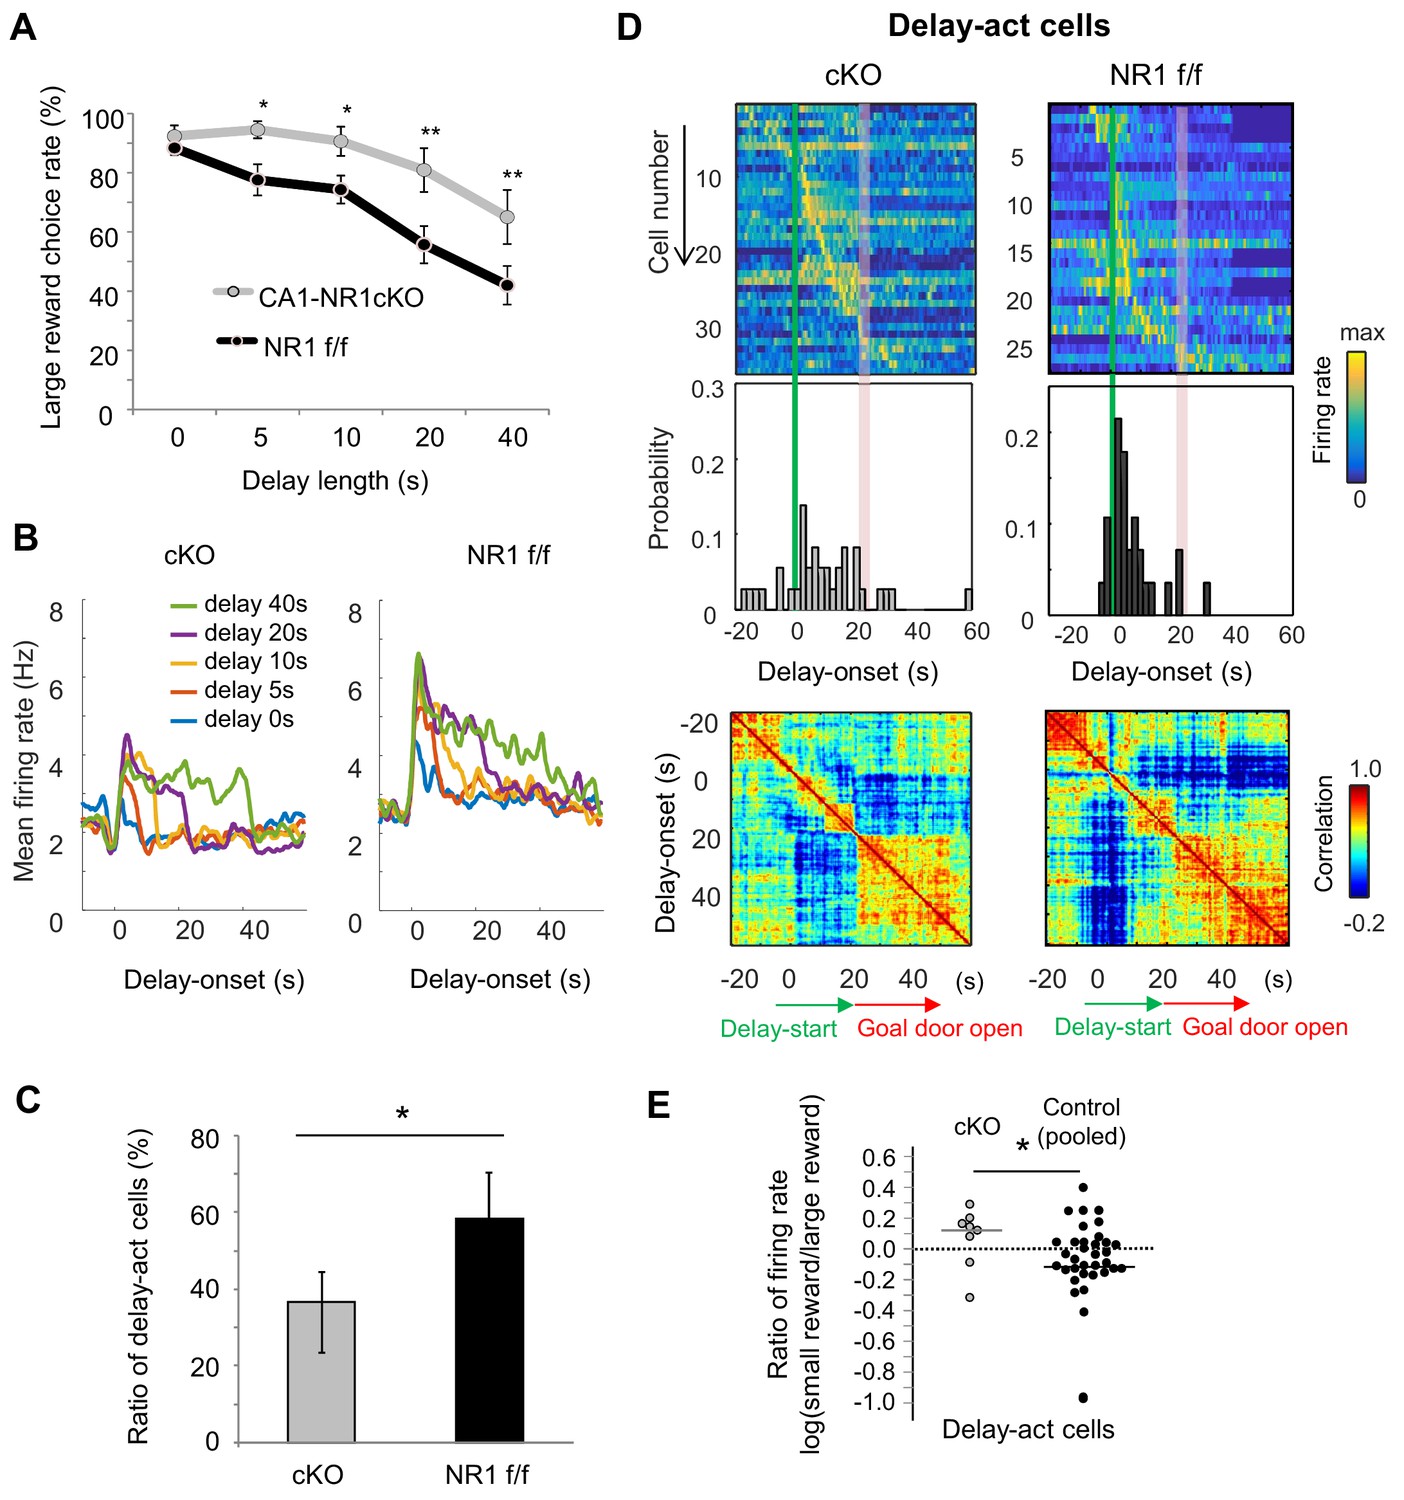
NMDAR-dependent mechanism for delay-discounting.

(A) Impaired delay-discounting in CA1-NR1 cKO mice. *, p<0.05; **, p<0.01; post-hoc Scheffe’s test. Error bars indicate SEM. (B) NMDAR deficiency disrupted the delay tuning in the CA1 activity. Average firing patterns of the CA1 delay-active cells from cKO and control mice for different delay lengths (0, 5, 10, 20, and 40 s). (C) Abnormal delay-active and –suppressed cell proportion in cKO mice. Ratio of delay-act cells to delay-sup cells for cKO and control mice. Error bars indicate 95% Clopper-Pearson’s confidence intervals. *, p<0.05; Mann–Whitney’s U test. (D) NMDAR deficiency disrupted the populational activity in CA1. Top, color-coded temporal firing patterns of the CA1 delay-active cells in cKO and control mice. Neurons were ordered by the time of their peak firing rates. Middle, temporal distribution of neurons. Green lines indicate delay-onset. Red lines indicate expected delay-offset. Bottom, correlation matrix of population vectors as a function of time for CA1 delay-act cells in cKO and control mice. (E) NMDAR deficiency disrupted the negative skew in the firing rate ratio of delay-active cells. Ratio of firing rates of delay-active cells in CA1 of cKO and WT mice. Dots indicate individual data for cKO (gray) and control (black) mice. The central bar indicates the median. *, p<0.05; Mann–Whitney’ U test.

We next recorded CA1 neuronal activity in cKO (n = 3, 123 units) and control mice (n = 4, 69 units, Table 4 and Table 5) to look for physiological correlates of the behavioral change. Delay-act cells in the cKO mice showed non-specific activation during the delay period (Figure 8B and Figure 8—figure supplement 1A). Hence, there was a lower and higher proportion of delay-act and delay-sup neurons, respectively, in the cKO and the ratio of delay-act/delay-sup was significantly lower in the cKO than in the control mice (Figure 8C, p=0.02, Fisher’s Exact Test, Figure 8—figure supplement 1B). Further, in contrast to the controls, the temporal distribution of all delay-act cells in the cKO was sparse and not specific to delay-onset. As a result, population vector analysis revealed that the activity was not segmented into three periods in the cKO mice (Figure 8D). In addition, the ratio of CA1 firing of cKO was significantly different than that observed in control mice and lacked the expected negatively skewed distribution (Z = 2.0, p=0.04, Mann-Whitney’s U-Test, Figure 8E). We could not detect significant difference among the genotypes in basic firing property during the task (mean firing rate, cKO — 3.07 Hz, control — 3.39 Hz, Z = −0.76, p=0.44, Mann-Whitney’s U-test). Subpopulation firing rates were also not significantly different (delay-act, cKO — 2.66 Hz, control — 3.13 Hz, Z = −0.91, p=0.35; delay-sup, cKO — 3.47 Hz, control — 3.47 Hz, Z = −0.68, p=0.14, Mann-Whitney’s U-test). These findings suggest that delay discount behavior and the underlying delay-related activity in CA1 pyramidal cells requires NMDAR-dependent mechanisms in the hippocampus.

Table 4
Full distribution of CA1 excitatory neurons for the NMDAR mutant study.

The numbers in parentheses are cells from the wildtype.

Test conditionsDelay responsivenessNeurons
cKOControl
ExtensionDelay-active2825
Delay-suppressed5620
Other2219
Reward loss and gainDelay-active833 (30)
Delay-suppressed60
Other32
Table 5
Ages of CA1-NMDAR cKO mutant and control mice used for the electrophysiological study.
GenotypeAnimal IDAge at surgeryAge at experiments ended
CA1-NR1 cKO
(CaMK2-Cre; NR1-flox/flox)
M182 months3 months
M283 months3 months
M303 months4 months
Control
(NR1-flox/flox)
M245 months5 months
M263 months4 months
M293 months4 months
M314 month5 months

Discussion

We recorded CA1 neuronal activity in mice during delay-based decision making in an automated T-maze task while independently manipulating delay length and reward size across sessions. We observed distinct populations of neurons that increased or decreased their firing during the delay. Moreover, the firing rates of a subset of the delay-activated CA1 neurons decreased with both delay length increments and reward size declines. Notably, the activated and suppressed neurons showed distinct activity changes following reward size manipulations. These results suggest that dissociable subpopulations of hippocampal neurons represent delay and reward information in opposing ways. These discoveries should help shape models of how the hippocampus supports decision making.

Although the delay-modulated activity was diverse across CA1 neurons, their responsiveness to delay was precisely controlled. A significant fraction of CA1 neurons reflected delay length in their firing rate, suggesting the encoding of delay length in the hippocampus on a single-cell level. Related to this, positive and negative correlations with delay length were observed in both delay-act and delay-sup cells. Currently, it is not clear what roles delay-act or delay-sup cells or those neurons with positive or negative correlation play in the animal’s decision. In a delay-discounting task, delay may be encoded in two different ways: by a discounting factor and by a factor predicting a larger reward. Future work should investigate whether the two directions of correlation are related to the discounting or prediction.

At the population level, the peak firing rates of delay-act and delay-sup cells were distributed largely around the delay-onset. As a result, population vector analysis demonstrated segmented and sustained network activity during the delay in the CA1 region, suggesting a role in prospective coding of specific periodic events centered on the delay. The decoding analysis demonstrated that particularly during short delay blocks, delay length could be decoded with population activity even prior to the delay initiation. This may reflect the animal's experience with the task and expectation of an impending reward. In addition, in the specific circumstance where a fixed delay was constantly presented, the population coding of delay may be more precise.

A significant fraction of both the delay-act and the delay-sup neurons that we recorded also carried spatially tuned delayed information. Thus, the activity of most delay-act and delay-sup cells in dorsal CA1 does not appear to represent solely delay information, but rather, may represent integrated information of the chosen option, reflecting both location and delay. This result is consistent with the idea that hippocampal cells are coding not only within the space and time dimensions individually, but rather across them jointly (Eichenbaum, 2014; Howard and Eichenbaum, 2015; MacDonald et al., 2011).

Changing reward size modulated the firing rates of both the delay-act and the delay-sup cells in CA1. It is widely known that the activity of CA1 neurons can depend on reward (Ambrose et al., 2016; Hölscher et al., 2003; Singer and Frank, 2009). Studies focusing on goal-directed behavior have demonstrated that some CA1 neurons fire when animals approach, wait for, or acquire rewards, but not when animals visit the same location in the absence of the reward (Eichenbaum et al., 1987; Fyhn et al., 2002; Hok et al., 2007; Kobayashi et al., 2003; Rolls and Xiang, 2005), indicating that a certain subset of CA1 neurons are highly sensitive to reward expectation or motivation. However, in monkeys, omission of a reward activated some CA1 neurons (Watanabe and Niki, 1985). This is consistent with our results demonstrating that during the delay, dissociable subsets of CA1 neurons were positively or negatively correlated with reward size. The scatter plot of the firing rate ratio of small/large reward conditions and long/short delay conditions (Figure 7E) shows that there are no global trends, suggesting that the CA1 neurons exhibit independent relationship between delay and reward manipulation responses. We found, however, that a fraction of neurons reacted in the same way to delay and reward manipulation, suggesting that there may be value-coding neurons in the CA1. Further study will be required to isolate specific neurons encoding subjective value, focusing on specific pathways or cell types. Accordingly, a distinct subpopulation of CA1 neurons may encode the delay-reward integration and may support the valuation process in delay-based decision making.

The phenotype of ‘lowered delay discounting’ caused by a loss of the NMDAR may also be interpreted as an abnormal repetition of an unpleasant choice, referred to as ‘compulsive behavior’. Systemic injection of the partial NMDAR agonist D-cycloserine reduces compulsive lever-pressing in a model of obsessive-compulsive disorder (OCD) in rats (Albelda et al., 2010). In addition, polymorphisms in a subunit of NMDAR have been considered as a risk factor in OCD (Arnold et al., 2004). The present study suggests that the hippocampal NMDARs are required for delay discounting and provides additional evidence that hippocampal NMDARs may be associated with compulsive disorders. It is widely believed that synaptic plasticity via NMDAR-dependent machinery contributes to association learning and that, in the hippocampus, this contributes to the formation of long-term, spatial memories (Martin et al., 2000). Studies using several lines of conditional knockout mice have pointed out that NMDAR in the hippocampus is involved in spatial learning (Tsien et al., 1996a), nonspatial learning (Huerta et al., 2000; Rondi-Reig et al., 2001), anxiety (Bannerman et al., 2004; Kjelstrup et al., 2002; McHugh et al., 2004; Richmond et al., 1999), time perception (Huerta et al., 2000), and decision making (Bannerman et al., 2012). In addition, physiological studies have demonstrated that a hippocampus that lacks NMDAR exhibits less specific spatial representation in place cells (McHugh et al., 1996). We found that NMDAR deficiency disrupted the proportion of delay-act and delay-sup cells, and population coding for the delay. These findings suggest that the NMDAR in the hippocampus may be required to maintain or develop time-coding. It should be noted that the NR1 knockout may be extended to other telencephalic regions (CA3, dentate gyrus, deep cortical layers) in the cKO animals in the present study. Further research is required in order to identify more specific mechanistic roles of the hippocampal NMDAR in delay-based decision making. In addition, in contrast to previous studies showing that rats with hippocampal lesions exhibit higher discount rates (Cheung and Cardinal, 2005; Mariano et al., 2009; McHugh et al., 2008), the NMDA KO mice demonstrated the opposite phenotype. Thus, there may be considerable differences between the effect of the lesions and that of NMDAR knockout in the hippocampus on the full network engaged during delay-based decision making.

In conclusion, our results show that CA1 neuronal activity during delay is segregated into two populations, delay active and delay suppressed neurons. Further, these groups demonstrate opposing responses to changes in motivational background. In addition, NMDAR-dependent plasticity mechanisms appear to be required for the formation of the firing patterns during delay and for the delay-discounting. These findings further clarify the role of the hippocampus in decision making, as well as in the control of impulsive or compulsive behaviors.

Materials and methods

Key resources table
Reagent type
(species) or resource
DesignationSource or referenceIdentifiersAdditional
information
Strain, strain background (Mus musculus)C57BL/6JRIKEN Bio Resource CenterRRID: IMSR_JAX:000664Wild-type mouse
Strain, strain background (Mus musculus)NR1floxPMID: 8980237005246 (Jackson Laboratory)Targeted mutation line
Strain, strain background (Mus musculus)Tg(Camk2a-cre)T29-1Stl/JPMID: 8980237005359 (Jackson Laboratory)Cre transgenic line
Strain, strain
background (Mus musculus)
Tg(Camk2a-cre)T29-1Stl/J, NR1flox/floxPMID: 8980237RRID: MGI:3581524Conditional knockout line
Commercial assay or kitT-mazeO’hara and Co., Ltd.RRID: SCR_018016Automatic operant test
OtherNeural probesNeuroNexusA4 × 2-tet-5mm-150-200-31232-ch electrode
OthernDriveNeuroNexusRRID: SCR_018019Micro driver to control movement of electrode
OtherAmplipex: KJE-1001AmplipexRRID: SCR_018017Recording system for neural signals
Software, algorithmMATLAB_R2018aMathworksRRID: SCR_001622
Software, algorithmKlustersPMID: 16580733RRID:SCR_015533
Software, algorithmNDmanagerPMID: 16580733RRID:SCR_015533
Software, algorithmNeuroscopePMID: 16580733RRID:SCR_015533
Software, algorithmKlustaKwik2PMID: 25149694RRID:SCR_014480
Sequence-based reagentCre_FPMID: 28244984PCR primersACC TGA TGG ACA TGT TCA GGG ATC G
Sequenced-based reagentCre_RPMID: 28244984PCR primersTCC GGT TAT TCA ACT TGC ACC ATG C
Sequenced-based reagentNR1flox-FPMID: 28244984PCR primersTGT GCT GGG TGT GAG GGT TG
Sequenced-based reagentNR1flox-RPMID: 28244984PCR primersGTG AGC TGC ACT TCC AGA AG
OtherDAPI stainThermoFisherThermo Fisher Scientific Cat# D1306(1 µg/mL)
OtherDiI stainThermoFisherThermo Fisher Scientific Cat# D3911(200 µg/mL)

Animals

All procedures were approved by the RIKEN Animal Care and Use Committee. A total of 29 male C57B6/J mice were used for this study (wildtype, n = 5; cKO, n = 11 (8 for behavioral study); control: n = 13 (9 for behavioral study]). Mice lacking NMDAR in the hippocampus (RRID:MGI:3581524) were generated by crossing the line gene-targeted for loxP-tagged Nr1 (Grin1) alleles (Nr1flox; Tsien et al., 1996a) and a transgenic line carrying Camk2a promoter-driven Cre recombinase (Camk2a-Cre, T29-1Stl; Tsien et al., 1996a). In this mutant, deletion of NR1 is delayed until about 4 weeks after birth and is restricted to the CA1 pyramidal cells until about 2 months of age (Fukaya et al., 2003). Most of the behavioral analysis using the mutant was done until this age. Hence, it is unlikely that the behavioral impairment observed was the result of undetected developmental abnormalities. Physiological characterization, however, may have harbored a more widespread deletion of the NR1 gene as the ages of cKO animals in the recording session were slightly more than 2 months old (Table 5).

Delay-based decision-making task

Request a detailed protocol

Adult mice were trained in a delay-based decision-making task under an automated T-maze (O’HARA and Co., Tokyo, Japan, RRID:SCR_018016) before electrophysiological recording. The maze was partitioned off into six areas (Start, Junction, Right-Goal, Right-Back, Left-Goal, and Left-Back) by seven sliding doors (S-J, J-R, R-RG, RG-S, J-L, L-LG, and LG-S). The detailed protocol has been described previously (Kobayashi et al., 2013; Zhang et al., 2018). In short, the mice had food restriction to approximately 80% of free-feeding weight, were habituated to the maze, and baited with scattered pellets (30 min/day) for 2 days. The large reward arm and the small reward arm were allocated to the right or left side arm randomly for each mouse. Four pellets were available in the large reward arm, whereas only one pellet was available in the small reward arm. Mice were allowed to roam freely and without delay to select either arm for 5–10 days for the initial training period until they preferred the large arm (>80%). Then, all animals were trained in the extension delay conditions for at least 5 days. For the first block of trials for each day, the large reward arm was associated without delay (0 s), and then, during the later blocks, it was associated with a 5 s, 10 s, 20 s, or 40 s delay. In the meantime, the small reward arm was always associated with no delay. Each block consisted of 10 trials or more (15 or 30 min). If the trial number was lower than 10, additional blocks were employed. Next, the mice, except cKO and control, were trained in the switched and both-side conditions. In the switched condition, the side of the delayed-large arm was switched to the other side. In the both-side condition, both sides were set as delayed-small and delayed–large arms. The switched conditions were performed initially and then under both-side conditions. In changing the conditions, 10 or more trials were continuously performed to develop a sustained reaction from the animals. Finally, the mice were trained in the Reward loss and gain conditions. We decreased the reward size to investigate whether the firing rate reflected a positive or negative aspect in the delayed option. Initially, we set a delay for a short time with the normal large reward, and then we changed the delay to be long without any change in the large reward, similar to other conditions. After these two continuous sessions, we changed the reward size from four to one pellet. As for other control conditions, we also performed the opposite flow (long delay with one pellet first, long delay with four pellets next). For all experiments, during the time between blocks, mice were allowed to drink water. Four to six consecutive daily sessions were performed per week.

Histological identification of the localization of the recorded sites

Request a detailed protocol

Owing to the small thickness of the silicon probe shanks, the tracks of shanks were hard to detect. Painting at the back of the shanks with DiI (Thermo Fisher Scientific Cat# D3911) and/or the creation of an electrical lesion by a small current (5 mA for 5 s) was used to facilitate track identifications under DAPI staining (Thermo Fisher Scientific Cat# D1306) (Figure 2—figure supplement 1).

Recording and spike sorting

Request a detailed protocol

Mice were anesthetized with isoflurane during surgery. Silicon probes or wire tetrodes were implanted in the hippocampal CA1 region (AP = −2.0 to −2.8 mm, ML = 1.2 to 2.0 mm, DV = 1.2 to 1.5 mm). In all experiments, ground and reference screws were fixed in the skull atop the cerebellum. The silicon probes attached to micromanipulators (nDrive, NeuroNexus, Michigan, USA), or to nichrome wire tetrodes combined with a micro-drive (Middleton and McHugh, 2016), which enabled us to move their positions to the desired depth, were implanted into the mice. Electrophysiological signals were acquired continuously at 20 kHz on a multi-channel recording system (KJE-1001, Ampliplex Ltd, Szeged, Hungary, RRID:SCR_018017). The wide-band signal was down-sampled to 1.25 kHz and used as the LFP signal. We detected SWRs (their timing, power, and durations) from filtered signal (120–230 Hz), which corresponded to more than three SD of log-power in the same frequency band. To trace the temporal positions of the animals, two color LEDs were set on the headstage and were recorded using a digital video camera at 30 frames/s. Spikes were extracted from the high-pass filtered signals (median filter, cut-off frequency: 800 Hz). Spike sorting was performed semi-automatically, using KlustaKwik2 (RRID:SCR_014480, https://github.com/kwikteam/klustakwik2/; Kadir et al., 2014). The cell types of the units were classified by peak-trough latency and width. In total, we analyzed 831 putative excitatory neurons (n = 639 for wildtype; n = 123 for cKO; n = 69 for NR1f/f mice; Table 1 and S4) and 250 inhibitory neurons (n = 169 for wildtype; n = 53 for cKO; n = 28 for NR1f/f mice). The positions of the animals were determined by the position of the LEDs mounted on the headstage. The rate maps of the spike number and occupancy probability were generated from 4 cm binned segments from the position and spiking data. The normalized PSTH for individual neurons in delay-act and delay–sup cells in the CA1 was computed under delay 20 s conditions. The autocorrelation of the population vector was then computed.

Determination of delay-active and delay-suppressed neurons

Request a detailed protocol

To examine the effect of delay on neuronal activities, we quantified changes in the firing rate of each neuron during the long delay period. First, we calculated the firing rate in the delay zone (Rdelay = spike number in delay zone ndelay/time spent in delay zone tdelay; see Figure 1A), and that in all zones (Rtotal = spike number in all zones ntotal/time spent in all zones ttotal) in long-delay trials, and then computed the ratio of them (Rdelay/Rtotal). Second, we performed a permutation test in order to determine whether the ratio of the firing rates Rdelay/Rtotal shows significant change or not. To make surrogate data, we resampled the spike trains by permuting the inter-spike-intervals and by realigning with them. We repeated this process 1000 times to obtain 1000 resampled datasets. The rank of the original firing rate ratio Rdelay/Rtotal in the resampled 1000 firing rate ratios was used to define the statistical assessment (delay-act cells — significant higher firing rate [rank <50, top 5%]; delay-sup cells — significant lower firing rate [rank >950, bottom 5%]).

Decoding of delay length from population spike activity

Request a detailed protocol

To quantify the information of delay length reflected in the population spike activity, we performed decoding analysis. We used the fitcecoc.m function from MATLAB statistics and the machine-learning toolbox, which enables to train a multiclass, error-correcting output codes (ECOC) model of linear support vector machines (SVM) for binary choices (e.g., Reber et al., 2019; Stavisky et al., 2019). In this, multiple binary SVMs between all pairs of labels are trained. All parameters were set to their default values. We constructed a feature vector for one or two trials, consisting of the firing activity of each neuron (normalized firing rate [0 to 1]) in 25 bins of 200 ms (over 5 s). The classifier was trained on spike trains from −25 s to 60 s after delay-onset of all five conditions, with labels of the delay length (delay lengths are 0, 5, 10, 20 and 40 s) for each animal (no fewer than 17, not more than 43 neurons from one animal) at every 2 s time step in each trial (Figure 5—figure supplement 1A). Classification performance was cross-validated using a leave-one-trial-out method and quantified as the correction probability. We separately calculate the correction probability of each delay length. The performance was shown together with surrogate decoding performance as chance prediction, obtained from artificial testing datasets created by shuffling the neuron labels and/or delay lengths (Figure 5—figure supplement 1B and D).

Statistical analysis

Request a detailed protocol

Correlation coefficients and P values between firing rates and delay length were calculated by the Matlab function (corrcoef). To estimate statistical significance of the obtained percentage of neurons correlated with delay length, we resampled firing rate and delay length in all trials with 1000 repeats. We then compared the observed percentage from the permutated percentage. To compare the firing rates between short and long delay conditions, we performed Wilcoxon’s rank sum test. Kolmogorov–Smirnov test (kstest) (Salz et al., 2016) was conducted to test the normality. To assess side-dependency in firing rates, three-way ANOVA (side [right and left] × phase [start, delay, and goal] × delay length [5 and 20]) was used. To compare the effect of reward loss and gain on firing rate of delay-act and delay-sup cells and average firing rates between cKO and control mice, Mann-Whitney’s U test was carried out. To examine the ratio distribution, we performed two-tailed one-sample t tests against 0. The behavioral impact of NMDAR conditional knockout was evaluated by two-way ANOVA (genotype [cKO and control] × choice probability) followed by post-hoc Scheffe’s test. Fisher’s exact test was applied to compare the cell-type distributions between cKO and control mice.

Data availability

All data generated or analysed during this study are included in the manuscript and supporting files.

References

  1. Book
    1. Ainslie G
    (1992)
    Picoeconomics: The Strategic Interaction of Successive Motivational States Within the Person
    Cambridge University Press.

Decision letter

  1. Laura L Colgin
    Senior Editor; University of Texas at Austin, United States
  2. Matthijs van der Meer
    Reviewing Editor

In the interests of transparency, eLife publishes the most substantive revision requests and the accompanying author responses.

Acceptance summary:

This paper suggests a potential explanation for the known contributions of the hippocampus to adaptive decision-making in the face of temporal delays. Masuda et al. dissociate delay and reward value behaviorally, and are therefore able to show that these decision variables are encoded in distinct populations of neurons in the mouse hippocampus.

Decision letter after peer review:

[Editors’ note: the authors submitted for reconsideration following the decision after peer review. What follows is the decision letter after the first round of review.]

Thank you for submitting your work entitled "The hippocampus encodes delay and value information during delay-discounting decision making" for consideration by eLife. Your article has been reviewed by three peer reviewers, one of whom is a member of our Board of Reviewing Editors, and the evaluation has been overseen by a Senior Editor. The reviewers have opted to remain anonymous.

Our decision has been reached after consultation between the reviewers. Based on these discussions and the individual reviews below, we regret to inform you that your work will not be considered further for publication in eLife.

Although there was broad agreement that the issue of how delay length is encoded in the activity of hippocampal neurons is timely and important, the manuscript lacks the critical analyses needed to evaluate whether there is a meaningful advance towards this goal.

In particular, all reviewers agreed that a permutation test is required to support the important central claim that some number of neurons encode delay length. However, even in the best case scenario where the currently reported number passes such a test, the small number of neurons encoding delay length would limit the significance of the finding. Relatedly, several reviewers felt the analyses performed did not appropriately take the known properties of "time cells" into account. Please see the reviews below for a more detailed explanation of these concerns.

Reviewer #1:

This study by Masuda and colleagues seeks to characterize differences in hippocampal activity during the delay phase of an intertemporal choice task. The question of under what circumstances and through what mechanism the hippocampus contributes to such delay discounting has received considerable attention in the human decision-making literature and in rodent behavioral neuroscience studies. Surprisingly, no studies appear to have asked how the rodent HC represents such choices in ensemble neural activity. Thus, I am excited about the potential of the study to fill a conspicuous neural representation gap in our working model of how the HC contributes to intertemporal choice.

The authors correctly identified that temporal discounting requires encoding of multiple different delay lengths, rather than simply the presence or absence of a delay. They therefore include different delay conditions in their task, so that firing rate and delay length can be correlated in each individual neuron. The main finding appears to be that a small set of neurons (<10% overall; 3 out of 58 and 8 out of 83 for delay-activated and -suppressed neurons respectively) encodes delay length thus defined. I do not find this result very informative for a number of reasons.

First, the authors should perform permutation tests to establish a chance distribution to compare these numbers to.

Second, the data suggest this analysis does not capture the properties of CA1 ensemble activity adequately: the population averages (Figure 4B) show a non-monotonic relationship with delay length, and the peri-event time histograms show the characteristic distribution of peak firing rates across the delay previously shown by Pastalkova, MacDonald, and others. The "retiming" experiments suggest that the sequence of firing reliably distinguishes the different delays - wouldn't this provide a very different affirmative answer to the authors' question of how HC activity encodes delay?

Third, although the authors manipulate reward amount and report how such changes affect delay-activated vs. -suppressed neurons, I could not find how the delay-encoding neurons specifically (the 3/58 and 8/83) were affected by reward amount. This is crucial to establish, because of the possibility that what looks like delay coding could actually be more general expected value coding.

Thus, to convincingly address the seemingly simple question of how HC activity relates to delay length the authors need to confront two tricky issues which are currently not adequately addressed:

1) Considering different coding schemes, such as sustained parametric coding of delay in individual neurons (e.g. short: 1Hz, medium, 2Hz, long: 3Hz), and dynamic sequence patterns that may differentiate between delays (e.g. short: neuron A->B->C, medium: B->D->E, long: C->D->F), and others.

2) Disentangling delay length from known covariates, such as expected value and movement.

Note that I have not commented on the substantial number of other analyses reported, such as activity dependence on location, the temporal distribution of firing rates, and temporal shifts with experience. These are helpful for reference but do not seem to speak to the main question of how different delay lengths are coded. Similarly, a potentially valuable component of the study is the altered behavior and neural activity in CA1 NMDAR knockout mice, but given the issues above, it is presently unclear how this should be interpreted.

Reviewer #2:

In this manuscript, Masuda and colleagues investigate an interesting and important question: how does the hippocampus represent a delay-based decision making task? The authors identify populations of neurons that fired (or ceased to fire) while mice waited in the delay zone, and showed that in a subset of these neurons delay-zone firing rate correlated with delay length. Interestingly, populations of delay-activated and delay-suppressed neurons showed opposite effects when reward size was decreased and then restored. Finally, the authors repeated many of these analyses in NMDA receptor knock-out mice, and found altered patterns of decision making and neural representations in these animals.

Given the wealth of evidence that hippocampus is important for decisions involving delays, an attempt to understand what is going on at the single-unit level during the delay period is an interesting and potentially valuable contribution to the literature. However, the most interesting and novel effects reported here are identified in very small numbers of neurons, raising potential questions about the robustness of the effects. In addition, the logic of the authors' method of identifying delay suppressed and activated neurons is unclear.

Samples sizes and neural effect sizes

Many of the effects reported in the manuscript are identified in small subgroups of neurons. I think this is partially because the authors ran several variants of the task and did not necessarily record large numbers of neurons for each of those different conditions, but even for the main task the authors report that mice typically performed around 10 trials per session, which is not so many for neural data analyses. This means that interesting effects like the potential correlation between firing rate and delay length are identified in rather small populations of cells (3/58 delay activated and 8/83 delay suppressed cells). These number are low, both in terms of the fraction of neurons that show the effect (which is pretty near chance for this example; 5% and 9% of neurons), and the total number of neurons analyzed for each effect, which raises the possibility that the analyses are somewhat underpowered and potentially spurious. Similarly, the delay-dependent shift in firing location (reported in Figure 5) is identified in 4/33 cells. The percentage of neurons whose firing rate changed during the revaluation procedure (where the delayed reward was decreased and then restored back to the normal size) was not reported, but the entire analysis was conducted on 30 delay activated neurons and 39 delay suppressed neurons, which is again a small number of cells to reliably detect changes.

Besides the issue of the number of cells recorded under different conditions, there are other aspects of the data that I don't understand and cannot parse by reading the paper. For instance, in the reward revaluation analysis there are pretty dramatically different numbers of neurons in the devalued and revalued conditions, meaning either that for some reason cells were lost between trials (indicating pretty serious recording instability), or this analysis was actually conducted across different recording sessions (rendering a comparison of absolute different in firing rate fraught, as it's unclear what fraction of neurons were recorded in both sessions). The fact that I'm still not entirely sure how this part of the experiment was carried out points to some issues with the methods description; with some many different variants of the task, it would be nice if more detailed descriptions of each were provided, along with a detailed timeline of which order the variations occurred in.

Approach for detection delay-activated and delay-suppressed cells

Given the naming of these cells, my initial impression was that they were populations of neurons that either increased or decreased their firing rate with increasing or decreasing delay. In fact, only very few neurons in their sample showed that sort of behavior. Instead, these groups of neurons are identified based on comparing their average firing rate in the delay zone with their average firing rate everywhere else on the track. To me, this makes it hard to specifically say the neurons identified in this way were specifically modulated by delay (as their naming implies), because the delay zone has other properties that set it apart from the rest of the track. Presumably animal's movement speed is low here, while it is high everywhere else on the track expect perhaps the reward zone. It's also the part of the maze where mice presumably spend the greatest total amount of session time. To anthropomorphize a bit, it's probably the region of the maze associated with the most frustration or annoyance due to the delay. All of these factor could be reasons for detecting a difference in firing rate in this particular location relative to every other location on the maze. Again, if the change in firing rate were linked directly to systematic variations in delay, I think that would go some ways towards ruling out other possibilities like the ones I mentioned here, but in fact, the data indicate that neurons firing rate correlated with delay length are quite rare.

Reviewer #3:

The authors of the study investigated the activity of CA1 neurons in the mouse during a delay discounting task. The main finding is that the activity of select CA1 neurons can reflect reward temporal delay, amount, and location by delay-activation or delay-suppression of spiking activity in a NMDA-dependent manner. The authors conclude that distinct subclasses of hippocampal neurons support delay-discounting decisions of the animals. The results of the study are novel and interesting and can only suggests several ways to further improve the significance of the current results.

1) Some of the reported effects are rather small (one example: proportion of neurons showing correlation between changes in firing rates and amount of delay at 5.1%, paragraph two of subsection “Delay-dependent neuronal activity in the CA1”). To test the significance of such effects above chance variability, whenever possible, the authors should compare these proportions with those obtained by shuffling neuronal activity, for instance shuffling neuronal identity across different delays, and show the control proportions are lower.

2). There two classes of responsive neurons, delay-act (+) and delay-sup (-). Aside from this feature, is there any other property of these cells that would allow them to be distinguished as two classes of neurons (see Discussion paragraph one)? Related to this, the significant correlations between delay duration and amount of change in firing rate the authors like to emphasize on appear positive (and small) for both delay+ and delay- neurons. Intuitively, I would have expected the interesting correlations to be negative for the delay- neurons and positive, and in higher proportions, for the delay+ neurons. The authors should discuss the significance, importance and implications of these findings.

3) The NR1KO CA1 neurons are known to generally fire with reduced rates compared with control animals. The reported z-scores might become noisier in the mutant animals due to their reduced baseline rates, which could result in reduced proportions of delay+ and delay- neurons compared with controls. The authors should compare the delay+ and delay- activity of NR1KO neurons with that of a subpopulation of control neurons with mean firing rates similar to those of KO ones, in addition to all control neurons.

4) The authors report the recording of inhibitory neurons activity (INT). I suggest the authors further explore this activity in the context of delay+ and delay- activity of putative pyramidal neurons (PYR) as a possible clue to the diversity of neuronal response to delay. For instance, is there any putative synaptic PYR-INT connection detectable in cross-correlations between individuals of these neuronal groups that changes with temporal delay or that could explain the two proposed classes of PYR neurons as well as the effects of NR1 KO?

5) Please indicate which animals were recorded with silicon probes and what kind of probes were used (recording sites configuration).

[Editors’ note: further revisions were suggested prior to acceptance, as described below.]

Thank you for submitting your article "The hippocampus encodes delay and value information during delay-discounting decision making" for consideration by eLife. Your article has been reviewed by three peer reviewers, one of whom is a member of our Board of Reviewing Editors, and the evaluation has been overseen by Laura Colgin as the Senior Editor. The reviewers have opted to remain anonymous.

The reviewers have discussed the reviews with one another and the Reviewing Editor has drafted this decision to help you prepare a revised submission.

Summary:

The reviewers agree that the main conclusion of the paper, that there are distinct signals related to delay and value in the activity of CA1 neurons, is now supported by the improved analyses in this revision. They also highlighted two remaining issues that the authors should be able to address with existing data and careful attention to communicating the logic and motivation for the analyses in the text.

Essential revisions:

First, the authors should add an up-front discussion of the possible ways in which delays could be coded in principle, followed by justification of the specific analysis methods chosen. It should be clear to the reader how the methods used are able to identify which of these schemes are supported by the data. See reviewer #1 for more details.

Second, more information and discussion related to the possibility that the NMDA receptor knockout may have spread beyond the hippocampus proper should be added (see reviewer #2).

Reviewer #1:

In this resubmission, the authors have added a number of important additional analyses, in particular (1) permutation tests to establish the statistical significance of the main results, and (2) a direct comparison of delay coding and "reward coding", showing that putative delay coding is not a consequence of temporal discounting of reward (Figure 7E).

A further major change is that the cell numbers (and percentages) coding delay is now an order of magnitude higher than in the original submission, a difference the authors explain is due to computing correlations between delay and firing rate on a trial-by-trial basis, rather than by first averaging across trials.

With these additions, I think the authors have provided solid evidence that the firing rates of a substantial proportion of CA1 neurons is parametrically related to delay length in the main "extension" version of the task.

However, as I wrote in my original review, the authors still do not seem to give consideration to the multitude of ways CA1 population activity can be said to encode delay length. There are previous findings in the literature (such as the MacDonald et al. and follow-up "time cell" papers) that lay out a specific "sequential activation" scheme for what delay activity could look like. It may be that this is not what happens in this data set, but they need to explicitly identify this possibility and then treat it with corresponding analyses.

More generally, the paper really needs an up-front discussion of the possible ways, neural coding schemes, in which delays could be coded in principle, followed by motivation/justification of the specific analysis methods that are able to identify which of these schemes are compatible with the data. Without this, many of the analyses lack a clear logical connection to possible interpretations. Just as one example, suppose that delay activity were to look as follows: short delay is coded by sequential activation of cells A-B-C, longer delay by A-B-C-D-E, and longest delay by A-B-C-D-E-F-G. The “mean firing rate” of cell A will now be parametrically related to delay length, because the same spiking activity will be normalized by a different length time window. I'd say this would be a misleading way of claiming that cell A encodes delay length, because activity isn't actually different between the three delays! I am aware the authors also use peak firing rate, which avoids this particular pitfall (but has other issues, how would a downstream decoder read this out?), but I'm using this example to hopefully impress on the authors the need to clearly motivate their choice of analysis.

There are other points in the manuscript where I found the logic difficult to follow. For instance, I think the analyses in Figure 7E is the logical next step after having shown that there is (in a certain number of cells) a relationship between delay and firing rate. Given that initial result, I would want to know to what extent such a relationship could be the result of correlated/confounding variables such as discounted reward value. In other words, are these neurons "just" coding value? From the authors' rebuttal, I get the impression that I somehow did not make this point fully clear. I will try again. Even though the actual outcome, number of reward pellets, is not changed, a change in delay means that for longer delays, the subjective discounted value is smaller. Thus, in the basic "extension" design, delay length is perfectly (inversely) correlated with subjective value, and it is therefore essential that the authors test if such a value-based account is the best explanation. It is a strength of the study that the authors have data that can address this, but the importance and logic of this argument currently is not clear from the paper, and the fact that the key result is "buried" in Figure 7E does the paper a disservice.

Reviewer #2:

In this revised version of the manuscript, the authors have addressed satisfactorily all my comments. The main concern regarding the low number of coding neurons has been addressed with new data analysis and the proportions of significant neurons are more convincing. Moreover, key terminology has been revised according to reviewers' comments and additional explanations have been added as requested. Overall, the manuscript has improved significantly. There remain several typos throughout the manuscript, mostly on the newly added text. The authors should proofread the manuscript and fix all these errors. Given the completion of that process, I have no further comments and I recommend the manuscript for publication.

I would like for the authors to include a new Table showing the ages of KO animals whose electrophysiological activity was reported in the manuscript (Figure 8, Figure 8—figure supplement 1). This is important as the authors state that in some of these animals the deletion of NMDAR spread beyond the CA1 area. The authors should also perform and report data analyses that are restricted to KO animals that were between 1-2 months of age at the time of ephys recording when NMDA deletion is restricted to CA1 area. If the authors want to maintain the statement currently in the Abstract and throughout the manuscript that "genetic deletion of NMDA receptor in hippocampal pyramidal cells impaired delay-discount behavior and diminished delay-dependent activity in CA1", they should show that this is indeed the case in the subgroup of animals where the NMDA KO was restricted to CA1 pyramidal neurons or at least the hippocampus (not entorhinal cortex or other brain areas). Otherwise, the authors should disclose that the reported effects might be contributed by NMDA deletion outside the hippocampus and name those brain areas. It would also really help if the demonstration of CA1 specific deletion of NMDAR in KO animals used in the ephys could be supported by immunohistochemistry.

https://doi.org/10.7554/eLife.52466.sa1

Author response

[Editors’ note: the authors resubmitted a revised version of the paper for consideration. What follows is the authors’ response to the first round of review.]

Reviewer #1:

This study by Masuda and colleagues seeks to characterize differences in hippocampal activity during the delay phase of an intertemporal choice task. The question of under what circumstances and through what mechanism the hippocampus contributes to such delay discounting has received considerable attention in the human decision-making literature and in rodent behavioral neuroscience studies. Surprisingly, no studies appear to have asked how the rodent HC represents such choices in ensemble neural activity. Thus, I am excited about the potential of the study to fill a conspicuous neural representation gap in our working model of how the HC contributes to intertemporal choice.

The authors correctly identified that temporal discounting requires encoding of multiple different delay lengths, rather than simply the presence or absence of a delay. They therefore include different delay conditions in their task, so that firing rate and delay length can be correlated in each individual neuron. The main finding appears to be that a small set of neurons (<10% overall; 3 out of 58 and 8 out of 83 for delay-activated and -suppressed neurons respectively) encodes delay length thus defined. I do not find this result very informative for a number of reasons.

First, the authors should perform permutation tests to establish a chance distribution to compare these numbers to.

Second, the data suggest this analysis does not capture the properties of CA1 ensemble activity adequately: the population averages (Figure 4B) show a non-monotonic relationship with delay length, and the peri-event time histograms show the characteristic distribution of peak firing rates across the delay previously shown by Pastalkova, MacDonald, and others. The "retiming" experiments suggest that the sequence of firing reliably distinguishes the different delays – wouldn't this provide a very different affirmative answer to the authors' question of how HC activity encodes delay?

Third, although the authors manipulate reward amount and report how such changes affect delay-activated vs. -suppressed neurons, I could not find how the delay-encoding neurons specifically (the 3/58 and 8/83) were affected by reward amount. This is crucial to establish, because of the possibility that what looks like delay coding could actually be more general expected value coding.

a) We thank the reviewer for these excellent suggestions, they have motivated us to rethink our analytical approach to identifying and verifying delay activity in CA1. First, in response to comments raised by all three reviewers, we have updated our approach to detect neurons showing correlation with delay length. In our original manuscript, the correlation analysis only used the averaged firing rate for all trials of each of the four delay lengths, reducing each neuron’s activity to four data points and making it very difficult to identify a meaningful number of single units (only 4 variables, R = 0.96 was required to reach significance P < 0.05). To make use of the rich data set we collected, we reanalyze correlation coefficients using each trial as a sample, and examined the delay length/firing rate changes using both the mean and peak firing rate of each cell separately. In this careful analysis we found a substantial fraction of the neurons demonstrated a significant correlation with delay length (about 70% for peak firing rate; about 35% for mean firing rate, Figure 5 in the revised manuscript). As you suggested, we performed a permutation test to simulate the chance probability of cell showing correlation and confirmed that the chance level (10.8 – 12.7% ) is much lower than what we observed.

b) As for the second point you raise, we agree that the population firing rate (Figure 4B in original manuscript) does in fact show a non-monotonic response across the longer delay, which highlights different trends among the delay-act and -sup cells. As we argued above, here we identify a novel group of neurons which increased or decreased their firing rate proportionally to the delay length. Thus, this finding suggests that not all delay-act or -sup cells, but rather a certain subset is involved in encoding of delay length.

In the terms of sequence structure observed in the population analysis, we conducted an additional analysis. We separately generated population codes of different experimental conditions. For estimation of factors in population structure, we separately produced peri-event time histograms in the different experimental conditions (extension, switch, both-side, and reward lose conditions). Interestingly we found a uniform-like distribution only from both-side conditions (Kolmogorov–Smirnov test, kstest; Salz et al., 2016, did not deny the possibility of uniformity in both-side conditions but did other all conditions, p = 0.46 for both-side condition). This suggests that CA1 population activity is diverse across the experimental conditions. Furthermore, uniform-like distribution of CA1 neurons may require repeated presentation of a constant delay. We add this information in Figure 4—figure supplement 2 and text.

c) From our recording data, CA1 cells could be analytically categorized with i) activity during delay (delay act and -sup), ii) responsiveness to long delay (up or down, and correlation), iii) place-dependency (side-dependent or -independent), and iv) reward dependency (up or down by reward loss or gain). For iii) and iv), we designed the experiment scheme to make it possible to cross-evaluate these responses with i) and ii). In reward loss or gain conditions (in original manuscript, devalue or revalue conditions), the CA1 activity was recorded under short delay and long delay, as well as under the reward manipulated conditions (see Figure 7—figure supplement 1 in the revised version). Thus, we could analyze the relationship among the delay-related activity and reward manipulation (Figure 7E in the revised version). The scatter plot of firing rate ratio small/large reward conditions and long/short delay conditions shows that there are no global trends (note that delay-act cells tend to be negative on small/large axis), suggesting that the CA1 neurons exhibit independent relationship delay (length) and reward manipulation responses.

Thus, to convincingly address the seemingly simple question of how HC activity relates to delay length the authors need to confront two tricky issues which are currently not adequately addressed:

1) Considering different coding schemes, such as sustained parametric coding of delay in individual neurons (e.g. short: 1Hz, medium, 2Hz, long: 3Hz), and dynamic sequence patterns that may differentiate between delays (e.g. short: neuron A->B->C, medium: B->D->E, long: C->D->F), and others.

2) Disentangling delay length from known covariates, such as expected value and movement.

Thank you for your critical perspective. As per the reviewer’s suggestion, we have reconceptualized our idea of delay coding in CA1. You have raised the idea of coding schemes based on the individual and population levels. Our data showed that a large fraction of neurons in CA1 reflect delay length in their firing rate. This would be the individual level of delay coding. At the population level, the uniform-like distribution of peak firing over task time was observed under a specific protocol, the both-side condition, where a constant delay length repeatedly presented. This suggests that the CA1 activity is controlled in a sequential manner to encode precise time. We added this point of view to the Discussion.

Author response image 1
Moving patterns and speed during delay.

Left: Moving traces of single trial on delay 5, 10, 20 and 40 s conditions. Right: Moving speed corresponding to the trials shown in the left traces. Initial high speed movements (around 20-24 cm/s) occurred by starting a trial are followed by constant intermitted speed movements (around 16 cm/s). Note that there is no obvious difference in moving speed among the delay 5, 10, 20 and 40 s conditions. Data from mouse M9.

Thank you for the suggestion. Covariates such as reward expectation and spatial context were investigated in an integrative manner. We believe understanding “compositeness” for CA1 activity is important because the CA1 activity has already known to be related to single components such as movement speed, reward expectation, and spatial context. The expected values in the present study were constant because the percentage of reward is always 100% within the all trials, although some initial trials after transition of switch, both-side, or reward loss/gain conditions perturbed the animals’ prediction of reward size. To consider this issue, we have shown the firing in all trials for such conditions and followed the transition and adaptation in a qualitative manner. Regarding moving speed, we captured example data in the bottom. It was general that the animals were running inside the delay zone during waiting. The movement trajectories and speed shown here do not match the firing patterns of CA1 neurons. Strong theta power during that time (Figure 2C-D) also suggest that the animals waiting in the delay zone are active in brain state.

Note that I have not commented on the substantial number of other analyses reported, such as activity dependence on location, the temporal distribution of firing rates, and temporal shifts with experience. These are helpful for reference but do not seem to speak to the main question of how different delay lengths are coded. Similarly, a potentially valuable component of the study is the altered behavior and neural activity in CA1 NMDAR knockout mice, but given the issues above, it is presently unclear how this should be interpreted.

We tried to explain importance of all analysis in the revised manuscript.

Reviewer #2:

In this manuscript, Masuda and colleagues investigate an interesting and important question: how does the hippocampus represent a delay-based decision making task? The authors identify populations of neurons that fired (or ceased to fire) while mice waited in the delay zone, and showed that in a subset of these neurons delay-zone firing rate correlated with delay length. Interestingly, populations of delay-activated and delay-suppressed neurons showed opposite effects when reward size was decreased and then restored. Finally, the authors repeated many of these analyses in NMDA receptor knock-out mice, and found altered patterns of decision making and neural representations in these animals.

Given the wealth of evidence that hippocampus is important for decisions involving delays, an attempt to understand what is going on at the single-unit level during the delay period is an interesting and potentially valuable contribution to the literature. However, the most interesting and novel effects reported here are identified in very small numbers of neurons, raising potential questions about the robustness of the effects. In addition, the logic of the authors' method of identifying delay suppressed and activated neurons is unclear.

The reviewer raises a key point, also referenced by the other reviewers. The small population of neurons the reviewers latch onto (3 out of 58 and 8 out of 83 for delay-activated and -suppressed neurons respectively) were CA1 neurons which showed a statistically significant correlation between delay length and average firing rate change across all tested delay conditions (5, 10, 20, and 40 sec). This number was small because we used only average firing rate over whole trials from each delay length condition, making it very difficult to obtain statistically significant cells when sample size is only four points (firing rate at delay length of 5, 10, 20, and 40 sec) for correlation analysis (R = 0.96 is required). Therefore, we have approached this question with a new analysis, now using the richness of our data set to include firing rates individual from all delay trials (about 30 – 40 trials). In this correlation analysis, we found a significant fraction of neurons which showed significant correlation (P < 0.05) of peak firing rate (about 70% ) and mean firing rate (about 35% ) with delay length (Figure 5). A permutation test, randomization of firing and delay length pairs, confirmed the percentages are higher than chance level (10.8 – 12.7% , P = 0.01).

As an answer to the second question, the confusion may stem from our admittedly poor overall definition of delay-act and delay-sup cells. We categorized them based on whether “the firing rate during the long delays (>20 sec)” is higher than the “baseline” (activity during delay is high or low) with applying a permutation test (compared to randomized firing). We apologize that some reviewers were confused by our finding that the delay-act cells from the neurons of firing rate significantly facilitated by delay length extension (short to long) and the delay-sup cells suppressed. This characteristic (facilitation or inhibition by delay extension) is investigated by comparison short and long delay conditions throughout our study. Therefore, we followed the firing pattern of CA1 neurons two directions: within trial (delay-act and delay-sup cells, selective activity to “delay”) and among different delay lengths (short: 5 sec and long: 20 sec, or 0, 5, 10, 20, and 40 sec).

Samples sizes and neural effect sizes

Many of the effects reported in the manuscript are identified in small subgroups of neurons. I think this is partially because the authors ran several variants of the task and did not necessarily record large numbers of neurons for each of those different conditions, but even for the main task the authors report that mice typically performed around 10 trials per session, which is not so many for neural data analyses. This means that interesting effects like the potential correlation between firing rate and delay length are identified in rather small populations of cells (3/58 delay activated and 8/83 delay suppressed cells). These number are low, both in terms of the fraction of neurons that show the effect (which is pretty near chance for this example; 5% and 9% of neurons), and the total number of neurons analyzed for each effect, which raises the possibility that the analyses are somewhat underpowered and potentially spurious. Similarly, the delay-dependent shift in firing location (reported in Figure 5) is identified in 4/33 cells. The percentage of neurons whose firing rate changed during the revaluation procedure (where the delayed reward was decreased and then restored back to the normal size) was not reported, but the entire analysis was conducted on 30 delay activated neurons and 39 delay suppressed neurons, which is again a small number of cells to reliably detect changes.

We apologize for the confusion. The number of analyzed neurons in these experiments were more than 800 in total. We think this number is at the high end for electrophysiological recordings in free moving mice. The reviewer is correct in that the number of neurons recorded under the various conditions was variable, we have included Table 2 that clarifies the number of mice and the number of neurons recorded under each individual condition. Further, as mentioned above, the small number of neurons in some of the analyses was due to several reasons. First, we divided whole population into delay-act and -sup cells for profiling subcategorized population. Second, neurons were recorded in the different experimental conditions which all include short and long delay conditions, although more than 80 neurons identified in each condition. Third, we only included neurons with >0.5 Hz average firing rate because some statistical methods, including permutation test for definition of delay-act and -sup neurons, require relatively higher firing rates. We believe that despite these challenges, the numbers are valid to assess statistical significance. Regarding the issue that small fraction of significantly correlated with delay length in firing rate, please see our answer to point 1 above.

Besides the issue of the number of cells recorded under different conditions, there are other aspects of the data that I don't understand and cannot parse by reading the paper. For instance, in the reward revaluation analysis there are pretty dramatically different numbers of neurons in the devalued and revalued conditions, meaning either that for some reason cells were lost between trials (indicating pretty serious recording instability), or this analysis was actually conducted across different recording sessions (rendering a comparison of absolute different in firing rate fraught, as it's unclear what fraction of neurons were recorded in both sessions). The fact that I'm still not entirely sure how this part of the experiment was carried out points to some issues with the methods description; with some many different variants of the task, it would be nice if more detailed descriptions of each were provided, along with a detailed timeline of which order the variations occurred in.

The relatively small sample size of neurons in the reward manipulation conditions stemmed from the experimental schedule which is now referenced in Figure 1—figure supplement 2. We sequentially performed different experimental conditions, and the reward manipulation conditions were at the end of the whole schedule. The number of neurons usually dropped day by day. We added the daily schedule of each experiment as figure supplements.

Approach for detection delay-activated and delay-suppressed cells

Given the naming of these cells, my initial impression was that they were populations of neurons that either increased or decreased their firing rate with increasing or decreasing delay. In fact, only very few neurons in their sample showed that sort of behavior. Instead, these groups of neurons are identified based on comparing their average firing rate in the delay zone with their average firing rate everywhere else on the track. To me, this makes it hard to specifically say the neurons identified in this way were specifically modulated by delay (as their naming implies), because the delay zone has other properties that set it apart from the rest of the track. Presumably animal's movement speed is low here, while it is high everywhere else on the track expect perhaps the reward zone. It's also the part of the maze where mice presumably spend the greatest total amount of session time. To anthropomorphize a bit, it's probably the region of the maze associated with the most frustration or annoyance due to the delay. All of these factor could be reasons for detecting a difference in firing rate in this particular location relative to every other location on the maze. Again, if the change in firing rate were linked directly to systematic variations in delay, I think that would go some ways towards ruling out other possibilities like the ones I mentioned here, but in fact, the data indicate that neurons firing rate correlated with delay length are quite rare.

Thank you for the wide range of suggestions. The delay in the task has two aspects: which option (or position) is associated, and how long the animals need to wait. Although the delay is not always long in the task, delay length did have a strong impact on choice behavior (Figure 1). To define delay-act cells we set our criteria based on the activity during delays longer than 20 s, which had a stronger effect of dropping animals’ preference to the delayed reinforcer. As the reviewer suggests, we could also define delay-act cells based on the enhanced firing rate after delay extensions (such as delay 5 to 20 sec). However, it would be more complex when the activity is compared to the different conditions tested in the present study, such as switch or both-side conditions where delay length changed in multiple position simultaneously. Moreover, we measure the change of firing patterns by delay extensions in some experimental conditions including extension and reward loss and gain conditions. This information is shown in the correlation analyses.

We agree with the reviewer’s opinion that the several factors may induce neural activity changes. We checked one possibility that difference of the moving speed during delay may affect firing activity (see Author response image 1). From this figure showing the examples of moving speed of different delay length, the animals seem to move at constant moving speed over delay 5,10,20, and 40 sec conditions.

Reviewer #3:

The authors of the study investigated the activity of CA1 neurons in the mouse during a delay discounting task. The main finding is that the activity of select CA1 neurons can reflect reward temporal delay, amount, and location by delay-activation or delay-suppression of spiking activity in a NMDA-dependent manner. The authors conclude that distinct subclasses of hippocampal neurons support delay-discounting decisions of the animals. The results of the study are novel and interesting and can only suggests several ways to further improve the significance of the current results.

1) Some of the reported effects are rather small (one example: proportion of neurons showing correlation between changes in firing rates and amount of delay at 5.1%, paragraph two of subsection “Delay-dependent neuronal activity in the CA1”). To test the significance of such effects above chance variability, whenever possible, the authors should compare these proportions with those obtained by shuffling neuronal activity, for instance shuffling neuronal identity across different delays, and show the control proportions are lower.

The small population of neurons that all the reviewers expressed concern with were CA1 neurons which showed a statistically significant correlation between delay length and mean firing rate change across all tested delay conditions (3 out of 58 and 8 out of 83 for delay-activated and -suppressed neurons respectively). This number was small because we used only average firing rate over whole trials from each delay length condition, making it difficult to obtain statistically significant cells when sample size is only four (firing rate at delay length of 5, 10, 20, and 40 sec) for correlation analysis (R = 0.96 is required). Therefore, we employed the firing rate of each neuron on a trial-by-trial basis over the delay trials (about 30 – 40 trials). In this correlation analysis, we found a large fraction of neurons showed significant correlation of (P < 0.05) peak firing rate (about 70% ) and mean firing rate (about 35% ) with delay length. A permutation test, randomization of firing and delay length pairs, confirmed the percentages are higher than chance level (10.8 – 12.7% , P = 0.01).

2). There two classes of responsive neurons, delay-act (+) and delay-sup (-). Aside from this feature, is there any other property of these cells that would allow them to be distinguished as two classes of neurons (see Discussion paragraph one)? Related to this, the significant correlations between delay duration and amount of change in firing rate the authors like to emphasize on appear positive (and small) for both delay+ and delay- neurons. Intuitively, I would have expected the interesting correlations to be negative for the delay- neurons and positive, and in higher proportions, for the delay+ neurons. The authors should discuss the significance, importance and implications of these findings.

Thank you for the important suggestions. We provide a revised figure (Figure 5) addressing these points. It shows that many neurons exhibit a negative correlation of their mean firing rate and delay length during the delay. Our interpretation of these data is that the longer delay is encoded via two different methods: a discounting factor (or delay length, we think these have similar meanings) and predicting factor for larger rewards. The neurons showing negative correlation may be candidate as later one. We added this discussion in the text.

3) The NR1KO CA1 neurons are known to generally fire with reduced rates compared with control animals. The reported z-scores might become noisier in the mutant animals due to their reduced baseline rates, which could result in reduced proportions of delay+ and delay- neurons compared with controls. The authors should compare the delay+ and delay- activity of NR1KO neurons with that of a subpopulation of control neurons with mean firing rates similar to those of KO ones, in addition to all control neurons.

According to the literature (McHugh et al., 1996), the firing rate of NR1cKO CA1 neurons are increased compared to controls. In our data, mean firing rate of whole population CA1 neurons were not significantly different. Following text was add in the result section: “We could not detect significant difference among the genotypes in basic firing property during the task (mean firing rate, cKO: 3.07 + Hz; Control: 3.39 Hz; Z = -0.76, P = 0.44, Mann-Whitney’s U-test). Subpopulation of firing rate were also not significantly different (delay-act, cKO: 2.66 Hz, Control: 3.13 Hz, Z = -0.91, P = 0.35; delay-sup, cKO: 3.47 Hz, Control: 3.47 Hz, Z = -0.68, P = 0.14, Mann-Whitney’s U-test).”

4) The authors report the recording of inhibitory neurons activity (INT). I suggest the authors further explore this activity in the context of delay+ and delay- activity of putative pyramidal neurons (PYR) as a possible clue to the diversity of neuronal response to delay. For instance, is there any putative synaptic PYR-INT connection detectable in cross-correlations between individuals of these neuronal groups that changes with temporal delay or that could explain the two proposed classes of PYR neurons as well as the effects of NR1 KO?

Thank you for the suggestion. We attached data of inhibitory neurons regarding population coding (Figure 4—figure supplement 1).

5) Please indicate which animals were recorded with silicon probes and what kind of probes were used (recording sites configuration).

We understand the importance of correspondence among animal identity, recording sites, and probe design. We added such information in Figure 2—figure supplement 1.

[Editors’ note: what follows is the authors’ response to the second round of review.]

Essential revisions:

First, the authors should add an up-front discussion of the possible ways in which delays could be coded in principle, followed by justification of the specific analysis methods chosen. It should be clear to the reader how the methods used are able to identify which of these schemes are supported by the data. See reviewer #1 for more details.

We appreciate this suggestion. First, we have added a leading discussion about the framework of hypothetical coding schemes (population codes and rate coding in individual neurons for delay coding) in the Introduction. Next, we added an analysis to ask if the delay lengths can be decoded by spike activity in population of CA1 neurons (Figure 5—figure supplement 1). The results showed that a machine learning method (multiclass classification learning using SVM) successfully decoded delay length by population spikes at a level much higher than chance. Thus, we could provide evidence that the population activity in the hippocampus may encode delay length. In the main structure of the manuscript, we have strengthened the support for the conclusion that individual neural codes for delay length are modulated by information such as reward and spatial relationship. This clarifies that Figure 7E, demonstrating the feature of individual neurons associated with delay increment and reward amounts reduction, could be interpreted as value loss, a common concept between these manipulations. This allows us to demonstrate that there were a proportion of neurons which meet a requirement of value coding.

Second, more information and discussion related to the possibility that the NMDA receptor knockout may have spread beyond the hippocampus proper should be added (see reviewer #2).

We are happy to include further information of the NMDA receptor knockout and control mice used for electrophysiology. We added a table (Table 5) indicating their ages at surgery and at the end of experiments and added further discussion about this issue in the text. It is important to note that all behavioral experiments were conducted with 2 months old mice, an age at which the KO is specific to CA1 (Fukaya et al., 2003).

Reviewer #1:

In this resubmission, the authors have added a number of important additional analyses, in particular (1) permutation tests to establish the statistical significance of the main results, and (2) a direct comparison of delay coding and "reward coding", showing that putative delay coding is not a consequence of temporal discounting of reward (Figure 7E).

A further major change is that the cell numbers (and percentages) coding delay is now an order of magnitude higher than in the original submission, a difference the authors explain is due to computing correlations between delay and firing rate on a trial-by-trial basis, rather than by first averaging across trials.

With these additions, I think the authors have provided solid evidence that the firing rates of a substantial proportion of CA1 neurons is parametrically related to delay length in the main "extension" version of the task.

However, as I wrote in my original review, the authors still do not seem to give consideration to the multitude of ways CA1 population activity can be said to encode delay length. There are previous findings in the literature (such as the MacDonald et al. and follow-up "time cell" papers) that lay out a specific "sequential activation" scheme for what delay activity could look like. It may be that this is not what happens in this data set, but they need to explicitly identify this possibility and then treat it with corresponding analyses.

More generally, the paper really needs an up-front discussion of the possible ways, neural coding schemes, in which delays could be coded in principle, followed by motivation/justification of the specific analysis methods that are able to identify which of these schemes are compatible with the data. Without this, many of the analyses lack a clear logical connection to possible interpretations. Just as one example, suppose that delay activity were to look as follows: short delay is coded by sequential activation of cells A-B-C, longer delay by A-B-C-D-E, and longest delay by A-B-C-D-E-F-G. The “mean firing rate” of cell A will now be parametrically related to delay length, because the same spiking activity will be normalized by a different length time window. I'd say this would be a misleading way of claiming that cell A encodes delay length, because activity isn't actually different between the three delays! I am aware the authors also use peak firing rate, which avoids this particular pitfall (but has other issues, how would a downstream decoder read this out?), but I'm using this example to hopefully impress on the authors the need to clearly motivate their choice of analysis.

We added a leading discussion about the framework of hypothetical coding schemes, population codes (sequential activation of multiple neurons/time cells) and rate coding in individual neurons to the Introduction.

An analysis we performed in the revised manuscript asked whether the delay lengths can be decoded by spiking activity across the population. We found that a machine learning method using support vector machine (SVM) successfully decoded different conditions of delay lengths (0, 5, 10, 20, and 40 s) by population spikes (50-60% accuracy, at 20% chance level). Thus, we could provide evidence that the population activity in the hippocampus may encode delay length. This result is shown as Figure 5—figure supplement 1.

In the main structure of the manuscript, we have strengthened the possibility of individual neural codes for delay length in interacting with other information such as reward and spatial relationship, extending the interpretation of Figure 7E, the feature of individual neurons associated with delay codes and reward amounts.

There are other points in the manuscript where I found the logic difficult to follow. For instance, I think the analyses in Figure 7E is the logical next step after having shown that there is (in a certain number of cells) a relationship between delay and firing rate. Given that initial result, I would want to know to what extent such a relationship could be the result of correlated/confounding variables such as discounted reward value. In other words, are these neurons "just" coding value? From the authors' rebuttal, I get the impression that I somehow did not make this point fully clear. I will try again. Even though the actual outcome, number of reward pellets, is not changed, a change in delay means that for longer delays, the subjective discounted value is smaller. Thus, in the basic "extension" design, delay length is perfectly (inversely) correlated with subjective value, and it is therefore essential that the authors test if such a value-based account is the best explanation. It is a strength of the study that the authors have data that can address this, but the importance and logic of this argument currently is not clear from the paper, and the fact that the key result is "buried" in Figure 7E does the paper a disservice.

Thank you for the critical remark. Indeed, there was a decrease in subjective value with correlation to delay length in extension conditions, but it is hard to interpret using only the data of this conditions. One reason is the well-established fact that hippocampal activity is strongly related with the spatiotemporal events. For example, the delay-length correlated neurons we found in the extension condition can be also interpreted as correlated with subjective value (and named as value correlated neurons or so). The subjective value is defined by cost-benefit integration, and delay must be recognized as a factor of cost in the task. Thus, delay and reward are common factors which modulate subjective value. In our opinion, the most important question is if the decrease of value by delay increment and that by reward reduction are similar or not in the rate response of CA1 neurons. If some neurons show reduced “common” firing rate change in response to delay increment and reward loss, the neurons can be recognized as value coding. Although the majority of CA1 neurons did not fit this criterion, there were some CA1 neurons that met this characteristic (plotted around the line of “delay effect = reward effect” in revised Figure 7E). We like to emphasize that these neurons showed common responses to delay increment and reward reduction, thus can be interpreted as encoding subjective value, a “common” concept. We tried to explain this logic more clearly in the Introduction. Result, and Discussion.

Reviewer #2:

In this revised version of the manuscript, the authors have addressed satisfactorily all my comments. The main concern regarding the low number of coding neurons has been addressed with new data analysis and the proportions of significant neurons are more convincing. Moreover, key terminology has been revised according to reviewers' comments and additional explanations have been added as requested. Overall, the manuscript has improved significantly. There remain several typos throughout the manuscript, mostly on the newly added text. The authors should proofread the manuscript and fix all these errors. Given the completion of that process, I have no further comments and I recommend the manuscript for publication.

I would like for the authors to include a new Table showing the ages of KO animals whose electrophysiological activity was reported in the manuscript (Figure 8, Figure 8—figure supplement 1). This is important as the authors state that in some of these animals the deletion of NMDAR spread beyond the CA1 area. The authors should also perform and report data analyses that are restricted to KO animals that were between 1-2 months of age at the time of ephys recording when NMDA deletion is restricted to CA1 area. If the authors want to maintain the statement currently in the Abstract and throughout the manuscript that "genetic deletion of NMDA receptor in hippocampal pyramidal cells impaired delay-discount behavior and diminished delay-dependent activity in CA1", they should show that this is indeed the case in the subgroup of animals where the NMDA KO was restricted to CA1 pyramidal neurons or at least the hippocampus (not entorhinal cortex or other brain areas). Otherwise, the authors should disclose that the reported effects might be contributed by NMDA deletion outside the hippocampus and name those brain areas. It would also really help if the demonstration of CA1 specific deletion of NMDAR in KO animals used in the ephys could be supported by immunohistochemistry.

We thank the reviewer for further important suggestions. We appended a table (Table 5) showing the ages of cKO and control animals for the electrophysiological study. The ages were 2-4 months old for cKO and 3-5 months old for control mice. We also described the possibility of the spread of the NR1 knockout in the electrophysiological results. It is important to note that all behavioral experiments were conducted with 2 months old mice, an age at which the KO is specific to CA1 (Fukaya et al., 2003). However, as the physiology was conducted up to 4 months of age and we do not wish to overstate the effect on neural activity, we have noted this limitation of the study in the revised Discussion.

https://doi.org/10.7554/eLife.52466.sa2

Article and author information

Author details

  1. Akira Masuda

    1. Laboratory for Behavioral Genetics, Center for Brain Science, RIKEN, Wako, Japan
    2. Organization for Research Initiatives and Development, Doshisha University, Kyotanabe, Japan
    Contribution
    Conceptualization, Software, Formal analysis, Funding acquisition, Investigation, Visualization, Methodology
    For correspondence
    amasuda@mail.doshisha.ac.jp
    Competing interests
    No competing interests declared
    ORCID icon "This ORCID iD identifies the author of this article:" 0000-0002-8659-6356
  2. Chie Sano

    Laboratory for Behavioral Genetics, Center for Brain Science, RIKEN, Wako, Japan
    Contribution
    Investigation
    Competing interests
    No competing interests declared
  3. Qi Zhang

    1. Laboratory for Behavioral Genetics, Center for Brain Science, RIKEN, Wako, Japan
    2. Faculty of Human Science, University of Tsukuba, Tsukuba, Japan
    Contribution
    Validation, Methodology
    Competing interests
    No competing interests declared
  4. Hiromichi Goto

    Laboratory for Behavioral Genetics, Center for Brain Science, RIKEN, Wako, Japan
    Contribution
    Resources, Validation, Methodology
    Competing interests
    No competing interests declared
  5. Thomas J McHugh

    Laboratory for Circuit and Behavioral Physiology, Center for Brain Science, RIKEN, Wako, Japan
    Contribution
    Conceptualization, Resources, Supervision, Methodology
    Competing interests
    No competing interests declared
  6. Shigeyoshi Fujisawa

    Laboratory for Systems Neurophysiology, Center for Brain Science, RIKEN, Wako, Japan
    Contribution
    Conceptualization, Resources, Software, Supervision, Funding acquisition
    Competing interests
    No competing interests declared
  7. Shigeyoshi Itohara

    Laboratory for Behavioral Genetics, Center for Brain Science, RIKEN, Wako, Japan
    Contribution
    Conceptualization, Resources, Data curation, Supervision, Funding acquisition, Validation, Methodology
    For correspondence
    shigeyoshi.itohara@riken.jp
    Competing interests
    No competing interests declared

Funding

Japan Society for the Promotion of Science (16K15196)

  • Akira Masuda

Japan Agency for Medical Research and Development (Brain/MINDS)

  • Shigeyoshi Fujisawa

The funders had no role in study design, data collection and interpretation, or the decision to submit the work for publication.

Acknowledgements

We thank Drs Steven Middleton, Roman Boehringer, and Chinnakkaruppan Adaikkan for help building tetrodes, Dr Charles Yokoyama for valuable comments, and Dr Susumu Tonegawa for providing us NR1 cKO mice. Funding was provided by a Grand-in-Aid for Exploratory Research (JSPS KAKENHI Grant Number 16K15196) and from the ‘Brain/MINDS’ program from the Japan Agency for Medical Research and Development (AMED).

Ethics

Animal experimentation: This study was performed in strict accordance with the recommendations in the Guide for the Care and Use of Laboratory Animals of the National Institute of Health. The study was approved by the Institutional Animal Care and Use Committee of the RIKEN Institute in Wako (approval number H27-2-239(6)), in conformity with Article 24 of the RIKEN regulations for animal experiments. All surgery was performed under isoflurane anesthesia, and every effort was made to minimize suffering.

Senior Editor

  1. Laura L Colgin, University of Texas at Austin, United States

Reviewing Editor

  1. Matthijs van der Meer

Version history

  1. Received: October 4, 2019
  2. Accepted: February 19, 2020
  3. Accepted Manuscript published: February 20, 2020 (version 1)
  4. Version of Record published: March 2, 2020 (version 2)

Copyright

© 2020, Masuda et al.

This article is distributed under the terms of the Creative Commons Attribution License, which permits unrestricted use and redistribution provided that the original author and source are credited.

Metrics

  • 2,984
    Page views
  • 476
    Downloads
  • 15
    Citations

Article citation count generated by polling the highest count across the following sources: Crossref, PubMed Central, Scopus.

Download links

A two-part list of links to download the article, or parts of the article, in various formats.

Downloads (link to download the article as PDF)

Open citations (links to open the citations from this article in various online reference manager services)

Cite this article (links to download the citations from this article in formats compatible with various reference manager tools)

  1. Akira Masuda
  2. Chie Sano
  3. Qi Zhang
  4. Hiromichi Goto
  5. Thomas J McHugh
  6. Shigeyoshi Fujisawa
  7. Shigeyoshi Itohara
(2020)
The hippocampus encodes delay and value information during delay-discounting decision making
eLife 9:e52466.
https://doi.org/10.7554/eLife.52466

Further reading

    1. Neuroscience
    Amanda J González Segarra, Gina Pontes ... Kristin Scott
    Research Article

    Consumption of food and water is tightly regulated by the nervous system to maintain internal nutrient homeostasis. Although generally considered independently, interactions between hunger and thirst drives are important to coordinate competing needs. In Drosophila, four neurons called the interoceptive subesophageal zone neurons (ISNs) respond to intrinsic hunger and thirst signals to oppositely regulate sucrose and water ingestion. Here, we investigate the neural circuit downstream of the ISNs to examine how ingestion is regulated based on internal needs. Utilizing the recently available fly brain connectome, we find that the ISNs synapse with a novel cell-type bilateral T-shaped neuron (BiT) that projects to neuroendocrine centers. In vivo neural manipulations revealed that BiT oppositely regulates sugar and water ingestion. Neuroendocrine cells downstream of ISNs include several peptide-releasing and peptide-sensing neurons, including insulin producing cells (IPCs), crustacean cardioactive peptide (CCAP) neurons, and CCHamide-2 receptor isoform RA (CCHa2R-RA) neurons. These neurons contribute differentially to ingestion of sugar and water, with IPCs and CCAP neurons oppositely regulating sugar and water ingestion, and CCHa2R-RA neurons modulating only water ingestion. Thus, the decision to consume sugar or water occurs via regulation of a broad peptidergic network that integrates internal signals of nutritional state to generate nutrient-specific ingestion.

    1. Neuroscience
    Lucas Y Tian, Timothy L Warren ... Michael S Brainard
    Research Article

    Complex behaviors depend on the coordinated activity of neural ensembles in interconnected brain areas. The behavioral function of such coordination, often measured as co-fluctuations in neural activity across areas, is poorly understood. One hypothesis is that rapidly varying co-fluctuations may be a signature of moment-by-moment task-relevant influences of one area on another. We tested this possibility for error-corrective adaptation of birdsong, a form of motor learning which has been hypothesized to depend on the top-down influence of a higher-order area, LMAN (lateral magnocellular nucleus of the anterior nidopallium), in shaping moment-by-moment output from a primary motor area, RA (robust nucleus of the arcopallium). In paired recordings of LMAN and RA in singing birds, we discovered a neural signature of a top-down influence of LMAN on RA, quantified as an LMAN-leading co-fluctuation in activity between these areas. During learning, this co-fluctuation strengthened in a premotor temporal window linked to the specific movement, sequential context, and acoustic modification associated with learning. Moreover, transient perturbation of LMAN activity specifically within this premotor window caused rapid occlusion of pitch modifications, consistent with LMAN conveying a temporally localized motor-biasing signal. Combined, our results reveal a dynamic top-down influence of LMAN on RA that varies on the rapid timescale of individual movements and is flexibly linked to contexts associated with learning. This finding indicates that inter-area co-fluctuations can be a signature of dynamic top-down influences that support complex behavior and its adaptation.