The acinar differentiation determinant PTF1A inhibits initiation of pancreatic ductal adenocarcinoma
- University of Utah, United States
- University of Texas Southwestern Medical Center, United States
- Vanderbilt University Medical Center, United States
Abstract
Understanding the initiation and progression of pancreatic ductal adenocarcinoma (PDAC) may provide therapeutic strategies for this deadly disease. Recently, we and others made the surprising finding that PDAC and its preinvasive precursors, pancreatic intraepithelial neoplasia (PanIN), arise via reprogramming of mature acinar cells. We therefore hypothesized that the master regulator of acinar differentiation, PTF1A, could play a central role in suppressing PDAC initiation. In this study, we demonstrate that PTF1A expression is lost in both mouse and human PanINs, and that this downregulation is functionally imperative in mice for acinar reprogramming by oncogenic KRAS. Loss of Ptf1a alone is sufficient to induce acinar-to-ductal metaplasia, potentiate inflammation, and induce a KRAS-permissive, PDAC-like gene expression profile. As a result, Ptf1a-deficient acinar cells are dramatically sensitized to KRAS transformation, and reduced Ptf1a greatly accelerates development of invasive PDAC. Together, these data indicate that cell differentiation regulators constitute a new tumor suppressive mechanism in the pancreas.
https://doi.org/10.7554/eLife.07125.001eLife digest
Pancreatic cancer is one of the most lethal forms of cancer, with fewer than 20% of people surviving for longer than twelve months after diagnosis. Two types of genetic mutation play important roles in pancreatic cancer. First, genes called oncogenes can be activated by mutations to drive unscheduled cell division. Second, the genes for tumor suppressors—proteins that prevent cells from dividing when they should not—can be switched off due to other mutations. Together, these mutations cause cells to over-proliferate and disrupt the structure of the pancreas.
In a healthy pancreas, several different cell types perform various roles: acinar cells produce proteins that digest food, ductal cells carry these proteins to the intestine, and β cells produce insulin. Certain proteins are responsible for telling each of these cells what tasks to perform, which defines their so-called differentiation state. The protein PTF1A is crucial for establishing the differentiation state of acinar cells. In the most common form of pancreatic cancer, acinar cells are reprogrammed to become ductal cells. Moreover, pancreatic cancer cells contain much lower levels of PTF1A than normal pancreatic cells.
To explore the connection between PTF1A and pancreatic cancer, Krah et al. deleted the gene for PTF1A in mice. This led to acinar cells being reprogrammed to become ductal cells. Additionally, when an oncogene mutation was activated at the same time as the gene for PTF1A was deleted, Krah et al. observed the rapid formation of large numbers of malignant pancreatic tumors in the mice. PTF1A therefore protects against pancreatic cancer by acting as a tumor suppressor and keeping acinar cells in their healthy, differentiated state.
Unlike other tumor suppressors, however, PTF1A levels are reduced in cancer cells by a mechanism that does not involve a genetic mutation. Therefore, a future challenge is to determine how the amount of PTF1A protein is reduced, and in the longer term, to explore if it is possible to reverse cancer progression by forcing cancer cells back into their original differentiation state.
https://doi.org/10.7554/eLife.07125.002Introduction
Pancreatic ductal adenocarcinoma (PDAC) has a dismal prognosis, with a 5-year survival rate around 5% and a cure rate approaching zero. The most up-to-date chemotherapy regimens extend life only minimally (Ryan et al., 2014), and patients undergoing resection of ostensibly local tumors almost invariably succumb to recurrent disease. While this observation suggests that PDAC is usually metastatic at the time of diagnosis, recent studies suggest that tumors require over 20 years to evolve from precancerous pancreatic intraepithelial neoplasia (PanIN) to invasive carcinoma (Yachida et al., 2010). Thus, in principle, there is a large window of time for effective and early detection, prevention, and treatment, provided appropriate methods are in place. Therefore, defining the cell type of origin and characterizing the process of PanIN-PDAC evolution within the physiologic context of key risk factors (e.g., chronic pancreatitis, type 2 diabetes, or genetic cancer syndromes [Ryan et al., 2014]) is crucial to finding effective therapies.
The vast majority of human PanINs and PDAC contain activating mutations in the KRAS oncogene, which have been shown in mice to represent driver mutations for PanIN initiation, maintenance, and progression to PDAC (reviewed in Pasca di Magliano and Logsdon, 2013). Notably, the progression of PanINs to PDAC is accompanied by additional mutations in tumor suppressor genes, such as INK4A, CDKN2A, TRP53 (commonly referred to as P53), and DPC4/SMAD4 (Ryan et al., 2014). While the initiation and progression of PDAC has understandably been difficult to study in human patients or to model in human tissue (Boj et al., 2015), much has been learned from the ‘KC’ mouse model in which a Cre-inducible oncogenic Kras allele (KrasLSL-G12D) causes focal PanIN formation when activated universally in the pancreas (Aguirre et al., 2003; Hingorani et al., 2003; Murtaugh, 2014). Until recently, PDAC was primarily thought to originate from pancreatic ductal cells because of the cancer's duct-like epithelial phenotype. However, recent studies indicate that PanINs (De La et al., 2008; Habbe et al., 2008; Kopp et al., 2012) and PDAC (Ji et al., 2009) can be initiated by activating oncogenic KrasG12D expression specifically within mature acinar cells, while KrasG12D activation in adult duct cells or centroacinar cells has little or no effect. Interestingly, even in the KC mouse model, where embryonic Cre recombinase activity directs KrasG12D expression to nearly every cell of the mature pancreas, only a small number of acinar cells eventually give rise to PanINs. The mechanism by which most acinar cells remain refractory to KrasG12D-mediated transformation has not been elucidated. An attractive hypothesis is that the factors that induce and maintain acinar cell differentiation state play a crucial role in inhibiting the acinar cell reprogramming step that serves to initiate PDAC formation and progression (Rooman and Real, 2012; Bailey et al., 2014; Murtaugh, 2014).
Consistent with acinar cells as the cell of origin in PDAC, and acinar cell identity being a protective mechanism against KrasG12D-mediated transformation, recent genome-wide association studies identified PDAC risk-associated single-nucleotide polymorphisms in the non-coding region of the gene encoding the acinar differentiation transcription factor NR5A2, also known as LRH-1 (Petersen et al., 2010). These findings have been confirmed in mouse studies, where pan-pancreatic loss of Nr5a2 significantly sensitizes pancreatic cells to KRAS-induced PanIN initiation. Additionally, pancreatic Nr5a2 is necessary to regenerate the acinar compartment following caerulein-induced pancreatitis (Flandez et al., 2014; von Figura et al., 2014b). These studies begin to define how acinar cell differentiation programs may act as an important defense in a progressively severe sequence of events: loss of the mature acinar phenotype, PanIN initiation, and formation of PDAC.
In adult pancreata, NR5A2 maintains acinar cell identity by cooperating with the acinar-specific pancreas-specific transcription factor 1 (PTF1) complex, which has binding motifs upstream of essentially all acinar differentiation products, such as Cpa1, Cela1, and Cel (Holmstrom et al., 2011). The central specificity component of PTF1 is the cell type-restricted basic helix-loop-helix protein, PTF1A (also known as p48). PTF1A plays two distinct roles during pancreatic organogenesis. First, it is necessary for the growth and morphogenesis of the early pancreatic epithelium, working to impart multipotency and second, its upregulation and lineage-specific interaction with RBPJL promotes acinar differentiation and regulates acinar cell-specific gene expression in adulthood (Krapp et al., 1998; Rose et al., 2001; Kawaguchi et al., 2002; Masui et al., 2007, 2010; Holmstrom et al., 2011). Homozygous mutations in human PTF1A that disrupt its function or expression cause pancreatic agenesis, supporting its role in pancreas development (Sellick et al., 2004; Weedon et al., 2014). The severity of this phenotype, however, precludes analysis of PTF1A function in mature human acinar cells. Importantly, in the adult pancreas, PTF1A drives its own expression and that of other PTF1 components via a positive autoregulatory loop (Masui et al., 2008). Consistent with the central role of this transcription factor in defining and maintaining acinar cell identity, we have shown that PTF1A is downregulated in acinar cells transformed by KrasG12D and Notch activation (De La et al., 2008). Beyond these observations, however, a definitive role of PTF1A in regulating the pathogenesis of PDAC and other adult pancreatic pathology has not yet been described. Based on the studies described above, we hypothesized that loss of PTF1A is a necessary and sufficient step in acinar cell reprogramming, the initiation of PanINs, and the progression of PDAC.
In this study, we demonstrate that downregulation of PTF1A is a decisive and rate-limiting step in acinar-to-ductal metaplasia (ADM), PanIN initiation, and PDAC progression. Our findings suggest that PTF1A acts in a dosage-sensitive manner to safeguard the pancreatic acinar population against both oncogene activity and environmental insults, such as damage caused by pancreatitis. Our study is the first to establish that an endogenous, autoregulatory differentiation program protects mature pancreatic cells from cancer initiation.
Results
PTF1A expression is lost during KRAS-induced transformation of acinar cells and in human PanINs
We have previously demonstrated that Ptf1a expression is lost when activated Notch and KrasG12D work synergistically to reprogram acinar cells into PanINs (De La et al., 2008). Given that Ptf1a is a central regulator of acinar cell gene expression, we hypothesized that this transcription factor should also be downregulated when acinar cells are transformed by oncogenic KrasG12D alone, as well as in human PanINs. To test this hypothesis, we activated KrasG12D specifically in acinar cells using a tamoxifen-inducible Cre expressed by the endogenous Ptf1a locus (Ptf1aCreERT) (Kopinke et al., 2012; Pan et al., 2013). Like the widely used Ptf1aCre allele (Kawaguchi et al., 2002), Ptf1aCreERT is a ‘knock-in/knock-out’ allele, and therefore, these mice are functionally heterozygous for Ptf1a. We induced KrasG12D expression at 6 weeks of age and harvested pancreata 9 months later. While most acini appeared histologically normal and resistant to KRAS-mediated transformation (Figure 1A), there was intermittent PanIN formation throughout the pancreas (Figure 1B), as previously reported (Kopp et al., 2012). By immunohistochemistry (IHC), normal acinar cells in these tissues exhibited robust nuclear PTF1A (Figure 1C); however, PTF1A was strongly decreased or absent in all acinar-derived PanIN lesions (Figure 1D). To extend these studies to human pancreatic cancer initiation, we stained pathological specimens (n = 4) containing both normal acinar tissue (Figure 1E) and PanIN lesions (Figure 1F). As observed in the KrasG12D mouse model, normal acini exhibited a strong PTF1A nuclear signal (Figure 1G), but PTF1A was largely absent from epithelial cell nuclei within PanINs (Figure 1H). In a small fraction of human PanINs, low levels of PTF1A were observed in a subset of epithelial cells (Figure 1—figure supplement 1). Residual PTF1A expression is consistent with the finding that approximately one-third of human PDAC samples express low levels of acinar-specific genes (Collisson et al., 2011).
Figure 1 with 1 supplement see all
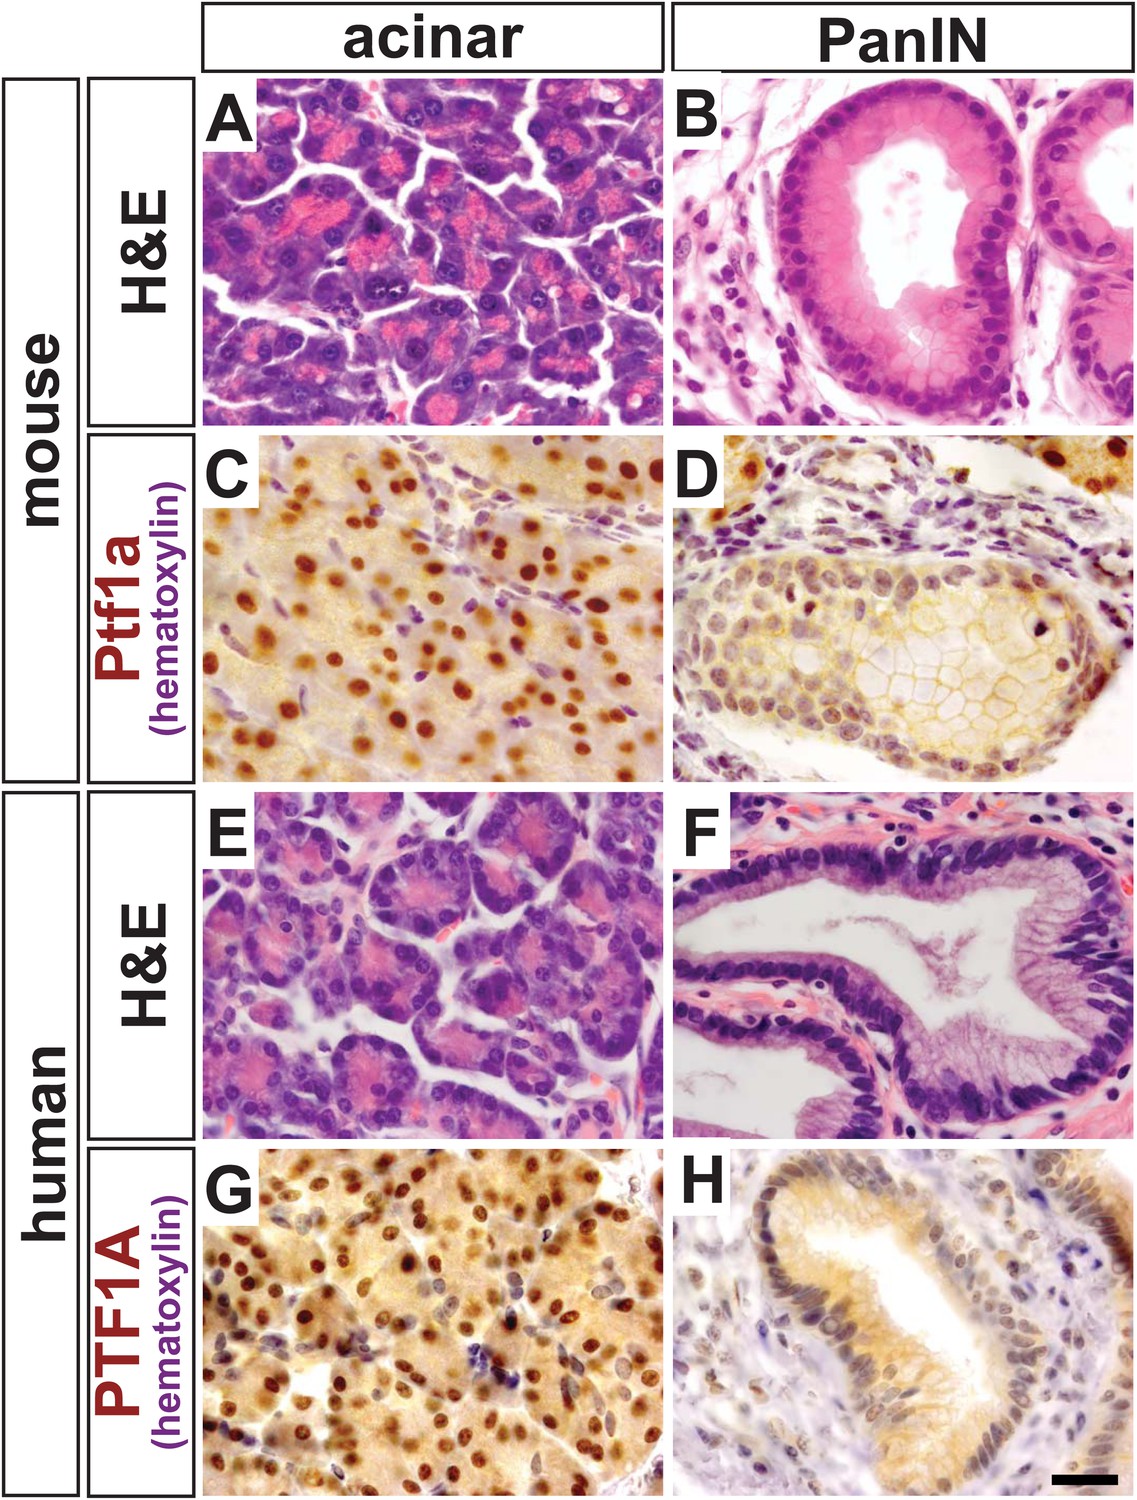
PTF1A is downregulated in PanINs from mice and humans.
(A, B) H&E staining of normal acinar and pancreatic intraepithelial neoplasia (PanIN) tissue of Ptf1aCreERT; KrasLSL-G12D pancreata. (C, D) PTF1A immunohistochemistry (IHC) of mouse acinar and PanIN tissue. (E, F) H&E staining of human acinar and PanIN tissue. (G, H) PTF1A immunostaining of normal acinar and PanIN tissue of human. Scale bar: 25 µm.
Deletion of Ptf1a causes acinar-ductal metaplasia and dramatically enhances KRAS-driven acinar cell transformation
In order to determine whether PTF1A downregulation was a functionally important step in PanIN initiation, or a side effect of acinar cell transformation itself, we used an inducible system to delete Ptf1a both in the absence and presence of oncogenic KrasG12D. In this model, we combined the Ptf1aCreERT allele, which does not express PTF1A protein, with a ‘floxed’ Ptf1a allele, to generate Ptf1a conditional knock-out (cKO) mice of the genotype Ptf1aCreERT/lox. We also crossed KrasLSL-G12D onto this Ptf1a cKO background. Negative control littermates were Ptf1a heterozygous (Ptf1aCreERT/+) without oncogenic Kras. An additional control group, representing baseline PanIN initiation in the presence of wild-type PTF1A, consisted of Ptf1aCreERT/+; KrasLSL-G12D littermates (henceforth referred to as KrasG12D mice). All inducible-Cre mice also contained a R26REYFP reporter (Srinivas et al., 2001), which allowed monitoring of the frequency of Cre-mediated recombination and lineage-tracing of the fate of recombined acinar cells. Table 1 summarizes the genotypes of mice used throughout this study; Figure 2—figure supplement 1 schematically depicts the alleles in each genotype.
Table 1
Nomenclature of mouse mutants used in this study
| Short-hand notation | Ptf1a alleles | Kras allele | Reporter allele |
|---|---|---|---|
| Control | Ptf1aCreERT/+ | – | R26REYFP/+ |
| Ptf1a cKO | Ptf1aCreERT/lox | – | R26REYFP/+ |
| KrasG12D | Ptf1aCreERT/+ | KrasLSL-G12D/+ | R26REYFP/+ |
| Ptf1a cKO; KrasG12D | Ptf1aCreERT/lox | KrasLSL-G12D/+ | R26REYFP/+ |
-
cKO, conditional knock-out.
In initial studies, 6- to 8-week-old mice were administered tamoxifen (TM) at 0.17 mg/g body weight, and pancreata were harvested 9 months later (Figure 2A). Compared with control samples, Ptf1a cKO pancreata exhibited intermittent ADM throughout the pancreas (Figure 2B,C). Metaplastic ‘ductules’ of Ptf1a cKO expressed Cytokeratin-19 (CK19), similar to normal ducts of control; however, Ptf1a cKO ductules appeared more dilated than control ducts (Figure 2F,G). Ptf1a cKO ductules also expressed the duct cell-restricted transcription factor SOX9 (Figure 2J,K), indicating a shift from an acinar to a duct-like differentiation state (Kopp et al., 2012). However, these metaplastic ductules did not have the histological morphology of PanINs (Figure 2C), nor did they stain positively for the PanIN-specific markers Claudin-18 (CLDN18) by IHC (Westmoreland et al., 2012) (Figure 2O) or acidic mucins by Alcian Blue histochemistry (Hingorani et al., 2003; Kopp et al., 2012) (Figure 2S). Interestingly, ADM in Ptf1a cKO mice was associated with no or scant inflammatory infiltrates, and the surrounding areas did not stain positively with Sirius Red (Figure 2W), a histochemical stain that highlights fibrotic collagen matrix (Neuschwander-Tetri et al., 2000).
Figure 2 with 2 supplements see all
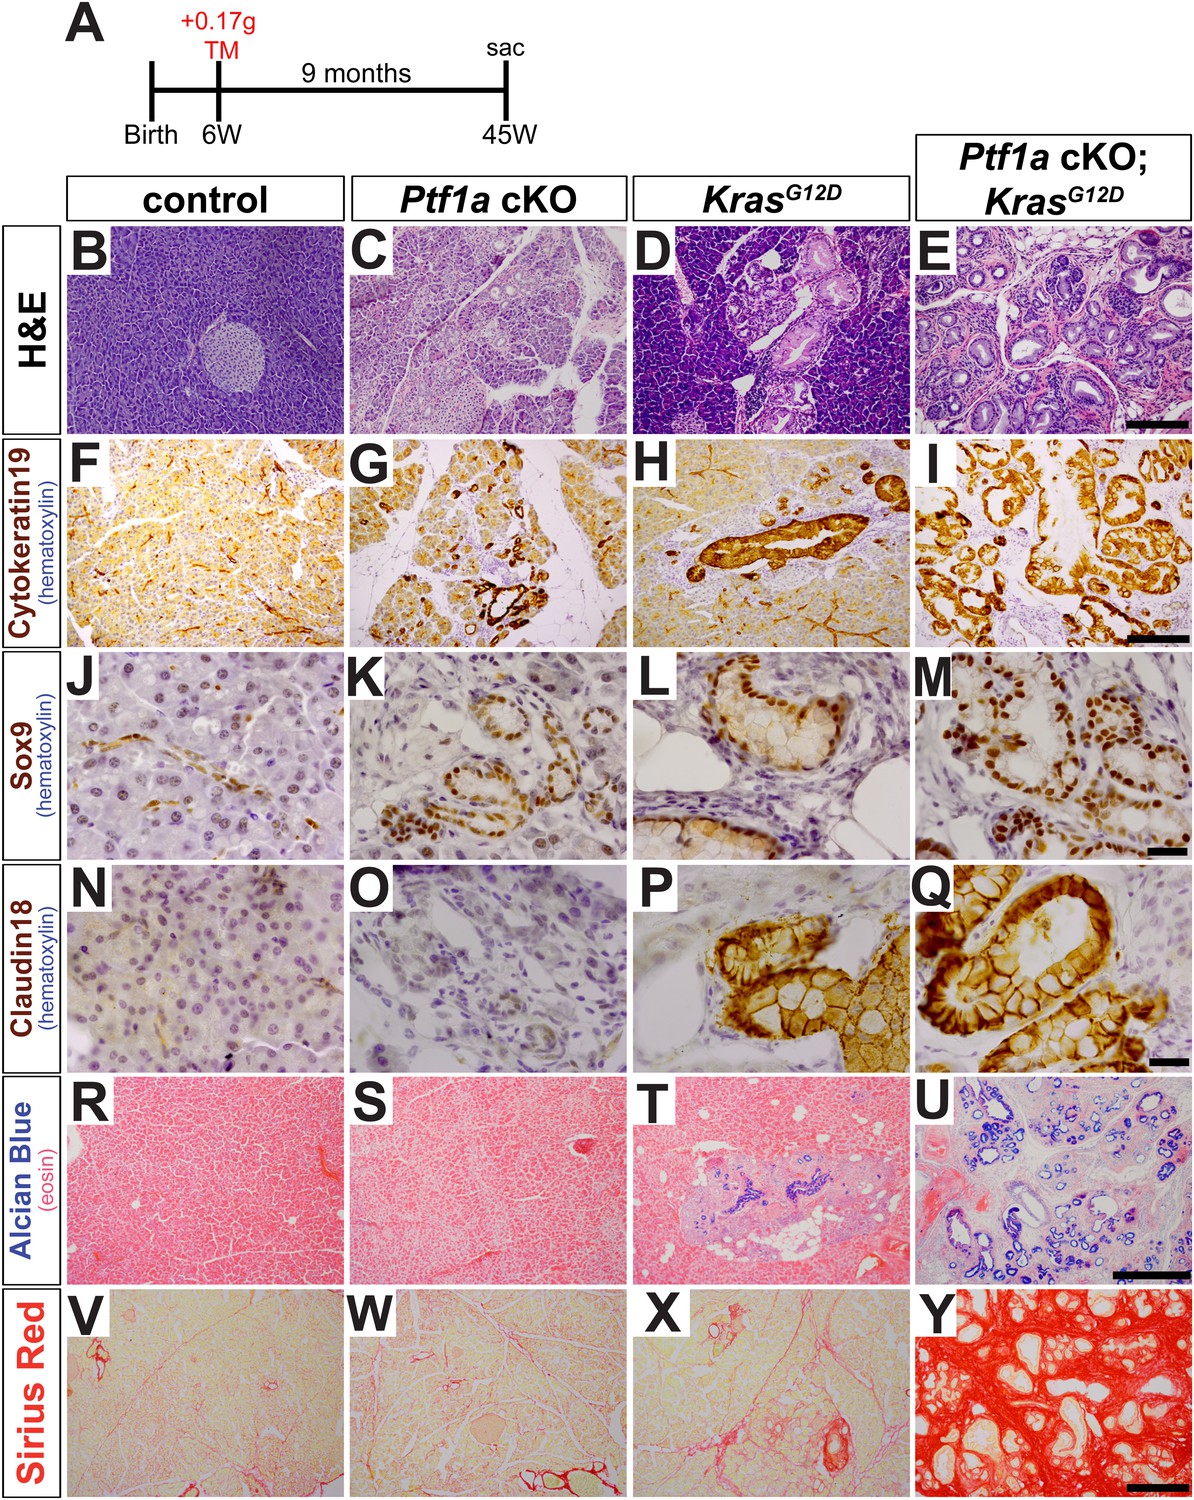
Loss of Ptf1a promotes acinar-to-ductal metaplasia and sensitizes acinar cells to KRAS-mediated transformation.
(A) Mice of indicated genotypes were administered TM (0.17 mg/g) to induce recombination, and sacrificed 9 months later. (B–E) H&E staining of pancreata from mice of indicated genotypes. (F–M) IHC for the duct markers CK19 and SOX9, indicating upregulation in both acinar-to-ductal metaplasia (ADM) and PanINs. (N–Q) IHC for the PanIN marker, CLDN18, highlighting intermittent PanIN formation in KrasG12D mice and widespread lesion development in Ptf1a conditional knock-out (cKO); KrasG12D. (R–U) Alcian Blue staining, indicating PanIN lesions in KrasG12D and Ptf1a cKO; KrasG12D pancreata. (V–Y) Sirius Red staining, highlighting local and widespread fibrosis in KrasG12D and Ptf1a cKO; KrasG12D mice, respectively. Scale bars: (B–E) 200 µm; (F–I) 200 µm; (J–Q) 25 µm; (R–U) 500 µm; (V–Y) 200 µm.
We next tested if inactivation of Ptf1a sensitized acinar cells to oncogenic KRAS-mediated transformation and PanIN initiation. While intermittent PanIN formation was observed in KrasG12D mice (Figure 2D), pancreata from Ptf1a cKO; KrasG12D mice were uniformly composed of extensively distributed PanINs embedded in fibrotic stroma, with almost no remaining normal acinar tissue (Figure 2E). PanINs in both KrasG12D and Ptf1a cKO; KrasG12D mice were positive for the duct marker Cytokeratin-19 (Figure 2H,I) and the duct-cell transcription factor SOX9 (Figure 2L,M), as well as the PanIN markers CLDN18 (Figure 2P,Q) and Alcian Blue acidic mucin staining (Figure 2T,U). Interestingly, only the Ptf1a cKO; KrasG12D pancreata exhibited abundant Sirius Red staining, indicating widespread fibrotic injury (Figure 2X,Y). Taken together, these data indicate that loss of Ptf1a sensitizes acinar cells to ADM and dramatically increases their susceptibility to oncogenic KRAS transformation and PDAC initiation.
Loss of Ptf1a expression is a rate-limiting step for PanIN initiation
Given the severity and robustness of PanIN formation in Ptf1a cKO; KrasG12D mice 9 months after TM administration, we next determined if loss of Ptf1a had a more acute effect on acinar cell transformation. To address this issue, 6- to 8-week-old mice were administered TM (0.17 mg/g) and pancreata were harvested 2 or 6 weeks thereafter (Figure 3A). To ensure that Cre-mediated recombination rates were comparable between genotypes, we determined the percentage of acinar cells expressing the R26REYFP reporter at 2 weeks post-TM administration. We found similar acinar recombination rates of 21–25% between genotypes (Figure 2—figure supplement 1). As the efficiency of Cre-mediated recombination can vary between different target loci (Liu et al., 2013), we additionally compared the extent and distribution of PTF1A ablation to that of R26REYFP activation. 3 days after TM administration (0.17 mg/g), there was a ∼20% decrease in the number of PTF1A+ cells detected by immunofluorescence (Figure 2—figure supplement 2). Importantly, the majority (∼75%) of EYFP+ cells were PTF1A-negative at this dose of TM (Figure 2—figure supplement 2), indicating that activation of EYFP provides an approximate surrogate for deletion of Ptf1a.
Figure 3 with 2 supplements see all
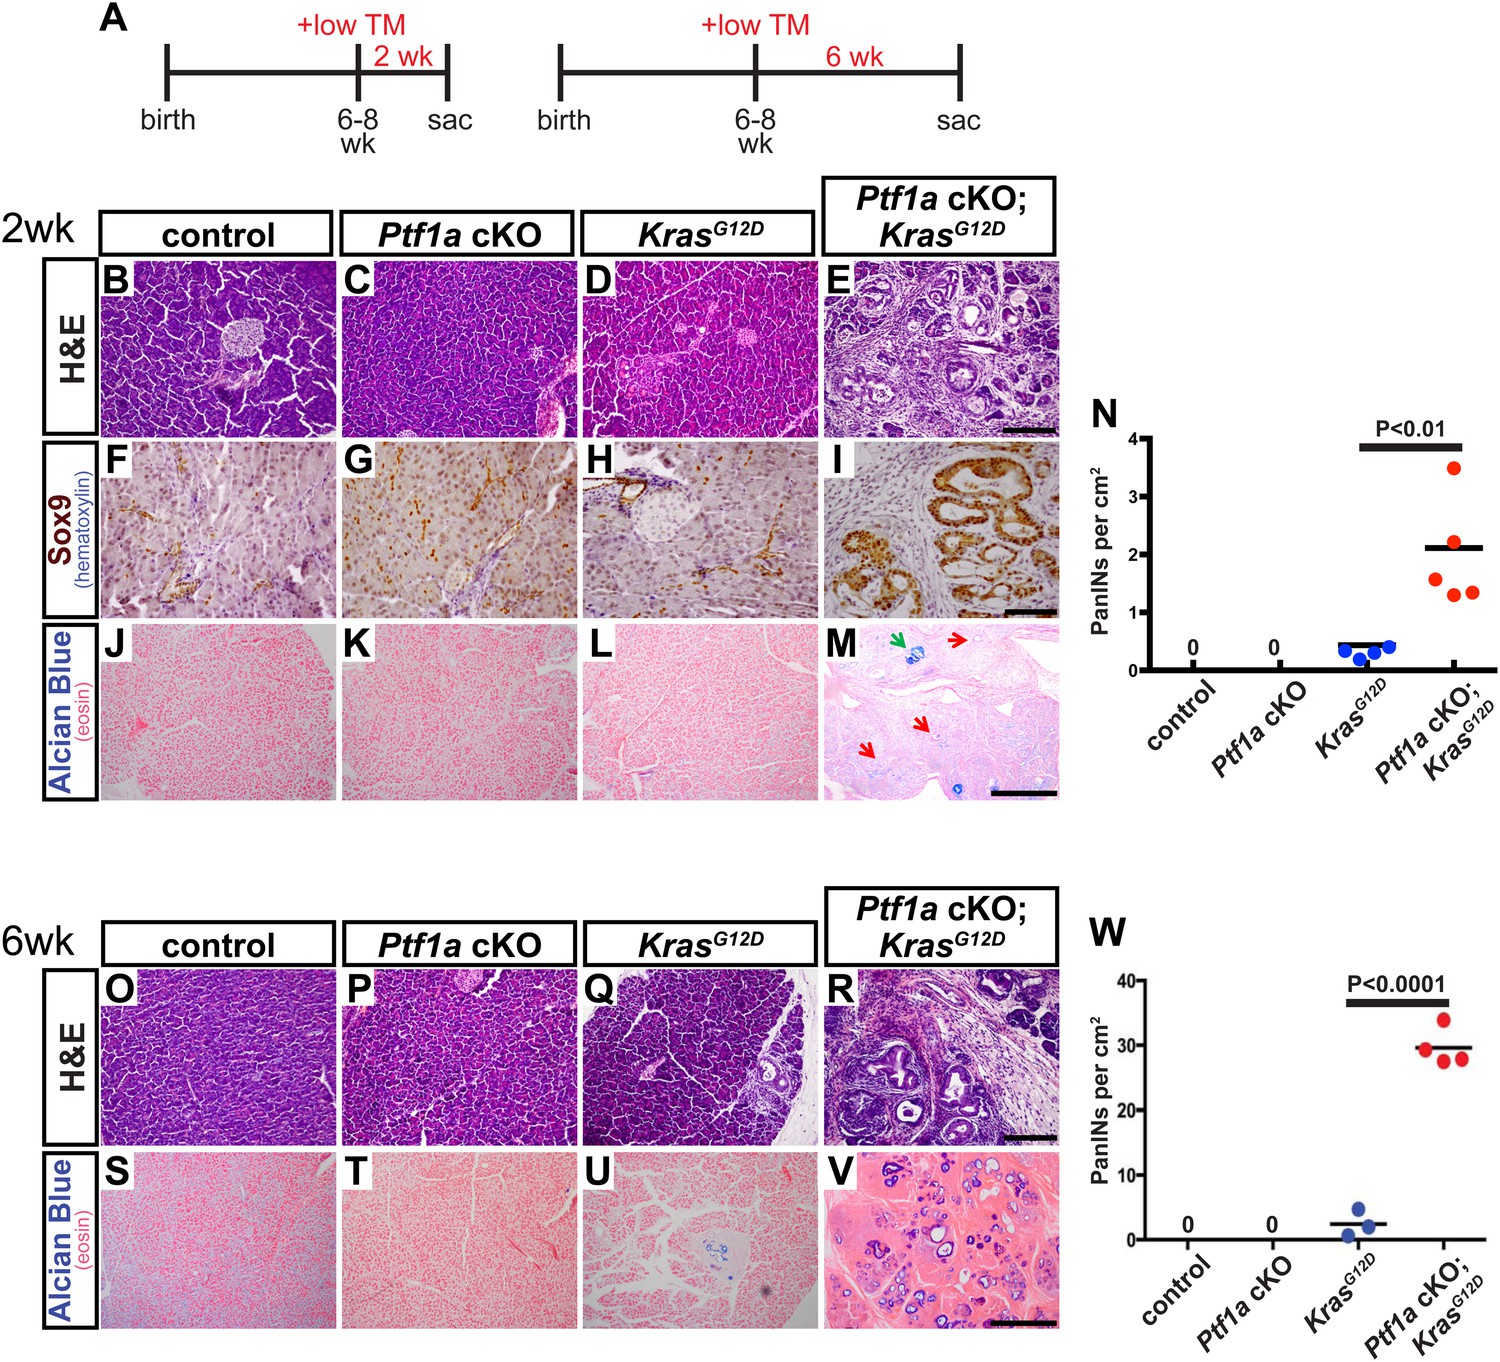
Loss of Ptf1a is a rate-limiting step in PanIN initiation.
(A) Mice of specified genotypes were administered 0.17 mg/g body weight TM to induce Cre-mediated recombination and were sacrificed either 2 or 6 weeks later. (B–E) H&E staining of pancreata from mice of indicated genotypes 2 weeks after TM administration. (F–I) IHC for the ductal transcription factor SOX9, indicating upregulation in ADM and PanINs of Ptf1a cKO; KrasG12D pancreata. (J–M) Alcian blue staining, indicating PanIN lesions in Ptf1a cKO; KrasG12D pancreata. In panel (M), green arrow indicates an Alcian Blue+ lesion, while red arrows indicate ADM that is Alcian Blue-negative. (N) Quantification of the genotype-dependent PanIN burden; Ptf1a cKO; KrasG12D pancreata possessed significantly more PanINs at 2 weeks post-TM than KrasG12D mice (p < 0.01). (O–R) H&E staining of pancreata from mice of indicated genotypes 6 weeks after TM administration. (S–V) Alcian Blue staining, highlighting PanIN lesions in pancreata from KrasG12D mice and Ptf1a cKO; KrasG12D mice. (W) Quantification of PanINs at 6 weeks post-TM. Ptf1a cKO; KrasG12D pancreata had ∼15-fold more Alcian Blue+ PanINs at this time point than KrasG12D (p < 0.0001). Scale bars: (B–E) 200 µm; (F–I) 100 µm; (J–M) 500 µm; (O–R) 200 µm; (S–V) 500 µm.
Interestingly, this level of Ptf1a deletion alone did not produce ADM or other histologically detectable effects at 2 weeks post-TM, compared to control mice (Figure 3B,C). While KrasG12D pancreata exhibited few or no PanINs at this time point, there was widespread induction of ADM, leukocyte infiltration, fibrosis, and PanIN initiation in Ptf1a cKO; KrasG12D pancreata (Figure 3D,E and Figure 3—figure supplement 1). We further confirmed that acinar-derived ADM and PanINs were being reprogrammed to a duct-like fate based on expression of the ductal transcription factor SOX9. While only normal ducts expressed SOX9 in control pancreata, PanINs and ADM in Ptf1a cKO; KrasG12D were SOX9+ at 2 weeks post-TM (Figure 3F–I). These data are consistent with a recent study indicating that Sox9 is necessary but not sufficient for the earliest stages of mouse PanIN initiation (Kopp et al., 2012).
To quantify lesion burden, we stained pancreata from all genotypes with Alcian Blue to highlight acidic mucin-rich PanINs (Figure 3J–M). Following a counting procedure established in our lab (De La et al., 2008), we observed a ∼sixfold increase in the frequency of PanINs in Ptf1a cKO; KrasG12D mice compared to mice expressing KrasG12D alone (Figure 3N). This is likely an underestimation of overall phenotypic change, since ADM, which precedes PanIN formation, does not stain with Alcian Blue. Based on histological inspection, ADM is widespread in Ptf1a cKO; KrasG12D mice at 2 weeks post-TM, but negligible in KrasG12D pancreata (Figure 3D,E,L,M).
Initiation and progression of PDAC involves interactions between KRAS-active epithelial cells and their stromal microenvironment, with local inflammation being commonly associated with more rapid tumorigenesis (Gukovsky et al., 2013). We observed that PanINs developing after 2 weeks in Ptf1a cKO; KrasG12D mice, identified by CLDN18 staining, were consistently surrounded by CD45+ leukocytes, indicating interactions between transformed epithelial cells and inflammatory cells (Figure 3—figure supplement 1). Because activation of pancreatic stellate cells is a hallmark of PDAC, we assessed the activation state of these cells using the marker α-smooth muscle actin (SMA). While SMA-positive cells were observed around blood vessels in pancreata of all genotypes, lobules of Ptf1a cKO; KrasG12D pancreata affected by ADM and PanIN initiation exhibited widespread SMA+ fibroblasts surrounding ADM and PanIN lesions (Figure 3—figure supplement 1). Staining with the fibrosis marker Sirius Red confirmed that PanIN-associated fibroblasts of Ptf1a cKO; KrasG12D pancreata were actively secreting collagenous matrix (Figure 3—figure supplement 1), indicating activation of stellate cells only 2 weeks after Cre-mediated recombination. The activation of stellate cells and fibrotic phenotype observed in Ptf1a cKO; KrasG12D pancreata (Figure 3—figure supplement 1) is likely a reaction to the high level of acinar cell transformation rather than a direct reaction to Ptf1a deletion itself, as Ptf1a cKO pancreata with ADM do not stain with Sirius red (Figure 2V).
In order to determine the acinar cell-intrinsic consequences of Ptf1a deletion, we used a 3D culture system in which acini can undergo metaplasia into ductal cysts in response to mutant Kras or EGF receptor (EGFR) ligand stimulation, without the influence of other cell types (Means et al., 2005; Ardito et al., 2012). To induce widespread, acinar-specific Kras activation and/or Ptf1a deletion, we treated mice with three daily doses of tamoxifen at 0.25 mg/ml, a treatment paradigm that we found to drive widespread recombination (see below). Acinar cell clusters from control, Ptf1a cKO, KrasG12D, and Ptf1a cKO; KrasG12D were isolated at 3 days after the final TM dose, prior to the appearance of any histological abnormalities, and embedded in a collagen matrix, as previously described (Means et al., 2005; Ardito et al., 2012). Neither control nor Ptf1a cKO acinar clusters underwent spontaneous cyst conversion, in the absence of added growth factors, implying that loss of Ptf1a is not sufficient for acinar-ductal reprogramming. As expected, acini of both genotypes generated CK19+ ductal cysts in response to the EGFR ligand TGFα (data not shown). By contrast, KrasG12D activation was sufficient for generation of acinar-derived cysts; importantly, Ptf1a cKO; KrasG12D acini formed significantly larger cysts than those derived from KrasG12D pancreata (Figure 3—figure supplement 2). These results are consistent with our in vivo data and suggest that acinar cell loss of Ptf1a enhances KRAS-mediated transformation independent of effects on the stromal microenvironment.
A generally similar synergy between KrasG12D and Ptf1a cKO was observed in vivo at the 6-week post-tamoxifen time point. Ptf1a cKO pancreata remained histologically unchanged compared to control, as at 2 weeks post-TM, while intermittent PanIN-1 lesions were observed in KrasG12D pancreata (Figure 3O–Q). Ptf1a cKO; KrasG12D pancreata, by contrast, were completely overrun by PanINs at this time point (Figure 3R), most of which stained positively with Alcian Blue (Figure 3V). Quantifying PanIN lesions by Alcian Blue staining, we observed a >15-fold increase in Ptf1a cKO; KrasG12D compared to mice expressing KrasG12D alone (Figure 3W). As we did not score more than one lesion per individual anatomic lobule, to avoid double-counting large or discontinuous lesions, this number likely underestimates the overall PanIN burden in Ptf1a cKO; KrasG12D pancreata given the likelihood of multiple initiation events per lobule. Altogether, the dramatic acceleration of PanIN development upon Ptf1a deletion suggests that downregulation of this TF is a rate-limiting step for KRAS-driven pancreatic tumorigenesis.
Extensive deletion of Ptf1a promotes rapid but incomplete acinar-ductal metaplasia
As we were surprised that a moderate level of acinar cell recombination (∼25%) failed to produce an overt, short-term phenotype in Ptf1a cKO pancreata (Figure 3), we tested if more pervasive deletion of Ptf1a would produce a more robust reprogramming phenotype. Control and Ptf1a cKO mice were administered a higher dose of TM (0.25 mg/g) by oral gavage on three consecutive days (a net 4.5-fold higher dose than previously) and were harvested 2 weeks later (Figure 4A). Quantification of EYFP+ acinar cells following this TM regimen demonstrated a recombination frequency of ∼65% (Figure 4—figure supplement 1). Additionally, we quantified the number of PTF1A-deficient acinar cells at 3 days after the final TM gavage, and found that only ∼15% of all pancreatic cells retained nuclear PTF1A, compared with ∼82% in TM-untreated controls (Figure 2—figure supplement 2). As with low-dose TM, described above, the majority (>90%) of EYFP+ cells were PTF1A-negative at 3 days post-TM, confirming that EYFP expression highlights acinar cells deleted for Ptf1a (Figure 2—figure supplement 2). The apparently greater extent of PTF1A ablation, relative to EYFP activation, may imply the existence of Ptf1a-deleted cells within the EYFP-negative population; such an observation would be consistent with previous evidence of locus-specific Cre deletion efficiencies (Liu et al., 2013).
Figure 4 with 3 supplements see all
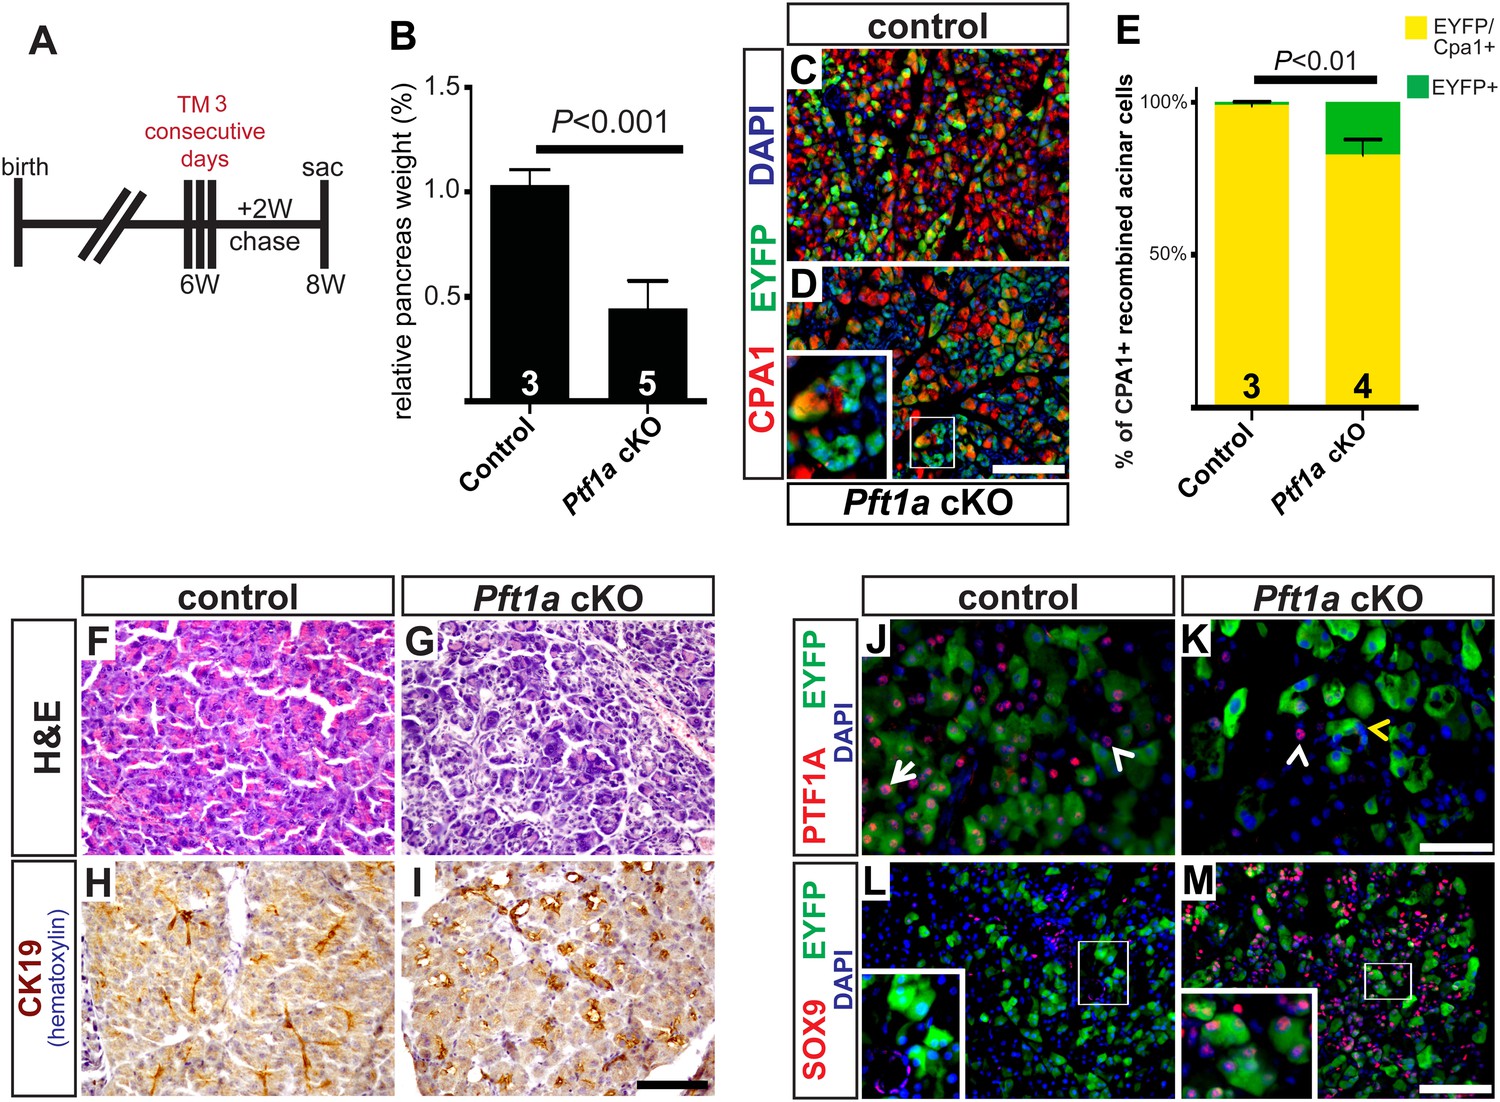
Widespread loss of Ptf1a promotes rapid acinar-to-ductal metaplasia.
(A) Control and Ptf1a cKO mice were administered TM (0.25 mg/g) on three consecutive days and sacrificed following a 2-week chase period. (B) Pancreas mass, measured as a percent of body weight, was significantly decreased in Ptf1a cKO mice 2 weeks after TM administration. (C, D) Immunofluorescence for the acinar enzyme carboxypeptidase A1 (CPA1) (red) and Cre reporter R26REYFP (green). Nuclei are labeled with DAPI (blue). Inset highlights EYFP+, CPA1-negative acinar cells forming duct-like structures in Ptf1a null pancreata. (E) Quantification of CPA1 expression by EYFP+ (Cre-recombined) cells in control and Ptf1a cKO pancreata (control n = 3, Ptf1a cKO n = 4, p < 0.01). (F, G) H&E staining of control and Ptf1a cKO pancreata 2 weeks after high-dose TM administration. (H, I) IHC for the duct marker CK19 highlighting areas of ADM in Ptf1a cKO pancreata. (J, K) Immunofluorescence for PTF1A (red) and the Cre reporter R26REYFP (green). White arrow indicates an EYFP+ cell expressing PTF1A in control; white arrowheads indicate non-recombined PTF1A+ cells; yellow arrowhead indicates a recombined, PTF1A-negative cell undergoing metaplasia in Ptf1a cKO. (L, M) Immunofluorescence for the duct transcription factor SOX9 (red) and the Cre reporter R26REYFP (green). Insets highlight restricted expression of SOX9 in controls and upregulation of SOX9 within EYFP+ acinar cells of Ptf1a cKO. Scale bars: (C, D) 100 µm, (F–I) 200 µm, (J, K) 50 µm, (L, M) 100 µm.
2 weeks following high-dose TM, Ptf1a cKO pancreata were less than half the mass of their control counterparts (Figure 4B). Immunofluorescence revealed that while nearly all EYFP+ acinar cells expressed the acinar marker carboxypeptidase A1 (CPA1) in controls, this marker was lost from approximately 15% of EYFP+ cells in Ptf1a cKO tissues, indicating loss of the normal differentiation state (Figure 4C–E). Histologically, Ptf1a cKO pancreata exhibited extensive acinar disorganization and dilation as well as sporadic upregulation of CK19 within acinar structures, suggestive of early stages of ADM (Figure 4F–I). CK19+ acinar cells (defined by EYFP co-expression) were consistently surrounded by CD45+ leukocytes (Figure 4—figure supplement 2A–C), consistent with an intimate association between metaplasia and inflammatory cell recruitment (Liou et al., 2013; Murtaugh and Keefe, 2015). Nonetheless, Ptf1a cKO pancreata did not exhibit a general pancreatitis phenotype (Figure 4—figure supplement 2A–C) nor did they exhibit a detectable increase in epithelial cell apoptosis (Figure 4—figure supplement 2D–F). In addition, we found that treatment of wild-type mice with high-dose TM was not sufficient to induce pancreatic inflammation (Figure 4—figure supplement 3), suggesting that the stronger phenotype of high-dose Ptf1a cKO mice, relative to low-dose, was not due to stimulation of ADM by non-specific tissue damage.
Loss of PTF1A was accompanied by upregulation of SOX9 by the majority of EYFP+ cells, indicating partial reprogramming to a duct-like state (Figure 4J–M). Surprisingly, we also observed a significant (∼fourfold) increase in the fraction of Ki67+ epithelial cells in Ptf1a cKO pancreata compared with control, suggesting that loss of PTF1A results in deregulation of proliferation as well as differentiation (Figure 4—figure supplement 2G–I). Taken together, these data indicate that Ptf1a is required to maintain acinar gene expression and quiescence, as well as prevent metaplasia to a duct-like state, potentially by inhibiting upregulation of SOX9.
Loss of Ptf1a activates KRAS-dependency and fibroinflammatory pathways
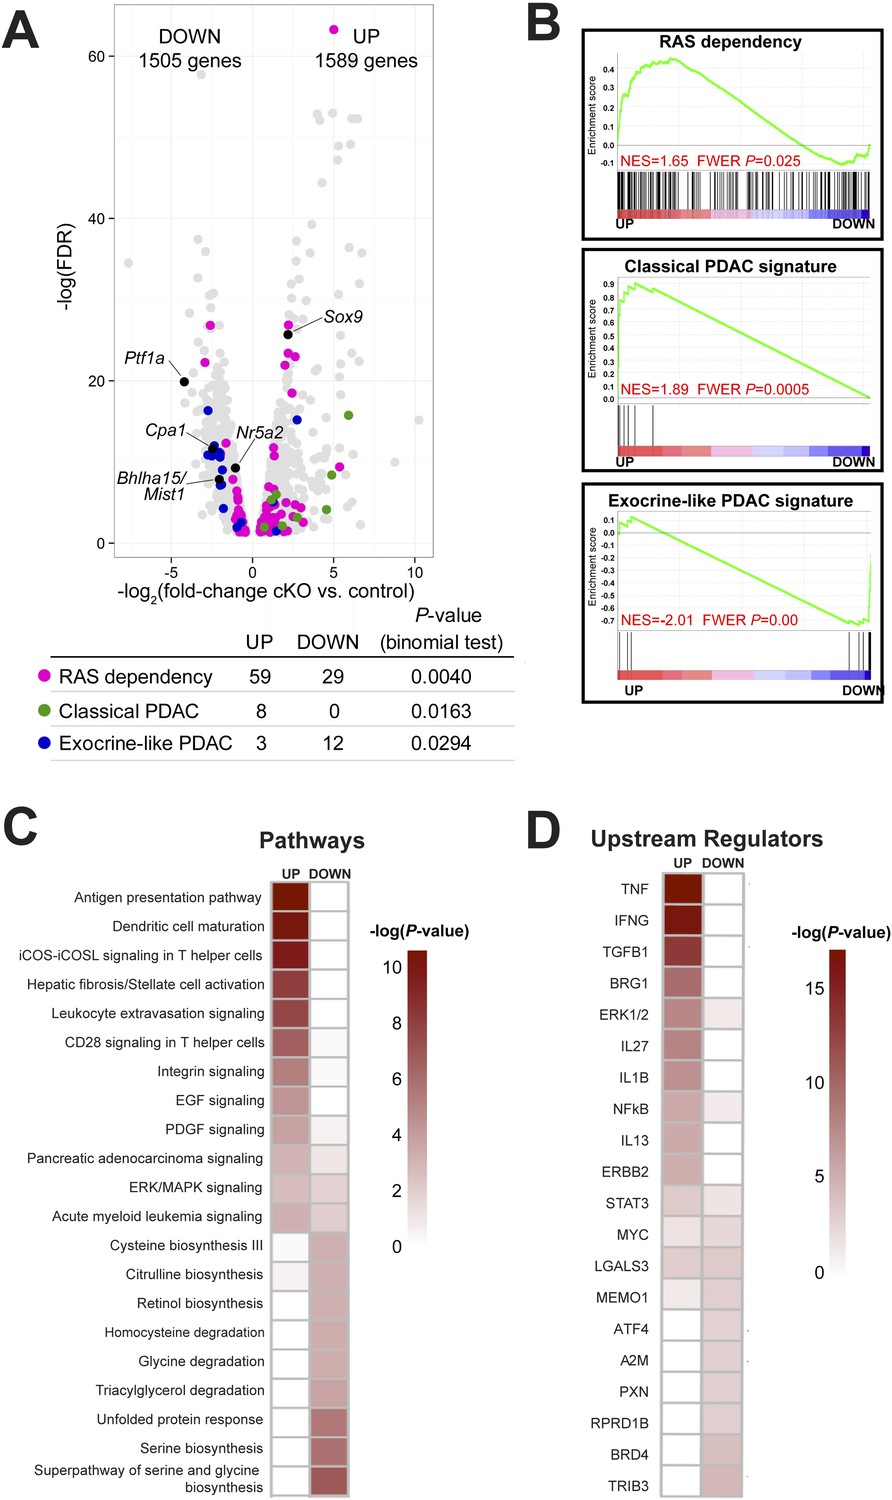
In order to investigate further the mechanism of ADM after loss of Ptf1a, we performed RNA-seq on whole pancreata from three control and three Ptf1a cKO mice, each of which received three doses of TM (0.25 mg/g) to induce maximal recombination 2 weeks prior to RNA extraction. Initial analysis of RNA-seq data sets by edgeR (Robinson et al., 2010), setting a false discovery rate (FDR) threshold of 0.05, identified significant changes in expression of over 3000 total genes (Figure 5A). Consistent with our immunostaining (Figure 4), among the most significantly downregulated mRNAs were Ptf1a (18.4-fold) and Cpa1 (5.45-fold), while Sox9 was significantly upregulated (4.61-fold) in Ptf1a cKO pancreata (Figure 5A). Additional downregulated mRNAs included a wide variety of digestive enzymes and other secreted proteins characteristic of the exocrine acinar phenotype, consistent with the long-standing hypothesis that they are directly regulated by PTF1A (Rose et al., 2001; MacDonald et al., in preparation).
Figure 5
Ptf1a suppresses fibroinflammatory pathways and oncogenic KRAS associated gene signatures.
(A) Volcano plot showing differentially expressed genes (false discovery rate [FDR] <0.05; gray) in Ptf1a cKO pancreata, relative to control. Individual genes are labeled and highlighted in black. Genes belonging to signatures characteristic of RAS dependency, classical and exocrine-like pancreatic ductal adenocarcinoma (PDAC) are highlighted in pink, green, and blue, respectively. Table below indicates p-values from binomial test for enrichment of gene signatures within up- or down-regulated genes. (B) Gene Set Enrichment Analysis (GSEA) enrichment plots of differentially expressed genes between Ptf1a cKO and control indicating positive enrichment of RAS dependency and classical PDAC signatures and negative enrichment of exocrine-like PDAC signature genes. (C, D) Ingenuity Pathway Analysis (IPA, Qiagen Redwood City, www.qiagen.com/ingenuity) was used to identify differentially expressed pathways and upstream regulators in Ptf1a cKO pancreata. (C) Heat map of pathways that are significantly increased and decreased upon Ptf1a deletion. (D) Heat map of upstream pathways and regulators predicted to drive the observed changes in gene expression. Color scale is indicative of the -log p-value (significance). All analyses are based on a ±2.0-fold expression threshold. Full details of the data set and analyses can be found in the supplementary data files.
Given our finding that loss of Ptf1a strongly potentiates KRAS-induced PanIN initiation (Figures 2, 3), we analyzed the expression of genes previously implicated in KRAS signaling and PDAC development. Interestingly, tumor suppressors classically associated with PDAC, such as p53 (Trp53), Cdkn2a/Ink4a, Pten, Brca2, and Smad4, were not significantly downregulated in the absence of Ptf1a (data not shown), leading to the notion that the susceptibility of Ptf1a cKO pancreata to KRAS involves a novel mechanism distinct from canonical tumor suppression pathways. By contrast, we found that two acinar-specific transcription factors previously implicated in suppressing PanIN development, Bhlha15 (commonly referred to as Mist1) and Nr5a2 (Shi et al., 2009b; Flandez et al., 2014; von Figura et al., 2014b), were downregulated in Ptf1a cKO mice, consistent with PTF1A acting at or near the top of a regulatory hierarchy responsible for maintaining acinar identity and suppressing tumorigenesis (Figure 5A).
In human cell lines derived from pancreatic and other cancers, dependence on KRAS signaling correlates with expression of specific gene signatures, including genes whose activity is required to sustain RAS activity and malignancy (Singh et al., 2009; Loboda et al., 2010). We found that previously identified RAS dependence genes were significantly enriched, by binomial test, among mRNAs upregulated in Ptf1a cKO tissue (Figure 5A). Within this signature were some of the most highly upregulated mRNAs in our data set, such as Tspan1 (32.4-fold increase), Slc1a2 (62.2-fold increase), Fut2 (41.4-fold increase), and Egr1 (6.2-fold increase) (Supplementary files 1, 2). The preferential upregulation of RAS dependency genes in Ptf1a cKO was confirmed by Gene Set Enrichment Analysis (GSEA) (Subramanian et al., 2005) (Figure 5B), and suggests that loss of PTF1A results in a phenotypic shift toward a KRAS-permissive phenotype. RAS dependency is characteristic of human PDAC cell lines and primary tumors with a ‘classical’, duct-enriched gene expression profile (Collisson et al., 2011). We find that the classical PDAC signature is also preferentially upregulated upon Ptf1a deletion, while the distinct ‘exocrine-like’ PDAC signature, largely comprising acinar-specific secreted proteins, is downregulated (Figure 5A,B). These results therefore strongly suggest not only that PTF1A maintains acinar differentiation, including expression of genes marking an acinar-like subset of human PDAC, but also that PTF1A suppresses an alternative gene expression program that facilitates KRAS signaling activity.
To identify biological pathways that were activated or attenuated by Ptf1a deletion, we analyzed this RNA-seq data set using Qiagen's Ingenuity Pathway Analysis (IPA, QIAGEN Redwood City, www.ingenuity.com) (Thomas and Bonchev, 2010; Kramer et al., 2014). We analyzed canonical pathways using three different thresholds of gene expression (1.5-fold up/downregulation, 2.0-fold up/downregulation, and 3.0-fold up/downregulation; Supplementary files 3–5). At an upregulation threshold of 2.0, deletion of Ptf1a significantly affected over 300 pathways, several of which have an established role in PDAC initiation. These included T-helper cell-signaling pathways (McAllister et al., 2014), stellate-cell activation and fibrosis (Sherman et al., 2014), and epidermal growth factor (EGF) signaling (Ardito et al., 2012; Navas et al., 2012) (Figure 5C). A general ‘pancreatic adenocarcinoma signaling’ pathway was also upregulated, consisting primarily of genes involved in PI-3-kinase and JAK/STAT signaling. We also used IPA Upstream Regulator Analysis to predict upstream signaling mediators that could explain the changes in gene expression within our data set (Kramer et al., 2014). The predicted upregulated mediators were consistent across multiple expression thresholds and included TNF-α, TGF-β, IL-1β, NFκB, and the SWI/SNF component Smarca4/Brg1 (Figure 5D). All of these signaling pathways have been implicated in PDAC initiation and progression (Bardeesy et al., 2006; Adrian et al., 2009; Khasawneh et al., 2009; Maniati et al., 2011; Daniluk et al., 2012; Maier et al., 2013; Gore et al., 2014; von Figura et al., 2014a). Thus, we propose that loss of Ptf1a alters cell state at multiple levels, ultimately promoting gene expression and signaling activities that are supportive of KRAS transformation.
Caerulein-induced pancreatitis is sufficient to reprogram Ptf1a-deficient acinar cells
Among the upstream mediators activated in the Ptf1a cKO model are TNF-α and NFkB, both of which promote ADM and inflammation in pancreatitis and amplify KRAS activity in pancreatic tumorigenesis (Maniati et al., 2011; Daniluk et al., 2012; Huang et al., 2013; Maier et al., 2013; Sendler et al., 2013). As Ptf1a deletion upregulates other pathways characteristic of pancreatic injury, such as stellate-cell activation, TGF-β signaling, and dendritic cell maturation (Bedrosian et al., 2011; Erkan et al., 2012), we were interested to determine if loss of Ptf1a would sensitize acinar cells to injury-induced reprogramming even without oncogenic KRAS.
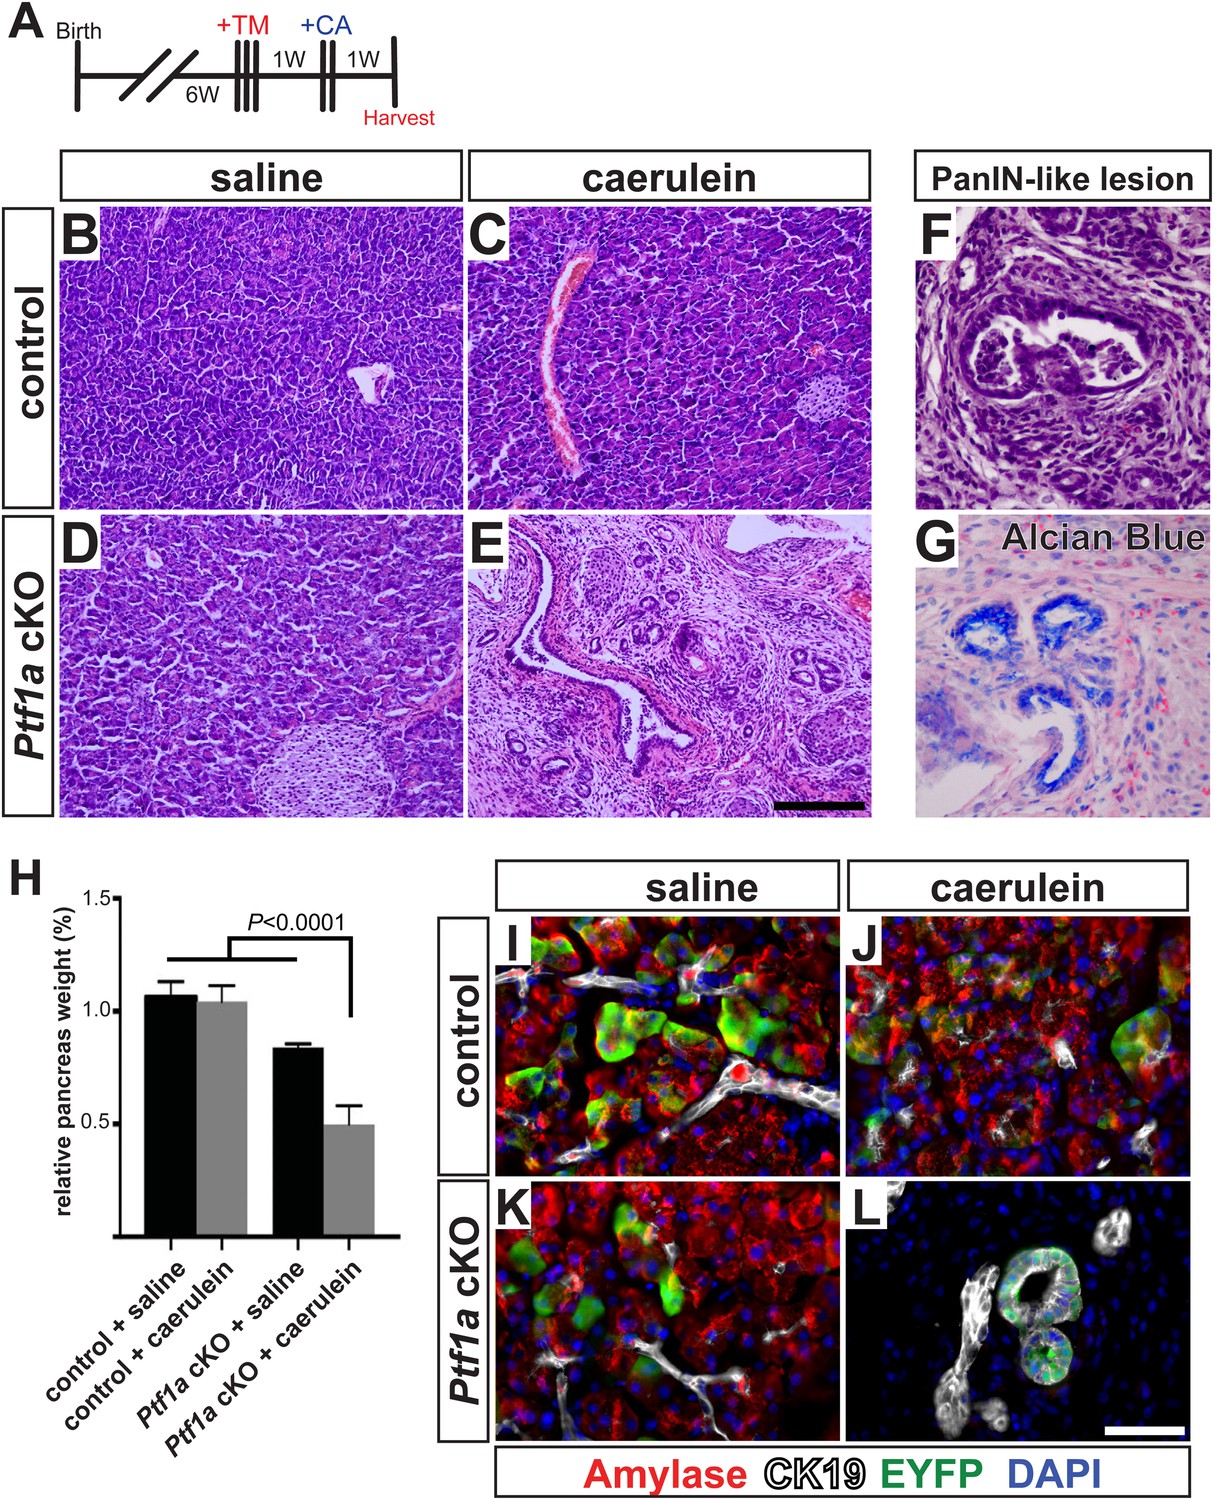
To test this hypothesis in vivo, we deleted Ptf1a via high-dose TM administration (three doses of 0.17 mg/g), which induced a recombination rate of ∼65% (Figure 4—figure supplement 1). At 1 week post-TM, acute pancreatitis was induced by two consecutive days of treatment with the secretagogue caerulein, as previously described (Jensen et al., 2005; Keefe et al., 2012), and pancreata were harvested 1 week later (Figure 6A). As a control for caerulein injections, additional TM-treated Ptf1a cKO and control mice were administered saline vehicle alone. As previously reported, control mice recovered from caerulein treatment and were indistinguishable from saline-injected controls after 1 week (Figure 6B–D). In contrast, Ptf1a cKO mice subjected to caerulein-induced pancreatitis exhibited widespread acinar atrophy, persistent inflammation, fibrotic stroma, and the appearance of mucinous metaplastic structures (Figure 6E,F). These abnormal ductules were Alcian Blue-reactive, similar to PanINs (Figure 6G), although staining for the PanIN-specific markers CLDN18 and MUC5AC was observed in only rare and isolated lesions (Figure 6—figure supplement 1A,B). Consistent with the overall distorted histology (Figure 6E) and atrophy (Figure 6H) of caerulein-treated Ptf1a cKO mice, no normal amylase+ acinar clusters could be detected in these pancreata, in contrast to controls (Figure 6I–L). Acinar-derived EYFP+ cells in caerulein-treated Ptf1a cKO pancreata were instead integrated within CK19+ duct-like structures, suggesting that pancreatitis synergizes with loss of Ptf1a to cause a rapid loss of acinar gene expression and complete reprogramming to a duct-like fate (Figure 6I–L).
Figure 6 with 1 supplement see all
Ptf1a is necessary for acinar cell regeneration and suppression of dysplasia following induced pancreatitis.
(A) 6- to 8-week-old control and Ptf1a cKO mice were administered three doses of TM (0.17 mg/g) on consecutive days. 1 week later, mice were administered eight hourly injections of caerulein or saline vehicle, on two consecutive days. Mice were sacrificed 1 week following caerulein treatment. (B–E) H&E staining on control and Ptf1a cKO pancreata (n = 4–5 per group) 1 week following caerulein treatment. (F) H&E stain highlighting a PanIN-like lesion in caerulein-treated Ptf1a cKO. (G) Alcian Blue-positive lesions in caerulein-treated Ptf1a cKO. (H) Relative pancreas size, measured as a percent of body weight, among treatment groups (n = 4–5 per group, p < 0.01). (I–L) Immunofluorescence for amylase (red), CK19 (white), and the Cre reporter R26REYFP (green), in pancreata of control and Ptf1a cKO treated with saline or caerulein. EYFP+ cells of caerulein-treated cKO have downregulated amylase and contribute to CK19+ PanIN-like structures. Scale bars: (B–E) 200 µm, (I–L) 50 µm.
As our findings in Ptf1a cKO; KrasG12D mice indicate that loss of PTF1A enhances the transforming activity of mutant KRAS, we were interested to determine if development of mucinous metaplasia involved enhanced signaling through endogenous RAS. The MEK-ERK pathway is a major regulator of KRAS-induced acinar reprogramming (Collins et al., 2014), and we found that nearly all metaplastic lesions of caerulein-treated Ptf1a cKO mice exhibited robust nuclear phospho-ERK staining (Figure 6—figure supplement 1C–F). Phospho-ERK was undetectable in saline-treated Ptf1a cKO mice, or control mice under either treatment. Taken together, these data demonstrate that PTF1A is necessary for acinar-cell redifferentiation and resolution of tissue injury following acute pancreatitis. In the absence of PTF1A, a persistent inflamed microenvironment may have tumor promoter-like activity, enhancing KRAS-MEK-ERK signaling to induce transformation (Gukovsky et al., 2013; Murtaugh, 2014).
Ptf1a heterozygosity promotes PDAC by increasing the frequency of initiating events
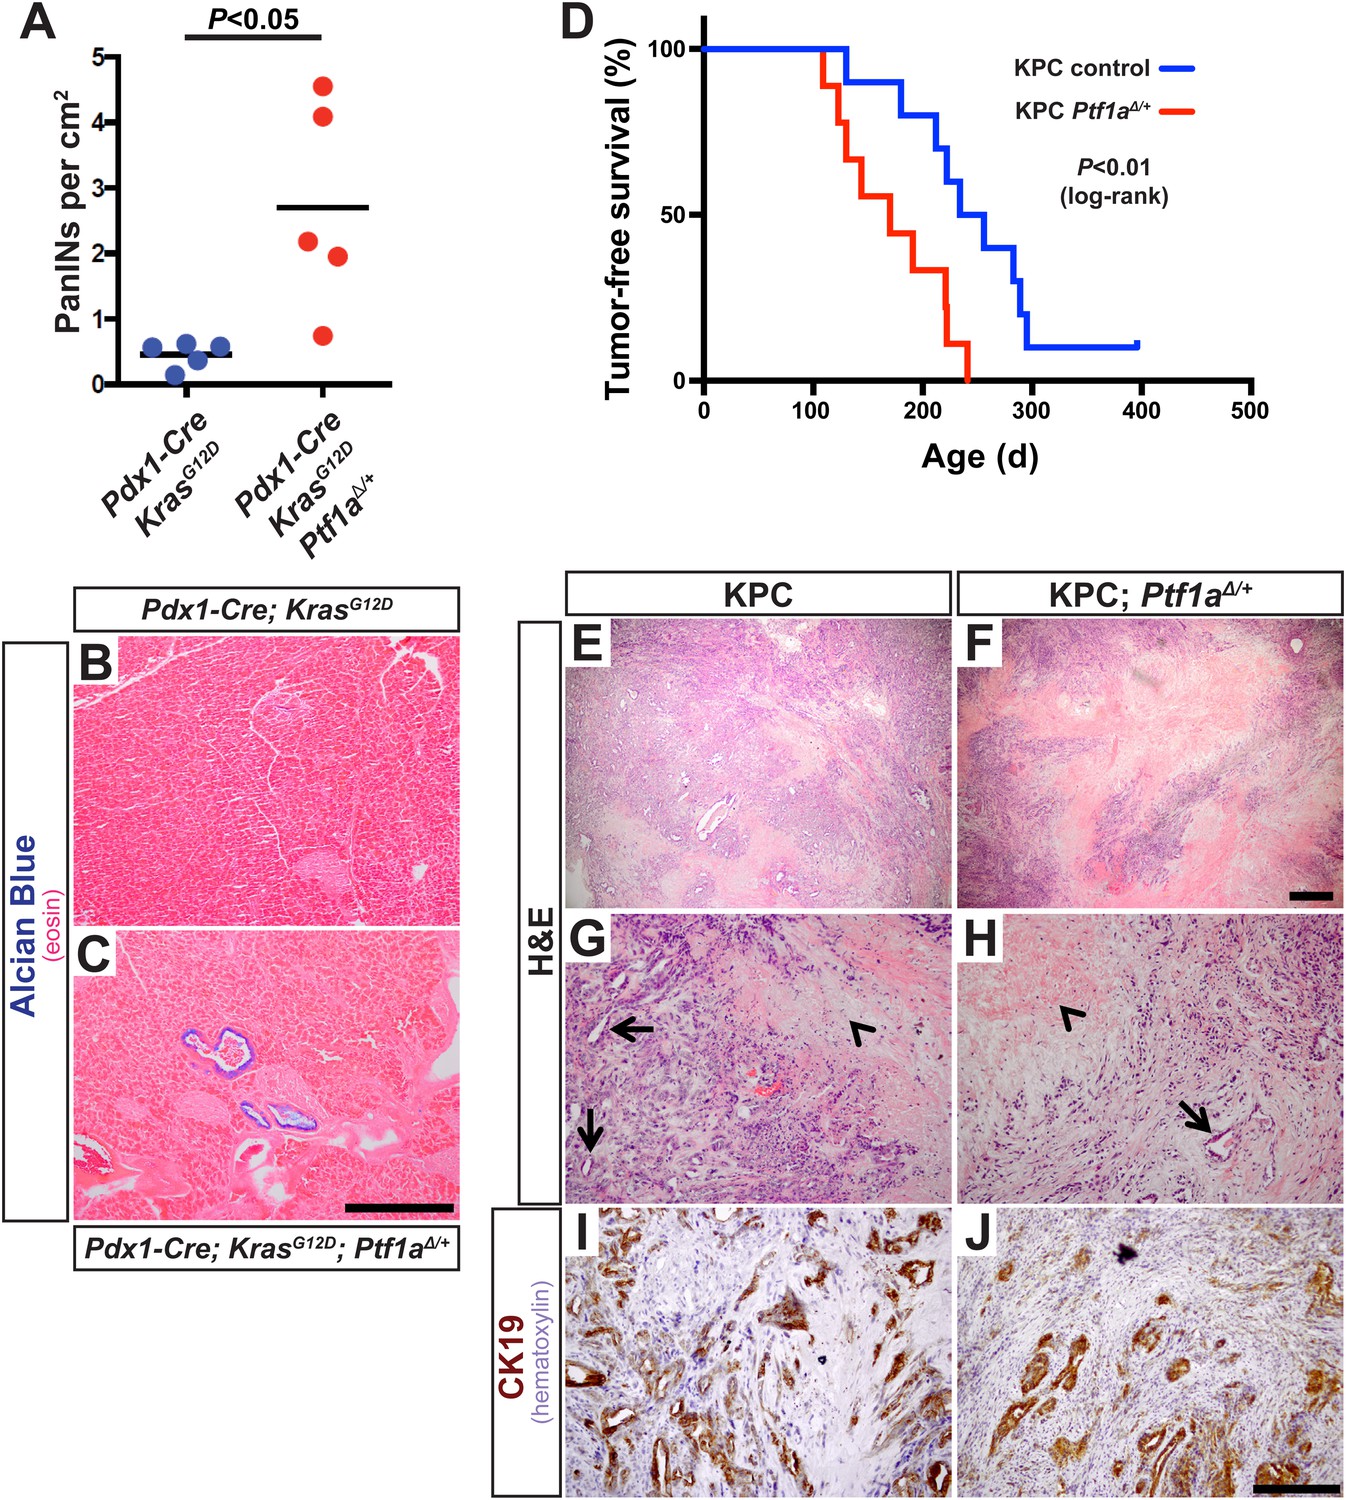
The above studies rely on genetic deletion of Ptf1a, a process without clear parallel in human disease: somatic mutations of PTF1A are not observed in human PDAC, according to the Catalogue of Somatic Mutations in Cancer (COSMIC) database (cancer.sanger.ac.uk). PTF1A is more likely to be downregulated by an epigenetic mechanism, for example, via attenuation of the positive autoregulatory loop by which PTF1A maintains its own expression and that of its partner transcription factors (Masui et al., 2008). Impaired expression of PTF1-network components, lowering the threshold for KRAS-mediate reprogramming and transformation, might explain the dosage-sensitive requirement for Nr5a2 in preventing PanIN formation (Flandez et al., 2014; von Figura et al., 2014b). To determine if the role of Ptf1a itself is dosage-sensitive, we generated mice of the ‘KC’ genotype, using the Pdx1-Cre driver to activate KrasLSL-G12D throughout the pancreas (Aguirre et al., 2003; Hingorani et al., 2003; Murtaugh, 2014), and which were either heterozygous for a germ line deletion of Ptf1a (Pdx1-Cre; KrasLSL-G12D; Ptf1aΔ/+) or remained homozygous Ptf1a wild type. We harvested pancreata at 1 month of age, at which time PanIN formation is usually minimal in KC mice, and quantified PanIN burden by Alcian Blue staining. Mice heterozygous for Ptf1a had increased PanINs at this early stage, compared to Ptf1a+/+ littermates (Figure 7A–C). This result is consistent with a dosage-sensitive function for PTF1A, such that reduced levels or activity already begin to destabilize acinar differentiation in the face of oncogenic insults.
Figure 7 with 1 supplement see all
Ptf1a heterozygosity increases the frequency of PanINs and allows for rapid progression of PDAC.
(A) Quantification of PanINs in pancreata from 1-month-old Pdx1-Cre; KrasG12D and Pdx1-Cre; KrasG12D; Ptf1a∆/+ mice (n = 5 per genotype, p < 0.05). (B, C) Representative Alcian Blue and Eosin staining from 1-month-old mice of indicated genotypes. (D) Kaplan–Meier analysis from KPC mice (Pdx1-Cre; KrasG12D; p53lox/+; Ptf1a+/+, blue line) and KPC; Ptf1a∆/+ mice (red line) (Log-Rank test p < 0.01). (E–H) H&E staining on tumors from both KPC and KPC:Ptf1a∆/+ mice at low and high magnification. (G, H) Arrows indicate ductile epithelial cells and arrowheads indicate areas of necrosis. (I, J) IHC for CK19 on tumor specimens from mice of indicated genotypes. Scale Bars: (B, C) 500 µm, (E, F) 500 µm, (G–J) 200 µm.
In humans, increased PanIN burden in early life is associated with familial risk of PDAC, suggesting that mutations driving genetic predisposition to PDAC act at the level of tumor initiation (Brune et al., 2006; Shi et al., 2009a). We therefore hypothesized that decreased Ptf1a dosage would promote cancer susceptibility by increasing the rate of PanIN initiation. Therefore, we utilized the well-characterized ‘KPC’ model of mouse PDAC in which heterozygous loss of p53 (official gene symbol Trp53) is added to the Pdx1-Cre; KrasLSL-G12D genotype (Hingorani et al., 2005; Rhim et al., 2012). As above, KPC mice (Pdx1-Cre; KrasLSL-G12D; p53lox/+) were generated on either Ptf1a+/+ or Ptf1aΔ/+ backgrounds, and animals were monitored for tumor-free survival. The results of Kaplan–Meier analysis showed that Ptf1a-heterozygous KPC mice developed PDAC much earlier than Ptf1a+/+ counterparts (Figure 7D, Log-rank test, p < 0.01). We observed prominent metastases to the liver in 3/9 Ptf1aΔ/+ KPC mice, but none in Ptf1a+/+ KPC controls (Figure 7—figure supplement 1). Importantly, despite the earlier onset of PDAC in KPC mice with Ptf1a heterozygosity, once tumors arose they were histologically indistinguishable between genotypes (Figure 7E–H). They contained classical features of human PDAC, including abundant fibrotic stroma surrounding CK19+ epithelial cells (Figure 7I,J) and substantial areas of necrosis. We therefore conclude that decreased Ptf1a gene dosage sensitizes pancreata to early KRAS-mediated PanIN initiation and rapid progression to PDAC.
Discussion
Previously, we and others established that acinar-to-ductal reprogramming is a necessary step in PanIN initiation (De La et al., 2008; Habbe et al., 2008; Kopp et al., 2012). Several recent studies extended these findings, demonstrating that several genes required for PanIN and PDAC development appear to act at the level of acinar cell reprogramming (Heid et al., 2011; Ardito et al., 2012; Kopp et al., 2012; Baer et al., 2014; Wu et al., 2014; Zhang et al., 2014). Here, we demonstrate that the loss of a principal regulator of acinar cell identity, PTF1A, is sufficient to prompt rapid and extensive acinar-to-ductal metaplasia even in the absence of other exocrine insults (Figure 4). Additionally, we demonstrate that Ptf1a-deficient acinar cells are extremely sensitive to oncogenic transformation, as they undergo rapid and robust KRAS-mediated PanIN formation (Figures 2, 3).
Deletion of Ptf1a alone at moderate frequency (∼25%) did not produce detectable histological changes in the pancreas over the course of 2–6 weeks (Figure 3). By contrast, we observed rapid de-differentiation of Ptf1a cKO acinar cells generated under a high-TM dose regimen that produced >65% deletion (Figure 4). This is an important finding regarding potentially non-cell autonomous protective mechanisms working to offset PanIN/PDAC initiation. We propose two linked hypotheses: first, when Ptf1a is lost from individual cells, other acinar-specific transcription factors that prevent reprogramming and co-regulate PTF1 target genes, such as NR5A2 and BHLHA15/MIST1, are sufficient to maintain a differentiated phenotype over the short term. Second, we propose that the persistent differentiation of Ptf1a cKO acinar cells is promoted by interactions with neighboring Ptf1a WT cells, producing a phenomenon similar to the ‘community effect’ in embryonic development (Gurdon et al., 1993). However, with increasing TM-driven deletion, the fraction of Ptf1a WT acinar cells passes a tipping point, the community effect cannot be sustained, and ductal metaplasia is correspondingly rapid. At a molecular level, the protective effect of wild-type acinar cells could be mediated by their ability to dampen local inflammation, suggested by the upregulation of fibroinflammatory pathways in our RNA-seq analyses (Figure 5). This is also suggested by our finding that Ptf1a cKO pancreata exhibit sustained inflammation after acute injury, including the conversion of acinar cells to PanIN-like, Alcian Blue+ ductule structures (Figure 6). These resemble tubular complexes observed in human and mouse chronic pancreatitis (Bockman et al., 1982; Strobel et al., 2007), suggesting that dysregulation of PTF1A expression or function might be involved in the etiology of this disease and its well-known contribution to PDAC risk. We additionally demonstrate that inflammation and loss of Ptf1a synergize to drive sustained activation of the MEK-ERK pathway, a major effector of oncogenic and endogenous KRAS. Going forward, it will interesting to test whether MEK inhibitors are able to prevent acinar cell reprogramming in the context of chronic pancreatitis and/or decrease the risk of chronic pancreatitis progressing to PDAC.
Given the dramatic effects of Ptf1a deletion on transformation and inflammation, it will be important to determine which genes in our RNA-seq data set are directly suppressed or activated by PTF1A. It has been previously established that PTF1A regulates a network of transcription factors controlling acinar-specific gene expression (Masui et al., 2008, 2010). Among these are Bhlha15/Mist1 and Nr5a2, both downregulated in the Ptf1a cKO condition (Figure 5), and both previously shown to inhibit PanIN development (Shi et al., 2009b; Flandez et al., 2014; von Figura et al., 2014b). Of these three genes, only Ptf1a is indispensable for acinar cell differentiation (Krapp et al., 1998; Pin et al., 2001; Kawaguchi et al., 2002; Holmstrom et al., 2011; von Figura et al., 2014b), and it will be of interest to determine the relative rank of these factors as suppressors of cancer initiation and progression, and their epistatic relationship. It will also be useful to understand how KRAS, together with inflammatory and other insults, is capable of downregulating the expression and/or function of PTF1-network components during tumor initiation. Of note, recent studies indicate that oncogenic KRAS induces specific pathways dedicated to silencing tumor suppressor genes (Wajapeyee et al., 2013; Serra et al., 2014); a similar process may drive downregulation of Ptf1a and its partners during acinar cell reprogramming.
Because loss of Ptf1a strongly potentiated KRAS-mediated transformation (Figures 2, 3), we hypothesized that PTF1A inhibits KRAS-signaling activity in some capacity. Here, we demonstrate that loss of Ptf1a leads to upregulation of genes associated with KRAS-dependency in human cancer cells (Singh et al., 2009; Loboda et al., 2010). Future investigations should therefore move forward to test if different subtypes of human PDAC exhibit different extents of PTF1A repression, and whether variation in PTF1A expression within human PDAC correlates with KRAS-dependency or disease prognosis. Recent studies have classified ∼1/3 of pancreatic cancers as ‘exocrine-like’, and several genes that are under Ptf1a control contribute to this signature (Figure 5A,B) (Collisson et al., 2011). Unfortunately, human PTF1A was not present on the microarray used in that study; nonetheless, their data suggest that PTF1A and its transcriptional targets are retained at low levels in some, but not all, cases of PDAC. Consistent with these previous reports, we found that sparse epithelial cells in human PanIN lesions retain nuclear PTF1A (Figure 1—figure supplement 1). In addition to supporting the contention that human PanINs and PDAC arise from mature acinar cells, these findings suggest that low levels of persistent PTF1A, held in check by epigenetic rather than genetic mechanisms, may be available for therapeutically targeted restoration. The fact that removal of a single allele of Ptf1a accelerates mouse PDAC development (Figure 7D) suggests that even incomplete inhibition of human PTF1A could promote acinar transformation and subsequent tumorigenesis. Our results suggest that PTF1A restoration provides an indirect approach to target KRAS-dependency in pancreatic cancer, inhibiting this currently ‘undruggable’, although ubiquitous, cancer-driving mutation (Pasca di Magliano and Logsdon, 2013). Additionally, our data suggest that PTF1A restoration may reduce inflammatory pathways that feed forward to synergize with oncogenic KRAS (Maniati et al., 2011; Daniluk et al., 2012; Maier et al., 2013). Future studies will focus on genetic PTF1A gain-of-function approaches to determine if sustained PTF1A expression can prevent and/or reverse acinar-to-ductal reprogramming, PanIN initiation and PDAC progression.
In summary, we show that acinar cell differentiation, maintained through PTF1A, suppresses multiple oncogenic pathways associated with PDAC initiation and progression. Our data suggest that PTF1A functions as a nodal point in PDAC initiation by maintaining acinar-cell gene expression, suppressing KRAS function, and resisting inflammation. The antagonism between KRAS and the pro-acinar transcription factor network captures, at a genetic level, the tension between differentiation and malignant transformation that has long been hypothesized to exist in cancer (Harris, 1990). Loss of normal differentiation and reprogramming of cell fate appear to occur during initiation of a diverse array of tumor types (Blanpain, 2013). Our results, for the first time, demonstrate that this process is rate-limiting for cancer development, thus, constituting a novel mechanism of tumor suppression. The mouse PanIN-PDAC model provides a new experimental system to relate genetic changes in cancer, such as KRAS mutation, to epigenetic changes such as PTF1A downregulation. Furthermore, understanding how PTF1A function is subverted during pancreatic cancer initiation, and whether its reactivation could suppress or reverse tumor development, may yield novel approaches to prevention and treatment.
Materials and methods
Mice
Experimental mice of the following genotypes have been previously described: Ptf1aCreERT (Ptf1atm2(cre/ESR1)Cvw [Kopinke et al., 2012; Pan et al., 2013]), Pdx1-Cre (Tg(Pdx1-cre)89.1Dam [Gu et al., 2002]), KrasLSL-G12D (Krastm4Tyj [Hingorani et al., 2003]), p53lox (Trp53tm1Brn [Marino et al., 2000]), and R26REYFP (Gt(ROSA)26Sortm1(EYFP)Cos [Srinivas et al., 2001]). The Ptf1alox allele (Ptf1atm3Cvw) was generated using homologous recombination in mouse ES cells at the Vanderbilt Transgenic Mouse/Embryonic Stem Cell Shared Resource. The 5′ and 3′ loxP sites were placed 1.7 kb upstream and 2 kb downstream of the Ptf1a transcriptional start site, respectively. Full details will be provided elsewhere (Wright et al., in preparation). Mice with a germ line deletion allele of Ptf1a, Ptf1aΔ were generated by crossing Ptf1alox to the ubiquitous early deletor line Sox2-Cre (Tg(Sox2-cre)1Amc [Hayashi et al., 2003]). To activate CreERT-mediated recombination, mice were administered tamoxifen (Sigma, St. Louis, MO) dissolved in corn oil, via oral gavage at doses indicated in the text. All mouse experiments were carried out according to institutional and NIH guidelines.
Human histological specimens
Request a detailed protocolAll human pathological specimens were de-identified before their use. The utilization of these human specimens is therefore not considered human subject research under the US Department of Human and Health Services regulations and related guidance (45 CDR Part 46). Paraffin embedded specimens were sectioned (6 µm) and IHC was performed for PTF1A, as described below. Samples were analyzed by NMK, MPB, and LCM.
Tissue processing and histology
Request a detailed protocolAfter euthanasia, pancreata were dissected in ice-cold phosphate-buffered saline solution (PBS), separated into multiple fragments, and processed for both frozen and paraffin sections as previously described (De La et al., 2008; Keefe et al., 2012; Kopinke et al., 2012). Briefly, tissues were fixed for paraffin embedding in zinc-buffered formalin (Z-FIX; Anatech, Battle Creek, MI), room temperature overnight, or 4% paraformaldehyde/PBS, 4°C 1–2 hr, followed by processing into Paraplast Plus (McCormick Scientific) or Tissue-Tek O.C.T. compound (Sakura Finetek, Torrance, CA). Paraffin and frozen sections were cut at thickness of 6 µm and 8 µm, respectively, and collected sequentially across multiples slides, with ∼100-µm spacing between individual sections on a single slide.
IHC and immunofluorescence followed our established procedures (De La et al., 2008; Keefe et al., 2012; Kopinke et al., 2012), including high-temperature antigen retrieval (Vector Unmasking Solution; Vector Laboratories, Burlingame, CA) prior to staining paraffin sections. Primary antibodies utilized in this study are listed in Table 2. Secondary antibodies, raised in donkey (Jackson Immunoresearch, West Grove, PA), were used at 1:250 dilution. Vectastain reagents and diaminobenzidine (DAB) substrate (Vector Laboratories) were used for IHC. Slides stained by immunofluorescence were counterstained with DAPI and mounted in Fluoromount-G (Southern Biotech), and photographed on an Olympus IX71 microscope, using MicroSuite software (Olympus America, Waltham, MA). Images were processed in Adobe Photoshop, with exposure times and adjustments identical between genotypes and treatment groups.
Table 2
Primary antibodies used in this study
| Antigen | Species | Source | Catalog # | Dilution |
|---|---|---|---|---|
| Amylase | Sheep | BioGenesis | 0480-0104 | 1:1000 |
| Cleaved-caspase-3 | Rabbit | Abcam | AB2302 | 1:1000 |
| Cd45 | Rat | eBioScience | 14-0451-82 | 1:2000 |
| Claudin-18 | Rabbit | Invitrogen | 700178 | 1:2000 |
| Cpa1 | Goat | R&D Systems | AF2765 | 1:1000 |
| Cytokeratin-19 | Rat | Developmental Studies Hybridoma Bank | – | 1:50 |
| Cytokeratin-19 | Rabbit | Abcam | AB133496 | 1:5000 |
| GFP | Chicken | Aves Labs Inc. | GFP-1010 | 1:5000 |
| Ki67 | Mouse | BD Biosciences | 550609 | 1:500 |
| Muc5ac | Mouse | NeoMarkers | 45M1 | 1:500 |
| Ptf1a | Rabbit | Chris Wright, Vanderbilt University | – | 1:5000 |
| Ptf1a | Goat | Chris Wright, Vanderbilt University | – | 1:5000 |
| Phospho-ERK1/2 (T202/Y204) | Rabbit | Cell Signaling | 9101 | 1:1000 |
| Sox9 | Rabbit | Millipore | AB5535 | 1:1000 |
| α-SMA | Rabbit | Abcam | AB32575 | 1:2000 |
-
SMA, smooth muscle actin.
For Alcian Blue staining, paraffin sections were washed 5 min in 3% acetic acid, followed by a 10–12 min incubation in staining solution (1% Alcian Blue in 3% acetic acid), and extensive washing in 3% acetic acid. Sirius Red staining was performed on frozen sections that were fixed for 1 hr in Bouin's fixative at 55°C. Specimens were subsequently washed in dH2O and stained for 1 hr in Picro-Sirius Red (American MasterTech, Lodi, CA). Following staining, specimens were rinsed in 0.5% acetic acid, dehydrated and equilibrated into xylene, and mounted with Permount.
PanIN scoring
Request a detailed protocolThe entire tissue area of Alcian Blue/eosin-stained slides was photographed, at 4× original magnification, followed by photomerging (Adobe Photoshop) and surface area measurement using ImageJ software (NIH). Alcian Blue+ PanIN lesions were counted manually under the microscope, and PanIN burden calculated as the total number of Alcian Blue+ lesions per cm2 surface area. As described in the text, metaplastic lesions that did not stain with Alcian Blue were not counted in the quantification. To avoid double-counting of potentially large and tortuous lesions, no more than one lesion was scored within an anatomically distinct pancreatic lobule (De La et al., 2008).
3D pancreatic acinar cultures
Request a detailed protocolAcinar cultures were established according to previous publications (Kurup and Bhonde, 2002; Means et al., 2005; Ardito et al., 2012). Briefly, dorsal pancreata were minced in Hank's buffered saline solution and digested sequentially in 0.02% trypsin (5 min, 37°C) and 1 mg/ml collagenase P (Roche Applied Science, Mannheim, Germany; 15 min, 37°C), following filtration to eliminate undigested material, and repeated washing to eliminate debris and dead cells, acinar cell clusters were embedded in rat tail collagen gels (Corning, Corning, NY), and cultured in Waymouth's medium (Life Technologies, Carlsbad, CA) supplemented with 1% fetal bovine serum, 0.4 mg/ml soybean trypsin inhibitor, and 1 µg/ml dexamethasone. Cultures were fixed and imaged after 5 days. To quantify cyst size, we randomly selected >10 fields per mouse, imaged, and quantified the maximal diameter of each transformed cyst using ImageJ.
Quantification of immunofluorescence images
Request a detailed protocolIn order to quantify R26REYFP labeling, 10–12 randomly selected 20× fields per specimen (taken across multiple sections) were photographed. Using ImageJ software (NIH), cells co-expressing EYFP with the acinar differentiation markers Amylase or CPA1 were detected by additive image overlay of their staining with DAPI and anti-GFP, and counted using the Analyze Particles function, as described previously (Keefe et al., 2012; Kopinke et al., 2012). To ensure counting accuracy, random images were spot checked by manual counting using Adobe Photoshop. All calculations were performed in Microsoft Excel and the results are reported as the mean ± standard deviation (error bars). p-values were determined by two-tailed, unpaired t-tests performed in Excel or Graphpad Prism 6.
RNA-seq analysis
Request a detailed protocolTotal RNA was isolated from pancreata of 4- to 5-month-old Ptf1a cKO mice (Ptf1aCreERT/lox) and their corollary controls (Ptf1aCreERT/+), 2 weeks after TM treatment (3 days, 0.25 mg/g/day), using the guanidine thiocyanate protocol previously described with minor modifications (MacDonald et al., 1987). Individual RNA-Seq libraries were prepared from 5 μg of pancreatic RNA from three control and three Ptf1a cKO mice with the Illumina True-seq protocol by the UT Southwestern Genomic Core. The sequence data sets from an Illumina HISEQ2500 contained 50-nucleotide uniquely aligned single-end reads of 25.1, 26.4, and 25.8 million for the control samples and 29.7, 24.7, and 26.7 million for the Ptf1a cKO RNA samples (Tophat2) (Kim et al., 2013). Genes with differential expression were derived using edgeR (Robinson et al., 2010), with the default trimmed mean of M-values (TMM) trim settings of 30% for Mg and 5% for Ag and an FDR cut-off of <0.05. The volcano plot of differentially expressed genes was generated using R (http://www.r-project.org/) with the log2 fold change (FC) plotted against the FDR (−log10) (Supplementary files 1, 2).
Gene signatures of RAS dependency (Singh et al., 2009; Loboda et al., 2010), classical and exocrine-like PDAC (Collisson et al., 2011), were mapped to orthologous mouse genes via HomoloGene ID. The RAS dependency signature combines gene lists from two separate studies (Singh et al., 2009; Loboda et al., 2010), comprising 264 genes with only five in common. For GSEA (Subramanian et al., 2005), we analyzed signature enrichment within the entire Ptf1a cKO RNA-seq data set, ordered by log2 FC relative to control, using the GSEA desktop application (http://www.broadinstitute.org/gsea/index.jsp).
To identify regulatory pathways altered upon Ptf1a deletion, significantly increased and decreased genes were analyzed by IPA (QIAGEN, Redwood City, CA, www.ingenuity.com) at expression thresholds of 1.5-, 2.0,- and 3.0-fold (Supplementary files 3–5). In order to obtain an accurate comparison between enriched and downregulated pathways, we used the Comparison Analysis function from expression data filtered at a gene expression threshold of ±2.0-fold. Heat maps were generated according to the −log p-values given by the IPA software using the comparison analysis function and were constructed in R (http://www.r-project.org/).
Caerulein treatment
Request a detailed protocolWe induced acute pancreatitis by i.p. injection of caerulein (Bachem, Torrance, CA), 0.1 µg/g, eight times daily over two consecutive days, as previously (Jensen et al., 2005; Keefe et al., 2012). Negative controls were injected with saline vehicle alone. Pancreata from all caerulein- or saline-treated mice were harvested 1 week following the final injection and processed as described above.
Kaplan–Meier analysis
Request a detailed protocolKPC mice (of the genotype Pdx1-Cre; KrasG12D; p53lox/+) and KPC mice with Ptf1a heterozygosity (Pdx1-Cre; KrasG12D; p53lox/+; Ptf1aΔ/+) were aged until they exhibited lethargy or distress as determined by the authors (NMK and LCM) and the in-house veterinary staff, or until the detection of a firm abdominal mass by palpation. The presence of PDAC was confirmed by histological analysis in consultation with a surgical pathologist (MB). At sacrifice, all mice were thoroughly inspected for liver metastases. Survival analysis was performed in GraphPad Prism (Version 6) and p-values were calculated using a Log-rank test.
Data availability
-
Effects on the transcriptome of adult mouse pancreas (principally acinar cells) by the inactivation of the Ptf1a gene in vivoPublicly available at NCBI Gene Expression Omnibus (Accession No: GSE70542).
References
-
The secret origins and surprising fates of pancreas tumorsCarcinogenesis 35:1436–1440.https://doi.org/10.1093/carcin/bgu056
-
Dendritic cells promote pancreatic viability in mice with acute pancreatitisGastroenterology 141:1915–1926.e14.https://doi.org/10.1053/j.gastro.2011.07.033
-
Tracing the cellular origin of cancerNature Cell Biology 15:126–134.https://doi.org/10.1038/ncb2657
-
Origin of tubular complexes in human chronic pancreatitisAmerican Journal of Surgery 144:243–249.https://doi.org/10.1016/0002-9610(82)90518-9
-
Multifocal neoplastic precursor lesions associated with lobular atrophy of the pancreas in patients having a strong family history of pancreatic cancerThe American Journal of Surgical Pathology 30:1067–1076.
-
An NF-kappaB pathway-mediated positive feedback loop amplifies Ras activity to pathological levels in miceThe Journal of Clinical Investigation 122:1519–1528.https://doi.org/10.1172/JCI59743
-
Notch and Kras reprogram pancreatic acinar cells to ductal intraepithelial neoplasiaProceedings of the National Academy of Sciences of USA 105:18907–18912.https://doi.org/10.1073/pnas.0810111105
-
Pancreatic cancer-associated retinoblastoma 1 dysfunction enables TGF-beta to promote proliferationThe Journal of Clinical Investigation 124:338–352.https://doi.org/10.1172/JCI71526
-
Direct evidence for the pancreatic lineage: NGN3+ cells are islet progenitors and are distinct from duct progenitorsDevelopment 129:2447–2457.
-
Spontaneous induction of murine pancreatic intraepithelial neoplasia (mPanIN) by acinar cell targeting of oncogenic Kras in adult miceProceedings of the National Academy of Sciences of USA 105:18913–18918.https://doi.org/10.1073/pnas.0810097105
-
The role of differentiation in the suppression of malignancyJournal of Cell Science 97:5–10.
-
Early requirement of Rac1 in a mouse model of pancreatic cancer719–730, Gastroenterology, 141, 730.e1–7, 10.1053/j.gastro.2011.04.043.
-
NCBI Gene Expression OmnibusNCBI Gene Expression Omnibus, GSE70542. http://www.ncbi.nlm.nih.gov/geo/query/acc.cgi?acc=GSE70542.
-
Ras activity levels control the development of pancreatic diseases1072–1082, Gastroenterology, 137, 1082.e1–6, 10.1053/j.gastro.2009.05.052.
-
Beta-catenin is selectively required for the expansion and regeneration of mature pancreatic acinar cells in miceDisease Models & Mechanisms 5:503–514.https://doi.org/10.1242/dmm.007799
-
Inflammation and mitochondrial fatty acid beta-oxidation link obesity to early tumor promotionProceedings of the National Academy of Sciences of USA 106:3354–3359.https://doi.org/10.1073/pnas.0802864106
-
Causal analysis approaches in ingenuity pathway analysisBioinformatics 30:523–530.https://doi.org/10.1093/bioinformatics/btt703
-
Analysis and optimization of nutritional set-up for murine pancreatic acinar cellsJournal of the Pancreas 3:8–15.
-
Macrophage-secreted cytokines drive pancreatic acinar-to-ductal metaplasia through NF-kappaB and MMPsThe Journal of Cell Biology 202:563–577.https://doi.org/10.1083/jcb.201301001
-
Crosstalk between the canonical NF-kappaB and Notch signaling pathways inhibits Ppargamma expression and promotes pancreatic cancer progression in miceThe Journal of Clinical Investigation 121:4685–4699.https://doi.org/10.1172/JCI45797
-
Induction of medulloblastomas in p53-null mutant mice by somatic inactivation of Rb in the external granular layer cells of the cerebellumGenes & Development 14:994–1004.
-
Transcriptional autoregulation controls pancreatic Ptf1a expression during development and adulthoodMolecular and Cellular Biology 28:5458–5468.https://doi.org/10.1128/MCB.00549-08
-
Pathogenesis of pancreatic cancer: lessons from animal modelsToxicologic Pathology 42:217–228.https://doi.org/10.1177/0192623313508250
-
Regeneration and repair of the exocrine pancreasAnnual Review of Physiology 77:229–249.https://doi.org/10.1146/annurev-physiol-021014-071727
-
Roles for KRAS in pancreatic tumor development and progressionGastroenterology 144:1220–1229.https://doi.org/10.1053/j.gastro.2013.01.071
-
The bHLH transcription factor Mist1 is required to maintain exocrine pancreas cell organization and acinar cell identityThe Journal of Cell Biology 155:519–530.https://doi.org/10.1083/jcb.200105060
-
The role of PTF1-P48 in pancreatic acinar gene expressionThe Journal of Biological Chemistry 276:44018–44026.https://doi.org/10.1074/jbc.M106264200
-
Pancreatic adenocarcinomaThe New England Journal of Medicine 371:1039–1049.https://doi.org/10.1056/NEJMra1404198
-
Mutations in PTF1A cause pancreatic and cerebellar agenesisNature Genetics 36:1301–1305.https://doi.org/10.1038/ng1475
-
Increased Prevalence of precursor lesions in familial pancreatic Cancer patientsClinical Cancer Research 15:7737–7743.https://doi.org/10.1158/1078-0432.CCR-09-0004
-
Gene set enrichment analysis: a knowledge-based approach for interpreting genome-wide expression profilesProceedings of the National Academy of Sciences of USA 102:15545–15550.https://doi.org/10.1073/pnas.0506580102
-
PI3K regulation of RAC1 is required for KRAS-induced pancreatic tumorigenesis in miceGastroenterology 147:1405–1416.e7.https://doi.org/10.1053/j.gastro.2014.08.032
Article and author information
Author details
Funding
National Cancer Institute (NCI) (R21-CA179453)
- Nathan M Krah
- L Charles Murtaugh
National Institute of Diabetes and Digestive and Kidney Diseases (NIDDK) (R01-DK061220)
- Raymond J MacDonald
National Institute of Diabetes and Digestive and Kidney Diseases (NIDDK) (P01-DK42502)
- Christopher VE Wright
Eunice Kennedy Shriver National Institute of Child Health and Human Development (T32-HD007491)
- Nathan M Krah
National Cancer Institute (NCI) (F30-CA192819)
- Nathan M Krah
The funders had no role in study design, data collection and interpretation, or the decision to submit the work for publication.
Acknowledgements
We are grateful to Matt Firpo, Gabrielle Kardon, and Kirk Thomas for helpful comments on the manuscript, and to Zev Kronenberg and Peter Hendrickson for assistance with bioinformatic analyses. This work was supported by NIH grants P01-DK42502 to CVEW, R01-DK061220 to RJM, and R21-CA179453 to LCM. NMK was a trainee of the University of Utah Developmental Biology Training Grant, T32-HD007491, and is currently supported by NIH fellowship F30-CA192819.
Ethics
Animal experimentation: This study was performed according to institutional and National Institutes of Health guidelines for animal research (Guide for the Care and Use of Laboratory Animals), and followed protocols approved by the Institutional Animal Care and Use Committees of the University of Utah (protocol #13-09009), University of Texas Southwestern Medical Center (protocol #2013-0008) and Vanderbilt University (protocol #M10/106).
Copyright
© 2015, Krah et al.
This article is distributed under the terms of the Creative Commons Attribution License, which permits unrestricted use and redistribution provided that the original author and source are credited.
Metrics
-
- 0
- citations
Views, downloads and citations are aggregated across all versions of this paper published by eLife.
Download links
A two-part list of links to download the article, or parts of the article, in various formats.
Downloads (link to download the article as PDF)
Open citations (links to open the citations from this article in various online reference manager services)
Cite this article (links to download the citations from this article in formats compatible with various reference manager tools)
The acinar differentiation determinant PTF1A inhibits initiation of pancreatic ductal adenocarcinoma
eLife 4:e07125.
https://doi.org/10.7554/eLife.07125


