Exploiting the mediating role of the metabolome to unravel transcript-to-phenotype associations

  1. Chiara Auwerx
  2. Marie C Sadler
  3. Tristan Woh
  4. Alexandre Reymond
  5. Zoltán Kutalik  Is a corresponding author
  6. Eleonora Porcu  Is a corresponding author
  1. Center for Integrative Genomics, University of Lausanne, Switzerland
  2. Swiss Institute of Bioinformatics, Switzerland
  3. University Center for Primary Care and Public Health, Switzerland
  4. Department of Computational Biology, University of Lausanne, Switzerland

Abstract

Despite the success of genome-wide association studies (GWASs) in identifying genetic variants associated with complex traits, understanding the mechanisms behind these statistical associations remains challenging. Several methods that integrate methylation, gene expression, and protein quantitative trait loci (QTLs) with GWAS data to determine their causal role in the path from genotype to phenotype have been proposed. Here, we developed and applied a multi-omics Mendelian randomization (MR) framework to study how metabolites mediate the effect of gene expression on complex traits. We identified 216 transcript-metabolite-trait causal triplets involving 26 medically relevant phenotypes. Among these associations, 58% were missed by classical transcriptome-wide MR, which only uses gene expression and GWAS data. This allowed the identification of biologically relevant pathways, such as between ANKH and calcium levels mediated by citrate levels and SLC6A12 and serum creatinine through modulation of the levels of the renal osmolyte betaine. We show that the signals missed by transcriptome-wide MR are found, thanks to the increase in power conferred by integrating multiple omics layer. Simulation analyses show that with larger molecular QTL studies and in case of mediated effects, our multi-omics MR framework outperforms classical MR approaches designed to detect causal relationships between single molecular traits and complex phenotypes.

Editor's evaluation

The reviewers found that your article brings important new methods and insight for how to analyze large, complex, multi-omic datasets in order to highlight specific molecular hypotheses for follow-up validation. As realistic/affordable sample sizes for population studies with omics data have recently exploded in size, this has raised the clear need for new or adapted statistical methods for best exploiting the increased statistical power. This work is compelling and we believe it should be of general interest to biologists and biostatisticians, and of particular interest to those working on (or those who could work on) large cohorts.

https://doi.org/10.7554/eLife.81097.sa0

Introduction

Genome-wide association studies (GWASs) have identified thousands of single nucleotide polymorphisms (SNPs) associated with a wide range of complex traits (MacArthur et al., 2017; Visscher et al., 2017). However, the path from GWAS to biology is not straightforward as most SNPs implicated by GWASs reside in non-coding regions of the genome (MacArthur et al., 2017) and do not directly inform on the functional mechanism through which variants exert their effect on phenotypes.

GWASs have been performed on gene expression (Võsa et al., 2021), DNA methylation (Min et al., 2021), protein (Sun et al., 2018), and metabolite (Shin et al., 2014; Lotta et al., 2021) levels, identifying genetic variants influencing molecular traits, commonly referred to as molecular quantitative trait loci (molQTLs). The large overlap between complex and molecular trait-associated variants suggests that integrating these data can help interpreting GWAS loci (Vandiedonck, 2018; Taylor et al., 2019; Ongen et al., 2017). Advances in the field of transcriptomics make gene expression the best studied molecular phenotype, thanks to the presence of large expression QTL (eQTL) studies (e.g., eQTLGen Consortium [Võsa et al., 2021] N>30,000). Availability of these datasets fostered the development of summary statistic-based statistical approaches aiming at identifying associations between transcripts and complex traits (Zhu et al., 2016; Porcu et al., 2019; Hormozdiari et al., 2014; Gusev et al., 2016), prioritizing genes from known GWAS loci for functional follow-up, and inferring the directionality of these relations (Porcu et al., 2019; Porcu et al., 2021b). However, the cascade of events that mediates the effect of genetic variants on complex traits involves more than one molecular trait. Although approaches used for gene expression can be extended to other molecular data, investigating whether these molecular traits reside along the same causal pathway remains under-explored and only recently have studies applied colocalization and Mendelian randomization (MR) to methylation, gene expression, and protein levels data (Giambartolomei et al., 2018; Wu et al., 2018; Gleason et al., 2020; Sadler et al., 2022) and to a lesser extent to metabolic QTLs (mQTL) (Yin et al., 2022).

Metabolites are often the final products of cellular regulatory processes and the most proximal omic layer to complex phenotypes. Their levels could thus represent the ultimate response of biological systems to genetic and environmental changes. For instance, the metabolic status of organisms reflects disease progression, as metabolic disturbances can often be observed several years prior to the symptomatic phase (Shah et al., 2010; Wang et al., 2011; Sabatine et al., 2005). Therefore, using metabolomics to identify early-stage biomarkers of complex phenotypes, such as prediabetes and COVID-19 susceptibility, has gained increased interest (Wang-Sattler et al., 2012; Julkunen et al., 2021). While two-sample MR approaches using metabolites as single exposure have revealed biomarkers for several diseases (Qian et al., 2021; Lord et al., 2021; Porcu et al., 2021a), these analyses focused on the prediction of disease risk rather than on deciphering the mechanisms of discovered associations.

Integrating transcriptomics with metabolomics data can provide insights into how metabolites are regulated, elucidating targetable functional mechanisms. Here, we develop a framework based on established MR methodology that hypothesizes a mediating role of the metabolome in the transcript-to-phenotype axis, with the primary exposure being defined as an upstream omic layer, namely gene expression. Specifically, our integrative MR analysis combines summary-level multi-omics (i.e., GWAS, eQTL, and mQTL) data to compute the indirect effect of gene expression on complex traits mediated by metabolites in three steps (Figure 1). First, we map the transcriptome to the metabolome by identifying causal associations between transcripts and metabolites. Next, we screen metabolites for downstream causal effects on 28 complex phenotypes, resulting in the identification of gene expression → metabolite → phenotype cascades (Figure 1A). In parallel, we prioritize trait-associated genes by testing the association of transcripts with phenotypes (Figure 1B). Third, for transcripts found to causally influence either a metabolite (A) or a complex phenotype (B), we test whether the identified target genes exert their effect on the phenotype through the metabolite using multivariable MR (MVMR; Figure 1C). Finally, we carried out extensive power analyses to determine under which conditions the mediation analysis (Figure 1C) outperforms the conventional exposure-outcome MR framework (Figure 1B).

Figure 1 with 1 supplement see all
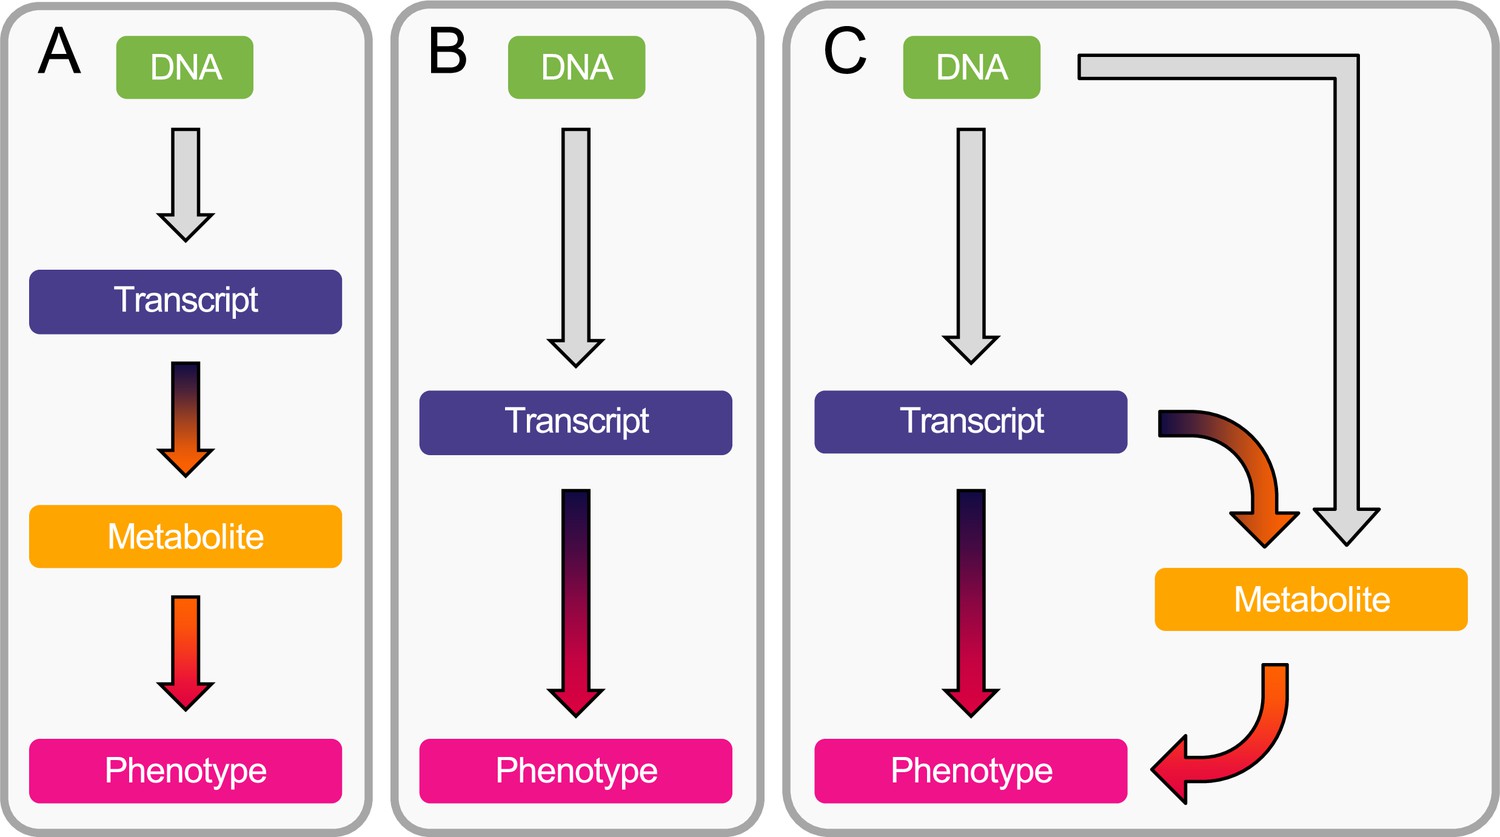
Workflow overview.

(A) Estimation of the causal transcript-to-metabolite and metabolite-to-phenotype effects through univariable Mendelian randomization (MR). (B) Estimation of the causal transcript-to-phenotype effects through univariable transcriptome-wide MR (TWMR). (C) Estimation of the direct (i.e., not mediated by the metabolites) and mediated effect of transcripts on phenotypes through multivariable MR (MVMR) by accounting for mediation through the metabolome.

Results

Mapping the transcriptome onto the metabolome

We applied univariable MR to identify metabolites whose levels are causally influenced by transcript levels in whole blood (Figure 1A). Summary statistics for cis-eQTLs stem from the eQTLGen Consortium meta-analysis of 19,942 transcripts in 31,684 individuals (Võsa et al., 2021), while summary statistics for mQTLs originate from a meta-analysis of 453 metabolites in 7824 individuals from two independent European cohorts: TwinsUK (N = 6056) and KORA (N = 1768) (Shin et al., 2014). After selecting SNPs included in both the eQTL and mQTL studies, our analysis was restricted to 7884 transcripts with ≥3 instrumental variables (IVs) (see Methods, Figure 1—figure supplement 1A) and 242 metabolites with an identifier in the Human Metabolome Database (HMDB) (Wishart et al., 2022) (see Methods, Supplementary file 1a). By testing each gene for association with the 242 metabolites, we detected 96 genes whose transcript levels causally impacted 75 metabolites, resulting in 133 unique transcript-metabolite associations (FDR 5% considering all 1,907,690 instrumentable gene-metabolite pairs; Supplementary file 1b). Most involved genes (86%; 83/96) were causally influencing the level of a single metabolite, with some notable exceptions acting as mQTL hubs, such as TMEM258 and FADS2 both affecting the same 11 metabolites, followed by FADS1 affecting a subset of six metabolites. While only 5 (3.8%) of the 133 associations were reported in HMDB, an automated literature review (see Methods) identified a match for 22 (16.5%) of the identified transcript-metabolite pairs (Supplementary file 1b).

Mapping the metabolome onto complex phenotypes

Univariable metabolome-wide MR (MWMR; Figure 1A) was used to identify causal relationships between 48 metabolites with ≥3 IVs (Figure 1—figure supplement 1B) and 28 complex phenotypes. The latter include a wide range of anthropometric traits, cardiovascular assessments, and blood biomarkers, whose summary statistics originate from the UK Biobank (UKB) (Bycroft et al., 2018;Supplementary file 1c). Overall, 34 metabolites were associated with at least one phenotype (FDR 5% considering all 1344 metabolite-phenotype pairs), resulting in 132 unique metabolite-phenotype associations (Supplementary file 1d).

Mapping the transcriptome onto complex phenotypes

We applied univariable transcriptome-wide MR (TWMR [Porcu et al., 2019] Figure 1B) to identify associations between expression levels of 10,435 transcripts from the eQTLGen Consortium with ≥3 IVs (Figure 1—figure supplement 1C) measured in both exposure and outcome datasets and the same 28 UKB phenotypes described in the previous section (Supplementary file 1c). In total, 5140 transcripts associated with at least one phenotype (FDR 5% considering all 292,170 gene-phenotype pairs) resulting in 13,141 unique transcript-phenotype associations (Supplementary file 1e).

Mapping metabolome-mediated effects of the transcriptome onto complex phenotypes

The mapping of putative causal effects performed in the previous steps provides the opportunity to infer the mediating role of the metabolome in biological processes leading to transcript-phenotype associations. We combined the 133 transcript-metabolite (FDR ≤5%) and 132 metabolite-trait (FDR ≤5%) associations to pinpoint 216 transcript-metabolite-phenotype causal triplets (FDR = 1–0.952 = 9.75%) (Supplementary file 1f). Among the 37 triplets for which the transcript and metabolite had previously been linked through automated literature review, none remained after incorporating a third term for the phenotype in the search and manually removing abstracts for which the search terms were used in an erroneous context. Relaxing the search criteria by omitting the metabolite term, 13/37 (35%) triplets returned at least one match for the gene-trait association.

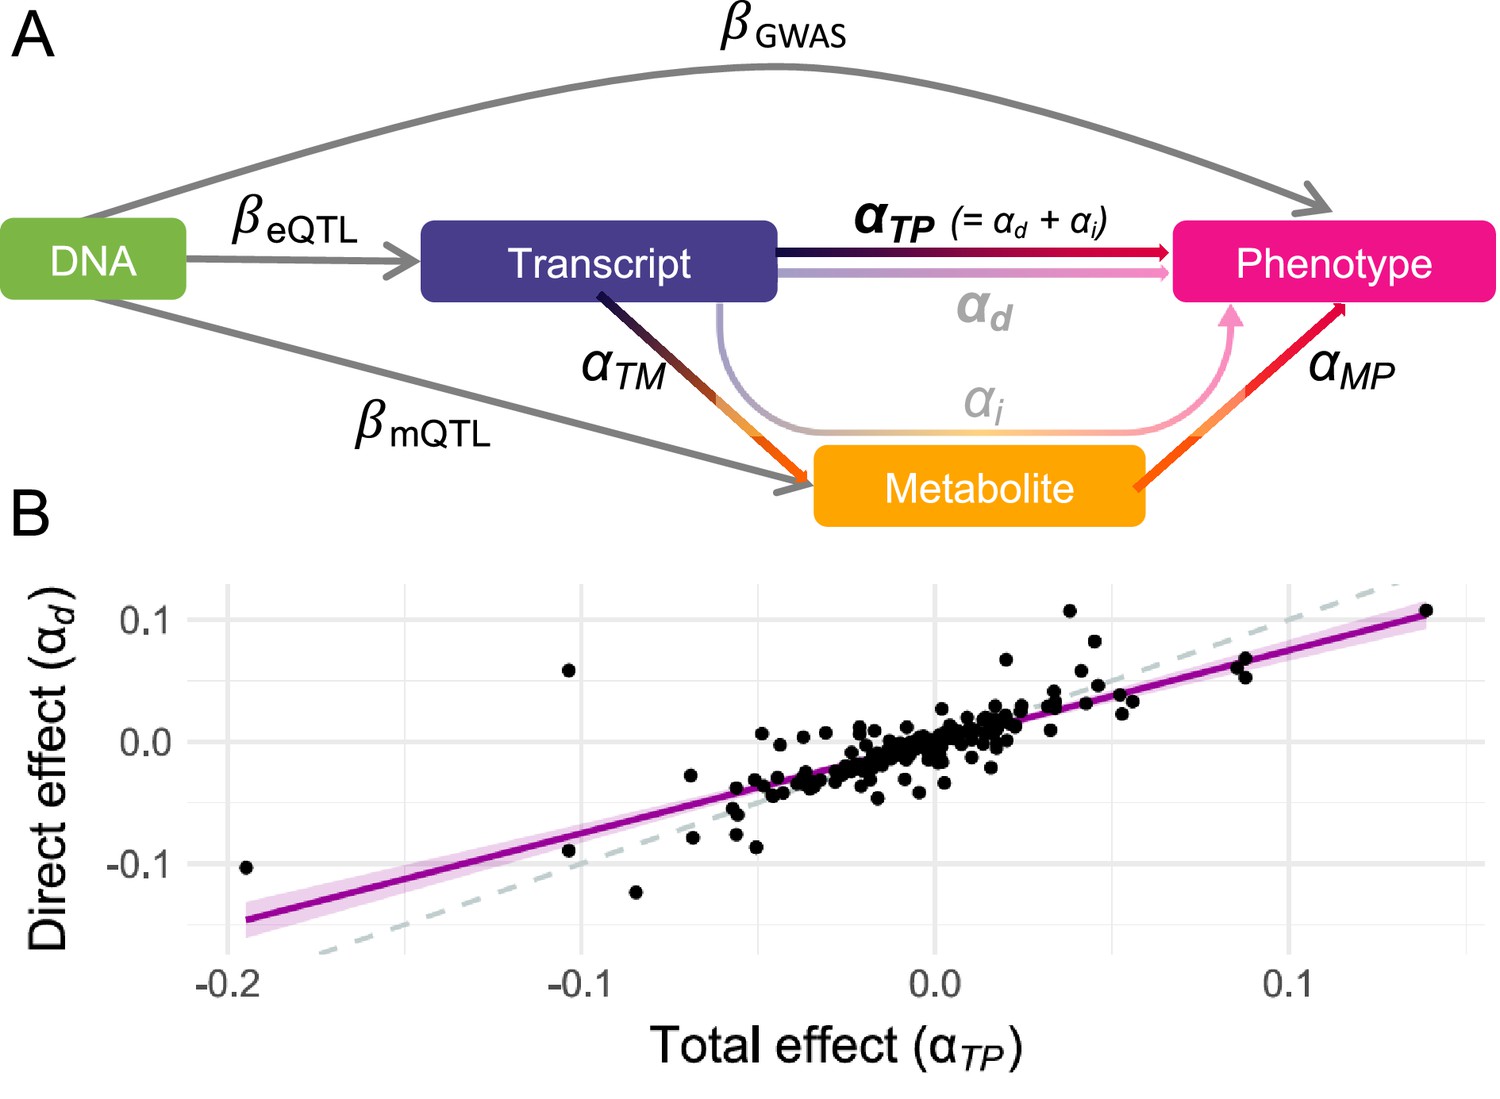
For each of these 216 putative mechanisms, an MVMR approach to compute the direct effect of gene expression on the phenotype was applied (see Methods; Figure 1C; Supplementary file 1f). Regressing direct effects (αd) on total effects (αTP) and accounting for regression dilution bias (see Methods; Figure 2A), it was estimated that 77% [95% CI: 70–85%] of the transcript effect on the phenotype was direct and thus not mediated by the metabolites (Figure 2B).

Direct and mediated effects.

(A) Graphical representation of the multivariable Mendelian randomization (MVMR) framework for mediation analysis: DNA represents genetic instrumental variables (IVs) chosen to be directly associated with either the exposure (transcript; βeQTL) or the mediator (metabolite; βmQTL) through summary statistics. The effect of these IVs on the outcome (phenotype; βGWAS) originates from genome-wide association studies (GWASs) summary statistics. Total effects αTP of transcripts on phenotypes are estimated by transcriptome-wide Mendelian randomization (TWMR), while direct effects αd are estimated by MVMR. Total effects αTP are assumed to equal the sum of the direct αd and indirect αi (i.e., mediated) effects, the two former being depicted in B. (B) Direct (αd ; y-axis) and total (αTP ; x-axis) effects for the 216 transcript-metabolite-trait causal triplets. The dashed line represents the identity, while the purple line represents the regression line with a shaded 95% confidence interval. Data related to Figure 2 panel B are available in Figure 2—source data 1.

Figure 2—source data 1

Direct and mediated effects.

Total (αTP ; transcript-to-phenotype effect) and direct (αd ; direct_effect) effects for the 216 transcript-metabolite-trait causal triplets involving the listed transcript (Gene_ID), metabolite (Shin_ID), and complex phenotype. This file relates to Figure 2B.

https://cdn.elifesciences.org/articles/81097/elife-81097-fig2-data1-v1.xlsx

Molecular mechanisms of genotype-to-phenotype associations

Dissecting causal triplets allows gaining mechanistc insights into biological pathways linking genes to phenotypes. For instance, expression of TMEM258 [MIM: 617615], FADS1 [MIM: 606148], and FADS2 [MIM: 606149], all mapping to a region on chromosome 11 (Figure 3A), were found to influence a total of 17 complex phenotypes through modulation of 1-arachidonoylglycerophosphocholine (LPC(20:4); HMDB0010395; αTMEM258LPC(20:4)=1.02; P = 8.0×10–81; αFADS1LPC(20:4)=0.39; P = 4.6×10⁻¹⁵; αFADS2LPC(20:4)=0.63; P = 5.1×10–62), 1-arachidonoylglycerophosphoethanolamine (LPE(20:4);HMDB0011517; αTMEM258LPE(20:4)=0.68; P = 1.1×10–37; αFADS1LPE(20:4)=0.30; P = 1.4×10–07; αFADS2LPE(20:4)=0.37; P = 1.2×10⁻¹⁸), and 1-arachidonoylglycerophosphoinositol (LPI(20:4); HMDB0061690; αTMEM258LPI(20:4)=0.51; P = 8.2×10⁻¹⁸; αFADS2LPI(20:4)=0.28; P = 6.3×10⁻¹⁶) levels (Figure 3B–C). These results align with the known pleiotropy of the region (i.e., >6000 associations reported in the GWAS Catalog as of May 2022). Interestingly, involved metabolites are complex lipids synthesized from arachidonic acid, a product of the rate-limiting enzymes encoded by FADS1 and FADS2 (Figure 3B). Recently, polymorphisms affecting the expression of these genes were shown to associate with the levels of over 50 complex lipids, including the ones identified by our study (Reynolds et al., 2020). Overall, this example illustrates how our method can capture meaningful biological associations and shed light on underlying molecular pathways of pleiotropy.

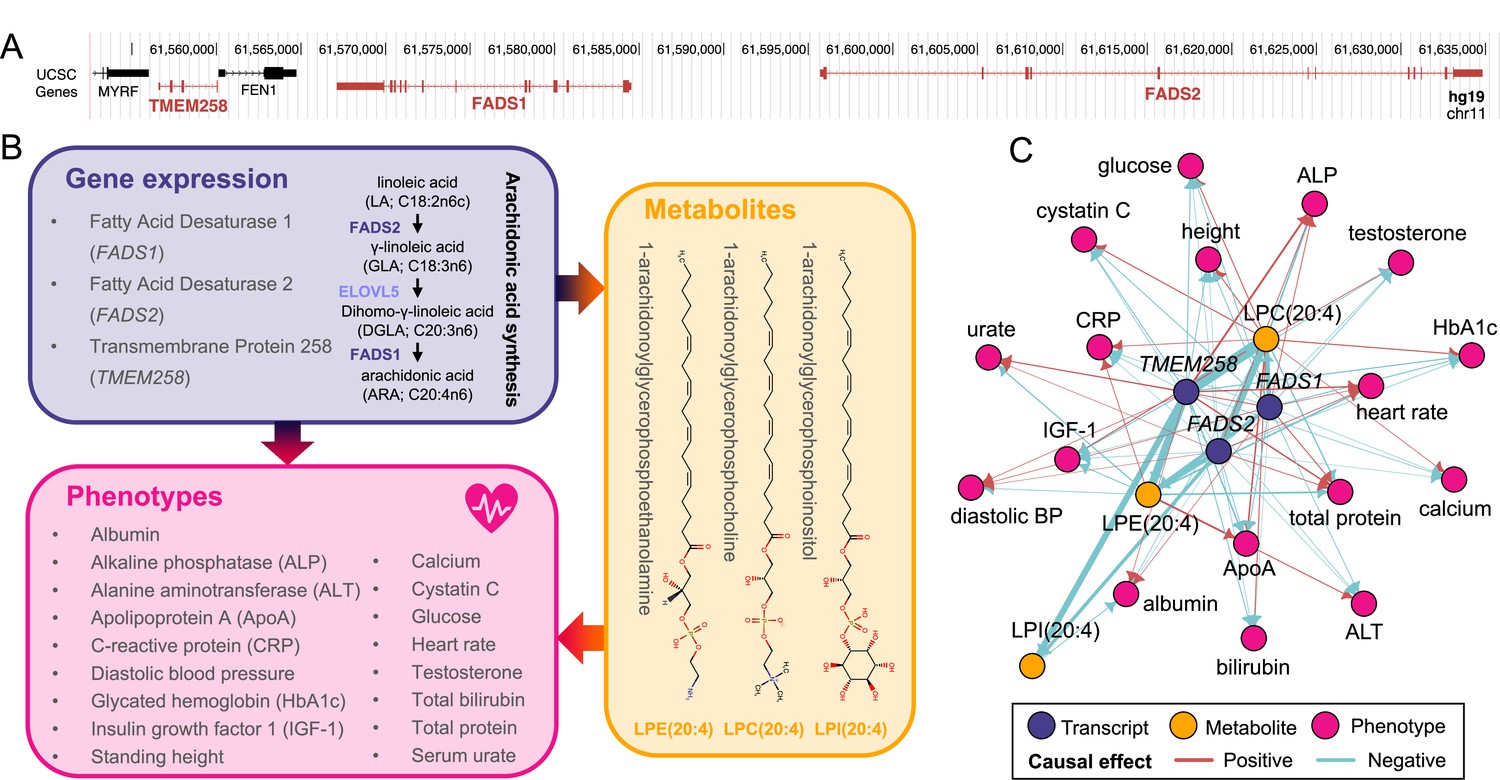
Molecular pleiotropy at the FADS locus.

(A) Genome browser (GRCh37/hg19) view of the genomic region on chromosome 11 encompassing TMEM258, FADS1, and FADS2 (red). (B) Diagram of the mediation signals detected for TMEM258, FADS1, and FADS2. Two of the implicated genes encode enzymes involved in arachidonic synthesis (purple). Involved genes impact 17 phenotypes (pink) through alteration of the levels of three metabolites, 1-arachidonoylglycerophosphocholine (LPC(20:4)), 1-arachidonoylglycerophosphoethanolamine (LPE(20:4)), and 1-arachidonoylglycerophosphoinositol (LPI(20:4)) whose structure is depicted (orange). (C) Network of the 65 transcript-metabolite-trait causal triplets involving TMEM258, FADS1, and FADS2. Nodes represent genes (purple), metabolites (orange), or phenotypes (pink). Edges indicate the direction of the effects estimated through univariable Mendelian randomization. Width of edges is proportional to effect size and color indicates if the effect is positive (red) or negative (blue).

Power analysis

Importantly, only 42% (90/216) of the causal triplets showed a significant total transcript-to-phenotype effect (i.e., estimated by TWMR), suggesting that the method lacks power under current settings. To characterize the parameter regime where the power to detect indirect effects is larger than it is for total effects, we performed simulations using different settings for the mediated effect. In each scenario we evaluated 500 transcripts and 80 metabolites and varied two parameters characterizing the mediation:

  1. The proportion (ρ) of direct (αd) to total (αTP) effect (i.e., effect not mediated by the metabolite) from –2 to 2 to cover the cases where direct and mediated effect have opposite directions (51 values).

  2. The ratio (σ) between the transcript-to-metabolite (αTM) and the metabolite-to-phenotype (αMP) effects, exploring the range from 0.1 to 10 (51 values).

Transcripts were simulated with 6% heritability (i.e., median h2 in the eQTLGen data) and a causal effect of 0.035 (i.e., ~65% of power in TWMR at α=0.05) on a phenotype. Each scenario was simulated 10 times and results were averaged to assess the mean difference in power (see Methods).

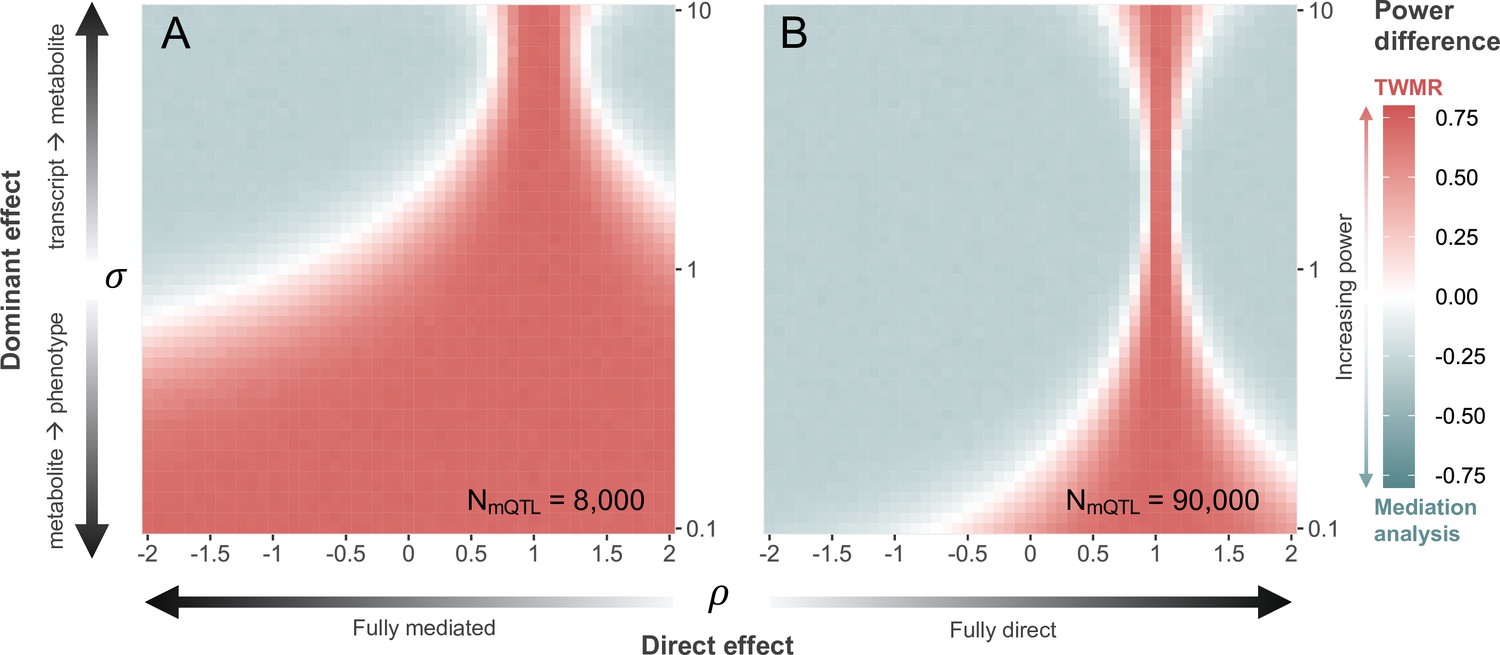
Simulations show that with current sample sizes (i.e., NGWAS=300,000, NeQTL=32,000, and NmQTL=8000), when αMP>αTM (i.e., σ<1), TWMR has increased power to detect significant transcript-to-phenotype associations, especially when ρ>0 (i.e., direct and total effect have the same direction (Figure 4A)). However, for all 216 causal triplets, we observed σ>1 (Figure 4—figure supplement 1). Under this condition, and assuming that the total effect of the transcript on the phenotype is dominated by the effect mediated by the metabolite (i.e., ρ<0.5 and ρ>1.5), TWMR had less power than the approach identifying mediators (Figure 4A), confirming that significant associations were missed by TWMR due to power issues related to the proportion of mediated effect.

Figure 4 with 2 supplements see all
Power comparison between transcriptome-wide Mendelian randomization (TWMR) and multivariable Mendelian randomization (MVMR).

Heatmap showing the difference in statistical power between TWMR and mediation analysis through MVMR at current (A; N=8000) and realistic future (B; N=90,000) metabolic quantitative trait loci (mQTL) dataset sample sizes. The x-axis shows the proportion (ρ) of direct (αd) to total (αTP) effect (i.e., effect not mediated by the metabolite) ranging from –2 to 2, arrows indicating increasing proportion of direct effect. The y-axis shows the ratio (σ) between the transcript-to-metabolite (αTM) and the metabolite-to-phenotype (αMP) effects, ranging from 0.1 to 10. Red vs. gray indicates higher power for TWMR vs. mediation analysis, respectively, while white represents equal power between the two approaches. Data related to Figure 4 panels A and B are available in Figure 4—source data 1 and Figure 4—source data 2, respectively.

Figure 4—source data 1

Difference in statistical power between transcriptome-wide Mendelian randomization (TWMR) and mediation analysis at N = 8000 metabolic quantitative trait locus (mQTL) dataset sample size.

Each cell represents the mean difference in power between TWMR and mediation analysis for a given scenario across 10 simulations. Rows reflect decreasing ratio between transcript-to-metabolite and metabolite-to-phenotype effects from 10 to 0.1 (sigma). Columns reflect increasing proportion of direct to total effect from –2 to 2 (rho). This file relates to Figure 4A.

https://cdn.elifesciences.org/articles/81097/elife-81097-fig4-data1-v1.xlsx
Figure 4—source data 2

Difference in statistical power between transcriptome-wide Mendelian randomization (TWMR) and mediation analysis at N = 90,000 metabolic quantitative trait locus (mQTL) dataset sample size.

Each cell represents the mean difference in power between TWMR and mediation analysis for a given scenario across 10 simulations. Rows reflect decreasing ratio between transcript-to-metabolite and metabolite-to-phenotype effects from 10 to 0.1 (sigma). Columns reflect increasing proportion of direct to total effect from –2 to 2 (rho). This file relates to Figure 4A.

https://cdn.elifesciences.org/articles/81097/elife-81097-fig4-data2-v1.xlsx

Repeating the simulations with an mQTL sample size of 90,000, nearing state-of-the-art sample sizes (Lotta et al., 2021), leads to a strong shift in the above-described trends (Figure 4B). Specifically, when the effect of the transcript on the phenotype is dominated by the effect mediated by the metabolite (ρ<0.3 and ρ>1.7), mediation analysis has more power than TWMR when σ>0.2. For larger proportions of direct effect, TWMR has increased power the more σ differs from 1. In line with the increased power of mediation analysis with larger mQTL datasets, the gain in power of mediation analysis over TWMR decreases with decreasing mQTL dataset sample sizes (ranging between N = 1000 and N = 4000; Figure 4—figure supplement 2), indicating that our approach is dependent on large sample sizes to reach its full potential.

Identifying new genotype-to-phenotype associations

The 126 triplets that were not identified through TWMR due to power issues represent putative new causal relations. This is well illustrated by a proof-of concept example involving ANKH [MIM: 605145] and calcium levels, for which 48 publications were identified through automated literature review (Supplementary file 1f). While the TWMR effect of ANKH expression on calcium levels was not significant (αANKHcalcium=-0.02; P=0.03), ANKH expression decreased citrate levels (αANKHcitrate=-0.30; P=2.2×10–06), which itself increased serum calcium levels (αcitratecalcium=0.07; P=6.5×10–0). Mutations in ANKH have been associated with several rare mineralization disorders [MIM: 123000, 118600] (Williams, 2016) due to the gene encoding a transmembrane protein that channels inorganic pyrophosphate to the extracellular matrix, where at low concentrations it inhibits mineralization (Ho et al., 2000). Recently, a study proposed that ANKH instead exports ATP to the extracellular space (where it is then rapidly converted to inorganic pyrophosphate), along with citrate (Szeri et al., 2020). Citrate has a high binding affinity for calcium and influences its bioavailability by complexing calcium-phosphate during extracellular matrix mineralization and releasing calcium during bone resorption (Granchi et al., 2019). Together, our data support the role of ANKH in calcium homeostasis through regulation of citrate levels, connecting previously established independent links into a causal triad.

In another example, SLC6A12 [MIM: 603080], which encodes the betaine/GABA transporter-1, involved in betaine and GABA uptake (Borden et al., 1995), was identified as a negative regulator of betaine (αSLC6A12betaine=-0.37; P = 8.2×10–08). While blood betaine levels negatively impacted serum creatinine levels (αbetainecreatinine=-0.06; P = 1.7×10–07), the effect of SLC6A12 expression on creatinine was not significant (αSLC6A12creatinine=0.02; P = 1.5×10–03). This observation is particularly interesting given that betaine acts as a protective renal osmolyte whose plasma and kidney tissue concentration were found to be downregulated in renal ischemia/reperfusion injury (Jouret et al., 2016; Wei et al., 2014) and whose urine levels have been proposed as a biomarker for chronic kidney disease progression (Gil et al., 2018). As both renal conditions are commonly monitored through serum creatinine levels, our data support the critical role of osmolyte homeostasis in renal health.

Discussion

In this study, we combined MR approaches integrating eQTL, mQTL, and GWAS summary statistics to explore the role of the metabolome in mediating the effect of the transcriptome on complex phenotypes. Applied to 28 medically relevant traits, our approach revealed 216 causal transcript-metabolite-phenotype triplets. Our automated literature review indicates that while some detected associations were previously reported, a large fraction, especially among the triplets, appears to be novel. It should be noted that the number of previously reported associations is likely underestimated as our approach does not account for all synonyms of a given feature and requires the terms to appear in the title or abstract of the publication. This makes it more likely for hypothesis-driven studies, inherently biased toward well-studied genes and metabolites, to be identified. Conversely, high-throughput, hypothesis-free studies that report the given association in a supplemental table are likely to be missed. Furthermore, due to its automated nature, our search is context-blind, so that some of the identified studies might report negative results, associations only under specific conditions (e.g., different organisms, experimental settings), or usage of the search term with a different meaning. To attenuate the latter, we also performed manual review of the retained abstracts for transcript-to-phenotype searches. While flawed, this rough estimate of the amount of existing evidence supporting our findings can be interpreted in combination with other lines of evidence. For instance, among the 90 signals that were also identified through TWMR, 93% showed a directionally concordant effect between the transcript-to-phenotype, transcript-to-metabolite, and metabolite-to-phenotype estimates (i.e., sign of product of the transcript-to-metabolite and metabolite-to-phenotype effects agrees with the sign of the transcript-to-phenotype effect). In these situations, dissection of causal effects provides clues as to the molecular mechanism through which involved genes modify complex phenotypes. This information is particularly valuable to identify key molecular mediators of highly pleiotropic genetic regions, such as the TMEM258/FADS1/FADS2 locus (Figure 3). While transcript levels of these genes affected eleven metabolites, three complex lipids were highlighted as strong molecular mediators of the transcript-to-phenotype effects.

Strikingly, 58% of the 216 causal transcript-metabolite-phenotype triplets were missed by TWMR – an approach that only considers gene expression and GWAS data. We highlight two novel but biologically plausible mechanisms linking ANKH to calcium levels through modulation of citrate and SLC6A12 to serum creatinine levels through regulation of the renal osmolyte betaine. Simulation analyses showed that these signals were likely missed by TWMR due to lack of power, as mediation analysis is better suited to detect associations with a low direct to total effect proportion and stronger transcript-to-metabolite than metabolite-to-phenotype effect. Promisingly, our simulations showed that mediation analysis becomes increasingly powerful over a wider range of parameter settings as the sample size of the mediator QTL study increases, highlighting the importance of generating large and publicly available molQTL datasets that can help to unravel functional gene-to-phenotype mechanisms.

As illustrated through the selected examples, a large fraction of detected mediations involves genes encoding metabolic enzymes or transporters/channels, with an enrichment for ‘secondary active transmembrane transporter activity’, for example (GO:0015291; FDR=0.021; background: 7884 genes with ≥3 IVs assessed through TWMR; STRING database). Matching the finding that the most likely effector genes of mQTLs are enriched for pathway-relevant enzymes and transporters (Smith et al., 2022), these results are not surprising given that the proteins encoded by these genes directly interact with metabolites, making it more likely that the effect of changes in their expression is mediated by metabolites. While our method is well suited to detect such effects, interpretation of discovered mediations is limited by the lack of spatial resolution of the mQTL data. Access to metabolite concentrations in different cellular compartments (e.g., extracellular space, cytosol, mitochondrial matrix, etc.) would generate more fine-tuned mechanistic hypotheses that consider the directionality of metabolite fluxes.

The observation that 77% of the transcript’s effect on the phenotype is not mediated by metabolites suggests that either true direct effects are frequent or that other unassessed metabolites or molecular layers (e.g., proteins, post-translational modifications, etc.) play a crucial role in mediation. It is to note that in the presence of unmeasured mediators or measured mediators without genetic instruments, our mediation estimates are lower bounds of the total existing mediation. In addition, unmeasured mediators sharing genetic instruments with the measured ones can modify result interpretation as some of the observed mediators may simply be correlates of the true underlying mediators. While this is a limitation of all MR methods, metabolic networks may harbor particularly large number of genetically correlated metabolite species. Similarly, owing to linkage disequilibrium and regulatory variants affecting multiple genes, transcripts from adjacent genes might appear to be involved in the same signals, as exemplified with the TMEM258/FADS1/FADS2 locus (Figure 3). While literature supports the role of the FADS genes, one cannot exclude a role for TMEM258, nor disentangle the specific function of FADS1 and FADS2. Thanks to the flexibility of the proposed framework, we expect that in the future and upon availability of ever larger and more diverse datasets, our method could be applied to estimate the relative contribution of currently unassessed mediators in translating genotypic cascades.

Another consideration is that complex phenotypes can have a stronger impact on gene expression than the opposite (Porcu et al., 2021b). Due to the lack of genome-wide trans-eQTL association summary statistics, our method does not investigate reverse causality on metabolites and gene expression, nor the role of metabolites as regulators of gene expression. Metabolites might also integrate the effect of several transcripts (i.e., multiple transcripts causally impact the levels of the same metabolite) before affecting complex phenotypes (Supplementary file 1g) or multiple metabolites may jointly mediate the impact of a single transcript. Modelling the latter phenomenon, which is beyond the scope of our current work, requires the development of structural equation models accounting for such effects and will eventually lead to a more comprehensive modelling of causal relations in complex biological networks, nuancing the interpretation of the molecular mechanisms shaping complex traits.

In conclusion, we developed a modular MR framework that has increased power over classical MR approaches to detect causal transcript-to-phenotype relationships when these are mediated by alteration of metabolite levels and is likely to become increasingly powerful upon release of larger molQTL datasets.

Methods

Univariable MR analyses

TWMR and MWMR (Porcu et al., 2019) were used to estimate the causal effects of transcript and metabolite levels (exposure) on various outcomes. For each transcript/metabolite, using inverse-variance weighted (IVW) method for summary statistics (Burgess et al., 2013), the causal effect of the molecular traits on the outcome was defined as

(1) α^=(βC1β)1(βC1γ)

Here, β is a vector of length n containing the standardized effect size of n independent SNPs on the gene/metabolite, derived from eQTL/mQTL studies, with β` being the transpose of β. γ is a vector of length n containing the standardized effect size of each SNP on the outcome. C is the pairwise LD matrix between the n SNPs. The standardized effect sizes for molecular and outcome GWASs were obtained from Z-score of summary statistics standardized by the square root of the sample size to be on the same standard deviation scale.

IVs were selected as autosomal, non-strand ambiguous, independent (r2 <0.01), and significant (PeQTL<1.8×1005 / PmQTL<1.0×1007) eQTL/mQTLs available in the UK10K reference panel (Huang et al., 2015) using PLINK (v1.9) (Chang et al., 2015). As retained SNPs are independent, we used the identity matrix to approximate C. SNPs with larger effects on the outcome than on the exposure were removed, as these potentially indicate violation of the MR assumptions (i.e., likely reverse causality and/or confounding).

The variance of α can be calculated approximately by the Delta method

(2) var(α^)= (α^β)2var(β^)+(α^γ)2var(γ^)+(α^β)(α^γ)cov(β^,γ^)

where cov(β,γ) is 0 if β and γ are estimated from independent samples. The causal effect Z-statistic for transcript/metabolite i was defined as α^iSE(α^i), where SE(α^i)=var(α^)i,i .

The IVW method provides an unbiased estimate under the assumption that all genetic variants are valid IVs, that is, all three MR assumption hold. However, the third assumption (no pleiotropy) is easily violated, leading to inaccurate estimates when horizontal pleiotropy occurs (Verbanck et al., 2018). To test for the presence of pleiotropy, we used Cochran’s Q test (Bowden et al., 2015; Burgess et al., 2017) to assess whether there were significant differences between the MR effects of an instrument (i.e., αβi) and the estimated effect of that instrument on phenotype/metabolite levels (γi). We defined

(3) di=γi αβi

and its variance as

(4) var(di)=var(γi)+(βi)2var(α)+ var(γi)(α)2+ var(βi)var(α)

Next, the deviation of each SNP was tested using the test statistic

(5) Ti=di2var(di)   χ12

When p<0.05, the SNP with largest | di | was removed and the test was repeated.

Mediation analysis through MVMR analyses

An MVMR approach was used to dissect the total causal effect of transcript levels on phenotypes (αTP) into a direct (αd) and indirect (αi) effect measured through a metabolite. Through inclusion of a metabolite and its associated genetic variants (r2 <0.01, pmQTL<1 × 10–07), the direct effect of gene expression on a phenotype can be estimated using a multivariable regression model (Burgess et al., 2013) as the first element of

(6) α^=(BC1B)1(BC1γ)

where B is a matrix with two columns containing the standardized effect sizes of n IVs on transcript levels in the first column and on the metabolite levels in the second column, γ is a vector of length n containing the standardized effect size of each SNP on the phenotype, and C is the pairwise LD matrix between the n SNPs.

The proportion of direct effect (ρ) is calculated by regressing direct effects (αd) on total effects (αTP) and then correcting for regression dilution bias:

(7) ρcorrected= ρ1(SE(αTP))2αTP2

Omics and traits summary statistics

Expression QTL data originated from the eQTLGen Consortium (Võsa et al., 2021) (N = 31,684), which includes cis-eQTLs (<1 Mb from gene center, two-cohort filter) for 19,250 transcripts (16,934 with at least one significant cis-eQTL at FDR <0.05 corresponding to p<1.8 × 10–05). mQTL data originate from Shin et al., 2014, which used ultra-high performance liquid chromatography-tandem mass spectrometry to measure 486 whole blood metabolites in 7824 European individuals. Association analyses were carried out on ~2.1 million SNPs and are available for 453 metabolites at the Metabolomics GWAS Server (http://metabolomics.helmholtz-muenchen.de/gwas/). Among these metabolites, 242 were manually annotated with the HMDB identifiers (Supplementary file 1a) and used in this study. GWAS summary statistics for 28 outcome traits measured in the UKB originate from the Neale Lab (http://www.nealelab.is/uk-biobank/). Protein interactions with metabolites were downloaded from HMDB v5.0 (https://hmdb.ca/downloads/) and were used to annotate transcript-metabolites associations.

Automated literature review

An automated literature review of all transcript-metabolite associations (Supplementary file 1b) was conducted in PubMed (September 20, 2022) following the scheme:

(8) (Gene[Title/Abstract]) AND ((MetHMDB[Title/Abstract]) OR (MetShin[Title/Abstract]))

With Gene being the name of the gene whose transcript is involved in the association, MetHMDB the involved metabolite’s common name on HMDB, and MetShin the involved metabolite’s name as reported in Shin et al., 2014. Returned PubMed identifiers were retrieved (Supplementary file 1b).

For transcript-metabolite associations involved in a causal triplet and for which the transcript-metabolites returned at least one publication (Supplementary file 1f), the search was extend by (i) adding an additional search term for the trait (i.e., AND (trait[Title/Abstract])) and (ii) substituting the metabolite term for the trait term. Returned PubMed identifiers were retrieved and corresponding abstracts were manually curated to exclude abstracts in which the search terms were used in a meaning other than the intended one (Supplementary file 1f).

Simulation analyses

Simulation analyses were conducted to assess the gain in power upon inclusion of metabolomics data in the MR framework. In the simulated scenario, a transcript has an effect on a phenotype mediated by a metabolite. Two parameters were allowed to vary: the proportion (ρ) of direct effect (i.e., effect not mediated by the metabolite) and the ratio (σ) between the effect of the transcript on the metabolite (αTM) and of the metabolite on the phenotype (αMP). Other parameters were fixed, including the heritability of the transcript at hT2=0.06 (corresponding to the median h2 in the eQTLGen data), the number of IVs NIVs at 6 (corresponding to the median number of IVs used in TWMR analyses). Effect sizes βeQTL are from a normal distribution βeQTLN(0,hT2NIVs). The causal effect of the transcript on the phenotype (αTP) was fixed to 0.035, which results in ∼65% power to detect a significant effect with TWMR. These quantities allowed to define βGWAS as βGWAS= αTP* βeQTL+ εP , where εPN(0,1NGWAS) with NGWAS=300,000 to reflect the sample size of UKB GWASs. The same vector of βeQTL was used to define βmQTL and estimate the causal effect of the transcript on the metabolite. βmQTL was defined as βmQTL=αTMβeQTL+εM , where εMN(0,1NmQTL) and NmQTL=8000 to reflect the sample size of the mQTL study used in this work. Simulations were also performed at NmQTL=90,000, to reflect sample size of potential future studies and NmQTL=1000, NmQTL=2000 and NmQTL=4000, to compare the two approaches’ power were the developed framework to be applied on existing smaller mQTL datasets. The total effect αTP can be expressed as αTP=αTM*αMP+ αdirect , where αdirect represents the direct effect of the transcript on the phenotype and αTM*αMP is the indirect effect mediated by the metabolite. Equivalently, αTM*αMP=αTP*(1-ρ) where ρ=αdirectαTP. To assess the ratio between the effect of the transcript on the metabolite and the effect of the metabolite on the phenotype (i.e., σ=αTM/αMP), αTM can be expressed as αTM=αTP(1ρ)σ . Similarly, to estimate the effect of the metabolite on the phenotype, a metabolite with heritability hM2=0.04 (corresponding to the median of h2 in the KORA +TwinsUK mQTL data) and NIVs=5 (corresponding to the median number of IVs used in MWMR analyses) is considered. Effect size βmQTL are from a normal distribution βmQTLN(0,hM2NIVs). These quantities allowed to define βGWAS as βGWAS= αTP*1-ρ/σ* βmQTL+ εP , where εPN(0,1NGWAS). Ranging ρ and σ from –2 to 2 and from 0.1 and 10, respectively, we run each simulation for 500 transcripts measuring 80 metabolites at each run and performed TWMR and MWMR starting from above-described βeQTL , βmQTL, and βGWAS. For each MR analysis the power to detect a significant association as well as the difference in power between TWMR and the mediation analyses (i.e., powerTP- powerTM*powerMP) was calculated. Each specific scenario was repeated 10 times and the average difference in power across simulation was plotted as a heatmap.

Data and code availability

All data used in this study are publicly available. GWAS summary statistics for outcome traits measured in the UKB originate from the Neale Lab (http://www.nealelab.is/uk-biobank/). eQTL data originated from the eQTLGen Consortium (https://www.eqtlgen.org) and was published in Võsa et al., 2021. mQTL data originate from Shin et al., 2014, and are available at the Metabolomics GWAS Server (http://metabolomics.helmholtz-muenchen.de/gwas/). The HMDB was used to annotate metabolites and the v5.0 release from November 9, 2021, of the ‘All proteins’ file was downloaded to extract transcript-metabolite interactions (https://hmdb.ca/downloads). PubMed was used for the automated literature review (https://pubmed.ncbi.nlm.nih.gov). The UCSC Genome Browser (https://genome.ucsc.edu/) was used to visualize the FADS locus, while the GWAS Catalog was used to assess the number of reported GWAS signals in the region (https://www.ebi.ac.uk/gwas/). The STRING database was used for the enrichment analysis (https://string-db.org/). Produced data is available as Supplementary file 1 and Source Data. Code used to perform analyses is freely available at https://github.com/eleporcu/Gene_Metab_Pheno; (Porcu, 2022 copy archived at swh:1:rev:c6bff8d094e369ff0d399751fc85fcd5ea250134).

Data availability

All data used in this study are publicly available. GWAS summary statistics for outcome traits measured in the UK Biobank originate from the Neale Lab (http://www.nealelab.is/uk-biobank/). eQTL data originated from the eQTLGen Consortium (https://www.eqtlgen.org) and was published in Vosa et al., 2021 [3]. mQTL data originate from Shin et al. 2014 [6], and are available at the Metabolomics GWAS Server (http://metabolomics.helmholtz-muenchen.de/gwas/). The Human Metabolome Database (HMDB) was used to annotate metabolites and the v5.0 release from 2021-11-09 of the "All proteins" file was downloaded to extract transcript-metabolite interactions (https://hmdb.ca/downloads). PubMed was used for the automated literature review (https://pubmed.ncbi.nlm.nih.gov). The UCSC Genome Browser (https://genome.ucsc.edu/) was used to visualize the FADS locus, while the GWAS Catalog was used to assess the number of reported GWAS signals in the region (https://www.ebi.ac.uk/gwas/). The STRING database was used for the enrichment analysis (https://string-db.org/). Produced data is available as Supplementary File 1 and Source Data. Code used to perform analyses is freely available at https://github.com/eleporcu/Gene_Metab_Pheno; (copy archived at swh:1:rev:c6bff8d094e369ff0d399751fc85fcd5ea250134).

References

    1. Min JL
    2. Hemani G
    3. Hannon E
    4. Dekkers KF
    5. Castillo-Fernandez J
    6. Luijk R
    7. Carnero-Montoro E
    8. Lawson DJ
    9. Burrows K
    10. Suderman M
    11. Bretherick AD
    12. Richardson TG
    13. Klughammer J
    14. Iotchkova V
    15. Sharp G
    16. Al Khleifat A
    17. Shatunov A
    18. Iacoangeli A
    19. McArdle WL
    20. Ho KM
    21. Kumar A
    22. Söderhäll C
    23. Soriano-Tárraga C
    24. Giralt-Steinhauer E
    25. Kazmi N
    26. Mason D
    27. McRae AF
    28. Corcoran DL
    29. Sugden K
    30. Kasela S
    31. Cardona A
    32. Day FR
    33. Cugliari G
    34. Viberti C
    35. Guarrera S
    36. Lerro M
    37. Gupta R
    38. Bollepalli S
    39. Mandaviya P
    40. Zeng Y
    41. Clarke T-K
    42. Walker RM
    43. Schmoll V
    44. Czamara D
    45. Ruiz-Arenas C
    46. Rezwan FI
    47. Marioni RE
    48. Lin T
    49. Awaloff Y
    50. Germain M
    51. Aïssi D
    52. Zwamborn R
    53. van Eijk K
    54. Dekker A
    55. van Dongen J
    56. Hottenga J-J
    57. Willemsen G
    58. Xu C-J
    59. Barturen G
    60. Català-Moll F
    61. Kerick M
    62. Wang C
    63. Melton P
    64. Elliott HR
    65. Shin J
    66. Bernard M
    67. Yet I
    68. Smart M
    69. Gorrie-Stone T
    70. BIOS Consortium
    71. Shaw C
    72. Al Chalabi A
    73. Ring SM
    74. Pershagen G
    75. Melén E
    76. Jiménez-Conde J
    77. Roquer J
    78. Lawlor DA
    79. Wright J
    80. Martin NG
    81. Montgomery GW
    82. Moffitt TE
    83. Poulton R
    84. Esko T
    85. Milani L
    86. Metspalu A
    87. Perry JRB
    88. Ong KK
    89. Wareham NJ
    90. Matullo G
    91. Sacerdote C
    92. Panico S
    93. Caspi A
    94. Arseneault L
    95. Gagnon F
    96. Ollikainen M
    97. Kaprio J
    98. Felix JF
    99. Rivadeneira F
    100. Tiemeier H
    101. van IJzendoorn MH
    102. Uitterlinden AG
    103. Jaddoe VWV
    104. Haley C
    105. McIntosh AM
    106. Evans KL
    107. Murray A
    108. Räikkönen K
    109. Lahti J
    110. Nohr EA
    111. Sørensen TIA
    112. Hansen T
    113. Morgen CS
    114. Binder EB
    115. Lucae S
    116. Gonzalez JR
    117. Bustamante M
    118. Sunyer J
    119. Holloway JW
    120. Karmaus W
    121. Zhang H
    122. Deary IJ
    123. Wray NR
    124. Starr JM
    125. Beekman M
    126. van Heemst D
    127. Slagboom PE
    128. Morange P-E
    129. Trégouët D-A
    130. Veldink JH
    131. Davies GE
    132. de Geus EJC
    133. Boomsma DI
    134. Vonk JM
    135. Brunekreef B
    136. Koppelman GH
    137. Alarcón-Riquelme ME
    138. Huang R-C
    139. Pennell CE
    140. van Meurs J
    141. Ikram MA
    142. Hughes AD
    143. Tillin T
    144. Chaturvedi N
    145. Pausova Z
    146. Paus T
    147. Spector TD
    148. Kumari M
    149. Schalkwyk LC
    150. Visscher PM
    151. Davey Smith G
    152. Bock C
    153. Gaunt TR
    154. Bell JT
    155. Heijmans BT
    156. Mill J
    157. Relton CL
    (2021) Genomic and phenotypic insights from an atlas of genetic effects on DNA methylation
    Nature Genetics 53:1311–1321.
    https://doi.org/10.1038/s41588-021-00923-x

Decision letter

  1. Evan Graehl Williams
    Reviewing Editor; University of Luxembourg, Luxembourg
  2. David E James
    Senior Editor; University of Sydney, Australia
  3. Evan Graehl Williams
    Reviewer; University of Luxembourg, Luxembourg

Our editorial process produces two outputs: (i) public reviews designed to be posted alongside the preprint for the benefit of readers; (ii) feedback on the manuscript for the authors, including requests for revisions, shown below. We also include an acceptance summary that explains what the editors found interesting or important about the work.

Decision letter after peer review:

Thank you for submitting your article "Exploiting the mediating role of the metabolome to unravel transcript-to-phenotype associations" for consideration by eLife. Your article has been reviewed by 2 peer reviewers, including Evan Graehl Williams as Reviewing Editor and Reviewer #1, and the evaluation has been overseen by David James as the Senior Editor.

The reviewers have discussed their reviews with one another, and the Reviewing Editor has drafted this to help you prepare a revised submission.

In brief, besides the reviewer-specific comments, there was a common thread regarding significances of the findings (both in the statistical sense and in the colloquial sense) and description of the method. I also apologize for the delay in the reviews; it was a huge challenge to get reviewers in July and August, and we potentially may consult a third reviewer for the revision.

Reviewer #1 (Recommendations for the authors):

Auwerx et al. have taken a new (or recent?) approach to mine large existing datasets of intermediary molecular data between GWAS and phenotype, with the aim of uncovering novel insight into the molecular mechanisms which lead a GWAS hit to have a phenotypic effect. The authors show that you can get additional insight by integrating multiple omics layers rather than analyzing only a single molecular type, including a handful of specific examples, e.g. that the effect of SNPs in ANKH on calcium are mediated by citrate. Such additional data is necessary because, as the authors' point out, while we have thousands of SNPs with significant impact on phenotypes of interest, we often don't know at all the mechanism, given that the majority of significant SNPs found through GWAS are in non-coding (and often intergenic) regions.

Scientific comments

(1) It's not quite clear to me whether the authors have designed a new method or have applied a recently-developed method. I follow that the general approach uses MR across multiple data types and then merges the results. I did look at the Github repo ("Gene_Metab_Pheno") but I'm not enough of a mathematical bioinformatician to really judge the novelty there, as to whether this is a new method or application of relatively recent other methods.

(2) The sample sizes are huge here since it is a meta-analysis, which means it's not quite clear to me how this method would scale to studies where there are not tens of thousands of individuals measured. It would be good to already have some general idea of what are the requirements in terms of power (sample size/target effect size / etc) for this approach – either added as a figure panel or two in this paper or just as text if the necessary parameters have already been explained elsewhere. I guess this comes back to the p >> n issue. I see for instance that the authors have 21k transcripts but they narrow it down to 7883 with {greater than or equal to} 3 IVs, used against their sample size of n = 7824 patients. Is this just convenient that n ~= p, or were the required parameters tweaked exactly so that you could reduce the number of transcripts down to more or less the sample size? You have a section on "Power Analysis" already which I appreciate, but reading through it again I can't tell what the minimum N would be. Or can I use an N = 500 I just have to use some other way to select only 500 (or whatever) transcripts? The power calculations go up to N = 90'000 which indeed is "state-of-the-art sample sizes" and would be unattainably large for all but the largest of international human cohorts, and perhaps a few large yeast or cell line studies.

(3) Related, I wasn't quite clear if the data from TwinsUK and KORA were analyzed separately, or if they were somehow merged.

(4) The authors mention "overall, 83% of the involved genes were causally influencing the level of a single metabolite, while TMEM258 and FADS2 affected 12 metabolites". Firstly I would mention that they affect 12 metabolites each just to be clear – although it's clearly annotated in Table S1. Second, and more relevantly, it would be nice to know in this table how many of these hits already are known in the literature. For instance I see the most significant hit is MAF1 with 5-oxoproline which doesn't immediately turn up anything (albeit I did not look very long). Hit #7, for SLC22A4 and isovalerylcarnitine does appear to be known in the literature ( http://www.metabolomix.com/rs272889-slc22a4-octn1-with-acylcarnitines/ ). Doing a decent literature analysis on all 257 of these hits in Table S1 might take a while (and/or require someone who knows how to do automated literature mining, which isn't trivial for this type of task especially given metabolite names like "X-12696") but even just some cherry-picking and/or (better) systematic analysis of the top 20-50 would be nice to see. It greatly improved my confidence in the findings when I just looked into two of your hits just now and found that one of them appears to be reasonably well known by literature.

(5) The authors mention that only 33% of the transcript-metabolite-phenotype triplets were observed by TWMR, but that 91% of those observed by all are in concordant directionality. I guess that means for those with concordant directionality, if no significant association was observed in one layer, there was just no cross-layer comparison? i.e. that the 91% "concordant directionality" are only checking among the 33% of hits by TWMR that were also observed both within and across layer?

(6) The authors mention no availability of trans-eQTL data; is that because the sample size is not sufficient to do a proper trans-eQTL analysis, or is it because of data privacy and an inability to get the precomputed trans-eQTLs from the eQTLGen Consortium due to some potential conflict (GDPR?).

(7) Back to Table S1: There are 257 hits here, with 191 genes (out of 7883) and 154 metabolites (out of 453), meaning that 299 metabolites didn't even have one significant association?

Reviewer #2 (Recommendations for the authors):

1. In general, the methodological approach should be explained in more detail. The study presents a novel MR-based approach and thus, the discussion of the method basics should be elaborated. This pertains to the following points:

– In the definition of causal effects from molecular traits on the outcome (eq. (1)), the symbol β' is not explained. The method used for standardization of effect sizes is not elaborated.

– For the multivariable MR analysis (equation not numbered), no causal effect statistic is specified. As discussed in the public review, no significance testing has been performed, but we strongly urge the authors to do so or give reasons for this lack of testing in the case of causal triplets.

– In the description of the simulation analyses, it should be made more clear how the definition of βGWAS as a function of βmQTL is reached.

– The authors should include a thorough discussion and a description of the method employed to evaluate the comparison between total and direct transcript-phenotype effects in Figure 2B.

2. There is some apparent inconsistency in the interpretation of results from the empirical study: The abstract states that 67 transcript-phenotype effects present within the 206 causal triplets were missed in a TWMR-only analyses, while the paragraph "Power Analysis" states that only 67 triplets showed a significant effect estimated by TWMR. The text relating to Figure 2B states that 79 % (~163) of the triplets were estimated to be due to direct effects by the transcript only. This should be presented in a more consistent and clear manner.

3. Plots for the distribution of the number of IVs per transcript/metabolite should be included (as supplemental figures).

4. It would be interesting to discuss potential modes of mediation between transcripts, metabolites and phenotypes. For example, individual metabolites might integrate the effects of several transcripts. This would not result in triplets, but ultimately, networks of mediation as shown for the TMEM258, FADS1, FADS2 case. How would such cases be treated in a statistically sound manner?

https://doi.org/10.7554/eLife.81097.sa1

Author response

Reviewer #1 (Recommendations for the authors):

Auwerx et al. have taken a new (or recent?) approach to mine large existing datasets of intermediary molecular data between GWAS and phenotype, with the aim of uncovering novel insight into the molecular mechanisms which lead a GWAS hit to have a phenotypic effect. The authors show that you can get additional insight by integrating multiple omics layers rather than analyzing only a single molecular type, including a handful of specific examples, e.g. that the effect of SNPs in ANKH on calcium are mediated by citrate. Such additional data is necessary because, as the authors' point out, while we have thousands of SNPs with significant impact on phenotypes of interest, we often don't know at all the mechanism, given that the majority of significant SNPs found through GWAS are in non-coding (and often intergenic) regions.

Scientific comments

(1) It's not quite clear to me whether the authors have designed a new method or have applied a recently-developed method. I follow that the general approach uses MR across multiple data types and then merges the results. I did look at the Github repo ("Gene_Metab_Pheno") but I'm not enough of a mathematical bioinformatician to really judge the novelty there, as to whether this is a new method or application of relatively recent other methods.

While the core Mendelian randomization (MR) and mediation analysis methodology used in this study is well-established, the novelty of the manuscript lies in (i) the strategy that sequential application of univariable and multivariable MR analyses across the different omics layers (i.e., genome, transcriptome, metabolome, phenome) can improve discovery power and (ii) the resulting key message that by incorporating metabolomic data to genetic studies, it becomes possible to gain functional and targetable insights into the pathways linking genetic variation to phenotypic diversity. To clarify this point, we have modified the Introduction of our revised manuscript:

“Here, we develop a framework based on established MR methodology that hypothesizes a mediating role of the metabolome in the transcript-to-phenotype axis. Specifically, our integrative MR analysis combines summary-level multi-omics (i.e., GWAS, eQTL, and mQTL) data to compute the indirect effect of gene expression on complex traits mediated by metabolites in three steps (Figure 1).”

(2) The sample sizes are huge here since it is a meta-analysis, which means it's not quite clear to me how this method would scale to studies where there are not tens of thousands of individuals measured. It would be good to already have some general idea of what are the requirements in terms of power (sample size/target effect size / etc) for this approach – either added as a figure panel or two in this paper or just as text if the necessary parameters have already been explained elsewhere. I guess this comes back to the p >> n issue. I see for instance that the authors have 21k transcripts but they narrow it down to 7883 with {greater than or equal to} 3 IVs, used against their sample size of n = 7824 patients. Is this just convenient that n ~= p, or were the required parameters tweaked exactly so that you could reduce the number of transcripts down to more or less the sample size?

Requiring at least 3 IVs is common practice in the field of MR as it allows to estimate the causal estimate more robustly, as previously described (PMID: 31341166). In general, the more instruments, the less outliers can bias results. If the InSIDE assumption holds the MR estimates are asymptotically unbiased, hence more instruments reduce bias. Finally, more instruments also increase discovery power. Hence, the fact that the number of transcripts is reduced to the sample size of the study is pure coincidence. Of note, while this reduces the multiple testing burden, it also means that we potentially miss out on true causal effects of transcripts that cannot be instrumented properly.

You have a section on "Power Analysis" already which I appreciate, but reading through it again I can't tell what the minimum N would be. Or can I use an N = 500 I just have to use some other way to select only 500 (or whatever) transcripts? The power calculations go up to N = 90'000 which indeed is "state-of-the-art sample sizes" and would be unattainably large for all but the largest of international human cohorts, and perhaps a few large yeast or cell line studies.

While we are hopeful that in the future, ever larger multi-omics datasets will become available to the research community (e.g., initiatives similar to the NMR metabolite measurement in >120,000 UK Biobank participants; https://biobank.ctsu.ox.ac.uk/crystal/label.cgi?id=220), we agree that the majority of currently available molecular datasets have smaller sample sizes than the one used in this study. To address this comment, we ran power analyses simulating mQTLs studies performed on 1000, 2000, and 4000 individuals. Following the previously observed trend, the gain in power of mediation analysis over TWMR decreases with decreasing N and is quasi inexistant with sample sizes smaller than 2,000. Hence, the reviewer’s point is well taken, the mediator sample size is crucial for our main conclusions. These additional results are detailed in the revised manuscript, along with Figure 4 —figure supplement 2:

“Repeating the simulations with a mQTL sample size of 90,000, nearing state-of-the-art sample sizes [7], we observe a strong shift in the above-described trends (Figure 4B). Specifically, when the effect of the transcript on the phenotype is dominated by the effect mediated by the metabolite (ρ<0.3 and ρ>1.7), mediation analysis has more power than TWMR when σ>0.2. For larger proportions of direct effect, TWMR has increased power the more σ differs from 1. In line with the increased power of mediation analysis with larger mQTL datasets, the gain in power of mediation analysis over TWMR decreases with decreasing mQTL dataset sample sizes (ranging between N=1,000 and N=4,000; Figure 4 —figure supplement 2), indicating that our approach is dependent on large sample sizes to reach its full potential.”

(3) Related, I wasn't quite clear if the data from TwinsUK and KORA were analyzed separately, or if they were somehow merged.

Data from KORA and TwinsUK have previously been analyzed, as described in Shin et al., 2014 (PMID: 24816252). Specifically, genome-wide association analyses were performed separately in KORA and TwinsUK for all 486 metabolite concentrations present in both studies after quality control steps. Association results were then combined using inverse variance meta-analysis based on effect size estimates and standard errors, adjusting for genomic control. Our study solely uses the publicly available meta-analysis summary statistics provided by Shin et al., 2014 for 453 of these metabolites.

We would also like to highlight that based on comments by Reviewer #1 and #2, the revised manuscript now focuses on a restricted set of 242 metabolites for which we were able to identify a Human Metabolome Database (HMDB) identifier through manual annotation. This approach is motivated by only analyzing metabolites whose potential associations can be followed up.

The current version of the manuscript reads as follows:

Results: “Summary statistics for cis-eQTLs stem from the eQTLGen Consortium meta-analysis of 19,942 transcripts in 31,684 individuals [3], while summary statistics for mQTLs originate from a meta-analysis of 453 metabolites in 7,824 individuals from two independent European cohorts: TwinsUK (N = 6,056) and KORA (N = 1,768). After selecting SNPs included in both the eQTL and mQTL studies, our analysis was restricted to 7,884 transcripts with ≥ 3 instrumental variables (IVs) (see Methods, Figure 1 —figure supplement 1A) and 242 metabolites with an identifier in The Human Metabolome Database (HMDB) (see Methods, Supplementary File 1a).”

Methods: “mQTL data originate from Shin et al., 2014 which used ultra-high performance liquid chromatography-tandem mass spectrometry (UPLC-MS/MS) to measure 486 whole blood metabolites in 7,824 European individuals. Association analyses were carried out on ~2.1 million SNPs and are available for 453 metabolites at the Metabolomics GWAS Server (http://metabolomics.helmholtz-muenchen.de/gwas/). Among these metabolites, 242 were manually annotated with Human Metabolome Database (HMDB) identifiers (Supplementary File 1a) and used in this study.”

(4) The authors mention "overall, 83% of the involved genes were causally influencing the level of a single metabolite, while TMEM258 and FADS2 affected 12 metabolites". Firstly I would mention that they affect 12 metabolites each just to be clear – although it's clearly annotated in Table S1.

This has been clarified in the revised manuscript:

“Most involved genes (86%; 83/96) were causally influencing the level of a single metabolite, with some notable exceptions acting as mQTL hubs, such as TMEM258 and FADS2 both affecting the same 11 metabolites, followed by FADS1 affecting a subset of 6 metabolites.”

Second, and more relevantly, it would be nice to know in this table how many of these hits already are known in the literature. For instance I see the most significant hit is MAF1 with 5-oxoproline which doesn't immediately turn up anything (albeit I did not look very long). Hit #7, for SLC22A4 and isovalerylcarnitine does appear to be known in the literature (http://www.metabolomix.com/rs272889-slc22a4-octn1-with-acylcarnitines/ ). Doing a decent literature analysis on all 257 of these hits in Table S1 might take a while (and/or require someone who knows how to do automated literature mining, which isn't trivial for this type of task especially given metabolite names like "X-12696") but even just some cherry-picking and/or (better) systematic analysis of the top 20-50 would be nice to see. It greatly improved my confidence in the findings when I just looked into two of your hits just now and found that one of them appears to be reasonably well known by literature.

This is a great suggestion which led us to conduct a more detailed follow-up investigation. Having a rough estimation of the number of associations that have previously been described in the literature would indeed be of great interest. Due to the large number of identified associations, performing a thorough, manual investigation of each of the identified associations is hardly manageable. As an alternative, we used an automated literature review strategy that we briefly describe below.

First, we reduced the number of investigated metabolites to 242 interpretable compounds for which we could identify an HMDB identifier through manual annotation (see reply to scientific comment #3). Second, using this annotation, we identified transcript-to-metabolite effects for which an interaction between the encoded protein and metabolite was reported in the HMDB. In parallel, we performed an automated literature review in PubMed for all identified transcript-to-metabolite effects. Next, for the 37 causal transcript-metabolite-phenotype triplets for which either the HMDB or the PubMed search for the transcript-to-metabolite yielded at least one results, we (i) added a third term to the PubMed search relating to the associated phenotype and (ii) replaced the metabolite term by the phenotype term to determine whether the transcript-to-phenotype analysis had previously been reported. Owing to the low specificity of the phenotype search term (e.g., “creatinine” appearing in “X mmol/mol creatinine”), we manually reviewed the abstracts of retained publications, excluding findings in which the search terms were used in an unintended way. We describe the methods and results of these analyses in detail in the revised manuscript – along with a discussion of the limitations of our approach – and provide the PMIDs of our automated search in the Supplementary File 1b:

Methods:

“Omics and traits summary statistics

[…] mQTL data originate from Shin et al. 2014, which used ultra-high performance liquid chromatography-tandem mass spectrometry (UPLC-MS/MS) to measure 486 whole blood metabolites in 7,824 European individuals. Association analyses were carried out on ~2.1 million SNPs and are available for 453 metabolites at the Metabolomics GWAS Server (http://metabolomics.helmholtz-muenchen.de/gwas/). Among these metabolites, 242 were manually annotated with Human Metabolome Database (HMDB) identifiers (Supplementary File 1a) and used in this study. GWAS summary statistics for 28 outcome traits measured in the UK Biobank (UKB) originate from the Neale Lab (http://www.nealelab.is/uk-biobank/). Protein interactions with metabolites were downloaded from HMDB v5.0 (https://hmdb.ca/downloads/hmdb_proteins.xml) and were used to annotate transcript-metabolites associations.

Automated literature review

An automated literature review of all transcript-metabolites associations (Supplementary File 1b) was conducted in PubMed (20/09/2022) following the scheme:(Gene[Title/Abstract]) AND ((MetHMDB[Title/Abstract]) OR (MetShin[Title/Abstract])) With Gene being the name of the gene whose transcript is involved in the association, MetHMDB the involved metabolite’s common name on HMDB, and MetShin the involved metabolite’s name as reported in Shin et al., [6]. Returned PubMed identifiers were retrieved (Supplementary File 1b).

For transcript-metabolite associations involved in a causal triplet and for which the transcript-metabolites returned at least one publication (Supplementary File 1f), the search was extend by (i) adding a further search term for the trait (i.e., AND (trait[Title/Abstract])) and (ii) substituting the metabolite term for the trait term. Returned PubMed identifiers were retrieved and corresponding abstracts were manually curated to exclude abstracts in which the search terms were used in a meaning other than the intended one (Supplementary File 1f).”

Results:

“Mapping the transcriptome onto the metabolome

[…] While only 5 (3.8%) of the 133 associations were reported in HMDB, an automated literature review (see Methods) identified a match for 22 (16.5%) of the identified transcript-metabolite pairs (Supplementary File 1b).

Mapping metabolome-mediated effects of the transcriptome onto complex phenotypes

[…] Among the 37 triplets for which the transcript and metabolite had previously been linked through automated literature review, none remained after incorporating a third term for the phenotype in the search and manually removing abstracts for which the search terms were used in an erroneous context. Relaxing the search criteria by omitting the metabolite term, 13/37 (35%) triplets returned at least one match for the gene-trait association.”

Discussion:

“Our automated literature review indicates that while some detected associations were previously reported, a large fraction, especially among the triplets, appears to be novel. It should be noted that the number of previously reported associations is likely underestimated as our approach does not account for all synonyms of a given feature and requires the terms to appear in the title or abstract of the publication. This makes it more likely for hypothesis-driven studies, inherently biased towards well-studied genes and metabolites, to be identified. Conversely, high-throughput, hypothesis-free studies that report the given association in a supplemental table are likely to be missed. Furthermore, due to its automated nature, our search is context-blind, so that some of the identified studies might report negative results, associations only under specific conditions (e.g., different organisms, experimental settings), or usage of the search term with a different meaning. To attenuate the latter, we also performed manual review of the retained abstracts for transcript-to-phenotype searches. While flawed, this rough estimate of the amount of existing evidence supporting our findings can be interpreted in combination with other lines of evidence. For instance, […].”

(5) The authors mention that only 33% of the transcript-metabolite-phenotype triplets were observed by TWMR, but that 91% of those observed by all are in concordant directionality. I guess that means for those with concordant directionality, if no significant association was observed in one layer, there was just no cross-layer comparison? i.e. that the 91% "concordant directionality" are only checking among the 33% of hits by TWMR that were also observed both within and across layer?

In response to Reviewer #2’s comments, the current version of the manuscript uses more stringent significant thresholds. At FDR 5%, we now observe 216 transcript-metabolite-phenotype triplets. Among these 216 triplets, 90 (42%) had a significant transcript-to-phenotype TWMR effect. Among these 90 triplets, 84 (93%) showed a directionally concordant effect between the transcript-to-phenotype, transcript-to-metabolite, and metabolite-to-phenotype estimates, meaning that the sign of the product of the transcript-to-metabolite and metabolite-to-phenotype effects equals the sign of the transcript-to-phenotype effect. This is now clarified in the Discussion:

“[…] among the 90 signals that were also identified through TWMR, 93% showed a directionally concordant effect between the transcript-to-phenotype, transcript-to-metabolite, and metabolite-to-phenotype estimates (i.e., sign of the product of the transcript-to-metabolite and metabolite-to-phenotype effects agrees with the sign of the transcript-to-phenotype effect).”

(6) The authors mention no availability of trans-eQTL data; is that because the sample size is not sufficient to do a proper trans-eQTL analysis, or is it because of data privacy and an inability to get the precomputed trans-eQTLs from the eQTLGen Consortium due to some potential conflict (GDPR?).

The trans-eQTLs data from eQTLGen Consortium are restricted to ~10,000 SNPs reported to be associated with complex traits in GWAS catalog due to the massive size of this type of data. There are current efforts within the eQTLGen Consortium to meta-analyse trans-eQTL summary statistics genome-wide, but these data will not be available before Q3 of 2023. Currently available data is unfortunately not sufficient to investigate reverse causality on metabolites and gene expression, as specified in the manuscript’s Discussion:

“Due to the lack of genome-wide trans-eQTL association summary statistics, our method does not investigate reverse causality on metabolites and gene expression […].”

(7) Back to Table S1: There are 257 hits here, with 191 genes (out of 7883) and 154 metabolites (out of 453), meaning that 299 metabolites didn't even have one significant association?

This is correct. In the current version of the manuscript and as explained in the reply to previous points, we restricted our analysis to 242 metabolites manually annotated with HMDB identifiers. In Supplementary File 1b, we report 133 significant (FDR < 5%) transcript-to-metabolite effects involving 75 unique metabolites, so that in case of 167 metabolites we do not have evidence for them being impacted by any of the 7,824 tested genes. It is interesting to notice that despite changes in our analysis (i.e., restrict to interpretable metabolites, more stringent criterion for significance), the proportion of metabolites that are not affected by any transcripts remains similar (previously: 299/453 = 66%; currently: 167/242 = 69%). One potential explanation is lack of power, given the relatively small sample size of the mQTL dataset (< 8,000), as compared to GWASs for other complex traits (> hundreds of thousands), that prevents detection of associations for a large fraction of metabolites. Alternatively, these metabolites might be influenced by transcripts that cannot be instrumented, making it impossible to detect association.

Reviewer #2 (Recommendations for the authors):

1. In general, the methodological approach should be explained in more detail. The study presents a novel MR-based approach and thus, the discussion of the method basics should be elaborated. This pertains to the following points:

– In the definition of causal effects from molecular traits on the outcome (equation (1)), the symbol β' is not explained. The method used for standardization of effect sizes is not elaborated.

We clarified this in the current version of the manuscript, which now reads as follows:

“Here, β is a vector of length n containing the standardized effect size of n independent SNPs on the gene/metabolite, derived from eQTL/mQTL studies, with β being the transpose of β. γ is a vector of length n containing the standardized effect size of each SNP on the outcome. C is the pairwise LD matrix between the n SNPs. The standardized effect sizes for molecular and outcome GWASs were obtained from Z-score of summary statistics standardized by the square root of the sample size to be on the same standard deviation scale.”

– For the multivariable MR analysis (equation not numbered), no causal effect statistic is specified. As discussed in the public review, no significance testing has been performed, but we strongly urge the authors to do so or give reasons for this lack of testing in the case of causal triplets.

The equation has now been labeled (6). As specified in the Methods, we used multivariable MR (MVMR) only to estimate the direct effect of gene expression on the phenotype. We do not test the significance of this estimate as we only compare it with the total effect estimated by TWMR regardless its significance. Regarding significance testing for other sections of the manuscript, please see extensive reply to major concern #1 and #2.

– In the description of the simulation analyses, it should be made more clear how the definition of βGWAS as a function of βmQTL is reached.

As described in the Methods, to estimate the effect of the metabolite on the phenotype, we considered a metabolite with heritability hM2=0.04 (corresponding to the median of h2 in the KORA+TwinsUK mQTL data) and NIVs=5 (corresponding to the median number of IVs used in MWMR analyses). Effect size βmQTL are from a normal distribution βmQTLN(0,hM2NIVs). These quantities allowed to define βGWAS as βGWAS= αTP(1ρ)/σ βmQTL+ εP, where εPN(0,1NGWAS).

– The authors should include a thorough discussion and a description of the method employed to evaluate the comparison between total and direct transcript-phenotype effects in Figure 2B.

We have now added a description of the comparison of the direct and total effects in the Methods:

“The proportion of direct effect (ρ) is calculated by regressing direct effects (αd) on total effects (αTP) and then correcting for regression dilution bias:

ρcorrected= ρ1(SE(αTP))2αTP2

It is crucial that due to lack of power, we do not compare individual direct-vs-total effects but only assess overall direct-vs-total effects across all transcript-phenotype pairs. The central message of the paper is not the difference between the two, but the difference in detection power between the two strategies, as we do illustrate in Figure 4.

2. There is some apparent inconsistency in the interpretation of results from the empirical study: The abstract states that 67 transcript-phenotype effects present within the 206 causal triplets were missed in a TWMR-only analyses, while the paragraph "Power Analysis" states that only 67 triplets showed a significant effect estimated by TWMR.

We apologize for this inconsistency, which has been clarified. The revised sections now read:

Abstract: “We identified 216 transcript-metabolite-trait causal triplets involving 26 medically relevant phenotypes. Among these associations, 58% were missed by classical transcriptome-wide MR […].”

Results: “Importantly, only 42% (90/216) of the causal triplets showed a significant total transcript-to-phenotype effect (i.e., estimated by TWMR), suggesting that the method lacks power under current settings.”

The text relating to Figure 2B states that 79 % (~163) of the triplets were estimated to be due to direct effects by the transcript only. This should be presented in a more consistent and clear manner.

In Figure 2B, we plot the direct (αd; y-axis) and total (αTP; x-axis) effects for the 216 transcript-metabolite-trait causal triplets. Regressing direct effects on total effects, we observed that 77% of the transcript effect on the phenotype is direct and thus not mediated by the metabolites. This is explained in the Results and Methods of the manuscript:

Results:

“Regressing direct effects (αd) on total effects (αTP) and accounting for regression dilution bias (see Methods; Figure 2A), it was estimated that 77% [95% CI: 70%-85%] of the transcript effect on the phenotype was direct and thus not mediated by the metabolites (Figure 2B).”

Methods:

“The proportion of direct effect (ρ) is calculated by regressing direct effects (αd) on total effects (αTP) and then correcting for regression dilution bias:

ρcorrected= ρ1(SE(αTP))2αTP2

3. Plots for the distribution of the number of IVs per transcript/metabolite should be included (as supplemental figures).

We now include Figure 1 —figure supplement 1 to illustrate this.

We furthermore refer to these plots in the Results section:

“Mapping the transcriptome onto the metabolome

[…] After selecting SNPs included in both the eQTL and mQTL studies, our analysis was restricted to 7,884 transcripts with ≥ 3 instrumental variables (IVs) (see Methods, Figure 1 —figure supplement 1A) […].

Mapping the metabolome onto complex phenotypes

Univariable metabolome-wide MR (MWMR; Figure 1A) was used to identify causal relationships between 48 metabolites with ≥ 3 IVs and 28 complex phenotypes (Figure 1 —figure supplement 1B). […]

Mapping the transcriptome onto complex phenotypes

We applied univariable transcriptome-wide MR (TWMR [12]; Figure 1B) to identify associations between expression levels of 10,435 transcripts from the eQTLGen Consortium with ≥ 3 IVs (Figure 1 —figure supplement 1C) measured in both exposure and outcome datasets and the same 28 UKB phenotypes described in the previous section (Supplementary File 1c)[…].”

4. It would be interesting to discuss potential modes of mediation between transcripts, metabolites and phenotypes. For example, individual metabolites might integrate the effects of several transcripts. This would not result in triplets, but ultimately, networks of mediation as shown for the TMEM258, FADS1, FADS2 case. How would such cases be treated in a statistically sound manner?

This is a very interesting idea and we believe that the field is increasingly interested in modelling such complex biological network. The situation where a single metabolite mediates the effect of multiple transcripts only needs a systematic search for metabolites repeatedly occurring in triplets. We identified 12 such metabolites (see Table integrated in revised manuscript as Supplementary File 1g). Nine out of 12 metabolites integrate effect of multiple transcripts to in turn affects multiple phenotypes, as illustrated in the last column of the Table. Of note 8/12 cases, the metabolites integrate the effect of transcript whose genes are in close genomic proximity (shown as bold transcripts in the same color). We already made this observation in the original manuscript and discussed this limitation:

“Owing to linkage disequilibrium and regulatory variants affecting multiple genes, transcripts from adjacent genes might appear to be involved in the same signals, as exemplified with the TMEM258/FADS1/FADS2 locus (Figure 3). While literature supports the role of the FADS genes, one cannot exclude a role for TMEM258, nor disentangle the specific function of FADS1 and FADS2.”

Investigating more complex scenarios where multiple correlated metabolites mediate the effect of a single transcript would require more advanced modelling techniques that go beyond the scope of this study. We strengthened the Discussion on the topic in the revised manuscript which now reads as follows:

“Another consideration is that complex phenotypes can have a stronger impact on gene expression than the opposite [15]. Due to the lack of genome-wide trans-eQTL association summary statistics, our method does not investigate reverse causality on metabolites and gene expression, nor the role of metabolites as regulators of gene expression. Metabolites might also integrate the effect of several transcripts (i.e., multiple transcripts causally impact the levels of the same metabolite) before affecting complex phenotypes (Supplementary File 1g) or multiple metabolites may jointly mediate the impact of a single transcript. Modelling the latter phenomenon, which is beyond the scope of our current work, requires the development of Structural Equation Models accounting for such effects and will eventually lead to a more comprehensive modelling of causal relations in complex biological networks, nuancing the interpretation of the molecular mechanisms shaping complex traits.”

https://doi.org/10.7554/eLife.81097.sa2

Article and author information

Author details

  1. Chiara Auwerx

    1. Center for Integrative Genomics, University of Lausanne, Lausanne, Switzerland
    2. Swiss Institute of Bioinformatics, Lausanne, Switzerland
    3. University Center for Primary Care and Public Health, Lausanne, Switzerland
    4. Department of Computational Biology, University of Lausanne, Lausanne, Switzerland
    Contribution
    Writing – original draft, Investigation, Visualization
    Competing interests
    No competing interests declared
    ORCID icon "This ORCID iD identifies the author of this article:" 0000-0003-3613-8450
  2. Marie C Sadler

    1. Swiss Institute of Bioinformatics, Lausanne, Switzerland
    2. University Center for Primary Care and Public Health, Lausanne, Switzerland
    3. Department of Computational Biology, University of Lausanne, Lausanne, Switzerland
    Contribution
    Formal analysis, Writing – review and editing
    Competing interests
    No competing interests declared
    ORCID icon "This ORCID iD identifies the author of this article:" 0000-0002-2599-9207
  3. Tristan Woh

    Department of Computational Biology, University of Lausanne, Lausanne, Switzerland
    Contribution
    Formal analysis, Writing – review and editing
    Competing interests
    No competing interests declared
    ORCID icon "This ORCID iD identifies the author of this article:" 0000-0001-6916-0174
  4. Alexandre Reymond

    Center for Integrative Genomics, University of Lausanne, Lausanne, Switzerland
    Contribution
    Writing – review and editing
    Competing interests
    No competing interests declared
  5. Zoltán Kutalik

    1. Swiss Institute of Bioinformatics, Lausanne, Switzerland
    2. University Center for Primary Care and Public Health, Lausanne, Switzerland
    3. Department of Computational Biology, University of Lausanne, Lausanne, Switzerland
    Contribution
    Conceptualization, Writing – original draft
    For correspondence
    zoltan.kutalik@unil.ch
    Competing interests
    No competing interests declared
    ORCID icon "This ORCID iD identifies the author of this article:" 0000-0001-8285-7523
  6. Eleonora Porcu

    1. Center for Integrative Genomics, University of Lausanne, Lausanne, Switzerland
    2. Swiss Institute of Bioinformatics, Lausanne, Switzerland
    3. University Center for Primary Care and Public Health, Lausanne, Switzerland
    Contribution
    Conceptualization, Formal analysis, Writing – original draft
    For correspondence
    eleonora.porcu@unil.ch
    Competing interests
    No competing interests declared
    ORCID icon "This ORCID iD identifies the author of this article:" 0000-0003-2878-7485

Funding

Swiss National Science Foundation (310030-189147)

  • Zoltán Kutalik

Swiss National Science Foundation (31003A_182632)

  • Alexandre Reymond

The funders had no role in study design, data collection and interpretation, or the decision to submit the work for publication.

Acknowledgements

Computations were carried out on the high-performance cluster of the Lausanne University Hospital (CHUV). This work was supported by funding from the Department of Computational Biology (ZK) and the Center for Integrative Genomics (AR) from the University of Lausanne, as well as funding from the Swiss National Science Foundation (310030-189147 to ZK and 31003A_182632 to AR).

Senior Editor

  1. David E James, University of Sydney, Australia

Reviewing Editor

  1. Evan Graehl Williams, University of Luxembourg, Luxembourg

Reviewer

  1. Evan Graehl Williams, University of Luxembourg, Luxembourg

Version history

  1. Preprint posted: June 10, 2022 (view preprint)
  2. Received: June 15, 2022
  3. Accepted: January 17, 2023
  4. Version of Record published: March 9, 2023 (version 1)

Copyright

© 2023, Auwerx et al.

This article is distributed under the terms of the Creative Commons Attribution License, which permits unrestricted use and redistribution provided that the original author and source are credited.

Metrics

  • 2,357
    Page views
  • 244
    Downloads
  • 4
    Citations

Article citation count generated by polling the highest count across the following sources: PubMed Central, Crossref, Scopus.

Download links

A two-part list of links to download the article, or parts of the article, in various formats.

Downloads (link to download the article as PDF)

Open citations (links to open the citations from this article in various online reference manager services)

Cite this article (links to download the citations from this article in formats compatible with various reference manager tools)

  1. Chiara Auwerx
  2. Marie C Sadler
  3. Tristan Woh
  4. Alexandre Reymond
  5. Zoltán Kutalik
  6. Eleonora Porcu
(2023)
Exploiting the mediating role of the metabolome to unravel transcript-to-phenotype associations
eLife 12:e81097.
https://doi.org/10.7554/eLife.81097

Further reading

    1. Genetics and Genomics
    2. Neuroscience
    Yoshifumi Sonobe, Soojin Lee ... Paschalis Kratsios
    Research Article Updated

    A hexanucleotide repeat expansion in C9ORF72 is the most common genetic cause of amyotrophic lateral sclerosis (ALS) and frontotemporal dementia (FTD). A hallmark of ALS/FTD pathology is the presence of dipeptide repeat (DPR) proteins, produced from both sense GGGGCC (poly-GA, poly-GP, poly-GR) and antisense CCCCGG (poly-PR, poly-PG, poly-PA) transcripts. Translation of sense DPRs, such as poly-GA and poly-GR, depends on non-canonical (non-AUG) initiation codons. Here, we provide evidence for canonical AUG-dependent translation of two antisense DPRs, poly-PR and poly-PG. A single AUG is required for synthesis of poly-PR, one of the most toxic DPRs. Unexpectedly, we found redundancy between three AUG codons necessary for poly-PG translation. Further, the eukaryotic translation initiation factor 2D (EIF2D), which was previously implicated in sense DPR synthesis, is not required for AUG-dependent poly-PR or poly-PG translation, suggesting that distinct translation initiation factors control DPR synthesis from sense and antisense transcripts. Our findings on DPR synthesis from the C9ORF72 locus may be broadly applicable to many other nucleotide repeat expansion disorders.

    1. Ecology
    2. Genetics and Genomics
    Franziska Grathwol, Christian Roos ... Gisela H Kopp
    Research Advance

    Adulis, located on the Red Sea coast in present-day Eritrea, was a bustling trading centre between the first and seventh centuries CE. Several classical geographers--Agatharchides of Cnidus, Pliny the Elder, Strabo-noted the value of Adulis to Greco--Roman Egypt, particularly as an emporium for living animals, including baboons (Papio spp.). Though fragmentary, these accounts predict the Adulite origins of mummified baboons in Ptolemaic catacombs, while inviting questions on the geoprovenance of older (Late Period) baboons recovered from Gabbanat el-Qurud ('Valley of the Monkeys'), Egypt. Dated to ca. 800-540 BCE, these animals could extend the antiquity of Egyptian-Adulite trade by as much as five centuries. Previously, Dominy et al. (2020) used stable istope analysis to show that two New Kingdom specimens of P. hamadryas originate from the Horn of Africa. Here, we report the complete mitochondrial genomes from a mummified baboon from Gabbanat el-Qurud and 14 museum specimens with known provenance together with published georeferenced mitochondrial sequence data. Phylogenetic assignment connects the mummified baboon to modern populations of Papio hamadryas in Eritrea, Ethiopia, and eastern Sudan. This result, assuming geographical stability of phylogenetic clades, corroborates Greco-Roman historiographies by pointing toward present-day Eritrea, and by extension Adulis, as a source of baboons for Late Period Egyptians. It also establishes geographic continuity with baboons from the fabled Land of Punt (Dominy et al., 2020), giving weight to speculation that Punt and Adulis were essentially the same trading centres separated by a thousand years of history.