Ongoing resolution of duplicate gene functions shapes the diversification of a metabolic network
- University of Wisconsin-Madison, United States
- University of Wisconsin-Madison, Madison, United States
- Morgridge Institute for Research, United States
Abstract
The evolutionary mechanisms leading to duplicate gene retention are well understood, but the long-term impacts of paralog differentiation on the regulation of metabolism remain underappreciated. Here we experimentally dissect the functions of two pairs of ancient paralogs of the GALactose sugar utilization network in two yeast species. We show that the Saccharomyces uvarum network is more active, even as over-induction is prevented by a second co-repressor that the model yeast Saccharomyces cerevisiae lacks. Surprisingly, removal of this repression system leads to a strong growth arrest, likely due to overly rapid galactose catabolism and metabolic overload. Alternative sugars, such as fructose, circumvent metabolic control systems and exacerbate this phenotype. We further show that S. cerevisiae experiences homologous metabolic constraints that are subtler due to how the paralogs have diversified. These results show how the functional differentiation of paralogs continues to shape regulatory network architectures and metabolic strategies long after initial preservation.
https://doi.org/10.7554/eLife.19027.001eLife digest
Genetic information is organized into units called genes, which encode sets of instructions needed to make proteins and other molecules in cells. When an organism reproduces, it passes on some or all of its genes to its offspring. Over many generations, individual genes may acquire changes known as mutations. Some mutations may improve the ability of the individual to survive and reproduce, but most are harmful and may even lead to death.
Organisms can bypass these constraints by creating extra copies of genes so that if one copy acquires a harmful mutation the other copy still works normally. Duplicate genes are crucial to evolution because they offer opportunities to evolve new characteristics, but most duplicated genes are quickly inactivated, in part because the organism does not need them. Decades of research have focused on how some duplicate genes manage to remain active, often by specializing or acquiring new roles. However, relatively little attention has been paid to what happens to duplicates after they have been retained.
Baker’s yeast – also known as Saccharomyces cerevisiae – is a single-celled organism that is often used to study genetics. Kuang et al. investigated whether yeast genes that were duplicated millions of years ago are still actively evolving and whether they have achieved different evolutionary outcomes in baker’s yeast and a closely related yeast called Saccharomyces uvarum. The experiments examined two pairs of genes that help to break down a sugar called galactose. Even though these genes were duplicated around 100 million years ago, they have continued to evolve in these yeasts.
In the last ten million years, these duplicate genes have taken on different roles so that baker’s yeast and S. uvarum have evolved different strategies for consuming galactose. S. uvarum breaks down galactose more aggressively than baker's yeast, but it also has a better system in place to prevent it from breaking down more galactose than it needs.
The findings of Kuang et al. suggest that the new roles that duplicated genes adopt in organisms might have a bigger effect on the evolution of organisms in the long run than is currently appreciated. Future work will test this idea by studying other duplicated genes in different species.
https://doi.org/10.7554/eLife.19027.002Introduction
Gene duplication provides raw material for evolution to act upon. Even so, most duplicate genes are inactivated and become pseudogenes before fixation. The molecular mechanisms behind paralog retention and differentiation have attracted considerable attention, and several general models have been proposed, including neofunctionalization (Ohno, 1970; Zhang et al., 2002), gene dosage selection (Conant and Wolfe, 2007; Sandegren and Andersson, 2009; Conant et al., 2014), subfunctionalization by duplication-degeneration-complementation (Force et al., 1999), and subfunctionalization by escape from adaptive conflict (Hittinger and Carroll, 2007; Des Marais and Rausher, 2008). Theoretical studies have proposed that the fates of duplicate genes are rapidly determined after gene duplication events (Moore and Purugganan, 2003; Innan and Kondrashov, 2010). These models generally treat the preservation of duplicate genes as a race to distinguish their functions prior to the complete inactivation of one of the redundant paralogs, either through neutral (Force et al., 1999; Lynch et al., 2001) or adaptive changes (Clark, 1994; Lynch et al., 2001). Regardless of the initial functional changes or dosage effects facilitating the fixation of paralogs, retention is not the end of their evolutionary paths (Gordon et al., 2009; Conant et al., 2014).
Duplicate genes continue to diverge in different lineages, providing additional evolutionary opportunities for organisms to diversify. Previously fixed copies of duplicate genes can alter their expression timing and patterns (Huminiecki and Wolfe, 2004; Tümpel et al., 2006), change substrate affinities (Voordeckers et al., 2012), and switch between regulatory modules (Thompson et al., 2013). In several cases, paralogs encoding enzymes have been recruited to perform regulatory functions, such as S. cerevisiae HXK2, GAL3, and ARG82 (Gancedo and Flores, 2008; Conant et al., 2014; Gancedo et al., 2014). Previously differentiated developmental roles can even be transferred from one paralog to another during evolution (Ureña et al., 2016). Perhaps more significantly, long-preserved paralogs can be lost in lineage-specific manners, a common phenomenon observed across the tree of life, including in bacteria (Gómez-Valero et al., 2007), yeasts (Scannell et al., 2007), Paramecium (Aury et al., 2006; McGrath et al., 2014), plants (De Smet et al., 2013), fishes (Amores et al., 2004), and mammals (Amores et al. 1998; Blomme et al., 2006). Although pervasive, the importance of ongoing paralog diversification to the evolution of organismal traits and phenotypes remains underappreciated.
Duplicate gene differentiation has heavily impacted the evolution of regulatory and metabolic networks (Reece-Hoyes et al., 2013; Voordeckers et al., 2015). Paralogs have contributed to the expansion of regulatory networks (Teichmann and Babu, 2004), the derivation of novel networks (Conant and Wolfe, 2006; Wapinski et al., 2010; Pérez et al., 2014; Pougach et al., 2014), the specialization of network regulation (Lin and Li, 2011), and the robustness of networks to perturbation (Papp et al., 2004; Deutscher et al., 2006). The WGD has even been proposed to have facilitated the evolution of an aerobic glucose fermentation strategy called Crabtree-Warburg Effect in the lineage of yeasts that includes Saccharomyces (Conant and Wolfe, 2007; Jiang et al., 2008). Gene regulation and metabolism are heavily intertwined biological processes, but there are few eukaryotic models that allow for an integrated study of the ongoing differentiation of paralogous genes with regulatory and metabolic diversification (Yamada and Bork, 2009; Conant et al., 2014).
The Saccharomyces cerevisiae GALactose sugar utilization network is one of the most extensively studied eukaryotic regulatory and metabolic networks, and its homologous networks are evolutionarily dynamic in yeasts. In S. cerevisiae, it includes the three enzymes of the Leloir pathway (Gal1, Gal7, and Gal10) that catabolize galactose, the galactose transporter Gal2, and three regulators. In the absence of galactose, the transcription factor Gal4 is inhibited by the co-repressor Gal80. When galactose is present, Gal80 is sequestered by the co-inducer Gal3, allowing Gal4 to activate the expression of the GAL network (Johnston, 1987; Bhat and Murthy, 2001; Egriboz et al., 2013). Numerous studies have shown that the GAL networks of various yeast lineages vary in gene content (Hittinger et al., 2004, 2010; Wolfe et al., 2015) and gene activity (Peng et al., 2015; Roop et al., 2016). Despite these findings, the impacts of variable network architectures on the evolution of gene regulation and metabolism are not well understood.
As a model for how duplicate gene divergence creates variable network architectures, we functionally characterized the GAL network of Saccharomyces uvarum (formerly known as Saccharomyces bayanus var. uvarum) and compared it to S. cerevisiae. Here we show that two GAL network paralog pairs in S. uvarum have diverged to different degrees and states than their S. cerevisiae homologs. We further show that, unlike S. cerevisiae, S. uvarum deploys a second co-repressor that prevents over-induction of the network. S. uvarum mutants lacking both co-repressors revealed surprising constraints on the rapid utilization of galactose; specifically, they arrested their growth, and metabolomic investigations suggested that they experienced metabolic overload. We show that homologous constraints exist in a milder form in S. cerevisiae, and the degree of metabolic constraint is affected by how GAL network paralogs have diversified between the species. These results show how, after a hundred of million of years of preservation, two pairs of interacting duplicate genes have continued to diverge functionally in ways that broadly impact metabolism, regulatory network structures, and the future evolutionary trajectories available.
Results
GAL gene content and sequence differences
S. uvarum has orthologs encoding all regulatory and structural genes that are present in S. cerevisiae, but it has duplicate copies of two additional genes. The first additional duplicate gene is GAL80B, which is a paralog of GAL80; this pair of paralogs was created by the whole genome duplication (WGD) event roughly 100 million years ago (Wolfe and Shields, 1997; Marcet-Houben and Gabaldón, 2015). GAL80B has been retained in the S. uvarum-Saccharomyces eubayanus clade, but it was lost in the S. cerevisiae-Saccharomyces arboricola clade (Hittinger et al., 2010, 2004; Scannell et al., 2011; Caudy et al., 2013; Hittinger, 2013; Liti et al., 2013; Baker et al., 2015). The second one is GAL2B, which was created by a recent tandem duplication in S. uvarum-S. eubayanus clade. Both S. cerevisiae and S. uvarum also contain a pair of specialized paralogs created by the WGD, GAL1 and GAL3. By comparing amino acid sequences against the S. cerevisiae GAL network, we found that most GAL genes are diverged to a similar extent (Figure 1 and Figure 1—source data 1), except for GAL4, which is primarily conserved in its DNA-binding and other functionally characterized domains. None of the S. uvarum GAL homologs exhibited significantly elevated rates of protein sequence evolution (from previously calculated dN/dS ratios [Byrne and Wolfe, 2005]), which might have otherwise suggested extensive neofunctionalization. Thus, we focused on whether and how the key regulatory genes partitioned functions differently between the two species.
Figure 1
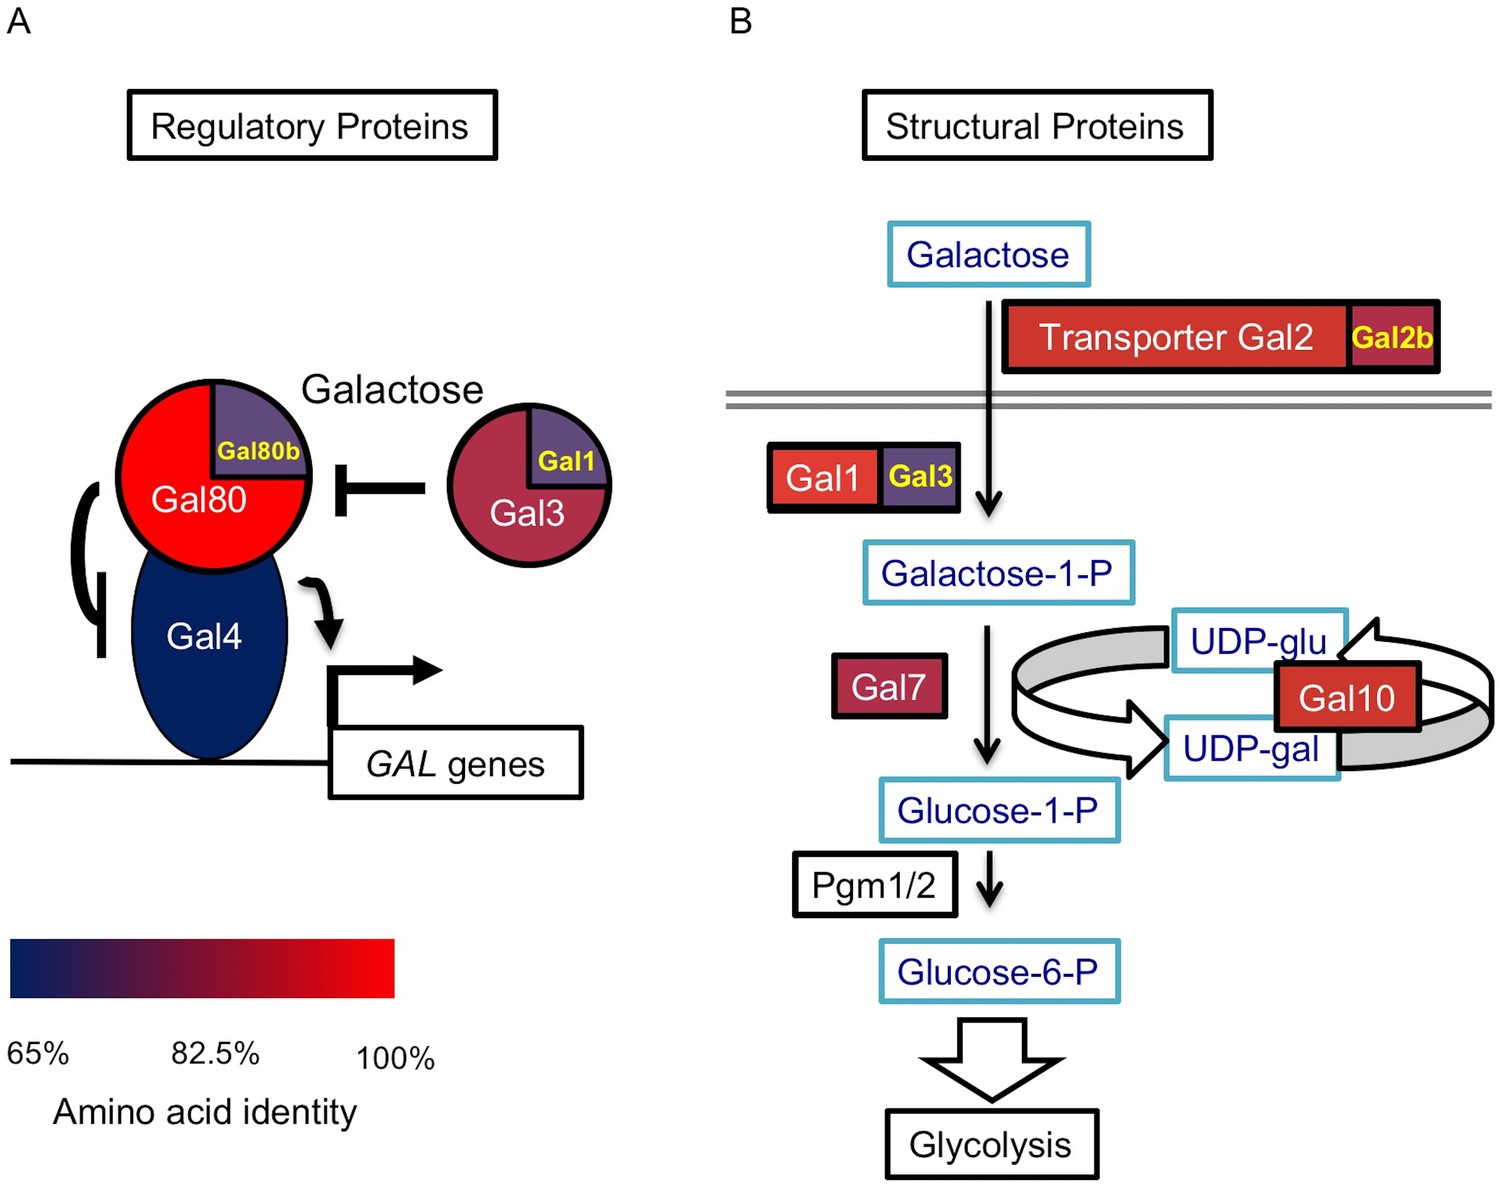
The S. uvarum GAL network.
(A) The GAL regulatory network. (B) The GAL or Leloir metabolic pathway. The colors show the amino acid identity of each component compared to their S. cerevisiae homologs (full data in Figure 1—source data 1). Proteins with two homologs in S. uvarum are split into two parts: Gal1/Gal3 and Gal80/Gal80b (also known as Sbay_12.142 [Scannell et al., 2011] or 670.20 [Caudy et al., 2013]) are two pairs of paralogs from a WGD event, while Gal2/Gal2b (also known as Sbay_10.165 [Scannell et al., 2011] or 672.62 [Caudy et al., 2013]) are paralogs from a recent tandem duplication event (Hittinger et al., 2004).
-
Figure 1—source data 1
Amino acid identity and GAL gene composition between S. uvarum and S. cerevisiae GAL network.
Quantitative data underlying Figure 1.
- https://doi.org/10.7554/eLife.19027.004
Less partitioned galactokinase and co-induction functions
In S. cerevisiae, the GAL1 and GAL3 paralogs are descended from an ancestral bi-functional protein that was both a co-inducer and a galactokinase (Rubio-Texeira, 2005; Hittinger and Carroll, 2007). They are almost completely subfunctionalized: ScerGAL3 lost its galactokinase activity and became a dedicated co-inducer, whereas ScerGAL1 lost most of its co-inducer activity but maintains galactokinase activity (Platt and Reece, 1998; Platt et al., 2000; Timson et al., 2002; Hittinger and Carroll, 2007; Lavy et al., 2016). Unlike ScerGal3, SuvaGal3 retains a -Ser-Ala- dipeptide in its active site that is sufficient to weakly restore galactokinase activity when added back to ScerGal3 (Platt et al., 2000), so we hypothesized that SuvaGAL3 encodes a functional galactokinase. To test this hypothesis, we precisely replaced the coding sequence of ScerGAL1, the gene encoding the sole galactokinase in S. cerevisiae (Platt et al., 2000), with SuvaGAL3 in S. cerevisiae. As expected, SuvaGAL3 conferred robust growth in galactose when driven by the ScerGAL1 promoter, suggesting that SuvaGAL3 retains galactokinase activity (Figure 2A). Nonetheless, the S. uvarum gal1 null mutant did not grow better in 2% galactose than it did without any carbon source, a phenotype similar to the S. cerevisiae gal1 null mutant (Figure 2—figure supplement 1), indicating that the native GAL3 promoter expression is insufficient to support robust metabolism.
Figure 2 with 1 supplement see all
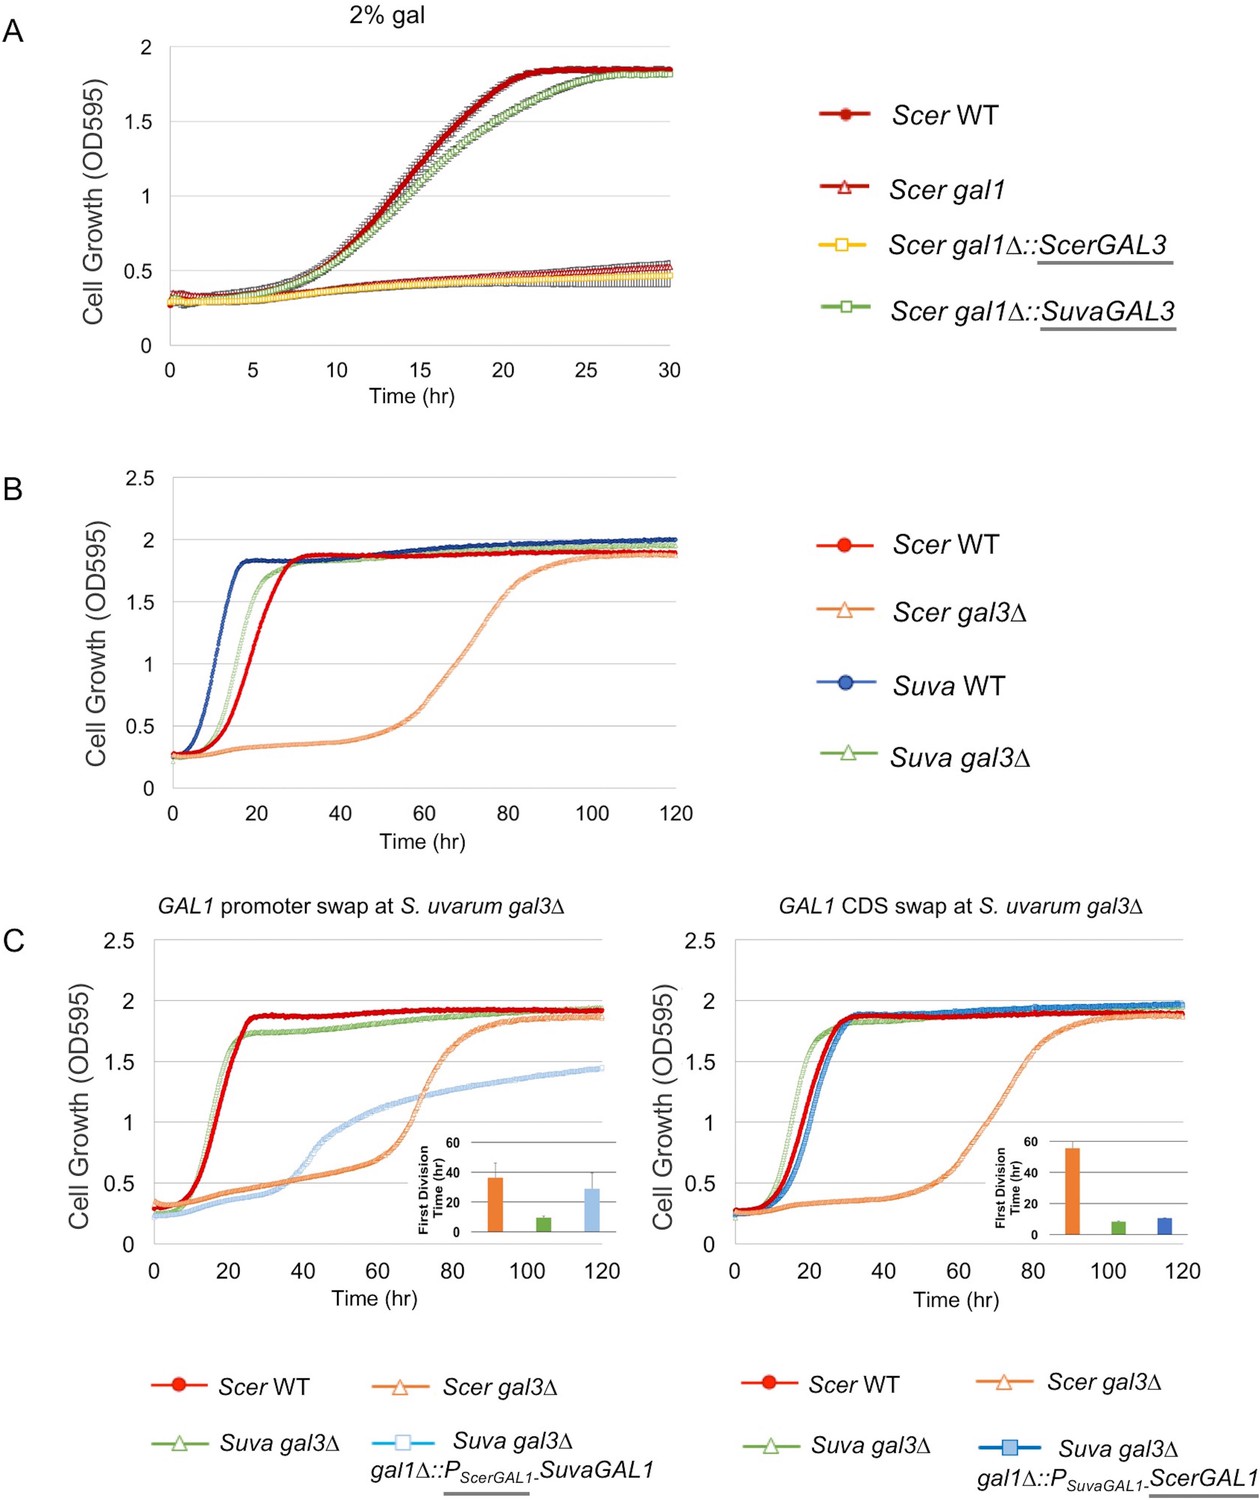
SuvaGAL1 and SuvaGAL3 are not as subfunctionalized as ScerGAL1 and ScerGAL3.
(A) S. uvarum GAL3 likely encodes a functional galactokinase. The error bars represent standard deviations of three biological replicates. A Wilcoxon rank sum test comparing the average times to first doubling between S. cerevisiae gal1 and S. cerevisiae gal1∆::SuvaGAL3 was significantly different (p=5.2e-3, n = 6). Note that driving ScerGAL3 from the ScerGAL1 promoter was insufficient to support growth with galactose as the sole carbon source, but SuvaGAL3 was sufficient. (B) Unlike S. cerevisiae gal3∆, S. uvarum gal3∆ does not show Long-Term Adaption (LTA). Strains were cultured in SC + 2% galactose. Wilcoxon rank sum tests comparing the average times to first doubling between S. uvarum gal3∆ and S. uvarum wild-type strains were significantly different (p=4.5e-5, n = 12). These experiments have been repeated independently at least twice with three biological replicates, but growth curves display only one representative replicate because LTA emergence is stochastic. (C) LTA was recapitulated in S. uvarum gal3∆ by replacing its GAL1 promoter with the S. cerevisiae GAL1 promoter (left panel) or, to a much lesser extent, by replacing the coding sequence (right panel). The insets show the times to the first doubling for the strains for their respective panels. The bar colors in the inset are the same as the growth curves. To highlight strain comparisons that test discrete hypotheses, three genotypes are repeated in Figure 2B and in both panels of Figure 2C: S. uvarum gal3∆, S. cerevisiae wild-type, and S. cerevisiae gal3∆. Strains were cultured in SC + 2% galactose. Wilcoxon rank sum tests comparing the average times to first doubling between strains were as follows: (1) p=4.6e-4 and n = 9 for S. uvarum gal3∆ versus S. uvarum gal3∆ gal1∆::PSuvaGAL1-ScerGAL1, (2) p=4.2e-5 and n = 12 for S. uvarum gal3∆ versus S. uvarum gal3∆ gal1∆::PScerGAL1-SuvaGAL1, and (3) p=0.21 and n = 12 for S. uvarum gal3∆ gal1∆::PScerGAL1-SuvaGAL1 versus S. cerevisiae gal3.
To further examine the functional divergence between SuvaGAL1 and SuvaGAL3, we knocked out GAL3 in S. uvarum. Surprisingly, the S. uvarum gal3 null mutant did not show the classic Long-Term Adaptation (LTA) phenotype of the S. cerevisiae gal3 null mutant (Tsuyumu and Adams, 1973). Instead of a growth delay of multiple days, we observed a delay of only a few hours in S. uvarum gal3∆ relative to wild-type (Figure 2B). These results suggest that other genes in S. uvarum may be able to partially compensate for the deletion of SuvaGAL3, such as its paralog, SuvaGAL1. To determine whether GAL1 differences between S. uvarum and S. cerevisiae might be responsible for the different gal3 null phenotypes, we replaced the SuvaGAL1 coding sequence or promoter sequence with their ScerGAL1 counterparts in the background of S. uvarum gal3∆. The ScerGAL1 promoter swap in S. uvarum gal3∆ largely recapitulated LTA, while the ScerGAL1 coding sequence swap extended the delay to a lesser extent (Figure 2C). Since the GAL1-GAL10 promoter is a divergent promoter, genetic modifications (evolved or engineered) inevitably impact both genes, as well as perhaps a lncRNA previously described in S. cerevisiae (Cloutier et al., 2016). These results suggest that differences at the GAL1 locus, especially within this promoter, are primarily responsible for the lack of LTA in the S. uvarum gal3∆ mutant. Overall, the data suggest that SuvaGAL1 is functionally redundant with SuvaGAL3 to a much greater extent than are ScerGAL1 and ScerGAL3. Thus, it is likely that the homologs in the common ancestor of S. uvarum and S. cerevisiae were more functionally redundant than in modern S. cerevisiae, and considerable subfunctionalization between ScerGAL1 and ScerGAL3 happened after the divergence of S. uvarum and S. cerevisiae.
S. uvarum has two co-repressors with partially overlapping functions
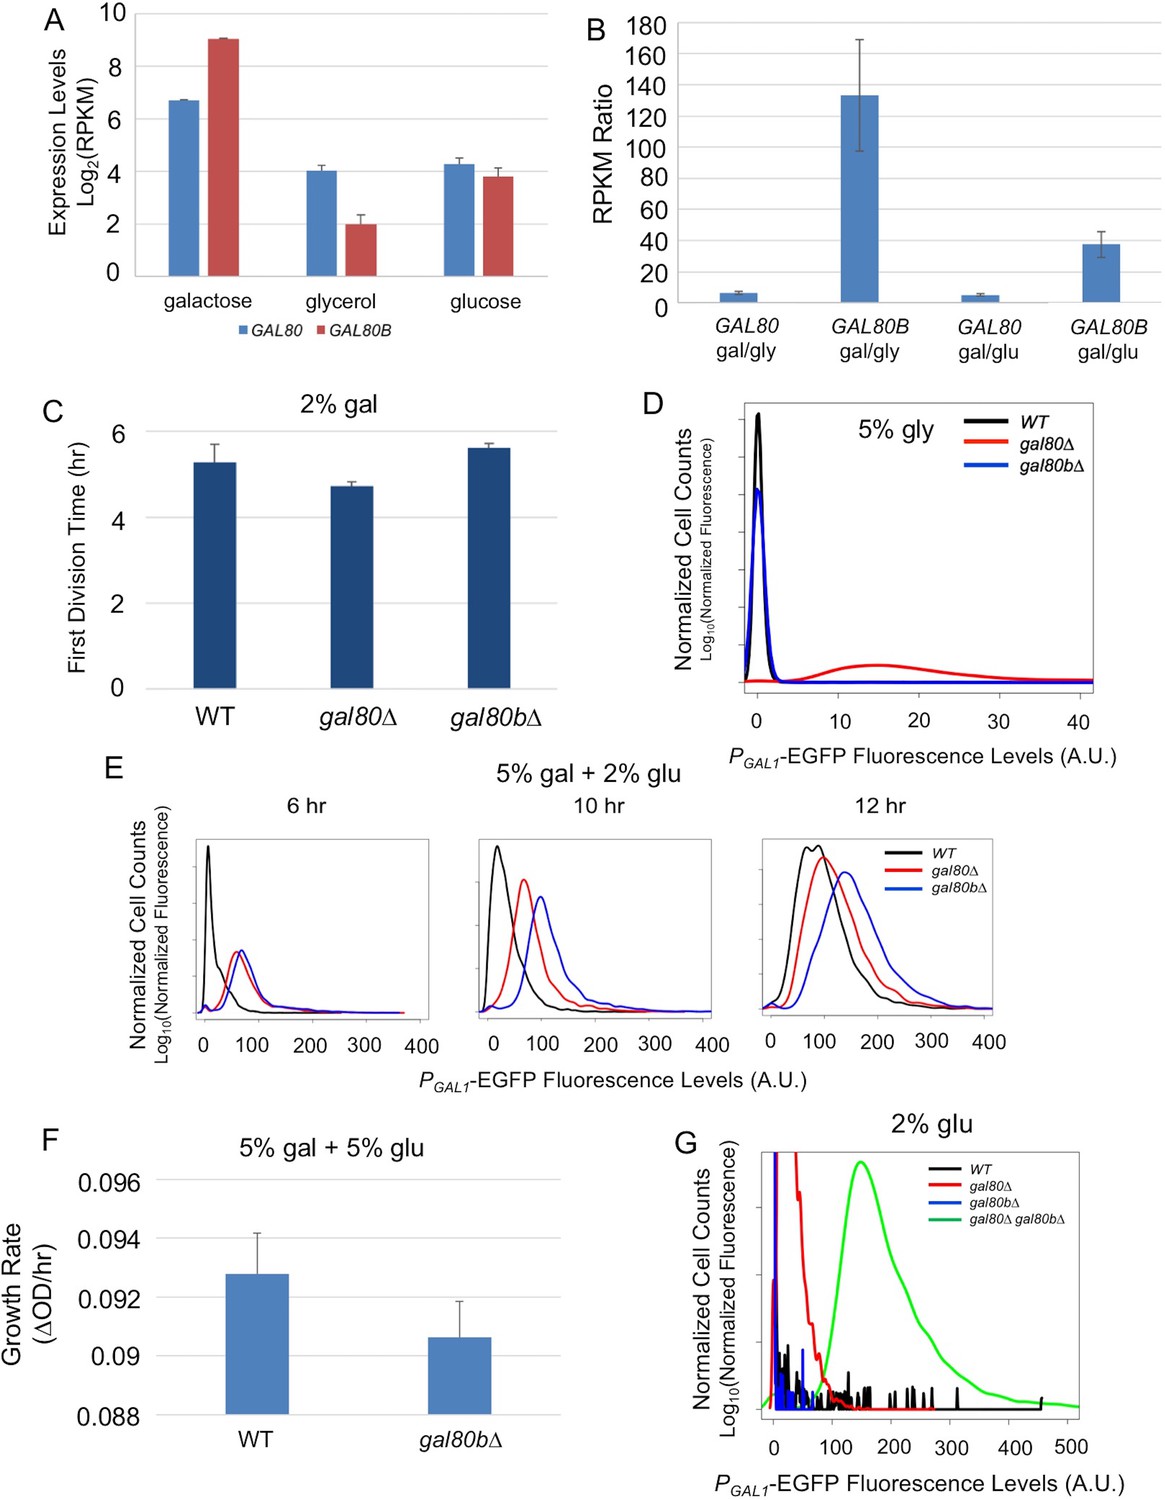
Next, we examined the functional divergence of the other pair of paralogous regulatory genes, SuvaGAL80 and SuvaGAL80B, which are homologous to the ScerGAL80 gene that encodes the sole GAL gene co-repressor in S. cerevisiae. We first examined the expression of these two genes in the presence or absence of galactose (Figure 3A). RNA sequencing (RNA-Seq) showed that SuvaGAL80 was expressed at a higher level than SuvaGAL80B in the absence of galactose (i.e. with glycerol or glucose as the sole carbon source). In contrast, in the presence of galactose, SuvaGAL80B was induced by 133-fold, much higher than the 6-fold induction observed for SuvaGAL80 (Figure 3B). S. uvarum gal80 null mutants had a shorter lag time than wild-type in galactose, as seen in S. cerevisiae gal80 null mutants (Torchia et al., 1984; Segrè et al., 2006; Hittinger et al., 2010), but gal80b null mutants did not (Figure 3C). Deleting SuvaGAL80 also resulted in elevated GAL1 expression in the non-inducing condition (i.e. 5% glycerol), while deleting SuvaGAL80B had no detectable effect (Figure 3D). Therefore, we conclude that SuvaGAL80 is the main gene responsible for repressing the GAL network in the absence of galactose.
Figure 3 with 1 supplement see all
SuvaGAL80 and SuvaGAL80B encode co-repressors with partially overlapping functions.
(A) Expression divergence between SuvaGAL80 and SuvaGAL80B. The bar graph on the left shows the mRNA levels (in log2 of Reads Per Kilobase of transcript per Million mapped reads or RPKM) of SuvaGAL80 and SuvaGAL80B in SC + 2% galactose, SC + 5% glycerol, and SC + 2% glucose. Error bars represent the standard deviations of three biological replicates. (B) Divergent galactose induction between SuvaGAL80 and SuvaGAL80B. The bar graph shows the ratio of mRNA levels between galactose (gal) and glycerol (gly), or between galactose and glucose (glu) from the data in Panel A. (C) Removing SuvaGAL80 conferred rapid initial growth in galactose. The bar graph shows the average time to first doubling of three biological replicates of each genotype in SC + 2% galactose from a representative experiment. S. uvarum gal80∆ grew significantly faster than wild-type (p=1.8e-3, n = 14, Wilcoxon rank sum test), but S. uvarum gal80b∆ did not (p=0.61, n = 14, Wilcoxon rank sum test). (D) Removing SuvaGAL80 resulted in constitutive GAL1 expression. The histogram shows the fluorescence levels of an EGFP reporter when driven by the S. uvarum GAL1 promoter in SC + 5% glycerol as determined by flow cytometry. (E) Removing SuvaGAL80B led to the elevated GAL1 expression in a mixture of glucose and galactose. Flow cytometry was conducted on strains cultured in SC + 5% galactose +2% glucose. (F) Removing SuvaGAL80B caused a fitness defect in a mixture of glucose and galactose. The specific growth rate of S. uvarum gal80b∆ was significantly lower than wild-type (p=2.7e-4, n = 18, Wilcoxon rank sum test). (G) SuvaGAL80 and SuvaGAL80B were both able to partially compensate for the loss of the other in repressing conditions, but the double-knockout resulted in constitutive expression. The histogram reports flow cytometry data from strains cultured in SC + 2% glucose for 9 hr.
Perhaps because of its dynamic expression, the deletion mutant phenotype of S. uvarum gal80b∆ proved condition dependent. Consistent with previous negative results (Caudy et al., 2013), no apparent phenotypic differences were observed for the S. uvarum gal80b∆ strain when it was grown in galactose, nor were its GAL1 expression levels altered (Figure 3C and Figure 3—figure supplement 1). Nonetheless, in a mixture of galactose and glucose, we observed elevated GAL1 expression in S. uvarum gal80b∆ strains, beyond the levels observed in S. uvarum gal80∆ strains (Figure 3E). Additionally, S. uvarum gal80b∆ grew significantly slower than wild-type after transfer from galactose to a mixture of galactose and glucose (Figure 3F), suggesting that SuvaGAL80B plays a specific and biologically important repressive role in conditions where it is required to prevent network over-induction. We also observed strong negative epistasis when both co-repressors were removed: the co-repressor double knockout had substantially higher GAL1 expression than either single knockout strain or the S. uvarum wild-type strain in the absence of galactose (Figure 3G). Thus, SuvaGAL80 and SuvaGAL80B encode partially redundant GAL gene co-repressors that can each partially compensate for the loss of the other. We conclude that SuvaGAL80B may play a minor role in the absence of galactose, but it provides important modulation in induced conditions.
Strains lacking the co-repressors arrest their growth
Surprisingly, knocking out both GAL80 and GAL80B in S. uvarum resulted in a strong Temporary Growth Arrest (TGA) phenotype in galactose (Figure 4A). This result stands in sharp contrast to the observation that S. cerevisiae gal80 null mutant strains from multiple genetic backgrounds (the lab strains S288c, W303, and R21, as well as the vineyard strain RM11-1a examined here) grew faster in galactose, a phenotype shared with Saccharomyces kudriavzevii gal80 null mutants and attributed to the constitutive GAL expression (Torchia et al., 1984; Segrè et al., 2006; Hittinger et al., 2010). This growth arrest was not a genetic engineering artifact; reintroducing SuvaGAL80 completely rescued the growth arrest, and knocking out these two genes with different markers produced the same mutant phenotype (Figure 4—figure supplement 1). More importantly, introducing ScerGAL80 completely rescued the growth arrest (Figure 4—figure supplement 1), suggesting that the TGA phenotype was not due to novel molecular functions specific to SuvaGAL80 or SuvaGAL80B. Instead, the dramatically varied phenotypes imply that these two species have different regulatory or metabolic wiring for galactose metabolism.
Figure 4 with 6 supplements see all
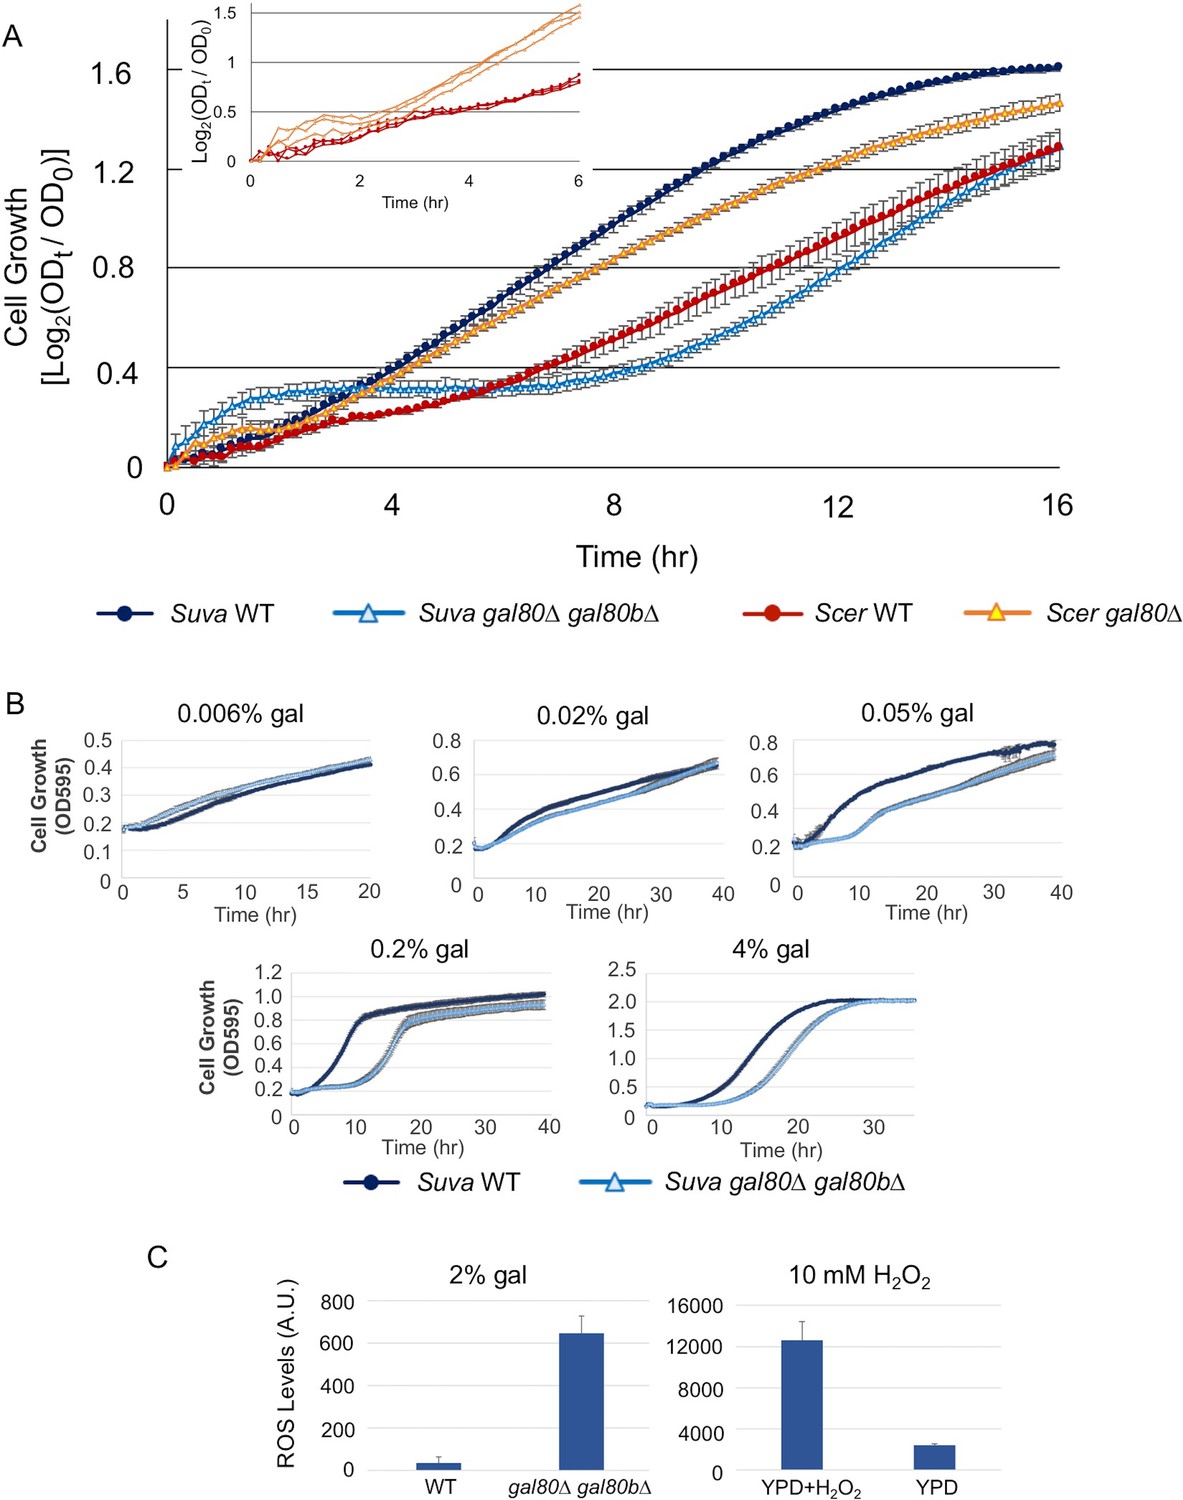
The galactose-dependent temporary growth arrest phenotype of S.uvarum gal80∆ gal80b∆.
(A) The Temporary Growth Arrest (TGA) phenotype in SC + 2% galactose. The averages of the log2 of the ratios between absorbances at each time point (ODt) and initial absorbances (OD0) for three biological replicates are shown. The error bars represent standard deviations. The inset shows the first six hours for three biological replicates each of S. cerevisiae wild-type and gal80∆ (in the background of S. cerevisiae RM11-1a, a vineyard strain). (B) The degree of the TGA phenotype was concentration dependent. A representative experiment with three biological replicates is shown; the experiment has been repeated three times. (C) Excessive reactive oxygen species (ROS) were accumulated in S. uvarum gal80∆ gal80b∆ during the TGA phase. ROS levels are reported as relative fluorescence and were measured 6.5 hr after inoculation into SC + 2% galactose (p=8.6e-6, n = 11, Wilcoxon rank sum test). The bar graph on the right shows a positive control using S. uvarum wild-type in YPD and YPD + 10 mM H2O2.
To test whether the TGA phenotype was associated with S. uvarum-specific GAL network members, we performed RNA-Seq on S. uvarum gal80∆ gal80b∆ in 2% glucose or 5% glycerol, conditions where the complete GAL network is expected to be constitutively expressed (Torchia et al., 1984; Segrè et al., 2006; Hittinger et al., 2010). We identified genes as GAL network members if and only if they were: (1) significantly up-regulated in S. uvarum gal80∆ gal80b∆ compared to the wild-type at FDR = 0.05 (35 genes); (2) up-regulated by at least two-fold (19 genes); (3) up-regulated in both glucose and glycerol (nine genes); and (4) predicted to contain Gal4 consensus binding sites (CGGN11CCG) upstream of their coding sequences. Using these stringent criteria, we found eight potential GAL network members in S. uvarum, seven of which were shared with S. cerevisiae based on previous chromatin immunoprecipitation and gene expression data (GAL1, GAL2, GAL2B, GAL7, GAL10, MEL1, and GCY1) (Torchia et al., 1984; Ren et al., 2000) (Figure 4—figure supplement 2A). GAL3, a well-established Gal4 target in S. cerevisiae, was considered differentially expressed using less stringent criteria, but orthologs of two other known targets were not (MTH1 and PCL10). The sole novel GAL network member in S. uvarum was the PGM1 gene, which was up-regulated 26-fold in 5% glycerol in S. uvarum gal80∆ gal80b∆ relative to wild-type. In S. cerevisiae, PGM1 encodes the minor isoform of phosphoglucomutase, which, along with Pgm2, connects the Leloir pathway to glycolysis (Figure 1). Notwithstanding the PGM1 gene, we conclude that the S. uvarum and S. cerevisiae GAL networks have similar compositions, and the handful of differences do not seem to readily explain the remarkably strong and unexpected TGA phenotype seen in S. uvarum strains lacking their co-repressors.
Overactive galactose catabolism precedes widespread metabolic and regulatory defects
In contrast to the constitutive expression of a fairly small network of direct Gal4 targets seen during growth in glucose and glycerol, S. uvarum gal80∆ gal80b∆ double mutants experienced global changes in gene expression that were specific to growth in galactose (Figure 4—figure supplement 2B,C). During the TGA phase, 1006 genes were differentially expressed in S. uvarum gal80∆ gal80b∆ relative to wild-type (620 genes up-regulated and 386 genes down-regulated by at least two-fold with FDR = 0.05 [Figure 5—source data 1]). After the mutant resumed growth in galactose, the vast majority (78%, 783 of 1006 genes) of these genes returned to expression levels indistinguishable from wild-type, and Gene Ontology (GO) term analysis showed that most of the biological processes affected during the TGA phase returned to normal (Supplementary file 1). The TGA phase gene expression profile was not consistent with a global environmental stress response (e.g. nuclear ribosome biogenesis and rRNA processing were up-regulated) but instead suggested a complex and incoherent integration of the regulatory signals that govern metabolism (Figure 5—source data 1 and Supplementary file 1).
Several lines of evidence suggested that this mis-regulation might be caused by overly rapid galactose catabolism immediately prior to the TGA phase. First, the optical density of the co-repressor double mutant initially increased faster than the wild-type in galactose and only plateaued after about 1.5 hr (Figure 4A). Second, during this early growth in galactose, the co-repressor double mutant produced more ethanol than the wild-type (Figure 4—figure supplement 3). Third, GAL1 was also strongly overexpressed in the mutant early during growth in galactose, but GAL1 expression gradually converged with the wild-type strain as the cells transitioned into the TGA phase (Figure 4—figure supplement 4). Finally, the severity of the TGA phenotype depended strongly on galactose concentration (Figure 4B), and growth defects were not seen in other carbon sources (Figure 4—figure supplement 5).
To further characterize how overly rapid galactose catabolism might lead to the TGA phenotype, we performed metabolomic analyses using mass spectrometry on co-repressor double mutant and wild-type strains cultured in 2% galactose. Prior to the TGA phase, the co-repressor double mutant accumulated galactose-1-phosphate, a known toxic intermediate of galactose metabolism (Petry and Reichardt, 1998; de Jongh et al., 2008), but this two-fold accumulation (relative to wild-type) seemed unlikely to be sufficient to explain the TGA phenotype. The level of galactose-1-phosphate in S. uvarum gal80∆ gal80b∆ returned to normal during the TGA phase (Figure 5 and Figure 5—source data 2) and was not nearly as strong as in S. cerevisiae gal7∆ or gal10∆ controls (seven- to 11-fold relative to S. cerevisiae wild-type) (Figure 5—figure supplement 1). Moreover, we did not observe gene expression signatures consistent with the previously described responses to galactose-1-phosphate toxicity (e.g., environmental stress response, unfolded protein response) (Slepak et al., 2005; De-Souza et al., 2014).
Instead, both transcriptomic and metabolomic analyses revealed broad metabolic defects as bottlenecks developed downstream of the Leloir pathway. During the growth arrest, we observed increased expression of genes that encode glycolytic enzymes (Figure 5 and Figure 5—source data 1). Key metabolic intermediates also accumulated in S. uvarum gal80∆ gal80b∆ strains before and during growth arrest, especially in upper glycolysis and interacting pathways (Figure 5 and Figure 5—source data 2). In particular, fructose-1,6-biphosphate accumulated significantly prior to the TGA phase (12.6-fold of wild-type levels) (Figure 5 and Figure 5—source data 2), a bottleneck that frequently occurs when upper glycolysis outpaces lower glycolysis (van Heerden et al., 2014). Under these conditions, inorganic phosphate becomes a limiting factor for growth as the ‘investment’ steps in upper glycolysis deplete the cells of ATP and phosphate to form sugar phosphates (Teusink et al., 1998; van Heerden et al., 2014). Indeed, S. uvarum gal80∆ gal80b∆ strains had one-fifth of the ATP as wild-type prior to the TGA phase (Figure 5—source data 2) and had significantly up-regulated (25-fold) expression of PHO84, which encodes a high-affinity phosphate transporter (Figure 5—source data 1).
Figure 5 with 1 supplement see all
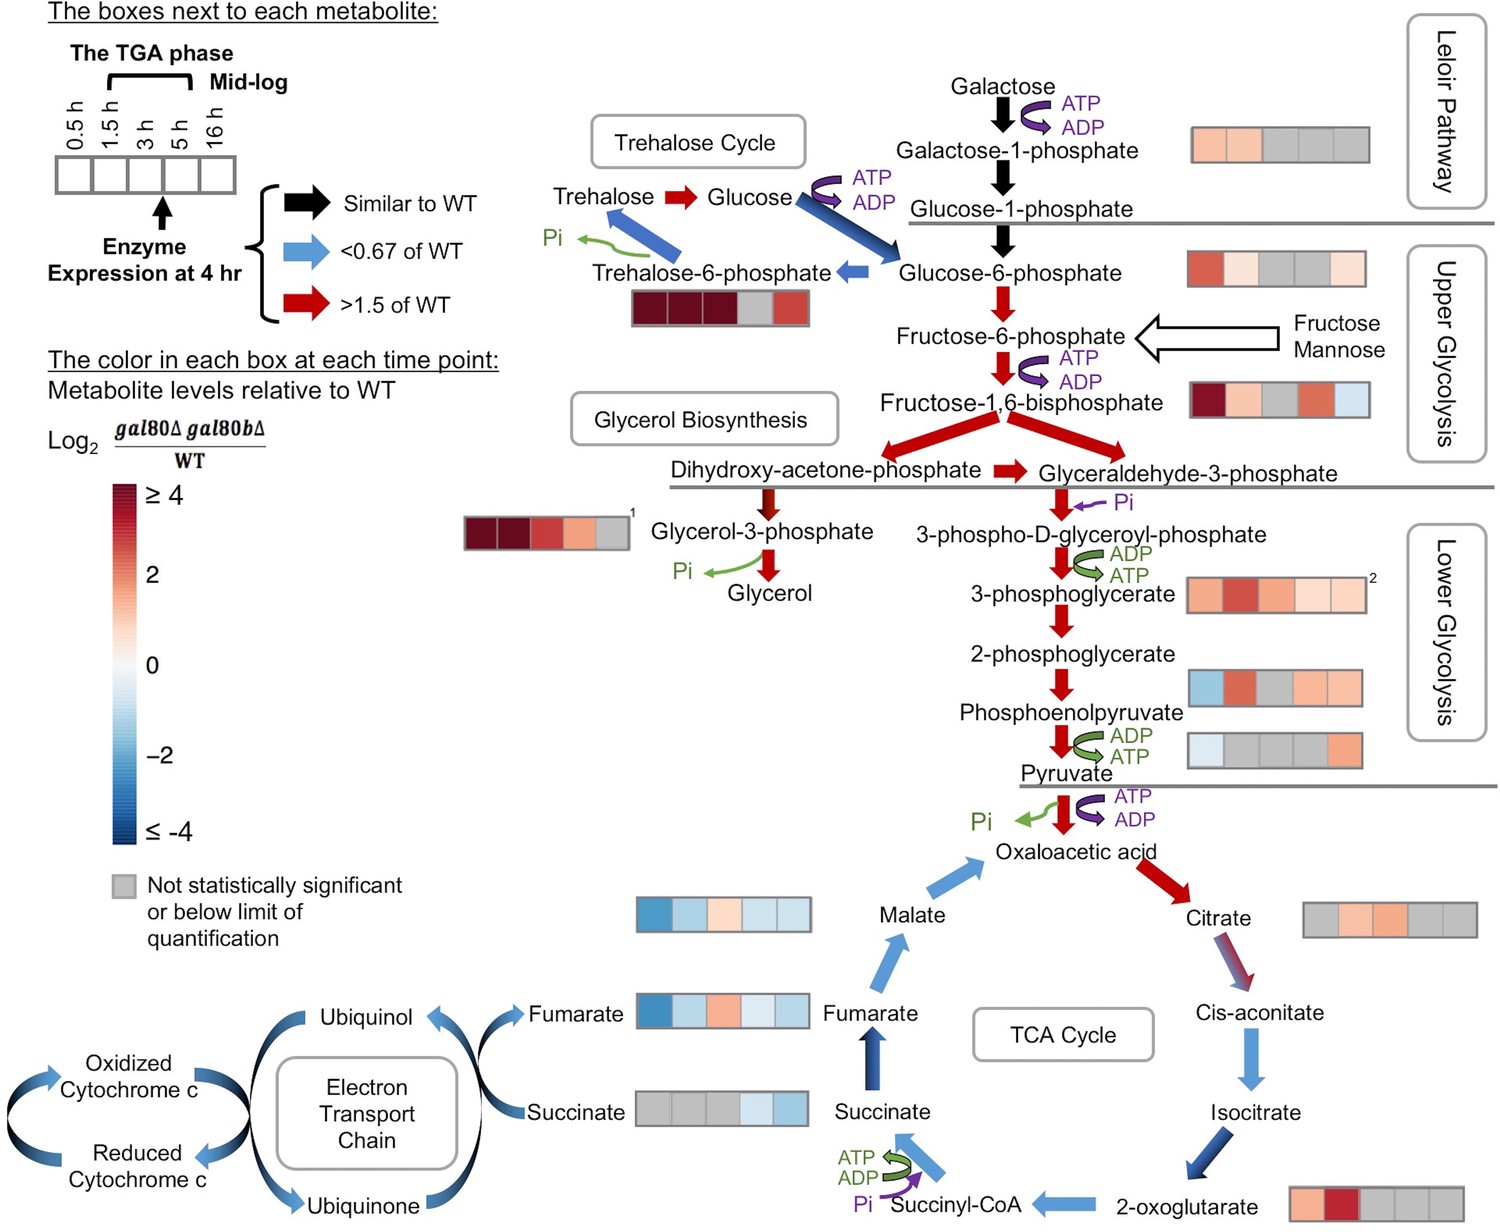
Overly rapid galactose catabolism leads to metabolic overload and bottlenecks.
The graph shows the metabolite levels and transcript expression for the Leloir pathway, glycolysis, trehalose cycle, glycerol biosynthesis, TCA cycle, and electron transport chain. Purple steps cost ATP or inorganic phosphate (Pi), while green steps generate ATP or Pi. Strains were cultured in SC + 2% galactose. The arrows are color-coded to represent the RNA-Seq gene expression differences of S. uvarum gal80∆ gal80b∆ relative to wild-type at 4 hr (red, up in the mutant; blue, down in the mutant; black, similar to wild-type; mixed colors (e.g. black and blue) indicate that the expression of genes involved in this step differs). The boxes next to each metabolite represent the log2 of the metabolite concentration differences relative to wild-type over time (0.5, 1.5, 3, 5, and 16 hr, respectively). The statistical significance for metabolite levels was assessed using Student’s t-tests (n = 3, p<0.05 with gray reported as not significant). The 1.5 hr to 5 hr time points correspond to the TGA phase, whereas the 16 hr time point corresponds to mid-log phase after recovery from the TGA phase. 1, the sum of the metabolite concentrations of glycerol-3-phosphate and glycerol-2-phosphate, the latter of which is not known to be a major metabolite in Saccharomyces; 2, the sum of the metabolite levels of 3-phosphoglycerate and 2-phosphoglycerate.
-
Figure 5—source data 1
Differential gene expression between S. uvarum gal80∆ gal80b∆ and wild-type during the TGA phase and at mid-log phase.
- https://doi.org/10.7554/eLife.19027.017
-
Figure 5—source data 2
Mass spectrometry metabolomic results comparing S. uvarum gal80∆ gal80b∆ to wild-type during the TGA phase and mid-log phase.
- https://doi.org/10.7554/eLife.19027.018
S. cerevisiae combats metabolic overload in upper glycolysis by using two main pathways to restore phosphate pools. The trehalose cycle temporarily reroutes upper glycolysis to store sugars as trehalose (van Heerden et al., 2014), while glycerol biosynthesis offers an early exit from glycolysis (Luyten et al., 1995). Disrupting the S. cerevisiae trehalose cycle leads to the accumulation of fructose-1,6-biphosphate, decreased ATP levels, and ultimately growth arrest due to a metabolically unbalanced state (van Heerden et al., 2014; Gibney et al., 2015), metabolic changes similar to the S. uvarum TGA phenotype. Strikingly, both pathways experienced dramatic bottlenecks in S. uvarum gal80∆ gal80b∆ strains before and during the TGA phase. Specifically, S. uvarum gal80∆ gal80b∆ cells accumulated 79- to 231-fold more trehalose-6-phosphate before and during the TGA phase, while they accumulated 225-fold more glycerol-3-phosphate before the TGA phase, the latter of which lessened to some extent during the TGA phase (3- to 16-fold) (Figure 5 and Figure 5—source data 2). These data are consistent with the hypothesis that the trehalose cycle and the glycerol biosynthesis pathway are unable to handle the metabolic overload when galactose is catabolized too rapidly in S. uvarum strains lacking the GAL network repression system.
The metabolic effects of the TGA phenotype also reverberated downstream, leading to the transcriptional down-regulation of the lower part of the TCA cycle and the electron transport chain (Figure 5). Reduced respiratory activity has been shown to increase the formation of reactive oxygen species (ROS) (Barros et al., 2004), and the co-repressor double mutant had strong signatures of mitochondrial dysfunction. GO terms related to mitochondrial structural components, mitochondrial translation, and respiration were among the most strongly down-regulated (Supplementary file 1). Indeed, we observed significantly higher accumulation of ROS in S. uvarum gal80∆ gal80b∆ during the TGA phase by using the general ROS indicator dichlorodihydrofluorescein diacetate (H2DCF-DA) (Figure 4C). We conclude that disconnecting S. uvarum galactose metabolism from the negative feedback loops normally provided by the co-repressors Gal80 and Gal80b likely allows galactose to enter the Leloir pathway and glycolysis too rapidly, leading to metabolic defects far beyond the mild accumulation of galactose-1-phosphate and deep into central metabolism.
Specific sugars can exacerbate metabolic overload
To determine whether the TGA phenotype reflected a more general metabolic constraint imposed by the interplay between glycolysis and interacting metabolic pathways, we grew S. uvarum gal80∆ gal80b∆ in mixtures of galactose with fructose, mannose, or glucose. Fructose, mannose, and glucose are all primarily catabolized through glycolysis, but only glucose generates glycolytic intermediates that are upstream of the trehalose cycle (Figure 5). Thus, fructose and mannose are expected to contribute directly to metabolic overload with minimal offsetting effects from the trehalose cycle. If the interaction between glycolytic load and the trehalose cycle were important to the TGA phenotype, growing the double mutant in mixtures of galactose with fructose or mannose would exacerbate the growth arrest. In contrast, if the TGA phenotype were caused by galactose-specific metabolism, the addition of these more preferred sugars would have no effect, or perhaps mitigate the TGA phenotype. Consistent with the TGA phenotype being caused by a general overloading of upper glycolysis, both fructose and mannose strongly exacerbated the TGA phenotype in S. uvarum gal80∆ gal80b∆, while glucose partially rescued the TGA phenotype (Figure 6A). Importantly, mixing fructose or mannose with galactose had much stronger defects than the identical amounts of galactose alone (Figure 4B and Figure 6A). Co-culturing wild-type S. uvarum strains in galactose with these sugars was not inherently toxic (Figure 6A), so the presence of the co-repressors allows cells to cope with this challenge. Growing S. uvarum gal80∆ gal80b∆ in fructose, mannose, or glucose alone also did not cause growth defects (Figure 4—figure supplement 5). Moreover, deleting GAL1 completely rescued the TGA phenotype in the co-repressor double mutant (Figure 6B), while mixtures of mannose and galactose dramatically increased the levels of ROS in S. uvarum gal80∆ gal80b∆ (Figure 6C), implying that the phenotypic enhancement caused by this sugar mixture acts through the same mechanism observed in galactose alone. Collectively, these results suggest that overly rapid catabolism of sugars can lead to general metabolic and growth defects when the appropriate futile metabolic cycles and negative feedback regulatory loops are not able to slow down catabolism.
Figure 6
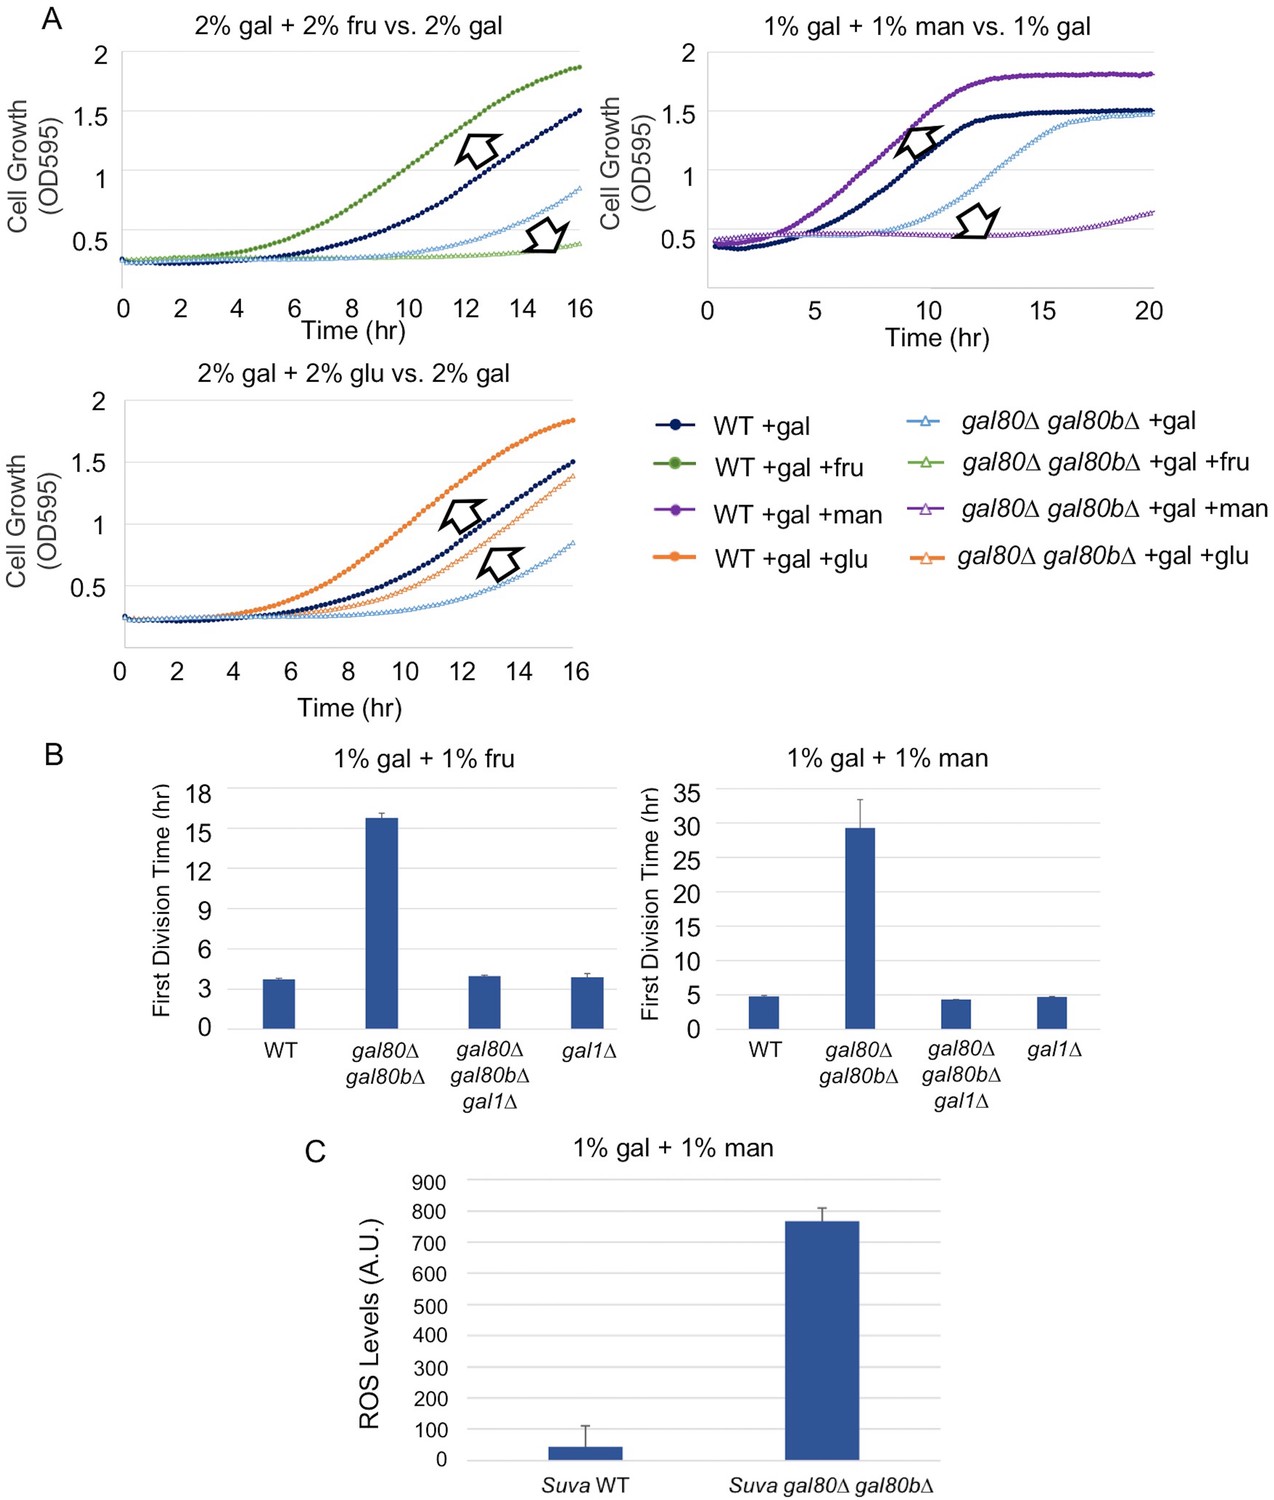
The addition of sugars downstream of the trehalose cycle exacerbated metabolic overload.
(A) Fructose and mannose exacerbated the TGA phenotype in the S. uvarum gal80∆ gal80b∆ background, whereas glucose partially rescued the TGA phenotype. (B) The S. uvarum TGA phenotype in galactose and fructose or mannose can be rescued by the deletion of GAL1. The average times to first doubling are shown for three biological replicates. The error bars represent standard deviations. S. uvarum gal80∆ gal80b∆ gal1∆ was significantly different than S. uvarum gal80∆ gal80b∆ in both SC + 1% galactose +1% fructose (p=4.8e-3, n = 6, Wilcoxon rank sum test) and SC + 1% galactose + 1% mannose (p=2.9e-3, n = 6, Wilcoxon rank sum test). S. uvarum gal80∆ gal80b∆ gal1∆ was not significantly different from S. uvarum gal1∆ in SC + 1% galactose +1% fructose (p=0.43, n = 6, Wilcoxon rank sum test) but was marginally different from S. uvarum gal1∆ in SC + 1% galactose +1% mannose (p=0.03, n = 6, Wilcoxon rank sum test). (C) Elevated accumulation of ROS in S. uvarum gal80∆ gal80b∆ in SC + 1% galactose +1% mannose. S. uvarum gal80∆ gal80b∆ had significantly higher ROS levels than the wild-type (p=8.6e-6, n = 11, Wilcoxon rank sum test). ROS levels are reported as relative fluorescence levels.
The less active S. cerevisiae GAL network is less susceptible to metabolic overload when derepressed
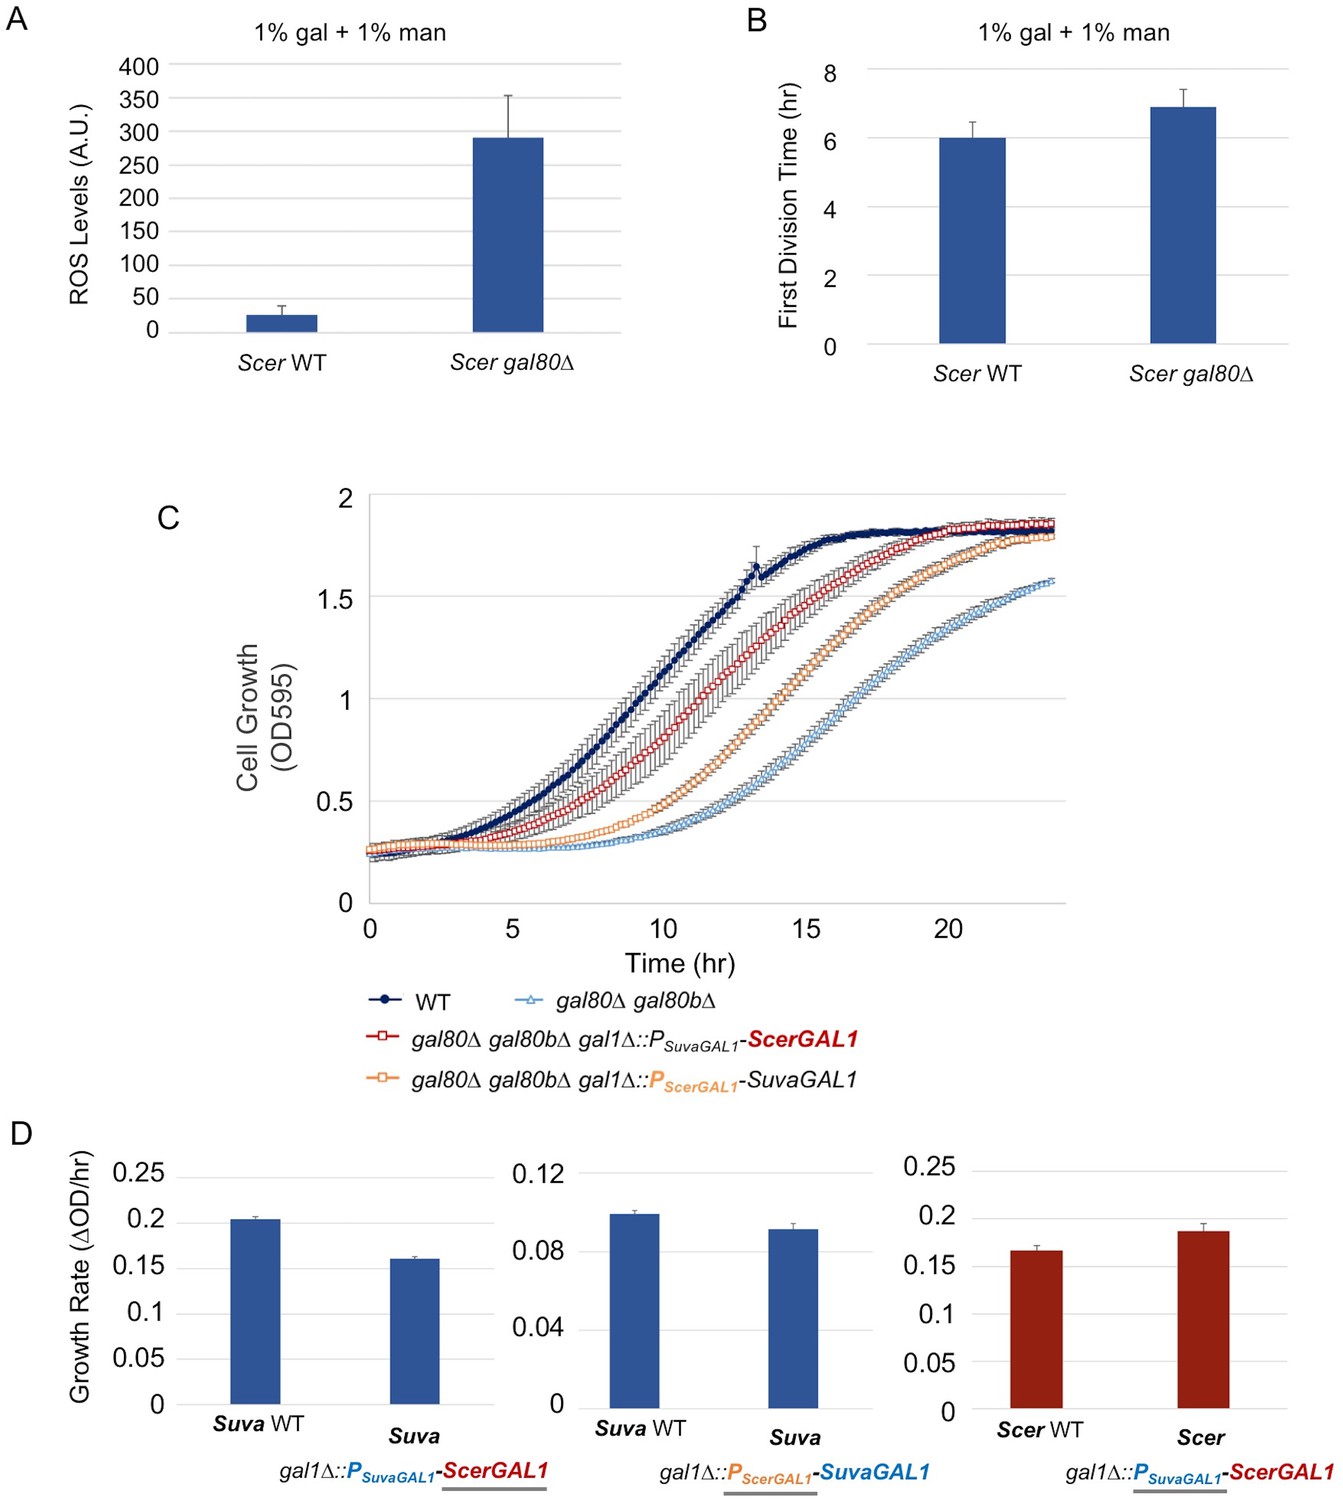
We next considered whether the differences between the GAL networks of S. cerevisiae and S. uvarum might explain why a similar phenotype had not been reported for S. cerevisiae co-repressor mutants. Recent work has convincingly shown that the S. uvarum GAL network is more transcriptionally active than the S. cerevisiae GAL network, especially in non-inducing and mixed sugar conditions (Caudy et al., 2013; Roop et al., 2016). Thus, we wondered whether S. cerevisiae and S. uvarum galactose catabolism might be under qualitatively similar constraints, even as the more poised and active state of the S. uvarum GAL network might render it more vulnerable to metabolic overload. First, we examined S. cerevisiae gal80 null mutants more closely and found a similar but less-pronounced early rapid increase in optical density, followed by a brief but reproducible TGA phenotype (Figure 4A, inset). This observation was missed by earlier studies, which were focused on later time points, because S. cerevisiae gal80 null mutants eventually grow much faster on galactose (Torchia et al., 1984; Segrè et al., 2006; Hittinger et al., 2010). To test whether the weak TGA phenotype seen in S. cerevisiae was due to mechanistically similar metabolic constraints, we sought to exacerbate the phenotype of a S. cerevisiae gal80∆ strain in a mixture of mannose and galactose. Indeed, the co-repressor mutant produced significantly more ROS than wild-type under these conditions (Figure 7A) and grew slightly more slowly (Figure 7B).
Figure 7
The less active S. cerevisiae GAL1 gene is partially responsible for a subtle temporary growth arrest.
(A) Elevated accumulation of ROS in S. cerevisiae gal80∆ in SC + 1% galactose +1% mannose. S. cerevisiae gal80∆ had significantly higher ROS than wild-type (p=2.3e-6, n = 12, Wilcoxon rank sum test). ROS levels are reported as relative fluorescence levels. (B) S. cerevisiae gal80∆ grew more slowly when galactose was mixed with mannose. The average of three biological replicates from a representative experiment is shown, and the error bars represent standard deviations (p=0.028, n = 6, Wilcoxon rank sum test). (C) Both the ScerGAL1 coding sequence and promoter are able to partially rescue the TGA phenotype. The error bars show the standard deviation of three biological replicates. (D) Both the ScerGAL1 coding sequence and promoter reduced the growth rate of an otherwise wild-type strain of S. uvarum in SC + 2% galactose, while the reciprocal swap of the GAL1 promoter in S. cerevisiae increased its growth rate. Wilcoxon rank sum tests comparing the specific growth rates of each subpanel were all significant: (1) p=2.3e-6 and n = 12 for S. uvarum gal1∆::PSuvaGAL1-ScerGAL1 versus S. uvarum wild-type, (2) p=2.5e-4 and n = 9 for S. uvarum gal1∆::PScerGAL1-SuvaGAL1 versus S. uvarum wild-type, and (3) p=8.8e-3 and n = 9 for S. cerevisiae gal1∆::PSuvaGAL1-ScerGAL1 versus S. cerevisiae wild-type.
Given the interspecific functional differences described above for GAL1 (Figure 2C) and its role as the gatekeeper of the Leloir pathway, we hypothesized that the varied strengths of the TGA phenotype might be due to genetic differences in the GAL1 locus. Thus, we precisely replaced the S. uvarum GAL1 promoter or the GAL1 coding sequence with their S. cerevisiae counterparts in S. uvarum gal80∆ gal80b∆. The S. cerevisiae GAL1 promoter rescued the TGA phenotype to some extent, but the GAL1 coding sequence swap was able to rescue the TGA phenotype to an even greater extent (Figure 7C). To confirm that ScerGAL1 was less active than SuvaGAL1 and not less toxic for other reasons, we examined the same precise allele replacements in an otherwise wild-type S. uvarum strain (i.e. containing functional copies of both co-repressors), as well as a precise reciprocal swap in S. cerevisiae replacing the ScerGAL1 promoter with the SuvaGAL1 promoter. Swapping the ScerGAL1 promoter and coding sequence into S. uvarum both led to lower growth rates in galactose, while swapping the SuvaGAL1 promoter into S. cerevisiae led to faster growth (Figure 7D). We conclude that the S. uvarum GAL1 promoter and coding sequences both encode higher activity than their S. cerevisiae counterparts. Thus, differences in their GAL network activities at least partly explain the relative strengths of their TGA phenotypes and the constraints placed on their galactose metabolisms.
Discussion
Biodiversity offers a panoramic window to molecular biology
The deep conservation of metabolism and many molecular processes contrasts sharply with the rapid turnover in the regulatory networks that sculpt organismal and phenotypic diversity. Here we have shown how numerous genetic differences between the S. cerevisiae and S. uvarum GAL networks, especially in the functions of paralogous regulatory genes, contribute to a more poised and active state in S. uvarum that is coupled to more robust repression system. When genes encoding the co-repressors were deleted, S. uvarum displayed a strong and unexpected growth arrest in galactose, likely due to metabolic overload. Even though S. cerevisiae produced qualitatively similar results, decades of previous research on this iconic metabolic and regulatory network overlooked their relatively mild presentation. Just as exaggerated manifestations facilitated the discoveries of transposons in maize, RNAi in Caenorhabditis elegans, and telomeres in Tretrahymena (Blackburn et al., 2006), the striking phenotype observed in the non-traditional model organism S. uvarum allowed us to more fully characterize the defect caused by overly rapid galactose catabolism, while demonstrating metabolic constraints conserved across sugars and organisms.
The non-equivalence of sugars in contributing to metabolic overload
In contrast to glucose, fructose and mannose each had strikingly deleterious effects on cells that were already consuming galactose too rapidly. In Saccharomyces, these differences can be explained both by their effects on signaling pathways and by their entry points into glycolysis. Several glucose signaling pathways directly repress GAL gene transcription (Johnston et al., 1994) and increase the degradation rate of Gal2 protein (Horak and Wolf, 2001), both of which would serve to reduce glycolytic load. In S. cerevisiae, fructose and mannose do not trigger glucose repression as strongly as glucose (Dynesen et al., 1998; Meijer et al., 1998). Perhaps as importantly, fructose and mannose bypass the trehalose cycle, a futile cycle recently shown to detour more than a quarter of early-stage glycolytic flux to prevent an unbalanced metabolic state and growth arrest (van Heerden et al., 2014). The challenges of the catabolism of sugars other than glucose may be widespread. For example, in humans, bypassing glucose-responsive regulatory mechanisms with fructose has been associated with diabetes (Lê et al., 2009; Kolderup and Svihus, 2015) and cancer (Port et al., 2012; Jiang et al., 2016).
Network architectures reflect metabolic constraints
The intrinsic constraints imposed by galactose metabolism may have led to the evolution of regulatory mechanisms that protect against the risks of metabolic overload. Many of the differences between the S. uvarum and S. cerevisiae GAL networks can be explained as offering alternative protective strategies, while affording varied catabolic capabilities. For instance, the direct regulation of the PGM1 gene by Gal4 would enhance the connection between the Leloir pathway and glycolysis in S. uvarum relative to S. cerevisiae (Fu et al., 2000; Ostergaard et al., 2000; Garcia Sanchez et al., 2010). S. uvarum PGM1 is highly induced by galactose (Figure 4—figure supplement 6), but this likely ancestral regulatory connection was lost in the S. cerevisiae-S. kudriavzevii clade (Figure 4—figure supplement 6). Nearly all of the known differences between the S. cerevisiae and S. uvarum GAL networks make S. uvarum more active, including (1) apparent regulation of PGM1 by Gal4; (2) the presence of genes encoding two galactose transporters (Figure 1); (3) the galactokinase activity of SuvaGal3 (Figure 2A); (4) the higher activity of both the GAL1 coding and cis-regulatory sequences (Figure 7D); and (5) higher background gene expression across the network (Caudy et al., 2013; Roop et al., 2016). Indeed, the possession of a gene encoding a second co-repressor appears to be one of the few features of the S. uvarum GAL network that would serve to counteract its higher activity. Thus, the dramatic up-regulation of GAL80B during induction may offer a robust negative feedback loop that helps prevent over-induction and metabolic overload. The retention of GAL80B may have allowed S. uvarum to maintain a more active GAL network, while the S. cerevisiae GAL network evolved lower activity.
Comparison of yeast genomes beyond the Saccharomyces suggests that galactose metabolism may impose similar constraints across the yeast phylogeny. The genes encoding the Leloir enzymes occur in one of the few broadly conserved yeast gene clusters (Wong and Wolfe, 2005; Slot and Rokas, 2010; Wolfe et al., 2015; Riley et al., 2016), which has been suggested could promote enzyme co-regulation to prevent the accumulation of toxic intermediates (Price et al., 2005; Lang and Botstein, 2011) or ensure that only complete networks are co-inherited (Lawrence and Roth, 1996; Hittinger et al., 2010). In addition to S. uvarum, many yeast species that underwent the WGD retain GAL80B (Hittinger et al., 2004). Perhaps due to these intrinsic metabolic challenges and the limited benefits of maintaining a dedicated GAL network, the ability to consume galactose has been lost many times across diverse yeast lineages (Hittinger et al., 2004, 2015; Slot and Rokas, 2010; Wolfe et al., 2015; Riley et al., 2016).
Ongoing functional diversification of paralogs and their gene networks
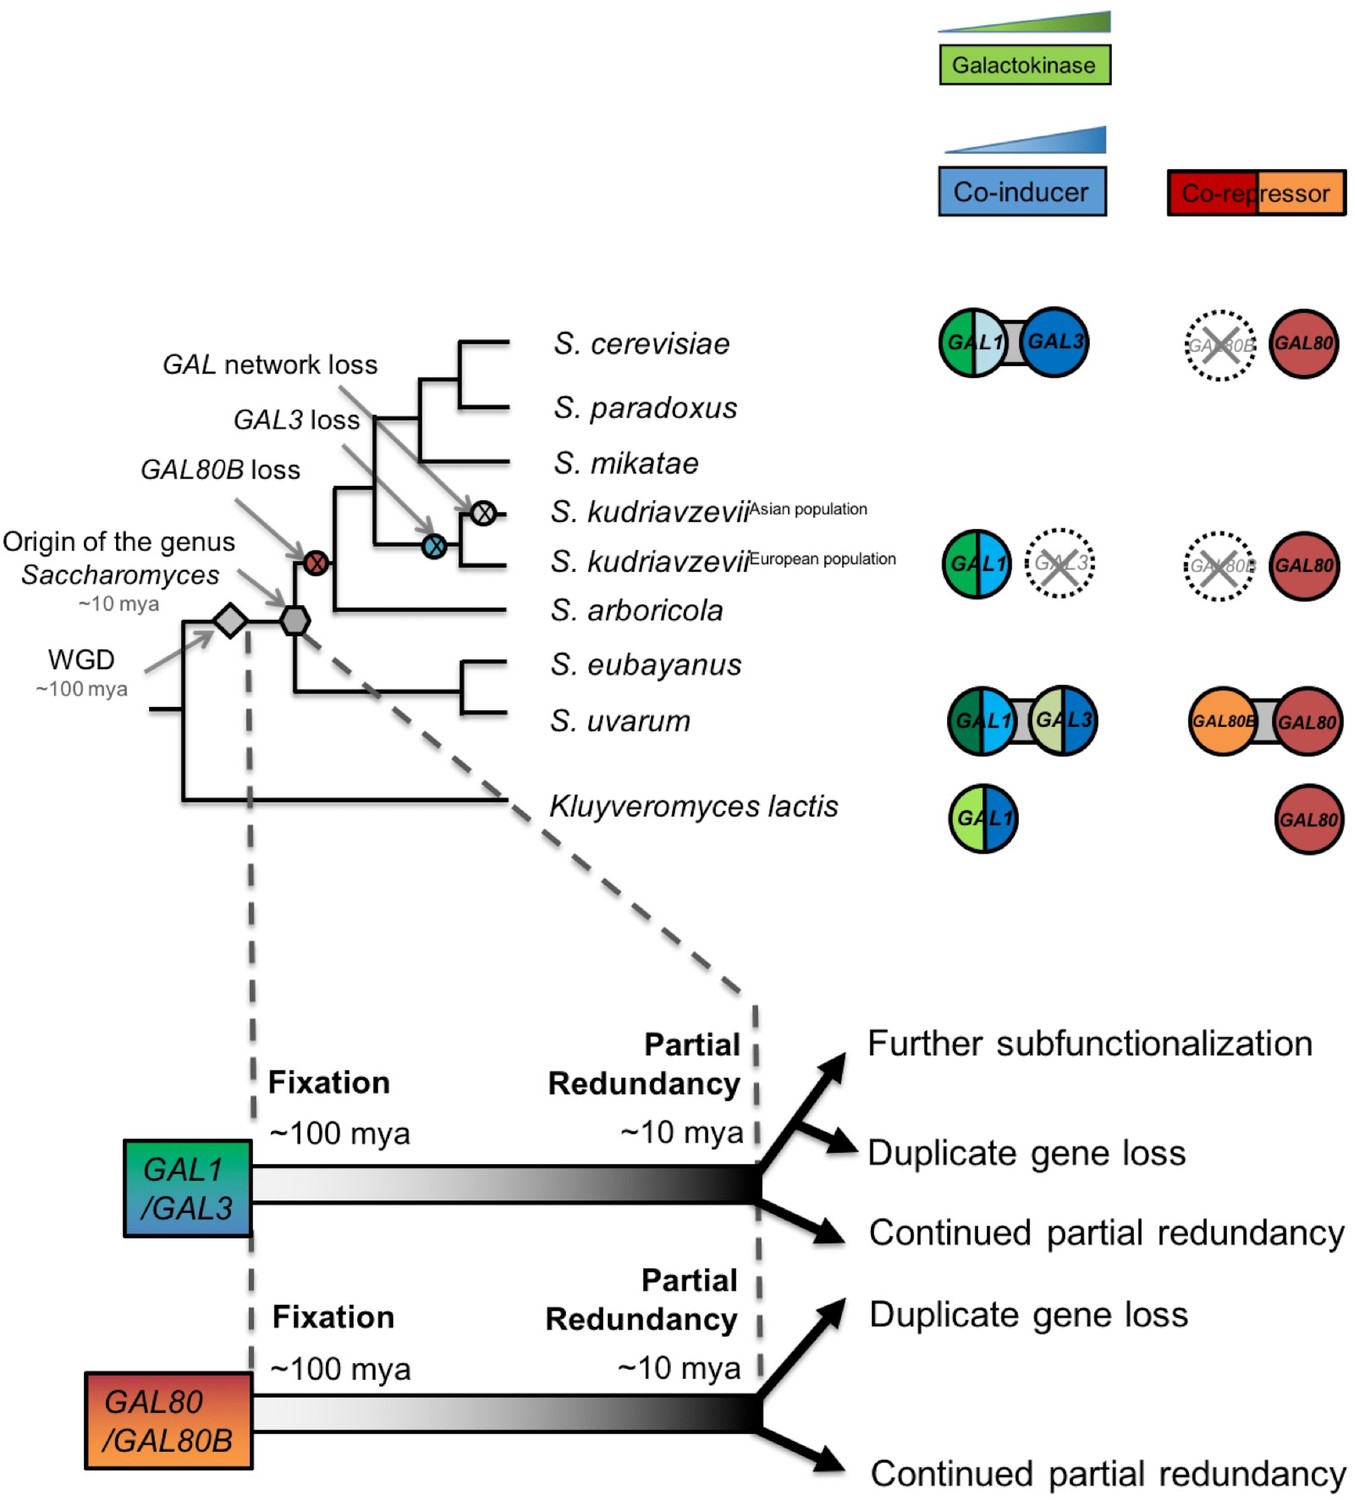
In contrast to more commonly studied processes of the rapid neofunctionalization and subfunctionalization of paralogs (Moore and Purugganan, 2003; Innan and Kondrashov, 2010), we have shown how duplicate GAL genes continued to diverge functionally in ways that dramatically influenced the metabolic and regulatory states of extant Saccharomyces species. Based on the redundancy observed between GAL1 and GAL3 and between GAL80 and GAL80B in S. uvarum, we infer that the functions of these two paralog pairs overlapped more at the origin of the genus Saccharomyces than in S. cerevisiae (Figure 8). After the S. uvarum-S. eubayanus clade diverged from the S. arboricola-S. cerevisiae clade, these genes met distinct fates in different lineages (Figure 8). GAL80B was lost in the S. cerevisiae-S. arboricola clade, while it was retained in S. uvarum and S. eubayanus (Hittinger et al., 2010, 2004; Scannell et al., 2011; Caudy et al., 2013; Hittinger, 2013; Liti et al., 2013; Baker et al., 2015). The fates of GAL1 and GAL3 were still more varied. GAL3 was lost in a European population of S. kudriavzevii, resulting in an induction defect, while the entire GAL network was lost in an East Asian population of this species that cannot consume galactose (Hittinger et al., 2010). GAL1 and GAL3 were nearly completely subfunctionalized in S. cerevisiae (Hittinger and Carroll, 2007), but we have shown here that they maintain considerable redundancy in S. uvarum.
Figure 8
Ongoing diversification of the functions of the GAL1-GAL3 and GAL80-GAL80B duplicate gene pairs in Saccharomyces.
Important evolutionary events are shown on the cladogram. WGD, the whole genome duplication that created the two pairs of paralogs. The inferred duplicate divergence fates are shown at the bottom of the tree. The inferred timeline is depicted by the dashed line. Roughly ~100 million years ago, these two pairs of duplicate genes were fixed in the ancestral genome following a WGD event. Considerable partial redundancy was maintained in the lineage leading to the origin of the genus Saccharomyces. In the last ~10 million years, the fates of the duplicate genes have functionally diverged along different evolutionary trajectories. The bifunctionality of the GAL1/GAL3 genes is represented by green for the enzymatic function and blue for the co-induction function. The color shading represents approximate functionality for experimentally characterized genes: a darker color indicates a stronger function, whereas a lighter color indicates a weaker function. The dashed circle with a cross indicates the loss of the indicated gene. Note that the S. kudriavzevii Asian population lost its entire GAL network, while the European population retained most of its GAL network but lost GAL80B and GAL3. The additional co-repressor in S. uvarum may minimize the risk of metabolic overload due to an otherwise highly active GAL network.
For both paralog pairs, the ongoing functional diversification has been asymmetric. Deleting GAL80B and GAL3 produced less striking phenotypes than deletion of their paralogs in S. uvarum, and some lineages have experienced inactivation or loss of these genes naturally. In the lineage leading to S. cerevisiae, Gal3 completely lost enzymatic activity, while a decrease in the promoter activity of its paralog GAL1 reduced, but did not eliminate, its ability to induce the network rapidly. Other GAL genes also experienced an adaptive decrease in promoter activities in the lineage leading to S. cerevisiae (Roop et al., 2016), which may have been enabled or necessitated by the loss of the secondary co-repressor encoded by GAL80B. Remarkably, the disparate resolutions of the functions of these paralogs did not happen soon after the WGD that created them. Instead, the diversification described here occurred within the last 10 million years of a 100 million year history, demonstrating that the echoes of duplication events continue to resonate through gene networks much longer than is generally appreciated (Gordon et al., 2009; Conant et al., 2014).
The ongoing functional diversification of ancient paralogs likely has an even greater impact on the evolution of plants and vertebrates, where nearly all extant species are the products of multiple rounds of WGD, and differential paralog retention is widespread (Amores et al., 1998, 2004; Aury et al., 2006; Blomme et al., 2006; Gómez-Valero et al., 2007; Scannell et al., 2007; De Smet et al., 2013; McGrath et al., 2014). Molecular and genetic dissection is much more challenging in these systems, but there are hints that the diversification of ancient paralogs continues to have functional consequences for the evolution of metabolism (Steinke et al., 2006; Conant et al., 2014) and development (Kassahn et al., 2009; Cortesi et al., 2015). Paralog diversification is often asymmetric as one paralog acquires a more specialized or auxiliary role (Force et al., 1999; Moore and Purugganan, 2003; Hittinger and Carroll, 2007; Des Marais and Rausher, 2008; Innan and Kondrashov, 2010; Conant et al., 2014). Even if this specialization is conditionally adaptive, the auxiliary paralog can become more susceptible to gene loss when conditions change. Paralog loss ends the saga of duplicate gene diversification, possibly forcing partially redundant functions back onto the remaining paralog, relieving paralog interference (Baker et al., 2013), or leading to compensatory changes elsewhere in the network. Perhaps more interestingly, paralog loss eliminates redundancy and limits the long-term potential for adaptation. The ongoing evolutionary processes affecting the GAL paralogs show how gene duplication facilitates phenotypic change and network diversification in ways that continue to reverberate.
Materials and methods
Strain construction
Request a detailed protocolTo construct GAL gene knockouts, we used MX cassettes (hphMX, natMX, or kanMX) (Wach et al., 1994; Goldstein and McCusker, 1999) to precisely replace the coding sequence from start codon to stop codon. Transformations were based on the standard lithium acetate/PEG method optimized for S. uvarum (room temperature incubation, followed by a 37˚C heat shock) (Gietz et al., 1995; Caudy et al., 2013). To perform allele swaps, the coding sequence or promoter was first replaced by a selectable and counter-selectable TK-hphMX cassette, which does not require the prior introduction of an auxotrophy (Alexander et al., 2014). The coding sequence or promoter of the desired replacement sequence was amplified by PCR primers with overhangs homologous to the targeted genomic flanking region. In some cases, extended homology (100–300 bp) was then introduced through PCR sewing. For each GAL1 promoter swap, we swapped the entire upstream intergenic region. Note that the S. cerevisiae and S. uvarum GAL1 promoters are both divergent promoters that also regulate GAL10 and may also impact a lncRNA previously described in S. cerevisiae (Cloutier et al., 2016). Successful replacement strains were isolated by selecting for the loss of thymidine kinase activity by resistance to 5-fluorodeoxyuridine (FUdR), as well as the loss of resistance to hygromycin by replica plating (Alexander et al., 2014). GFP reporters were constructed in three parts: the hphMX cassette was placed upstream as the selection marker, the S. uvarum GAL1 promoter was used to drive the expression of the reporter, and the reporter was a yEGFP (yeast Enhanced Green Fluorescence Protein) construct with a S. cerevisiae CYC1 terminator that was amplified from FM1282 (Hittinger and Carroll, 2007; Hittinger et al., 2010). GFP reporters were introduced to replace S. uvarum gto1, an inactive pseudogene (chr7: 767,328–766,478) orthologous to S. cerevisiae GTO1 (Scannell et al., 2011). The modified loci of all transformants were verified by Sanger sequencing. S. cerevisiae is NCBITaxon:4932, S. uvarum is NCBITaxon:230603, and the strains used in this study are listed in Supplementary file 2.
Media and growth assays
Request a detailed protocolStrains were first streaked on YPD (10 g/L yeast extract, 20 g/L peptone, 20 g/L glucose, 18 g/L agar) plates from frozen glycerol stocks. Next, a single colony of each strain was cultured in synthetic complete (SC) medium plus 0.2% glucose (1.72 g/L yeast nitrogen base without amino acids, 5 g/L ammonium sulfate, 2 g/L complete dropout mix, 2 g/L glucose) for 2–3 days, a condition that does not induce and only minimally represses the GAL network. There were at least two biological replicates for each genotype, generally from independent transformants. These pre-cultures were washed with water and inoculated into the desired growth media in a 96 well plate. No explicit power analyses were performed to determine sample sizes or the number of replicates. Instead, each experiment was independently performed at least twice on separate days; details can be found in each legend. Biological replicates were defined as independent isogenic colonies on agar plates, which were used for subsequent precultures and growth assays; technical replicates were defined as independent growth assays from the same preculture. The absorbance of each well was read by an unshaken BMG FLUOstar Omega plate reader every 10 min at 595 nm. The number of cell divisions for each time point was calculated as log2[(ODstrain−ODmedia)/(ODstart−ODmedia), an equation that normalized each optical density time point to its starting optical density and the optical density of the medium. The times to first doubling were calculated as the times for the optical densities to double from their normalized starting points. Specific growth rates were calculated using the Growth Curve Analysis Tool (GCAT) (Bukhman et al., 2015). Replicates that failed to grow as precultures or during growth assays were considered as outliers and were excluded from subsequent analyses; no other data were excluded. For S. cerevisiae and S. uvarum gal1 mutant growth assays (Figure 2—figure supplement 1), strains were pre-cultured in SC plus 0.67% fructose for 2 days and inoculated at a 1:1000 ratio into supplemented minimal medium (1.72 g/L yeast nitrogen base without amino acids, 5 g/L ammonium sulfate, 85.6 mg/L uracil, 85.6 mg/L lysine, 20 g/L galactose) plus 2% galactose or no carbon source. The growth properties of these strains were determined by subtracting the optical densities of cultures in media without a carbon source from media with galactose; differences less than 0.05 were considered as 'no growth.' In each case, S. cerevisiae strains were cultured at 30˚C, while S. uvarum strains were cultured at 24˚C, except when they were cultured in the same 96 well plate. In these cases (Figure 2C, Figure 2B and Figure 4A), strains were grown at 26˚C, and the results were summarized in one graph.
Flow cytometry
Request a detailed protocolThe pre-culture and growth conditions were identical to those described above for the 96-well growth assays. At the indicated time points, 1–30 μL cultures were transferred from the 96-well plate to fresh medium of the same type in a new 96-well plate to obtain a concentration of 200–500 cells/μl for flow cytometry. There were at least three biological replicates for each genotype. The flow cytometry was conducted using a Guava EasyCyte Plus flow cytometer. Each experiment was independently conducted at least twice on separate days. The data were extracted from FCS 2.0 formatted files using FlowCore (Hahne et al., 2009) (RRID:SCR_002205). The fluorescence levels were normalized by forward scatter to control for cell size. For each genotype, histograms of normalized fluorescence levels of 6000 cells were smoothed by Kernel density estimation and plotted using the R statistical package.
RNA sequencing
Request a detailed protocolStrains were pre-cultured in SC plus 0.2% glucose for 2 days and inoculated into SC plus 2% galactose, 2% glucose, or 5% glycerol. Samples were harvested at the indicated time points and frozen using a dry ice/ethanol bath. Total RNA was extracted using the standard acidic phenol protocol (Hittinger and Carroll, 2007), and residual DNA was removed through DNase I treatment. Poly-A enrichment was performed with the NEBNext Poly(A) mRNA Magnetic Isolation Module (NEB #E7490, in the experiment to examine S. uvarum GAL network membership) or with the NEB Magnetic mRNA Isolation kit (NEB #S1550, in the experiment sampled during the TGA phase and at mid-log phase in galactose). Illumina libraries were constructed using the NEB Ultra Directional RNA Library Prep Kit for Illumina (NEB #E7420) and sequenced using the Illumina HiSeq 2500 platform. Reads were mapped onto the S. uvarum reference genome (CBS7001) (Scannell et al., 2011) using Bowtie version 2.2.2 with local read alignment and otherwise default settings (Langmead et al., 2009). Read counts were quantified by HTSeq version 0.6.0 (Anders et al., 2015) (RRID:SCR_005514). Differential expression was determined using EBseq version 1.1.5 with a false discovery rate (FDR) of 0.05 (Leng et al., 2013) (RRID:SCR_003526). Analysis with edgeR (RRID:SCR_012802) using the default settings was performed in parallel to examine known S. cerevisiae Gal4 targets that were not scored as differentially expressed in S. uvarum (Robinson et al., 2010). Differentially expressed genes were further analyzed by GO term analysis (Ashburner et al., 2000; Cherry et al., 2012) (Generic GO Term Mapper, RRID:SCR_005806; SGD Gene Ontology Slim Mapper, RRID:SCR_005784). The RNA-Seq data are available at NCBI's SRA under accession number SRP077015.
Reactive oxygen species (ROS) measurements
Request a detailed protocolThe pre-culture conditions were identical to those described above for the growth assays. The ROS measurement protocol was adapted from a previous study (Dudgeon et al., 2008). A 10 mM stock of H2DCFDA (2',7'-dichlorodihydrofluorescein diacetate) was freshly prepared in ethanol before each use. Cells were washed once and inoculated into the stated growth medium with 10 µM H2DCFDA. Cultures were harvested at the indicated time points. Fluorescence levels and optical densities were measured using a BMG FLUOstar Omega plate reader, which can read both fluorescence and optical density. To establish standard curves, a 2-fold serial dilution for each strain was measured. Since the standard curves suggested a linear relationship between fluorescence levels and cell number, fluorescence levels were normalized to optical densities. The S. uvarum wild-type strain was inoculated into YPD plus 10 mM H2O2 and into YPD only as positive and negative controls, respectively. Each experiment was independently conducted at least twice on separate days with at least three biological replicates in each experiment.
13C-labelled yeast metabolome extract preparation
Request a detailed protocolThe 13C yeast metabolome extract (Bennett et al., 2008) was prepared by growing Y22-3 (McIlwain et al., 2016) aerobically on YNB (-AA) + 1% 13C glucose. Yeast cultures were inoculated at an OD of 0.05 into 13C medium. Samples were harvested from each culture by centrifugation and frozen in liquid N2. Frozen pellets were first extracted with 750 µL of 40:40:20 ACN/MeOH/H2O, followed by a second extraction with 500 µL of the same extraction solvent. Extracts were pooled, centrifuged, and the supernatant was collected for later use as an internal standard for absolute metabolite quantification (Bennett et al., 2008).
Liquid chromatography-tandem mass spectrometry (LC-MS/MS) metabolomic analyses
Request a detailed protocolLyophilized cell culture metabolites were extracted from mutant and wild-type strains with 5 mL ice-cold 7:2:1 MeOH/CHCl3/H2O, and 100 µL of the extract was mixed with 10 µL 13C-labelled yeast metabolome extract. Three biological replicates were included for the S. uvarum strains (Figure 5), while two were included for the S. cerevisiae strains (Figure 5—figure supplement 1). Chromatographic separations based on a previously described method (van Dam et al., 2002; Long et al., 2012) were carried out on an Agilent 1200 series HPLC comprising a vacuum degasser, binary pump, heated column compartment, and thermostated autosampler set to maintain 6˚C. Mobile phase A (MPA) was 0.5 mM NaOH, and mobile phase B (MPB) was 100 mM NaOH. 20 μL of intracellular extract or calibrant standard mixture was separated on a Dionex IonPac AS11-HC IC column (2.0 mm x 250 mm, 9.0 µm) held at 40°C using a flow rate of 0.35 mL/min. Metabolite elution was achieved by first holding at 5% MPB for 22.5 min to separate isobaric phosphosugar species. MPB was then linearly increased from 5% to 100% over 27.5 min to elute the remaining metabolites. MPB was held at 100% for 7 min for column cleaning followed by an 8 min re-equilibration step at 5% MPB. The LC system was coupled to a Dionex ERS 500 suppressor controlled by a Dionex Reagent-Free Controller (model RFC-10) and an Agilent 6460 A Triple Quadrupole MS. The MS was operated in negative mode, acquiring MRM scans for each metabolite. Quantification based off external standard calibration curves and correction with the 13C-labelled yeast standard was performed with Agilent MassHunter Quantitative Analysis software (version B.06.00).
High performance liquid chromatography (HPLC)
Request a detailed protocolThe pre-culture conditions were identical to those described above for the growth assays. At indicated time points, 1 mL of cells were centrifuged, and 500 μL supernatant was harvested and frozen at −80˚C. HPLC was conducted at the GLBRC Metabolomics Lab using an HPLC-RID system with an Aminex HPX-87H (BioRad, Inc. Hercules, CA) following previously described protocols (Moore and Johnson, 1967; Ehrman and Himmel, 1994). Instrument control, data collection and analyses were conducted using ChemStation B.04.03 software (Agilent Technologies, Inc., Palo Alto, CA).
Statistical analysis
Request a detailed protocolAll p-values, except for the RNA-Seq, metabolomics (two-sided student’s t-test), and HPLC analyses (two-sided student’s t-test), were calculated using a conservative two-sided nonparametric test. Specifically, we used a Wilcoxon rank sum test that allows the rank data from multiple independent experiments to be pooled to account for day-to-day variation without making assumptions about the distribution of the variance. These tests were performed using Mstat software version 6.1.4 (http://mcardle.oncology.wisc.edu/mstat/).
Data availability
-
RNA-Seq of Saccharomyces uvarumPublicly available at the NCBI Short Read Archive (accession no: SRP077015).
References
-
The genome sequence of Saccharomyces eubayanus and the domestication of lager-brewing yeastsMolecular Biology and Evolution 32:2818–2831.https://doi.org/10.1093/molbev/msv168
-
Higher respiratory activity decreases mitochondrial reactive oxygen release and increases life span in Saccharomyces cerevisiaeJournal of Biological Chemistry 279:49883–49888.https://doi.org/10.1074/jbc.M408918200
-
Modeling microbial growth curves with GCATBioEnergy Research 8:1022–1030.https://doi.org/10.1007/s12155-015-9584-3
-
Saccharomyces Genome Database: the genomics resource of budding yeastNucleic Acids Research 40:D700–D705.https://doi.org/10.1093/nar/gkr1029
-
Dosage, duplication, and diploidization: clarifying the interplay of multiple models for duplicate gene evolution over timeCurrent Opinion in Plant Biology 19:91–98.https://doi.org/10.1016/j.pbi.2014.05.008
-
Increased glycolytic flux as an outcome of whole-genome duplication in yeastMolecular Systems Biology 3:129.https://doi.org/10.1038/msb4100170
-
The roles of galactitol, galactose-1-phosphate, and phosphoglucomutase in galactose-induced toxicity in Saccharomyces cerevisiaeBiotechnology and Bioengineering 101:317–326.https://doi.org/10.1002/bit.21890
-
The unfolded protein response has a protective role in yeast models of classic galactosemiaDisease Models & Mechanisms 7:55–61.https://doi.org/10.1242/dmm.012641
-
Carbon catabolite repression of invertase during batch cultivations of Saccharomyces cerevisiae: the role of glucose, fructose, and mannoseApplied Microbiology and Biotechnology 50:579–582.https://doi.org/10.1007/s002530051338
-
Self-association of the Gal4 inhibitor protein Gal80 is impaired by Gal3: evidence for a new mechanism in the GAL gene switchMolecular and Cellular Biology 33:3667–3674.https://doi.org/10.1128/MCB.00646-12
-
Simultaneous saccharification and fermentation of pretreated biomass: Improving mass balance closureBiotechnology Techniques 8:99–104.https://doi.org/10.1007/BF00152848
-
Preservation of duplicate genes by complementary, degenerative mutationsGenetics 151:1531–1545.
-
Loss of the major isoform of phosphoglucomutase results in altered calcium homeostasis in Saccharomyces cerevisiaeJournal of Biological Chemistry 275:5431–5440.https://doi.org/10.1074/jbc.275.8.5431
-
Evolution of moonlighting proteins: insight from yeastsBiochemical Society Transactions 42:1715–1719.https://doi.org/10.1042/BST20140199
-
Moonlighting proteins in yeastsMicrobiology and Molecular Biology Reviews 72:197–210.https://doi.org/10.1128/MMBR.00036-07
-
Genomics and the making of yeast biodiversityCurrent Opinion in Genetics & Development 35:100–109.https://doi.org/10.1016/j.gde.2015.10.008
-
Saccharomyces diversity and evolution: a budding model genusTrends in Genetics 29:309–317.https://doi.org/10.1016/j.tig.2013.01.002
-
The evolution of gene duplications: classifying and distinguishing between modelsNature Reviews. Genetics 11:97–108.https://doi.org/10.1038/nrg2689
-
Relaxation of yeast mitochondrial functions after whole-genome duplicationGenome Research 18:1466–1471.https://doi.org/10.1101/gr.074674.107
-
Multiple mechanisms provide rapid and stringent glucose repression of GAL gene expression in Saccharomyces cerevisiaeMolecular and Cellular Biology 14:3834–3841.https://doi.org/10.1128/mcb.14.6.3834
-
A model fungal gene regulatory mechanism: the GAL genes of Saccharomyces cerevisiaeMicrobiological Reviews 51:458–476.
-
Fructose metabolism and relation to Atherosclerosis, type 2 diabetes, and obesityJournal of Nutrition and Metabolism 2015:823081.https://doi.org/10.1155/2015/823081
-
Gal3 binds Gal80 tighter than Gal1 indicating adaptive protein changes following duplicationMolecular Biology and Evolution 33:472–477.https://doi.org/10.1093/molbev/msv240
-
Selfish operons: horizontal transfer may drive the evolution of gene clustersGenetics 143:1843–1860.
-
Expansion of hexose transporter genes was associated with the evolution of aerobic fermentation in yeastsMolecular Biology and Evolution 28:131–142.https://doi.org/10.1093/molbev/msq184
-
Cofermentation of glucose, xylose, and cellobiose by the beetle-associated yeast Spathaspora passalidarumApplied and Environmental Microbiology 78:5492–5500.https://doi.org/10.1128/AEM.00374-12
-
Fps1, a yeast member of the MIP family of channel proteins, is a facilitator for glycerol uptake and efflux and is inactive under osmotic stressThe EMBO Journal 14:1360–1371.
-
The probability of preservation of a newly arisen gene duplicateGenetics 159:1789–1804.
-
Fructose overconsumption causes dyslipidemia and ectopic lipid deposition in healthy subjects with and without a family history of type 2 diabetesAmerican Journal of Clinical Nutrition 89:1760–1765.https://doi.org/10.3945/ajcn.2008.27336
-
Glucose repression in Saccharomyces cerevisiae is related to the glucose concentration rather than the glucose fluxJournal of Biological Chemistry 273:24102–24107.https://doi.org/10.1074/jbc.273.37.24102
-
BookProcedures for the Chemical Analysis of Wood and Wood Products (as Used at the U.S. Forest Products Laboratory)Forest Products Laboratory, Forest Service, U.S. Department of Agriculture.
-
Transcription of a yeast phosphoglucomutase isozyme gene is galactose inducible and glucose repressibleMolecular and Cellular Biology 10:1415–1422.https://doi.org/10.1128/MCB.10.4.1415
-
Fructose consumption and cancer: is there a connection?Current Opinion in Endocrinology, Diabetes, and Obesity 19:367–374.https://doi.org/10.1097/MED.0b013e328357f0cb
-
Bacterial gene amplification: implications for the evolution of antibiotic resistanceNature Reviews. Microbiology 7:578–588.https://doi.org/10.1038/nrmicro2174
-
Intracellular galactose-1-phosphate accumulation leads to environmental stress response in yeast modelMolecular Genetics and Metabolism 86:360–371.https://doi.org/10.1016/j.ymgme.2005.08.002
-
Gene regulatory network growth by duplicationNature Genetics 36:492–496.https://doi.org/10.1038/ng1340
-
The danger of metabolic pathways with turbo designTrends in Biochemical Sciences 23:162–169.https://doi.org/10.1016/S0968-0004(98)01205-5
-
Evolution of SUMO function and chain formation in insectsMolecular Biology and Evolution 33:568–584.https://doi.org/10.1093/molbev/msv242
-
How do regulatory networks evolve and expand throughout evolution?Current Opinion in Biotechnology 34:180–188.https://doi.org/10.1016/j.copbio.2015.02.001
-
Birth of a metabolic gene cluster in yeast by adaptive gene relocationNature Genetics 37:777–782.https://doi.org/10.1038/ng1584
-
Evolution of biomolecular networks: lessons from metabolic and protein interactionsNature Reviews Molecular Cell Biology 10:791–803.https://doi.org/10.1038/nrm2787
Article and author information
Author details
Meihua Christina Kuang

Chris Todd Hittinger
Funding
National Institutes of Health (R35 GM118110)
- Joshua J Coon
DOE Great Lakes Bioenergy Research Center (DOE Office of Science BER DE-FC02-07ER64494)
- Chris Todd Hittinger
National Science Foundation (DEB-1253634)
- Chris Todd Hittinger
National Institute of Food and Agriculture (Hatch Project 1003258)
- Chris Todd Hittinger
Pew Charitable Trusts (Pew Scholar in the Biomedical Sciences)
- Chris Todd Hittinger
Alexander von Humboldt-Stiftung (Alfred Toepfer Faculty Fellow)
- Chris Todd Hittinger
National Science Foundation (DEB-1442148)
- Chris Todd Hittinger
The funders had no role in study design, data collection and interpretation, or the decision to submit the work for publication.
Acknowledgements
We thank Mick McGee for performing the HPLC experiments and analyzing the data; Audrey P Gasch for providing access to the Guava flow cytometer; the University of Wisconsin Biotechnology Center DNA Sequencing Facility for providing Illumina and Sanger sequencing facilities and services; Amy A Caudy, Stephen A Johnston, and James E Hopper for helpful discussions; William G Alexander for technical advice on the use of the TK-hphMX and TK-kanMX cassettes; and Emily Clare Baker and Drew T Doering for critical reading of the manuscript.
Copyright
© 2016, Kuang et al.
This article is distributed under the terms of the Creative Commons Attribution License, which permits unrestricted use and redistribution provided that the original author and source are credited.
Metrics
-
- 2,351
- views
-
- 515
- downloads
-
- 29
- citations
Views, downloads and citations are aggregated across all versions of this paper published by eLife.
Citations by DOI
-
- 29
- citations for umbrella DOI https://doi.org/10.7554/eLife.19027
Download links
A two-part list of links to download the article, or parts of the article, in various formats.
Downloads (link to download the article as PDF)
Open citations (links to open the citations from this article in various online reference manager services)
Cite this article (links to download the citations from this article in formats compatible with various reference manager tools)
Ongoing resolution of duplicate gene functions shapes the diversification of a metabolic network
eLife 5:e19027.
https://doi.org/10.7554/eLife.19027


