The structure of the COPI coat determined within the cell
- European Molecular Biology Laboratory, Germany
- MRC Laboratory of Molecular Biology, United Kingdom
- Max Planck Institute of Biochemistry, Germany
Abstract
COPI-coated vesicles mediate trafficking within the Golgi apparatus and from the Golgi to the endoplasmic reticulum. The structures of membrane protein coats, including COPI, have been extensively studied with in vitro reconstitution systems using purified components. Previously we have determined a complete structural model of the in vitro reconstituted COPI coat (Dodonova et al., 2017). Here, we applied cryo-focused ion beam milling, cryo-electron tomography and subtomogram averaging to determine the native structure of the COPI coat within vitrified Chlamydomonas reinhardtii cells. The native algal structure resembles the in vitro mammalian structure, but additionally reveals cargo bound beneath β’–COP. We find that all coat components disassemble simultaneously and relatively rapidly after budding. Structural analysis in situ, maintaining Golgi topology, shows that vesicles change their size, membrane thickness, and cargo content as they progress from cis to trans, but the structure of the coat machinery remains constant.
https://doi.org/10.7554/eLife.32493.001Introduction
Vesicular transport between cellular compartments is a fundamental mechanism of eukaryotic cells. Three conserved, archetypal protein coats, COPI, COPII and clathrin, mediate the formation and trafficking of vesicles in the endocytic-secretory pathway (Bonifacino and Glick, 2004). These coats share organizational and functional principles, and likely diverged from an ancestral coat prior to the last common eukaryotic ancestor.
The COPI coat mediates intra-Golgi and retrograde Golgi-ER trafficking (Malhotra et al., 1989; Letourneur et al., 1994), and is essential for maintaining the polarized Golgi structure (Bonifacino and Glick, 2004; Glick and Nakano, 2009; Popoff et al., 2011). COPI is recruited to the membrane as a heptameric complex, called coatomer, by interaction with the small GTPase Arf1. Analogous to the clathrin and COPII coats, COPI coatomer incorporates a coat-like and an adaptor-like subcomplex. The coat-like subcomplex of COPI consists of ε, α, and β’ subunits, the latter two of which have a ‘proto-coatomer’ architecture characterized by N-terminal β–propellers combined with extended α–solenoids. Similar architecture is also found in the clathrin heavy chain, the Sec31 COPII coat subunits, and some nuclear pore components (Lee and Goldberg, 2010; Devos et al., 2004). The COPI adaptor-like subcomplex consists of γ, ζ, β, and δ subunits and is a homolog of the AP1 and AP2 clathrin adaptor complexes (Schledzewski et al., 1999). X-ray crystallography of purified coatomer components (Watson et al., 2004; Yu et al., 2009; Lee and Goldberg, 2010; Hsia and Hoelz, 2010; Yu et al., 2012; Jackson et al., 2012; Ma and Goldberg, 2013), as well as cryo-electron tomography (cryo-ET) of COPI-coated vesicles assembled in vitro, have led to a complete molecular model of the COPI coat (Faini et al., 2012; Dodonova et al., 2015, Dodonova et al., 2017). Within the assembled coat, three copies of coatomer and six copies of Arf1 form a three-fold triad structure in which the coat-like and adaptor-like subcomplexes of coatomer form intertwined arches. Triads link together on the membrane surface to produce vesicles of variable size and shape.
Disassembly of the coat after budding is triggered by hydrolysis of Arf1-GTP, which is regulated by GTPase activating proteins (ArfGAPs) (Popoff et al., 2011). The dynamics of GTP hydrolysis and coat disassembly are poorly understood; it remains unclear whether Arf1 dissociates from the membrane before or together with coatomer, as well as whether the coat disassembles gradually or en masse.
The diversity of COPI function has led to the hypothesis that there are different types of COPI vesicles. Biochemical and microscopic studies have categorized COPI vesicles based on their donor compartment, cargo load, possible transport direction, isoform composition, and morphology (Orci et al., 1997; Lanoix et al., 2001; Malsam et al., 2005; Moelleken et al., 2007; Donohoe et al., 2007, Donohoe et al., 2013; Bouchet-Marquis et al., 2008). Based on conventional electron microscopy of the Scherfellia dubia Golgi, vesicles were grouped into COPIa, which have lightly stained luminal content and surround the cis region of the stack, and COPIb, which have strongly stained luminal content and are found near the medial Golgi. Vesicles budded from the final trans cisterna were characterized as a separate type of secretory vesicle based on their morphology (Donohoe et al., 2007, Donohoe et al., 2013). Cryo-electron microscopy of mammalian cell vitreous sections suggested that one group of COPI vesicles and buds has a ‘spiky’ coat morphology while a different group has a smoother, more homogeneous coat (Bouchet-Marquis et al., 2008). The molecular basis for the apparent heterogeneity of COPI vesicles is unknown.
We previously used cryo-electron tomography and subtomogram averaging (Wan and Briggs, 2016) to build a molecular model of the COPI coat budded in vitro from giant unilamellar vesicles using purified coat protein components (Faini et al., 2012; Dodonova et al., 2015, Dodonova et al., 2017). To investigate the structure, distribution and diversity of COPI within the cell, we combined cryo-electron tomography and subtomogram averaging with cryo-focused ion beam (cryo-FIB) milling of vitrified cells (Schaffer et al., 2017; Marko et al., 2007; Rigort et al., 2012). We imaged Golgi stacks within the native cellular environment of the genetically-tractable model organism, Chlamydomonas reinhardtii (Jinkerson and Jonikas, 2015). This unicellular green alga provides reproducible Golgi architecture (Farquhar and Palade, 1981), enabling comparative analysis across multiple cells, as well as superb cryo-EM imaging conditions that enhance the fidelity of structure determination in situ, within the cell (Pfeffer et al., 2017; Freeman Rosenzweig et al., 2017). Previously, in situ cryo-ET studies of this organism revealed the presence of ordered intracisternal arrays that may help maintain the architecture of the C. reinhardtii Golgi (Engel et al., 2015).
Results and discussion
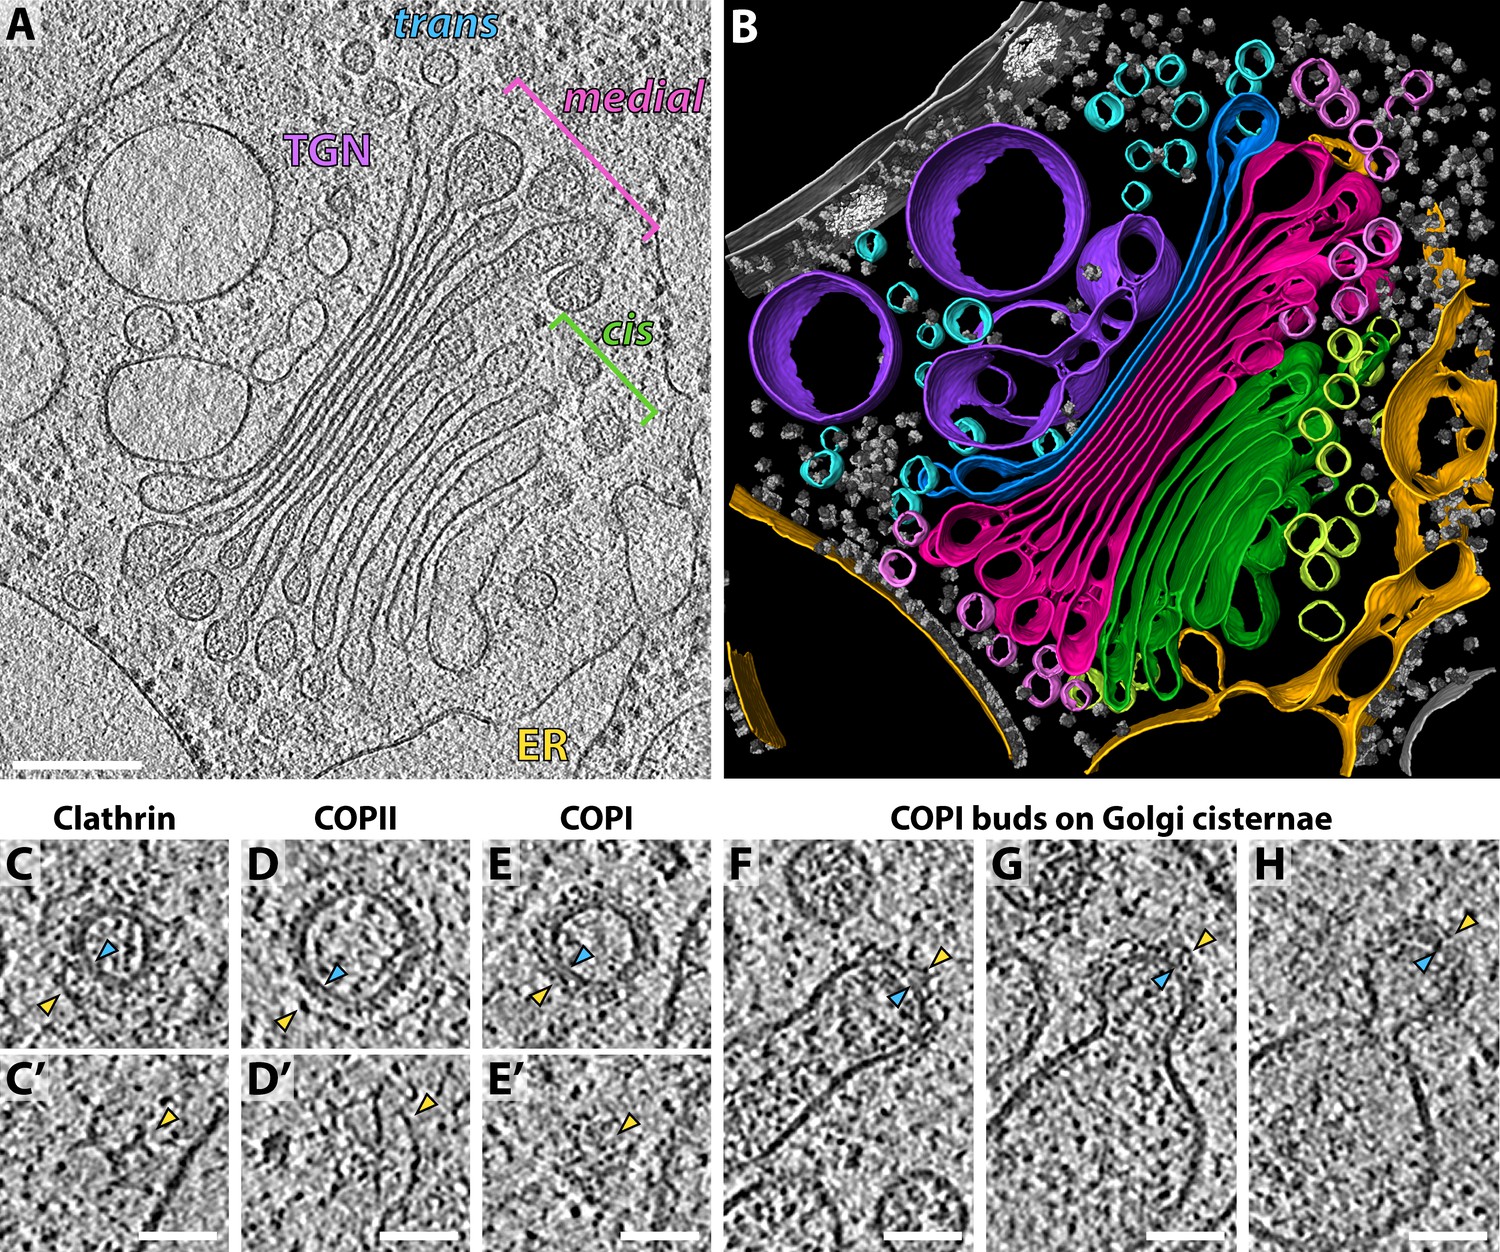
We collected a dataset of 29 cryo-electron tomograms, each containing a clearly-visible Golgi stack. Most Golgi stacks in our dataset consisted of nine cisternae that exhibited reproducible morphology (Figure 1A–B, Video 1). Luminal density progressively darkened through the cis and medial Golgi, while the cisterna centers narrowed and edges swelled. The final trans cisterna and the adjacent ballooning compartments of the trans-Golgi-network (TGN) both contained a translucent lumen (Figure 1A).
Figure 1
Molecular architecture of the Chlamydomonas Golgi apparatus and transport vesicles revealed by in situ cryo-ET.
(A) A slice through a cellular tomogram containing a representative Golgi stack and (B) corresponding 3D segmentation, showing the native morphology of the ER (yellow), four cis cisternae (green), cis vesicles (light green), four medial cisternae (magenta), medial vesicles (light pink), the trans cisterna (blue), trans vesicles (light blue) and the TGN (purple). Other membranes, the nuclear envelope, nuclear pore complexes and ribosomes are shown in grey. (C–E) Slices through (C, C’) clathrin, (D, D’) COPII and (E, E’) COPI coated transport vesicles found within the tomograms. Panels C, D and E are slices through the centers of the vesicles. Panels C’, D’ and E’ are top slices through the coats of the same vesicles, showing characteristic structures of (C’) clathrin triskelions, (D’) the triangular Sec13/31 COPII lattice, and (E’) the dense COPI coat. (F–H) Slices through three COPI buds in different stages of maturation. Yellow arrowheads: cytoplasmic boundary of the coat, blue arrowheads: vesicle or bud membrane. Scale bars: 200 nm in A-B, 50 nm in C-H.
Video 1
In situ cryo-electron tomogram of the native Chlamydomonas Golgi.
The movie slices back and forth in Z through the tomographic volume, then reveals the 3D segmentation, colored as in Figure 1B. The ER is yellow, four cis cisternae are green, cis vesicles are light green, four medial cisternae are magenta, medial vesicles are light pink, the trans cisterna is blue, trans vesicles are light blue and the TGN is purple. Other membranes, the nuclear envelope, nuclear pore complexes and ribosomes are shown in grey.
All three archetypal protein coats could be visually identified in the tomograms without any ambiguity: clathrin-coated vesicles were found in the vicinity of the TGN and were distinguished by their characteristic triskelion-based cage (Figure 1C,C’), while ER exit sites with COPII buds and vesicles were distinguished by their two-layered coat (Figure 1D,D’). Multiple COPI-coated vesicles and buds were found around the periphery of the Golgi cisternae and were discriminated from clathrin and COPII-coated membranes by the presence of a dense uniform coat (Figure 1E–H).
We extracted 267 buds and vesicles showing extensive COPI coats. We applied a reference-free subtomogram averaging workflow, as previously described (Faini et al., 2012), to determine the structure of the COPI coat ab initio, without making use of structures previously determined in vitro. We divided the buds and vesicles into two half-datasets, which were processed independently (Figure 2—figure supplement 1A). The two resulting structures were compared by Fourier shell correlation and averaged together to generate a final structure from 3579 subtomograms (10,737 asymmetric units) with a resolution of 20 Å (Figure 2—figure supplement 1B). The features of the map are consistent with the measured resolution (Figure 2A).
Figure 2 with 3 supplements see all
Determination of the native COPI coat structure and arrangement.
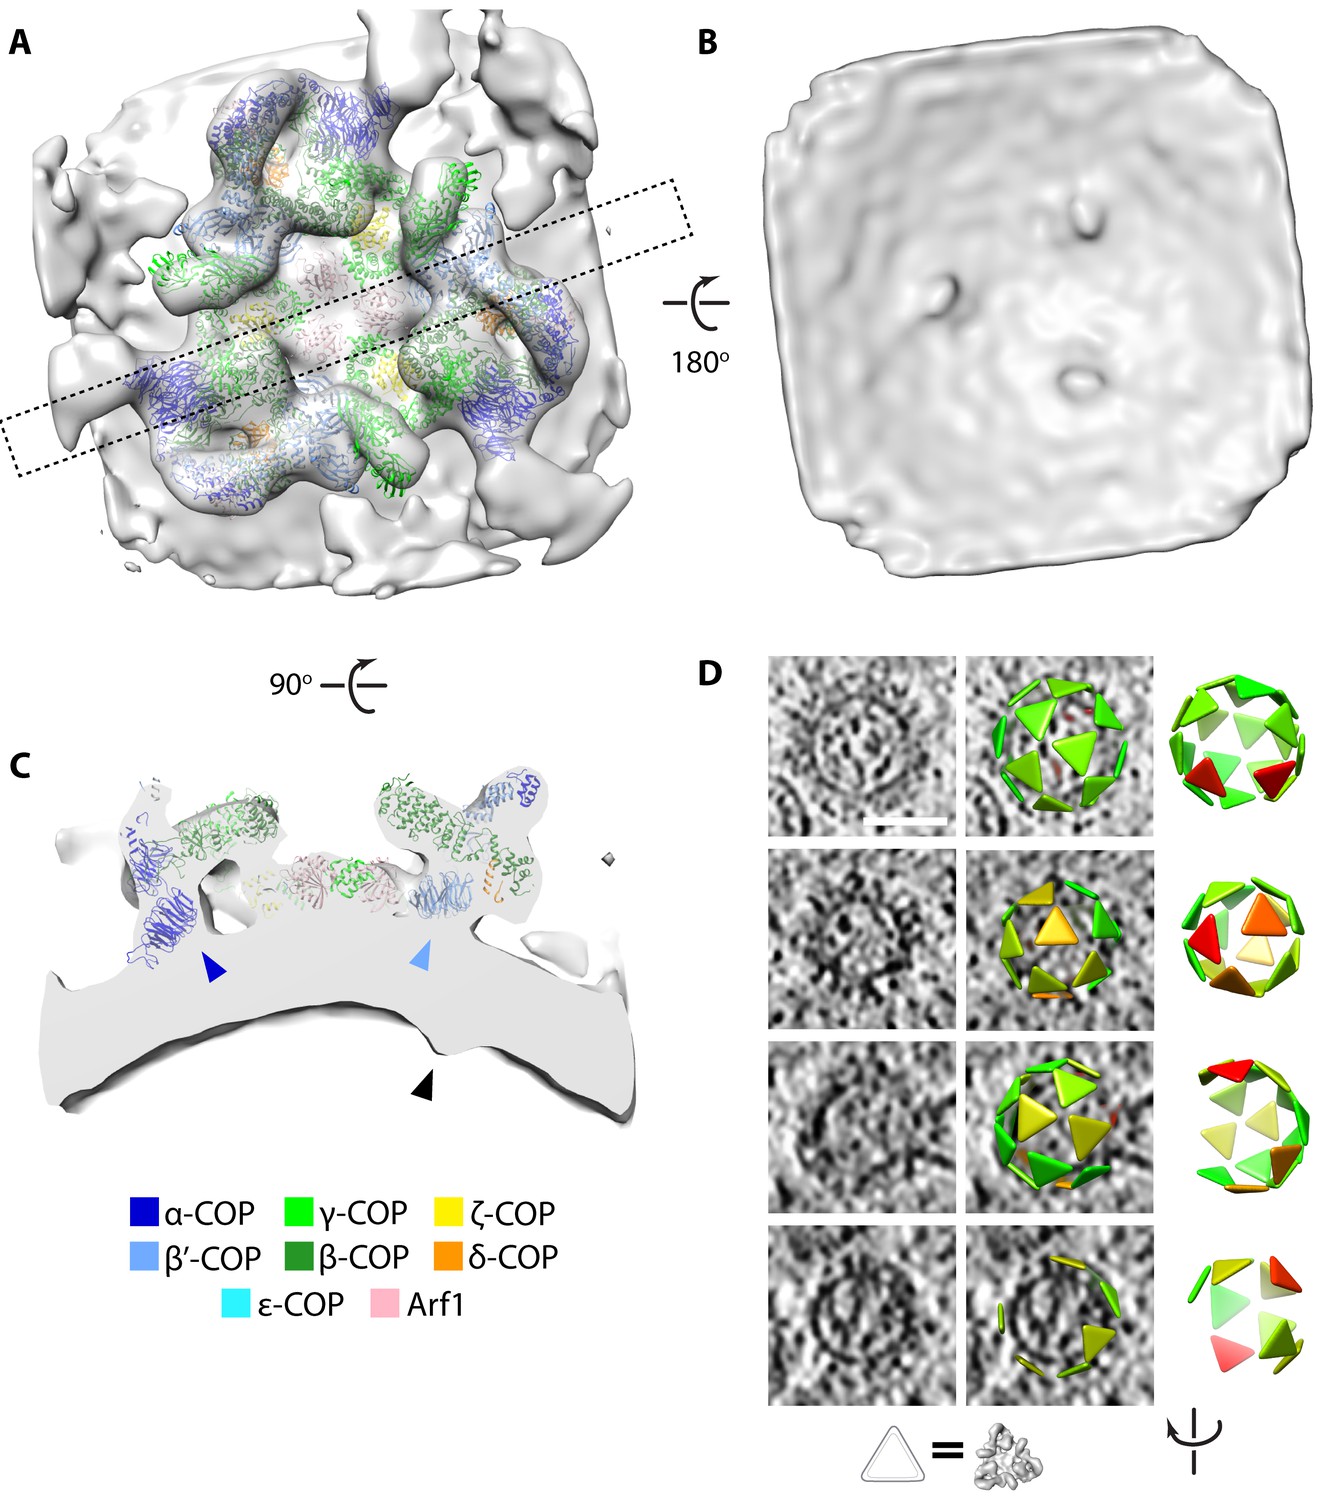
(A–C) Isosurface view of the triad density map determined within the cell. (A) View from the cytoplasmic side, dashed rectangle indicates the position of the cross-section shown in panel C. (B) View from the vesicle lumen side, displaying three cargo density protrusions. (C) Cross-section view, showing the position of the cargo density (black arrowhead) relative to the positions of the N-terminal β–propellers of α–COP (dark blue arrowhead) and β’-COP (light blue arrowhead). (D) Examples of coat arrangement on vesicles and buds. In each row, left: tomographic slice; middle: tomographic slice overlaid with triangles at the positions and orientations of each triad (correspondence between triangle and structure is illustrated below), colored by similarity to the structure in panels A-C (green to red = high to low correlation); right: view of the triad arrangement rotated to orient the budding scar towards the viewer. The vesicle in the bottom row has an incomplete coat and is likely undergoing uncoating. Scale bar: 50 nm.
The native in situ structure of COPI from C. reinhardtii is strikingly similar to structures previously determined from in vitro reconstituted COPI budding reactions using mouse proteins (Figure 2—figure supplement 2) (Faini et al., 2012; Dodonova et al., 2015, Dodonova et al., 2017). The pseudoatomic model based on the in vitro structure fits into our in situ structure as a rigid body (Figure 2A, Video 2). This shows that the architecture of the COPI coat described in vitro, in which the adaptor-like and coat-like subcomplexes do not form two layers but rather form an intertwined trimeric assembly, is the architecture present within cells, and that this architecture is highly conserved between two distantly-related species.
Video 2
Overview of the in situ COPI structure and bound cargo density.
The movie shows an isosurface view of the native COPI triad structure. The PBD model 5A1U, derived from a structure of COPI determined in vitro (Dodonova et al., 2015), is fit into the structure as a rigid body. The isosurface is initially shown from the cytoplasmic side, before it is rotated 90° and sliced perpendicular to the membrane to show cargo density residing beneath the N-terminal β-propeller of β’-COPI but not beneath the analogous domain of α-COP. The isosurface is then rotated a further 90° and viewed from the vesicle lumen side to show three symmetric cargo densities.
A closer comparison of the in vitro and in situ structures reveals that the in situ map has an additional density positioned on the luminal side of the membrane below the N-terminal β–propeller of the β’–COP subunit (Figure 2B,C; Figure 2—figure supplement 2D,E). The position of this density, on the luminal side of the membrane directly below the dilysine cargo-binding site in β’–COP, and its absence in the in vitro system where there is no cargo, suggests that it corresponds to bound cargo or cargo receptor transported by vesicles. We found no additional density below the equivalent cargo-binding site in the homologous N-terminal β–propeller of α–COP, indicating that α-COP binds fewer, smaller, or more flexible cargos than β’–COP.
There are therefore differences in cargo binding between α-COP and β’–COP. While it was previously suggested that α-COP and β’–COP have distinct selectivity towards KKXX and KXKXX ER retrieval motifs (Eugster et al., 2004; Jackson et al., 2012), more recent work suggests that cargo specificity may depend on the −2 position of the motif (Ma and Goldberg, 2013). The motif binding pockets in C. reinhardtii are conserved with respect to other eukaryotes, and C. reinhardtii contains retrieved proteins with both KKXX and KXKXX motifs. We see two possible interpretations of our observation. The first is that α-COP and β’–COP have specificities towards particular motifs, and that proteins containing these motifs differ in their abundance, size, or flexibility. The second is that the distinct positions of α-COP and β’–COP within the coat lead to differences in the amount of cargo bound: for example, this could be due to the more inclined tilt of the β’–COP β–propeller relative to the membrane, or differences in the timing, duration or strength of the interaction between the two β-propellers and the membrane during coat assembly. In both cases, the difference in cargo binding could either be specific to C. reinhardtii or a widespread property.
We visualized the coatomer organization by placing a triangle at the position and orientation of each COPI triad in the analyzed vesicles and buds (Figure 2D). Consistent with previous in vitro observations, the overall vesicle coat organization is pleomorphic and the arrangement of the triads does not conform to any type of global symmetry. Instead, both in vitro and in situ, triads contact each other in four defined patterns, called linkages (Faini et al., 2012; Dodonova et al., 2015). Within the cell, we determined the structures of the three most common linkages, which showed good overall agreement with the previously obtained in vitro structures (Figure 2—figure supplement 3). In linkage IV, interactions between triads involve ε-COP and the C-terminal domain of α–COP. Although ε-COP, like the µ-homology domain of δ-COP, is dispensable for COPI function (Arakel et al., 2016), it forms a rigid, defined interaction in the linkage, suggesting that it plays a role in coat assembly in vivo.
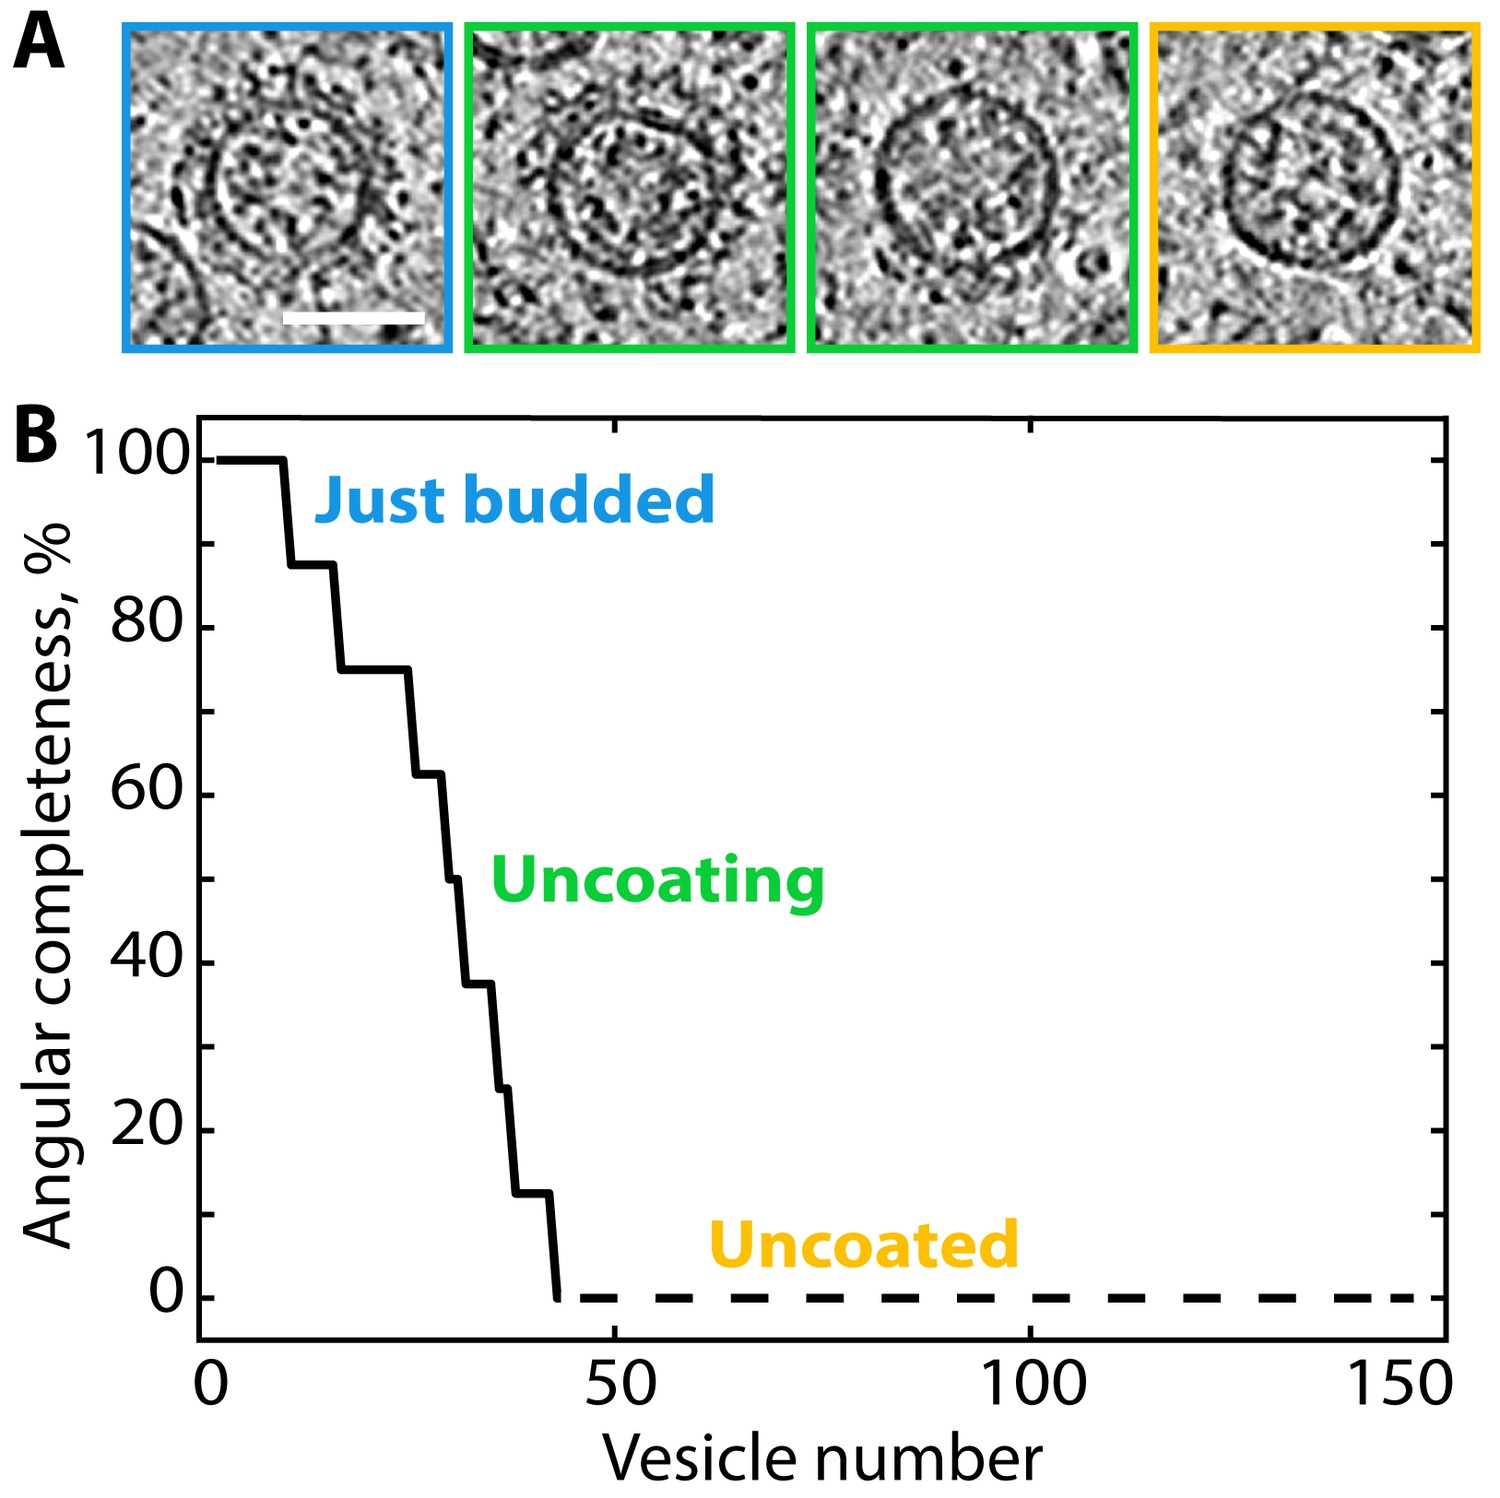
We observed vesicles with varying degrees of coat completeness, but no fully complete coats; as previously described in vitro, each vesicle contained a gap in the coat at the site of scission (the ‘budding scar’) (Figure 2D). A large population of uncoated vesicles was present in the ribosome exclusion zone immediately surrounding the Golgi. The luminal density and diameter distribution of these vesicles were the same as that of COPI-coated vesicles (Figure 3—figure supplements 1 and 2). Thus, the combination of location, size and density strongly suggests that the majority of them are uncoated COPI vesicles. We estimated coat completeness in XY slices through the centers of the vesicles in five selected Golgi tomograms (Figure 3, Figure 3—figure supplement 1). Since our data represent a random sampling of the COPI vesicle population in the proximity of the Golgi, the relative dynamics of vesicle uncoating can be inferred from the distribution of coat completeness. Coat disassembly begins after budding, and is fairly rapid but not catastrophic, since a significant number of vesicles at intermediate uncoating stages were observed. The percentage of uncoated vesicles indicates that uncoating is completed after approximately one third of the average vesicle lifetime (Figure 3). We could not determine whether individual coatomer complexes remain associated with the naked vesicles, or whether the uncoating process starts at the budding scar or at random coat positions.
Figure 3 with 3 supplements see all
Ranked plot of COPI vesicle completeness indicates a rapid and processive uncoating process.
(A) Central slices through COPI vesicles at different stages of uncoating (from left to right). (B) Vesicles were sorted according to the angular completeness of the coat, as measured from central slices (see Materials and methods). Scale bar: 50 nm.
Knowing the positions of individual COPI complexes in the cell enabled us to sort the complexes into discrete subpopulations based on their cellular location. To assess whether structural changes occur in the COPI coat during budding or initial uncoating, we calculated separate averages for buds and vesicles, for both triads and linkages. We did not detect any substantial differences in the structures (Figure 3—figure supplement 3). These observations suggest that the stoichiometry of coatomer subunits and Arf1 are the same during assembly and disassembly. This would not be the case if GTP hydrolysis led to loss of Arf1 from the coat either during or shortly after budding, as has been proposed (Yang et al., 2002; Liu et al., 2005), or if there were changes in the position or presence of any coatomer subunits during or after budding. Thus, we conclude that loss of Arf1 and coatomer disassembly occur simultaneously. The lack of any extra densities in the averages from buds and vesicles further indicates that additional factors such as ArfGAPs bind only transiently or at low stoichiometry.
COPI-coated vesicles changed their appearance during progression through the Golgi stack. We observed a gradual transition from lighter to darker vesicle luminal density through the stack that generally matched that of the donor cisternae, followed by an abrupt change to a translucent lumen in some vesicles found near the trans Golgi (Figure 1A, Figure 4A,B). Interestingly, COPI coated buds were also found on the translucent TGN compartments (Figure 4—figure supplement 1). We consider it likely that these buds mediate retrograde transport towards the trans Golgi, but cannot rule out that they yield anterograde secretory vesicles such as those previously suggested to exist in algae (Donohoe et al., 2007). While translucent buds were found on the TGN and some regions of the trans Golgi, most buds emerging from the translucent trans cisterna had darker luminal density that was similar to medial Golgi vesicles (Figure 4—figure supplement 1), indicating enrichment of cargo in the trans buds. The change in observed luminal density (which correlates directly with density observed in cryo-EM) through the Golgi stack indicates a progressive increase and then decrease in the amount of material being transported, consistent with the predominant vesicle cargo being resident Golgi proteins (Donohoe et al., 2013).
Figure 4 with 6 supplements see all
Variability of the COPI structure and membrane thickness throughout the Golgi.
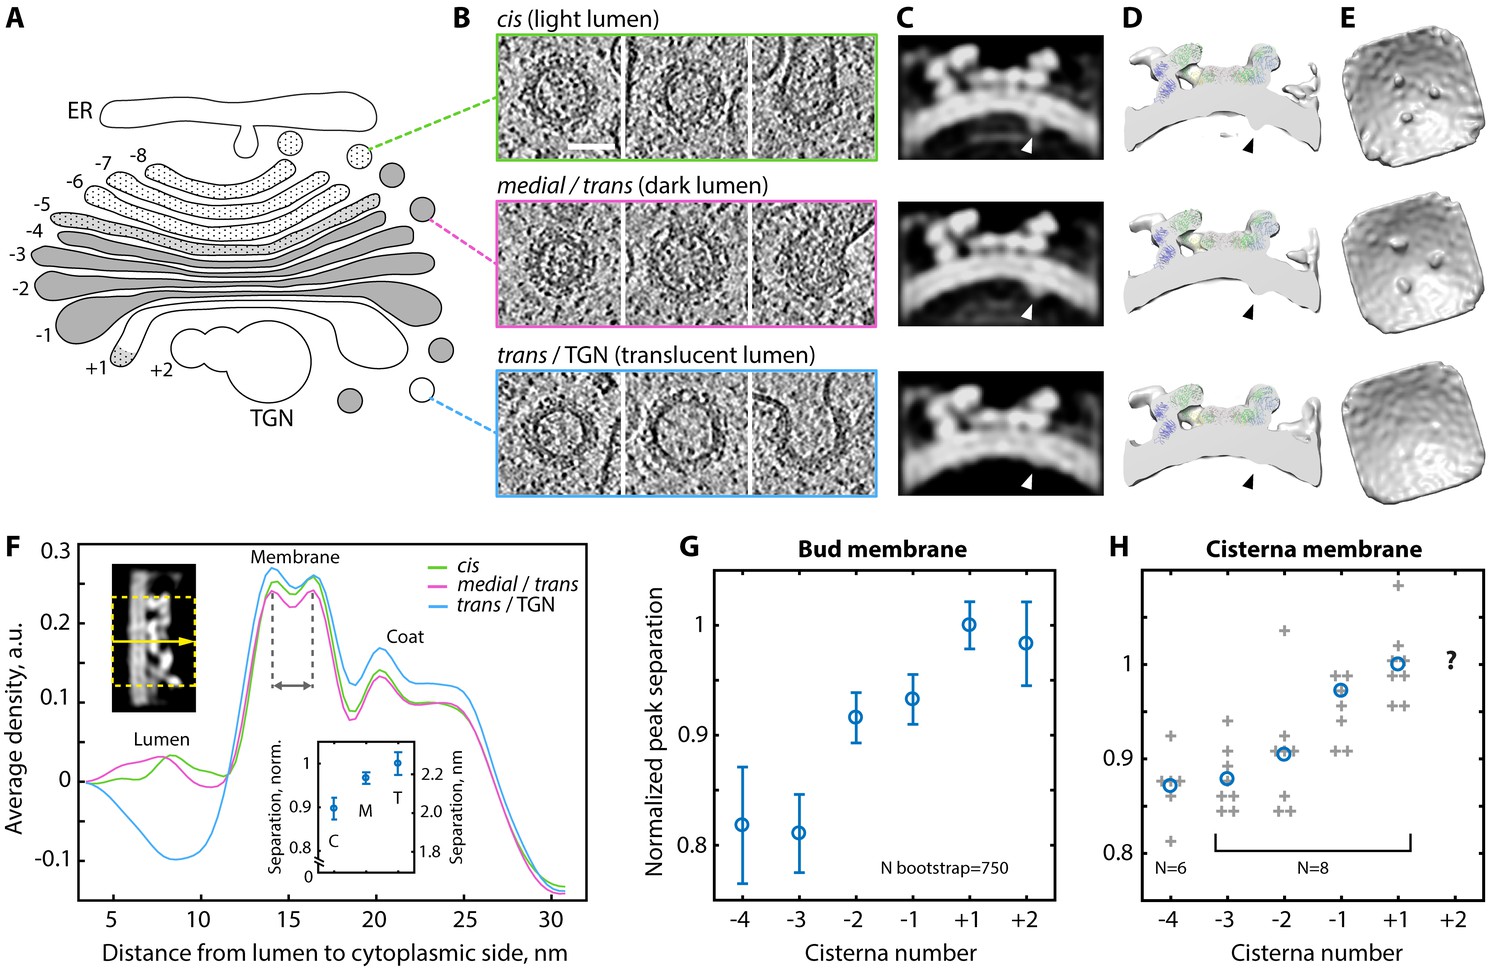
(A) Schematic of the C. reinhardtii Golgi showing cisternae with cis (−8 to −6), intermediate (−5), medial (−4 to −1), and trans morphology (+1) and the TGN (+2). Cisternae are numbered relative to the transition from dark to translucent lumen (between −1 and +1). (B) Examples of buds and vesicles from three groups defined by position and luminal density (see Materials and methods). Top row: ‘cis’, middle row: ‘medial/trans’, bottom row: ‘trans/TGN’. (C–E) ~24 Å structures of the coat determined from the three groups. (C) Orthographic slices and (D) cross-section isosurface views through the averages. Arrowheads: cargo. (E) Isosurface views from inside the vesicle. While the coatomer structure remains constant, the ‘trans/TGN’ structure lacks bound cargo. (F) Density profiles through the three COPI structures. Top left inset: example orthographic slice through a straightened structure, dashed yellow rectangle and arrow: averaged region and direction of the profile. Bottom inset: bootstrapped mean bilayer leaflet separation measured for the ‘cis’ {C}, ‘medial/trans’ {M} and ‘trans/TGN’ {T} averages, error bars: bootstrapped SD. (G–H) Membrane bilayer thickness in (G) COPI buds and (H) non-coated membrane regions from individual medial and trans Golgi cisternae. In G, mean and error bars (SD) were bootstrapped (see Materials and methods). In H, grey crosses: individual cisternae, blue circles: means, TGN measurements were not obtained. Scale bar: 50 nm.
There was a gradual increase in the diameter of buds and vesicles from the cis through the medial and trans Golgi (Figure 4—figure supplement 2). The vesicles with a translucent lumen had a more variable diameter distribution. The increasing vesicle diameter may result from the swelling of the medial and trans cisterna edges, causing the curvature of the donor membrane to decrease. Similarly, the variable donor membrane curvature in the TGN likely yields a variety of translucent vesicle sizes.
We separated vesicles and buds into three groups (‘cis’, ‘medial/trans’, and ‘trans/TGN’; Figure 4A,B) based on their position and luminal density (see Materials and methods). We averaged the subtomograms in each group to obtain structures of the COPI coat from three different Golgi regions (Figure 4C–E, Figure 4—figure supplement 3). The coat structure is highly similar between the three regions except for the luminal cargo/cargo-receptor density, which is less prominent in the average obtained from the translucent buds and vesicles of the trans Golgi and TGN. This suggests that vesicles in this region bind less, or less bulky, cargo in the vicinity of the β-propellers of β’-COP, which contain a dilysine cargo-binding site.
In the structures from each region, two peaks of bilayer density were resolved beneath the COPI coat (Figure 4C). Measurement of the distance between the peaks revealed a gradual increase in membrane thickness from cis to trans Golgi vesicles and buds (Figure 4F,G; Figure 4—figure supplement 4) (we note that absolute bilayer thickness cannot be measured from this data, see Materials and methods). We also measured a general increase in bilayer thickness in non-coated membranes of the medial and trans Golgi cisternae (Figure 4H, Figure 4—figure supplements 5 and 6). These observations are in good agreement with the hypothesis that changes in lipid composition create a gradient of membrane thickness that increases from the ER towards the plasma membrane, which has been suggested to play a role in transmembrane protein sorting along the secretory pathway (Mitra et al., 2004; Sharpe et al., 2010).
We observed that the morphology of COPI vesicles, including the luminal density, membrane thickness and vesicle size, change through the Golgi stack in a manner that reflects corresponding changes in the morphology of the donor cisterna. While vesicle morphology is inherited from the donor membrane, the composition of the vesicle differs from that of the donor cisterna. The specifically bound cargo under the β’–COP beta propellers, as well as the dark luminal density of buds on the translucent trans cisterna, both confirm that proteins are selectively incorporated. In contrast to the observed morphological changes through the stack, we found no indication of structurally distinct COPI vesicle subclasses; the structure of the sorting machinery is the same in all buds and vesicles.
This study shows that it is possible to determine the native structure of the COPI coat, without making use of previous structural information, directly within the cell, avoiding the artifacts associated with sample preparation for more traditional structural biology techniques. The tomograms represent snapshots of the dynamic cellular environment in its native state, and information from this cellular context gives additional insights into COPI function. We believe that the ability to determine structure directly within the cellular environment can transform cell and structural biology.
Materials and methods
Key resources table
| Reagent type (species) or resource | Designation | Source or reference | Identifiers | Additional information |
|---|---|---|---|---|
| strain, strain background (Chlamydomonas reinhardtii) | mat3-4 mt+ | PMID: 11445540, DOI: 10.1101/gad.892101 | CC-3994, Chlamydomonas Resource Center | small cells improve vitrification |
| software, algorithm | SerialEM | PMID: 16182563, DOI: 10.1016/j.jsb.2005.07.007 | cryo-ET tilt-series acquisition | |
| software, algorithm | MotionCor2 | PMID: 28250466, DOI: 10.1038/nmeth.4193 | frame alignment | |
| software, algorithm | IMOD | PMID: 8742726, DOI: 10.1006/jsbi.1996.0013 | tomogram alignment, reconstruction | |
| software, algorithm | Amira | FEI/Thermo Fisher Sceintific | 3D segmentation of tomogram volumes | |
| software, algorithm | Matlab | Mathworks | subtomogram averaging, data analysis | |
| software, algorithm | TOM package for Matlab | PMID: 15721576, DOI:10.1016/j.jsb.2004.10.006 | subtomogram averaging | |
| software, algorithm | Av3 package for Matlab | PMID: 15774580, DOI: 10.1073/pnas.0409178102 | subtomogram averaging | |
| software, algorithm | RELION with helical processing | PMID: 28193500, DOI: 10.1101/095034 | averaging of 2D membrane profiles | |
| software, algorithm | USCF Chimera | PMID: 15264254, DOI: 10.1002/jcc.20084 | visualization |
Cell culture and sample preparation
Request a detailed protocolCell culture and sample preparation were performed as previously described (Engel et al., 2015). Chlamydomonas reinhardtii strain mat3-4 (Umen and Goodenough, 2001), characterized by a smaller cell size that aids vitrification, was acquired from the Chlamydomonas Resource Center (University of Minnesota) and grown with constant light (~90 μmol photons m−2 s−1) and normal atmosphere aeration in Tris-acetate-phosphate (TAP) medium. Plunge-freezing and cryo-focused ion beam milling were performed as previously described (Schaffer et al., 2017). Cells were blotted onto carbon-coated 200-mesh copper grids (Quantifoil Micro Tools), which were plunged into a liquid ethane-propane mixture using a Vitrobot Mark 4 (FEI). Frozen grids were mounted into modified Autogrids (FEI) and loaded into either a Scios (FEI) or a Quanta 3D FEG (FEI) FIB/SEM microscope. Samples were coated with thin layer of organometallic platinum using the in situ gas injection system (GIS, FEI). Thin lamellae containing the cellular interior were milled using the Ga+ beam at 30 kV and a shallow angle of 8°−12°.
Cryo-electron tomography
Request a detailed protocolTomograms were collected with SerialEM software (Mastronarde, 2005) on a 300 kV Titan Krios (FEI) equipped with a postcolumn energy filter (968 Quantum, Gatan) and a K2 Summit direct electron detector (Gatan) operated in movie mode at 12 frames per second. Tilt series were acquired over an angular range of approximately −60° to +60°, using a bi-directional tilt scheme with a 2° increment. Cumulative electron dose was kept under ~100 e-/Å2, the object pixel size was 3.42 Å, and defocus ranged from −4 to −6 um. Each tomogram was acquired from a separate cell, and thus each is a biological replicate. Around five different cell cultures were used in total. During 16 microscopy sessions, a total of 60 tomograms were acquired that contained Golgi or coated vesicle structures. These tomograms were then sorted by image quality and tilt-series alignment precision, yielding 29 tomograms that were used for analysis, including nine described in a previously published study of Golgi intracisternal arrays (Engel et al., 2015).
Subtomogram averaging
Request a detailed protocolK2 image frames were aligned with MotionCor2 (Zheng et al., 2017) to correct for beam-induced motion. Cumulative electron dose-dependent low-pass filters were calculated as previously determined, assuming a uniformly distributed total dose of 60 e-/Å2 (Grant and Grigorieff, 2015), and were applied to the tilt series before processing. Contrast transfer-function (CTF) correction of individual tilt images was performed using ctfphaseflip implemented in IMOD (Xiong et al., 2009). Tilt series were aligned in IMOD using patch-tracking and reconstructed using weighted backprojection (Kremer et al., 1996).
Tomograms were visualized in Amira software (FEI). We localized 267 COPI vesicles and buds, measured their membrane-to-membrane diameters and determined their central coordinates. Within cells, the mean (±SD) diameter of late buds and vesicles was 56 ± 6 nm (Figure 3—figure supplement 2), approximately 10 nm wider than that of vesicles budded in vitro. Subtomogram alignment and averaging was performed using Matlab (Mathworks) scripts derived from the TOM (Nickell et al., 2005) and Av3 (Förster et al., 2005) toolboxes, essentially as described (Dodonova et al., 2015). The diameters and coordinates of buds and vesicles were used to define the starting positions and orientations of subtomograms. The positions were placed as evenly distributed points (spacing 10 nm) on the surface of a sphere defined by the vesicle center and diameter. Initial psi and theta angles, which define out-of-plane rotation, were assigned as the normal to the sphere surface. Phi angles defining in-plane rotation were assigned randomly.
To generate the initial reference, we selected 64 vesicles and late buds that were completely embedded within the lamellae, had diameters that were close to average and had extensive coats as judged by visual inspection. This set was split into two independent halves, which were processed separately. Subtomograms were extracted from twice-binned volumes with a pixel size of 13.68 Å. Initial smooth reference averages for the first round of alignment were generated based on the assigned Euler angles, and subtomograms were aligned iteratively using the result of the previous round as a reference. After convergence, both independent averages contained an identical three-fold symmetrical feature in different positions. This feature was brought to the center of both references and additional alignments were performed with three-fold symmetry applied (Figure 2—figure supplement 2A). After centering the structures and applying threefold symmetry, the two references looked the same and were similar to the structure of the COPI coat obtained in vitro (Figure 2—figure supplement 2A). The two structures were then rotated to the same orientation and used as starting references for alignment of the full dataset.
The remaining vesicles and buds were divided between the two half-datasets. Subtomograms were extracted as described above and aligned to the starting references. After alignment, we removed subtomograms with low cross-correlation coefficients to the reference. Overlapping subtomograms were removed based on the distance threshold of 17.7 nm (13 pixels). The final datasets had 1713 and 1866 subtomograms (5139 and 5598 asymmetric units). The structures were further refined by processing subtomograms extracted from once-binned (pixel size 6.84 Å) and unbinned (pixel size 3.42 Å) volumes. Prior to the resolution measurement, each reference was masked with a soft-edged cylindrical mask that excluded the membrane. Resolution was measured using mask-corrected phase-randomized Fourier shell correlation (FSC) (Figure 2—figure supplement 1B) (Chen et al., 2013). The final density map was obtained by averaging the structures from the two half-datasets together. The final structure was low-pass filtered to the determined resolution, reweighted by dividing by the sum of its CTFs, and sharpened with a B-factor of −2000 (Rosenthal and Henderson, 2003). Map visualization and fitting of PDB structures were performed using Chimera software (Pettersen et al., 2004). The in vitro pseudoatomic model 5A1U was fit into our in situ structure as rigid body.
Lattice map and linkage structure analysis
Request a detailed protocolTriad positions and orientations were visualized using a custom chimera plugin. No completely coated vesicles were found. Some of the vesicles were not completely contained within the FIB lamella and, in other cases, some triads may not have been successfully identified during the alignment procedure. For the remaining COPI-coated cellular vesicles, we could determine that the coat is incomplete, either because areas of uncoated membrane are clearly visible in the tomogram, or because the arrangement of triads would not allow the vesicle to be closed by the addition of more triads (Figure 2D). The absence of any complete vesicle coats could reflect rapid partial uncoating after budding, or result from a budding scar, where the coat is never completed at the bud neck. The absence of complete vesicles in in vitro reconstitution reactions (Faini et al., 2012), which are performed in the presence of non-hydrolysable GTP analogues, suggests that the gap in the coat represents a budding scar.
Linkage position identification and structure determination were performed as previously described (Faini et al., 2012). Briefly, triad positions were visualized and example sets of triads representing each linkage were manually picked. These sets were used to calculate the relative rotations and translations between the triads in each linkage and search the dataset for positions matching these patterns. This automated search identified 946 occurrences of linkage I, 1013 occurrences of linkage II, and 271 occurrences of linkage IV. Linkage III has an inherent high curvature and was observed in vitro to be present mainly on small vesicles (Faini et al., 2012). Because the average diameter of cellular vesicles is larger than that of in vitro vesicles, this arrangement of triads was only found on a few small vesicles within the cell (Figure 2—figure supplement 3).
To determine the structures of linkages I, II and IV, subtomograms were extracted from once-binned volumes (pixel size 6.84 Å) at the identified positions and divided into two half-sets. Euler angles were assigned to each pattern. We randomized the third Euler angle and ran an in-plane iterative rotational alignment on the first half-dataset, regenerating the linkage structure. This reference was low-pass filtered to 55 Å and used as a starting reference to align the second half-dataset.
Resolution was measured as described above and was determined to be 32–33 Å for all linkages. PDB pseudoatomic models 5NZT, 5NZU, and 5NZV from the in vitro study were used for fitting. We previously found that linkage I appears approximately three-fold symmetric at low resolution (Faini et al., 2012), but is asymmetric at higher resolution (Dodonova et al., 2015). For the in situ linkage I average, we were unable to resolve the asymmetry, and the structure was similar to that previously determined at low resolution. The structure of linkage II was also similar to that observed at low resolution. The density from the µ-homology domains of δ-COP located at the center of the pattern were not well resolved, suggesting that these domains are flexible in their position.
Measurement of vesicle coat completeness
Request a detailed protocolTo measure the distribution of vesicle coat completeness, we identified 42 coated vesicles and 103 uncoated vesicles in five selected Golgi stacks (Figure 3—figure supplement 1). 13 tomographic slices around the vesicle center were averaged, and the resulting image was overlaid with a mask dividing it into eight sectors. The number of sectors containing coated membrane was recorded for each vesicle and used to calculate the angular completeness (Figure 3). While there are no complete vesicles in the dataset, mostly-complete vesicles may appear to be complete in a central slice. Thus, the measurements can systematically overestimate the completeness of mostly-complete vesicles, and underestimate the completeness of mostly-incomplete vesicles. The ratio of vesicles with coat to uncoated vesicles was ~1:2. We estimated the lifetime of coated vesicles as 1/3 of the total vesicle lifetime.
Morphological annotation and structure variation analysis
Request a detailed protocolThe dataset of 267 vesicles and buds was visually annotated. Each vesicle or bud was assessed for budding stage (early bud, late bud with neck, vesicle), luminal density and position within the Golgi stack. Cisternal morphology was defined according to the scheme shown in Figure 4A. Only vesicles and buds whose positions could be confidently defined were used for generating separate averages from the cis, medial/trans and trans/TGN regions.
For structural analysis across the Golgi stack, we aimed to separate vesicles and buds into three groups that had maximal morphological and positional variation. For the ‘cis’ average, we included all buds on the cisternae with cis morphology and position (usually the first four cisternae from cis side, which had uniform thickness and light luminal density) and all vesicles residing near the first two cisternae of the Golgi stack and between the Golgi and ER. Some of these vesicles were found in close proximity to the ER membrane. For the ‘medial/trans’ average, we took all buds from cisternae with medial morphology (narrow region at the cisterna center, swollen periphery, dense lumen) and all vesicles not assigned to the ‘cis’ and ‘trans/TGN’ classes. Most of the buds on the last trans cisterna were included in the ‘medial/trans’ average due to their dark luminal density (Figure 4—figure supplement 1). For the ‘trans/TGN’ average, we took vesicles and buds with a characteristic translucent lumen. These selected buds mostly emanated from TGN compartments. ‘Trans/TGN’ vesicles resided near the trans Golgi and TGN, and were easily distinguished from ‘medial/trans’ vesicles by lumen density. There was no difference in the distribution of cross-correlation values between each group of subtomograms and the average structure (Figure 4—figure supplement 3), suggesting that there are no large changes in the coat organization through the Golgi.
To measure membrane thickness in buds from individual cisternae, we defined the cisterna number relative to the first compartment with a translucent lumen, as diagrammed in Figure 4A. This compartment, which normally corresponded to the trans cisterna but occasionally the TGN (Figure 4—figure supplement 5), was numbered +1. Preceding cisterna were labeled according to their position as −1, –2, −3, –4, −5. Translucent compartments that followed +1, corresponding to swollen and heterogeneously shaped TGN, were labeled +2.
Measurement of membrane thickness in vesicles and buds
Request a detailed protocolComparison of orthographic slices through the cis, medial/trans and trans/TGN structures suggested that there are differences in membrane bilayer thickness and curvature through the Golgi. We analyzed the membrane thickness change in more detail by generating a density profile through ‘straightened’ references. The membrane thickness was measured from straightened subtomogram averages of the vesicle/bud groups defined above: cis, medial/trans and trans/TGN (Figure 4F), as well as averages of buds from individual cisternae of the medial and trans Golgi (Figure 4G, Figure 4—figure supplement 4). The averages were low-pass filtered to 25 Å and sharpened with a B-factor of −2000. Volumes were straightened using radial orthographic projection as previously described (de Marco et al., 2010), and the average density profile was determined along the perpendicular vector to the straightened reference’s membrane (Figure 4F, top left inset). The distance between the two peaks of the membrane bilayer was measured. For each subset, we then applied a bootstrap approach in which we repeated the procedure described above (from averaging to measurement) 750 times on sets of subtomograms equal in size to the original subset but randomly sampled from it with replacements. From these 750 profiles, we determined the mean and standard deviation of the membrane thickness. Data analysis was performed in Matlab (Mathworks).
Measurement of membrane thickness in Golgi cisternae
Request a detailed protocolTo measure the membrane thickness in stacked, non-coated Golgi cisternae, we selected eight Golgi stacks in which the bilayers could be clearly observed and the cisternae were perpendicular to the imaging plane throughout the tomographic volume (Figure 4—figure supplement 5A). We extracted XY slices from the tomogram, then extracted 20 × 20 boxes along a bilayer, which were aligned and averaged using elements of the RELION helical reconstruction workflow (He and Scheres, 2017) to obtain a well-resolved 2D bilayer average (Figure 4—figure supplement 5B) for each cisterna. The number of particles for each average ranged from 100 to 300. The membrane density profile along the perpendicular vector to the bilayer was extracted using Fiji (Schindelin et al., 2012) and the peak-peak distance was measured (Figure 4—figure supplement 6).
The membrane profile is modulated by a number of effects that are difficult to assess including the contrast transfer function of the microscope, the charge gradient across the bilayer, the presence or absence of associated proteins and the exact orientation of bilayer relative to the beam (in case of 2D average). For this reason, while measurements can be compared within one experiment, it is important to note that the peak-peak distance does not correspond to the absolute bilayer thickness and cannot be compared to measurements performed in different ways such as those from the subtomogram averages.
Data availability
-
The in situ structure of the Chlamydomonas COPI coat: average from vesiclesPublicly available at the EBI European Nucleotide Archive (accession no: EMD-3970).
-
The in situ structure of the Chlamydomonas COPI coat: average from the cis-Golgi regionPublicly available at the EBI European Nucleotide Archive (accession no: EMD-3971).
-
The in situ structure of the Chlamydomonas COPI coat: average from the medial/trans-Golgi regionPublicly available at the EBI European Nucleotide Archive (accession no: EMD-3972).
-
The in situ structure of the Chlamydomonas COPI coat: average from the trans-Golgi/TGN regionPublicly available at the EBI European Nucleotide Archive (accession no: EMD-3973).
-
The in situ structure of the Chlamydomonas COPI coat: average of all dataPublicly available at the EBI European Nucleotide Archive (accession no: EMD-3968).
-
The in situ structure of the Chlamydomonas COPI coat: average from budsPublicly available at the EBI European Nucleotide Archive (accession no: EMD-3969).
-
The in situ structure of the Chlamydomonas COPI coat linkage IPublicly available at the EBI European Nucleotide Archive (accession no: EMD-3974).
-
The in situ structure of the Chlamydomonas COPI coat linkage IIPublicly available at the EBI European Nucleotide Archive (accession no: EMD-3975).
-
The in situ structure of the Chlamydomonas COPI coat linkage IVPublicly available at the EBI European Nucleotide Archive (accession no: EMD-3976).
-
Cryo-electron tomogram of the Chlamydomonas reinhardtii Golgi apparatusPublicly available at the EBI European Nucleotide Archive (accession no: EMD-3977).
-
The structure of the COPI coat leafPublicly available at the EBI European Nucleotide Archive (accession no: EMD-3720).
-
The structure of the COPI coat linkage IPublicly available at the EBI European Nucleotide Archive (accession no: EMD-3722).
-
The structure of the COPI coat linkage IIPublicly available at the EBI European Nucleotide Archive (accession no: EMD-3723).
-
The structure of the COPI coat linkage IVPublicly available at the EBI European Nucleotide Archive (accession no: EMD-3724).
-
The structure of the COPI coat leafPublicly available at the EBI European Nucleotide Archive (accession no: 5NZR).
-
The structure of the COPI coat linkage IPublicly available at the EBI European Nucleotide Archive (accession no: 5NZT).
-
The structure of the COPI coat linkage IIPublicly available at the EBI European Nucleotide Archive (accession no: 5NZU).
-
The structure of the COPI coat linkage IVPublicly available at the EBI European Nucleotide Archive (accession no: 5NZV).
-
The structure of the COPI coat triadPublicly available at the EBI European Nucleotide Archive (accession no: EMD-2985).
-
The structure of the COPI coat triadPublicly available at the EBI European Nucleotide Archive (accession no: 5A1U).
-
Structures from COPI-coated vesicles: triadPublicly available at the EBI European Nucleotide Archive (accession no: EMD-2084).
References
-
Golgi apparatus studied in vitreous sectionsJournal of Microscopy 230:308–316.https://doi.org/10.1111/j.1365-2818.2008.01988.x
-
The alpha- and beta'-COP WD40 domains mediate cargo-selective interactions with distinct di-lysine motifsMolecular Biology of the Cell 15:1011–1023.https://doi.org/10.1091/mbc.E03-10-0724
-
The Golgi apparatus (complex)-(1954-1981)-from artifact to center stageThe Journal of Cell Biology 91:77s–103.https://doi.org/10.1083/jcb.91.3.77s
-
Membrane traffic within the Golgi apparatusAnnual Review of Cell and Developmental Biology 25:113–132.https://doi.org/10.1146/annurev.cellbio.24.110707.175421
-
Helical reconstruction in RELIONJournal of Structural Biology 198:163–176.https://doi.org/10.1016/j.jsb.2017.02.003
-
Molecular basis for recognition of dilysine trafficking motifs by COPIDevelopmental Cell 23:1255–1262.https://doi.org/10.1016/j.devcel.2012.10.017
-
Molecular techniques to interrogate and edit the Chlamydomonas nuclear genomeThe Plant Journal 82:393–412.https://doi.org/10.1111/tpj.12801
-
Computer visualization of three-dimensional image data using IMODJournal of Structural Biology 116:71–76.https://doi.org/10.1006/jsbi.1996.0013
-
Sorting of Golgi resident proteins into different subpopulations of COPI vesicles: a role for ArfGAP1The Journal of Cell Biology 155:1199–1212.https://doi.org/10.1083/jcb.200108017
-
ArfGAP1 dynamics and its role in COPI coat assembly on Golgi membranes of living cellsThe Journal of Cell Biology 168:1053–1063.https://doi.org/10.1083/jcb.200410142
-
Rules for the recognition of dilysine retrieval motifs by coatomerThe EMBO Journal 32:926–937.https://doi.org/10.1038/emboj.2013.41
-
Automated electron microscope tomography using robust prediction of specimen movementsJournal of Structural Biology 152:36–51.https://doi.org/10.1016/j.jsb.2005.07.007
-
TOM software toolbox: acquisition and analysis for electron tomographyJournal of Structural Biology 149:227–234.https://doi.org/10.1016/j.jsb.2004.10.006
-
UCSF Chimera--a visualization system for exploratory research and analysisJournal of Computational Chemistry 25:1605–1612.https://doi.org/10.1002/jcc.20084
-
COPI budding within the Golgi stackCold Spring Harbor Perspectives in Biology 3:a005231.https://doi.org/10.1101/cshperspect.a005231
-
Optimized cryo-focused ion beam sample preparation aimed at in situ structural studies of membrane proteinsJournal of Structural Biology 197:73–82.https://doi.org/10.1016/j.jsb.2016.07.010
-
Fiji: an open-source platform for biological-image analysisNature Methods 9:676–682.https://doi.org/10.1038/nmeth.2019
-
Control of cell division by a retinoblastoma protein homolog in ChlamydomonasGenes & Development 15:1652–1661.https://doi.org/10.1101/gad.892101
-
Cryo-electron tomography and subtomogram averagingMethods in Enzymology 579:329–367.https://doi.org/10.1016/bs.mie.2016.04.014
-
CTF determination and correction for low dose tomographic tilt seriesJournal of Structural Biology 168:378–387.https://doi.org/10.1016/j.jsb.2009.08.016
-
ARFGAP1 promotes the formation of COPI vesicles, suggesting function as a component of the coatThe Journal of Cell Biology 159:69–78.https://doi.org/10.1083/jcb.200206015
Article and author information
Author details
Svetlana O Dodonova

Funding
Deutsche Forschungsgemeinschaft (SFB-1035/Project A01)
- Wolfgang Baumeister
Deutsche Forschungsgemeinschaft (SFB1129 (Z2))
- John AG Briggs
Medical Research Council (MC_UP_1201/16)
- John AG Briggs
The funders had no role in study design, data collection and interpretation, or the decision to submit the work for publication.
Acknowledgements
EM maps are deposited in the Electron Microscopy Data Bank (accession codes EMD-3968, EMD-3969, EMD-3970, EMD-3971, EMD-3972, EMD-3973, EMD-3974, EMD-3975, EMD-3976, EMD-3977). We thank K Qu for providing the Chimera plugin, S Munro and F Wieland for comments on the manuscript and W Wan for discussions. Our work was technically supported by EMBL IT services. JAGB and colleagues were funded by the European Molecular Biology Laboratory, the Chica and Heinz Schaller Stiftung, and grants from the Deutsche Forschungsgemeinschaft within SFB1129 (Z2). WB and colleagues were funded by the Max Planck Society and the Deutsche Forschungsgemeinschaft Excellence Cluster Center for Integrated Protein Science Munich (CIPSM) and SFB-1035/Project A01.
Copyright
© 2017, Bykov et al.
This article is distributed under the terms of the Creative Commons Attribution License, which permits unrestricted use and redistribution provided that the original author and source are credited.
Metrics
-
- 26,082
- views
-
- 2,436
- downloads
-
- 187
- citations
Views, downloads and citations are aggregated across all versions of this paper published by eLife.
Citations by DOI
-
- 187
- citations for umbrella DOI https://doi.org/10.7554/eLife.32493
Download links
A two-part list of links to download the article, or parts of the article, in various formats.
Downloads (link to download the article as PDF)
Open citations (links to open the citations from this article in various online reference manager services)
Cite this article (links to download the citations from this article in formats compatible with various reference manager tools)
The structure of the COPI coat determined within the cell
eLife 6:e32493.
https://doi.org/10.7554/eLife.32493
Further reading
-
- Structural Biology and Molecular Biophysics
- Cell Biology
Advances in imaging techniques have shed new light on the structure of vesicles formed by COPI protein complexes.


