The long non-coding RNA Cerox1 is a post transcriptional regulator of mitochondrial complex I catalytic activity
- University of Edinburgh, Western General Hospital, United Kingdom
- University of Oxford, United Kingdom
- University of Edinburgh, United Kingdom
Abstract
To generate energy efficiently, the cell is uniquely challenged to co-ordinate the abundance of electron transport chain protein subunits expressed from both nuclear and mitochondrial genomes. How an effective stoichiometry of this many constituent subunits is co-ordinated post-transcriptionally remains poorly understood. Here we show that Cerox1, an unusually abundant cytoplasmic long noncoding RNA (lncRNA), modulates the levels of mitochondrial complex I subunit transcripts in a manner that requires binding to microRNA-488-3p. Increased abundance of Cerox1 cooperatively elevates complex I subunit protein abundance and enzymatic activity, decreases reactive oxygen species production, and protects against the complex I inhibitor rotenone. Cerox1 function is conserved across placental mammals: human and mouse orthologues effectively modulate complex I enzymatic activity in mouse and human cells, respectively. Cerox1 is the first lncRNA demonstrated, to our knowledge, to regulate mitochondrial oxidative phosphorylation and, with miR-488-3p, represent novel targets for the modulation of complex I activity.
https://doi.org/10.7554/eLife.45051.001eLife digest
Animal cells generate over 90% of the energy they need within small structures called mitochondria. Converting food into energy requires many different proteins and cells control the relative amounts of the proteins in mitochondria to ensure this process is efficient. To make more of a given protein, the cell must copy the DNA of the gene that encodes it into another molecule known as a messenger RNA, before reading the instructions in the messenger RNA to build the protein. However, this is not the only way that a cell uses molecules of RNA.
A second group of RNAs called long non-coding RNAs (or lncRNAs) can help regulate the production of proteins in complex ways, and each lncRNA can have an effect across multiple genes. Some lncRNAs, for example, stop a third group of RNAs – microRNAs – from blocking certain messenger RNAs from being read. Sirey et al. set out to answer whether a lncRNA might help to co-ordinate the production of the many proteins needed by mitochondria.
In experiments with mouse cells grown in the laboratory, Sirey et al. identified a lncRNA called Cerox1 that can co-ordinate the levels of at least 12 mitochondrial proteins. A microRNA called miR-488-3p suppresses the production of many of these proteins. By binding to miR-488-3p, Cerox1 blocks the effects of the microRNA so more proteins are produced. Sirey et al. artificially altered the amount of Cerox1 in the cells and showed that more Cerox1 leads to higher mitochondria activity. Further experiments revealed that this same control system also exists in human cells.
Mitochondria are vital to cell survival and changes that affect their efficiency can be fatal or highly debilitating. Reduced efficiency is also a hallmark of ageing and contributes to conditions including cardiovascular disease, diabetes and Parkinson’s disease. Understanding how mitochondria are regulated could unlock new treatment methods for these conditions, while a better understanding of the co-ordination of protein production offers other insights into some of the most fundamental biology.
https://doi.org/10.7554/eLife.45051.002Introduction
In eukaryotes, coupling of the mitochondrial electron transport chain to oxidative phosphorylation (OXPHOS) generates the majority of ATP that fulfils cellular energy requirements. The first enzyme of the electron transport chain, NADH:ubiquinone oxidoreductase (complex I), catalyses the transfer of electrons from NADH to coenzyme Q10, pumps protons across the inner mitochondrial membrane and produces reactive oxygen species (ROS). Mammalian mitochondrial complex I dynamically incorporates 45 distinct subunits into a ~ 1 MDa mature structure (Vinothkumar et al., 2014; Guerrero-Castillo et al., 2017). It is known that oxidatively damaged subunits can be exchanged in the intact holo-enzyme (Dieteren et al., 2012), but how this process may be regulated is poorly understood. The efficiency and functional integrity of OXPHOS are thought to be partly maintained through a combination of tightly co-ordinated transcriptional and post-transcriptional regulation (Mootha et al., 2003; van Waveren and Moraes, 2008; Sirey and Ponting, 2016) and specific sub-cytoplasmic co-localisation (Matsumoto et al., 2012; Michaud et al., 2014). The nuclear encoded subunits are imported into the mitochondria after translation in the cytoplasm and their complexes assembled together with the mitochondrially encoded subunits in an intricate assembly process (Perales-Clemente et al., 2010; Lazarou et al., 1793; Vogel et al., 2007). Mitochondrial biogenesis is co-ordinated first transcriptionally from both genomes (Scarpulla et al., 2012), and then post-transcriptionally by regulatory small noncoding RNAs such as microRNAs (miRNAs) (Dumortier et al., 2013; Li et al., 2012). Recently, SAMMSON a long noncoding RNA (lncRNA) was found to bind p32 and, within mitochondria, enhanced the expression of mitochondrial genome-encoded polypeptides (Leucci et al., 2016).
Nuclear-encoded and cytosol-located lncRNAs have not yet been implicated in regulating mitochondrial OXPHOS (Vendramin et al., 2017) despite being surprisingly numerous and often found localised to mitochondrion- and ribosome-adjacent portions of the rough endoplasmic reticulum (van Heesch et al., 2014). It is here, on the ribosome, that turnover of miRNA-targeted mRNAs frequently occurs during their translation (Tat et al., 2016). Here we describe a novel mammalian conserved lncRNA, termed Cerox1 (cytoplasmic endogenous regulator of oxidative phosphorylation 1). Cerox1 regulates complex I activity by co-ordinately regulating the abundance of at least 12 complex I transcripts via a miRNA-mediated mechanism. Cerox1 knockdown decreases the enzymatic activities of complexes I and IV. Conversely, elevation of Cerox1 levels increases their enzymatic activities, halves cellular oxidative stress, and protects cells against the cytotoxic effects of the complex I inhibitor rotenone. To our knowledge, Cerox1 is the first lncRNA modulator of normal mitochondrial energy metabolism homeostasis and cellular redox state. The miRNA-dependency of Cerox1 and the regulation of associated OXPHOS transcripts are supported by: (i) direct physical interaction of miR-488–3p with Cerox1 and complex I transcripts; (ii) decrease or increase in Cerox1 and complex I transcripts following miR-488–3p overexpression or inhibition, respectively; (iii) miR-488–3p destabilisation of wildtype Cerox1, but not a Cerox1 transcript containing a mutated miR-488–3p miRNA recognition element (MRE) seed region; and, (iv) absence of the OXPHOS phenotypes either in cell lines deficient in microRNA biogenesis or when Cerox1’s predicted miR-488–3p response element is mutated. The miRNA-dependent role of Cerox1 illustrates how RNA-interaction networks can regulate OXPHOS and that lncRNAs represent novel targets for modulating OXPHOS enzymatic activity.
Results
Cerox1 is a conserved, highly expressed long noncoding RNA
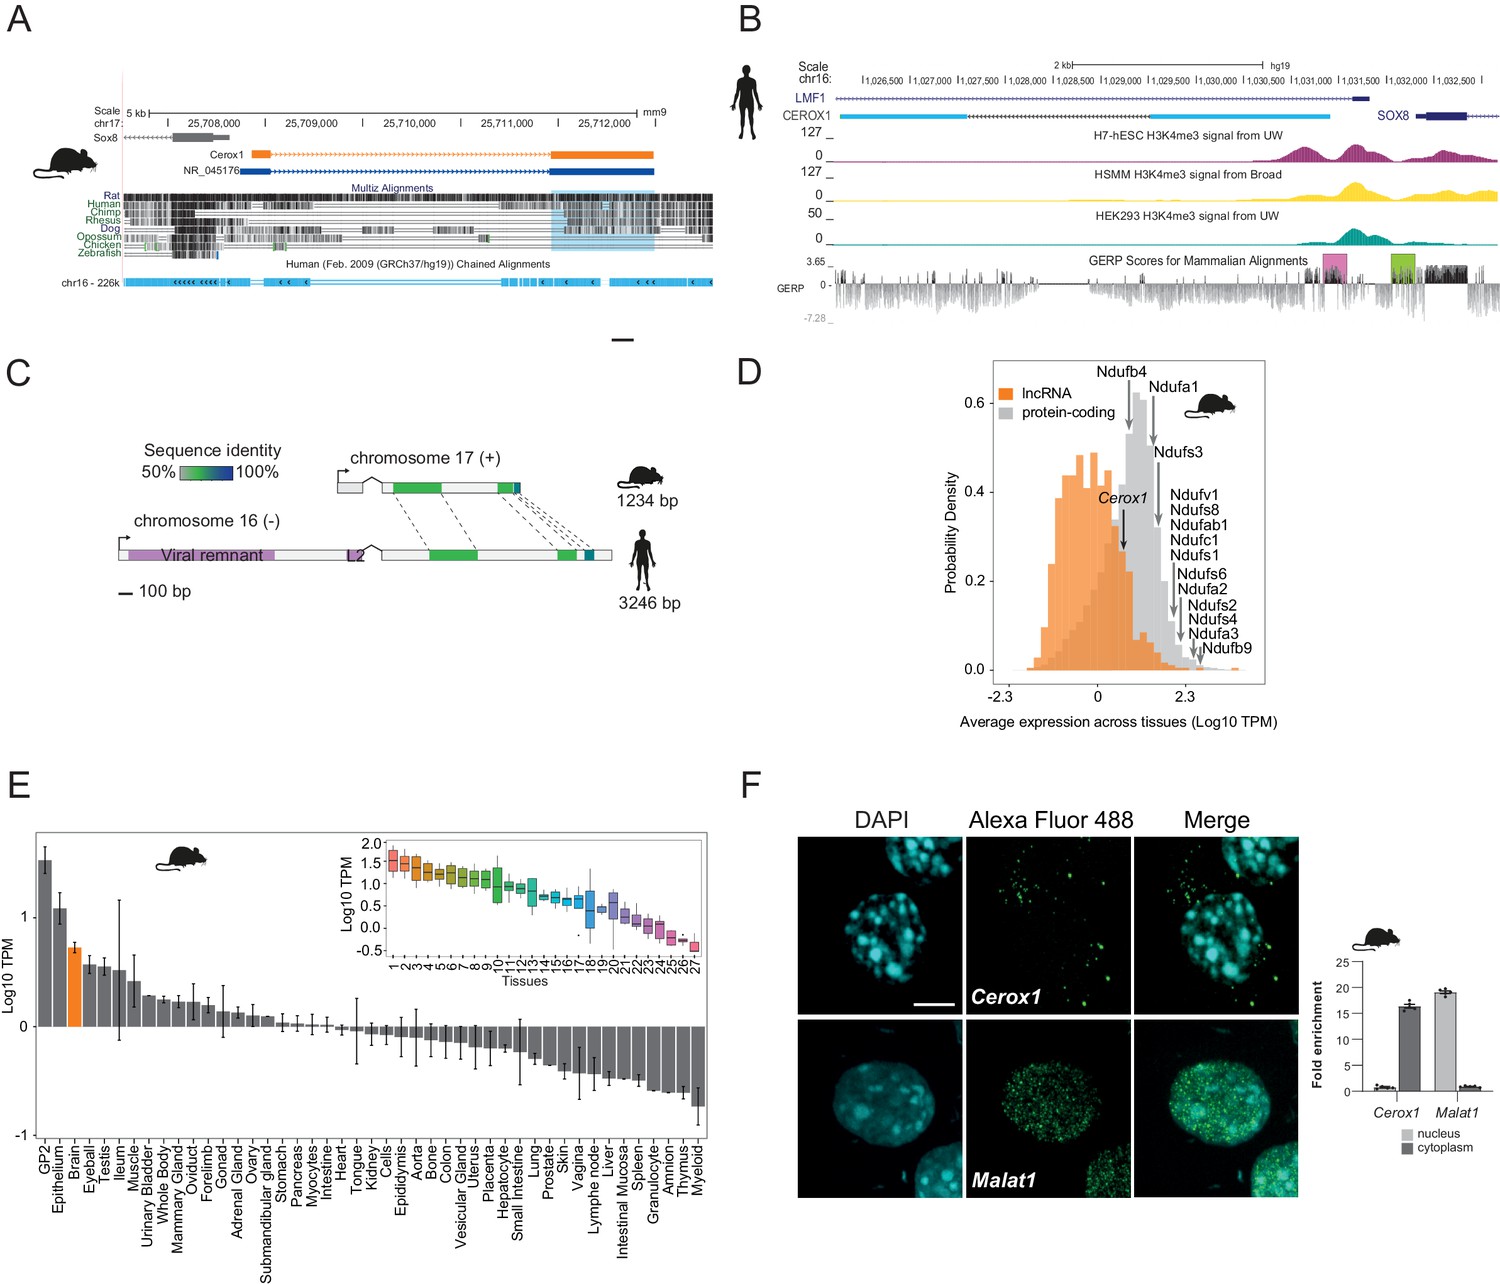
Cerox1 was selected for further investigation from among a set of central nervous system-derived polyadenylated long non-coding RNAs identified by cDNA sequencing (GenBank Accession AK079380, 2810468N07Rik) (Carninci et al., 2000; Ponjavic et al., 2007). Mouse Cerox1 is a 1.2 kb, two exon, intergenic transcript which shares a bidirectional promoter with the SRY (sex determining region Y)-box 8 (Sox8) gene (Figure 1A). A human orthologous transcript (CEROX1, GenBank Accession BC098409) was identified by sequence similarity and conserved synteny (60–70% nucleotide identity within alignable regions, Figure 1B,C). Both mouse and human transcripts have low protein coding potential (Materials and methods, Figure 1—figure supplement 1A) and no evidence for translation from available proteomic datasets.
Figure 1 with 1 supplement see all
Cerox1 is an evolutionarily conserved, highly expressed and predominantly cytoplasmic lncRNA.
(A) The mouse Cerox1 locus (mm9 assembly). Sequence shaded in blue highlights conservation within exon two among eutherian mammals, but not in non-mammalian vertebrates such as chicken and zebrafish. (B) Syntenic human locus (hg19). This transcript was previously identified on the minus strand as LMF1 non-coding transcript 4, and is located within the intron of LMF1 non-coding transcript 2. LMF1 non-coding transcript two is annotated as a nonsense mediated decay biotype. A prominent peak of H3K4me3 (tri-methylation of histone H3 lysine 4 often found near promoters) modification marks the CEROX1 transcriptional start site. H3K4me3 peaks for H7-human embryonic stem cells (H7-hESC), human skeletal muscle myoblasts (HSMM) and human embryonic kidney 293 cells (HEK293) are depicted. The genomic evolutionary rate profiling (GERP) score indicates a higher extent of conservation of the CEROX1 promoter (shaded pink) than the adjacent SOX8 promoter (shaded green). (C) Schematic representation of mouse Cerox1 transcript and the human orthologous sequence. Exon two contains blocks of 60–70% sequence identity; human CEROX1 has an additional 1235 bases of retrotransposed insertions at the 5’ end. (D) Distributions of lncRNAs’ and protein-coding genes’ average expression levels across tissues in mouse. Average expression levels of representative mitochondrial complex I subunits’ mRNAs are indicated. TPM = tags per million. (E) Average expression levels of Cerox1 across mouse tissue samples. The orange bar highlights nervous system tissue samples whose values for replicates among neurological tissues are shown in the inset panel: 1- Medulla oblongata, 2– Spinal cord, 3– Diencephalon, 4– Substantia nigra, 5– Microglia, 6– Raphe, 7– Dorsal spinal cord, 8– Corpora quadrigemina, 9– Cortex, 10– Corpus striatum, 11- Visual cortex, 12– Olfactory brain, 13– Cerebellum, 14– Neurospheres sympathetic neuron derived, 15– Neurospheres parasympathetic neuron derived, 16– Neurospheres enteric neuron derived, 17– Astrocytes (cerebellar), 18– Hippocampus, 19– Hippocampal, 20– Ventral spinal cord, 21– Astrocytes, 22– Pituitary gland, 23– Astrocytes (hippocampus), 24– Cortical neurons, 25– Striatal neurons, 26– Schwann cells, 27– Meningeal cells. Error bars indicate s.e.m. (F) Cytoplasmic localisation of mouse Cerox1 compared to a nuclear retained lncRNA, Malat1, as demonstrated by fluorescent in situ hybridization and cell fractionation followed by quantitative PCR. By fractionation, mouse Cerox1 is 15-fold enriched in the cytoplasm of N2A cells (n = 5; error bars s.e.m.). Scale bar = 5 μm.
Four human or mouse data types supported CEROX1 as having an important organismal role. First, its promoter shows a greater extent of sequence conservation than the adjacent SOX8 promoter and its exons are conserved among eutherian mammals (Figure 1B). Second, from expression data, its levels in primary tissues and cells are exceptionally high, within the top 13% of a set of 879 lncRNAs with associated cap analysis of gene expression (CAGE) clusters (Figure 1D,E). Expression is particularly high in neuroglia, neural progenitor cells and oligodendrocyte progenitors (Bergmann et al., 2015; Mercer et al., 2010; Zhang et al., 2014) (Figure 1—figure supplement 1B). Cerox1 is notable in its higher expression in the adult brain than 64% of all protein coding genes. Cerox1 expression is also developmentally regulated. For example, it is a known marker gene for type one pre-haematopoietic stem cells in the dorsal aorta (Zhou et al., 2016) and its expression is high in mouse embryos beyond the 21 somite stage (https://dmdd.org.uk/). High expression of Cerox1 in the brain was confirmed using quantitative real-time PCR (qPCR) for both mouse and human orthologous transcripts (Figure 1—figure supplement 1C,D).
Third, single nucleotide variants are significantly associated both with CEROX1 expression and anthropomorphic traits, measured in the UK Biobank. These lie within an 85 kb interval encompassing the CEROX1 locus, and 5’ regions of SOX8 and LMF1 genes. For example, rs3809674 is significantly associated with standing and sitting heights; arm fat-free mass (left or right); arm predicted mass (left or right); trunk fat-free or predicted mass; and whole body fat-free mass (p<5×10⁻⁸, Supplementary file 1); this variant is also a CEROX1 expression quantitative trait locus (eQTL) for 30 GTEx tissues (p≤0.05), some with absolute normalised effect sizes reaching 0.83 (Figure 1—figure supplement 1E). Genetically determined expression change in CEROX1 therefore could explain, in part, variation in these anthropomorphic traits. These variations affect a large fraction of the human population (minor allele frequency of 28% in 1000 Genomes data). An alternative interpretation that rs3809674 (and linked variants) act on anthropomorphic traits through LMF1, rather than CEROX1, is consistent with this variant being an eQTL for LMF1, but is not consistent with the known protein function of LMF1, a lipase maturation factor, because the associated anthropomorphic traits relate only to fat-free mass. A summary-data-based Mendelian randomization analysis that uses rs3809674 as an instrumental variable, predicts an effect of CEROX1 gene expression on glioma risk (Melin et al., 2017). Finally, it has recently been demonstrated in a mouse model of haematopoietic lineage differentiation that Cerox1 depletion may impair the contributions of stem cell or B cell differentiation to haematopoiesis (Delás et al., 2019).
In mouse neuroblastoma (N2A) cells the most highly expressed Cerox1 transcript (Figure 1—figure supplement 1F,G) is enriched in the cytoplasmic fraction (Figure 1F) with a short half-life of 36 ± 16 mins (Figure 1—figure supplement 1H) and is mainly associated with the ribosome-free fraction (Figure 1—figure supplement 1I).
Cerox1 expression modulates levels of oxidative phosphorylation transcripts
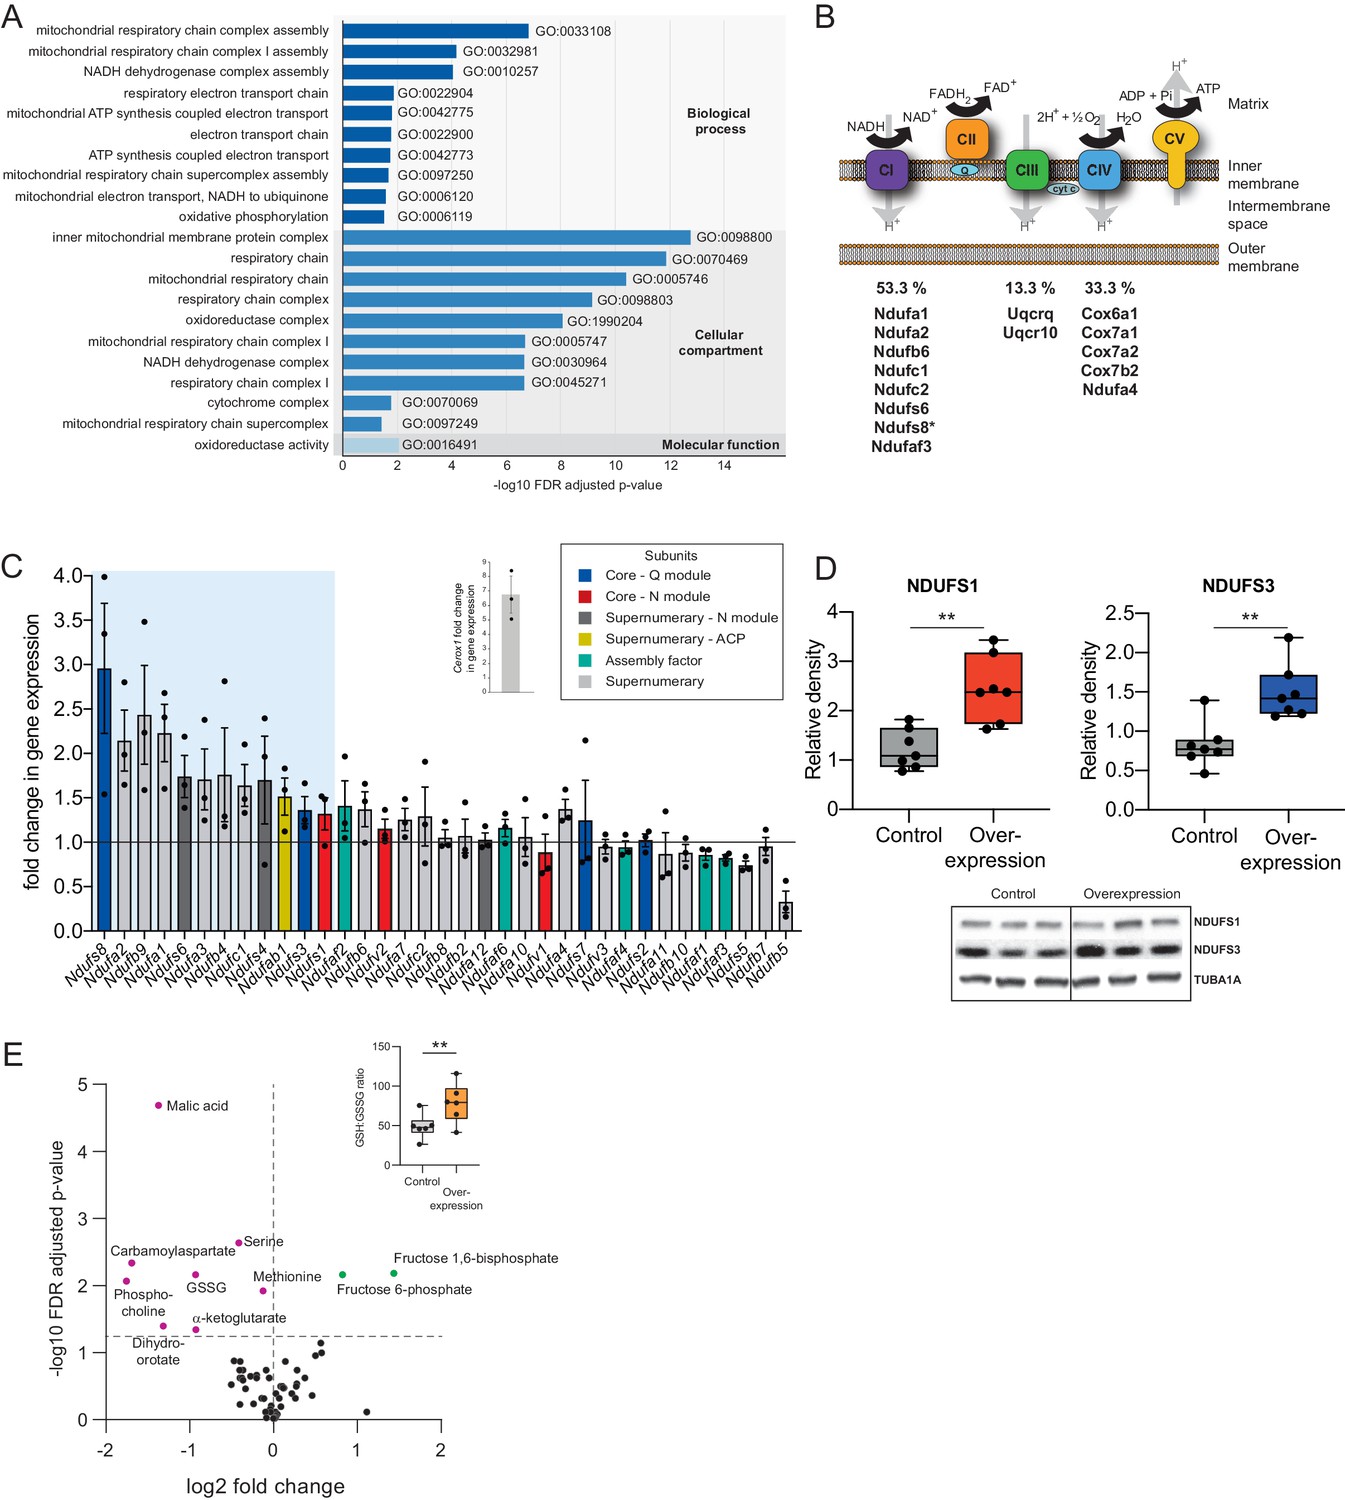
Expression of Cerox1 was manipulated by transient overexpression or shRNA-mediated knockdown. Twelve shRNAs were tested for the ability to knock-down Cerox1 (Figure 2—figure supplement 1A). One of these (sh92) decreased expression levels by greater than 60%, with the next best shRNA (sh1159) decreasing expression by approximately 40%. As expected from their sharing of the Cerox1-Sox8 bidirectional promoter, CRISPR-mediated activation and inhibition of the Cerox1 locus was not specific as it led also to changes in Sox8 expression (Figure 1A, Figure 2—figure supplement 1B). However, decreasing Cerox1 levels in N2A cells by shRNA or transient overexpression had no effect on the expression of neighbouring genes (Figure 2—figure supplement 1C). In contrast, Cerox1 overexpression led to differential expression of 286 distal genes (q < 0.05, Bonferroni multiple testing correction; Supplementary file 2), of which an unexpected and large majority (83%; 237) were upregulated (p<10−6; binomial test). Our attention was immediately drawn to the considerable (≥20 fold) enrichment of the mitochondrial respiratory chain gene ontology term among upregulated genes (Figure 2A).
Figure 2 with 1 supplement see all
Cerox1 overexpression elevates levels of OXPHOS transcripts and their encoded proteins.
(A) Gene ontology analysis indicates a significant enrichment of upregulated genes involved in mitochondrial electron transport, energy production and redox reactions. (B) Four membrane bound multi-subunit complexes (CI, CII, CIII, CIV) are embedded in the inner mitochondrial membrane and facilitate transfer of electrons; three of these subunits are also proton pumps which create the chemiosmotic gradient required for ATP synthase activity, with complex V being ATP synthase. The subunits vary in size and complexity with Complex I (NADH:ubiquinone oxidoreductase) consisting of 45 subunits, Complex II (succinate dehydrogenase) four subunits, Complex III (Ubiquinol:cytochrome c oxidoreductase) 11 subunits and Complex IV (Cytochrome c oxidase) 13 subunits. Of 15 oxidative phosphorylation genes whose transcripts were up-regulated following Cerox1 overexpression 53% were subunits of Complex I, 13% were subunits of Complex III and 33% were subunits of Complex IV. * indicates core subunits that are essential for activity. Note: subunit NDUFA4 has recently been reassigned to mitochondrial complex IV (Balsa et al., 2012). (C) qPCR profiling of 35 complex I subunits and assembly factors (30 nuclear encoded complex I subunits and five assembly factors). Transcripts showing a 1.4 fold, or greater, change in expression after overexpression of Cerox1 are present within the boxed shaded area. Fold change of wild-type Cerox1 compared to the control are indicated in the inset panel. The transcripts profiled can be characterised into six categories: Core–Q module, subunits responsible for the electron transfer to ubiquinone; Core–N module, subunits responsible for the oxidation of NADH; Supernumerary subunits– those that are additional to the core subunits required for the catalytic role of complex I, but do not play a catalytic role themselves. Many of these subunits may be performing a structural role, but the majority are of unknown function. The supernumerary subunits can be further subdivided into supernumerary – N module, those accessory subunits associated with the NADH oxidation module of CI; supernumerary ACP (acyl carrier protein) – in addition to being a non-catalytic subunit of CI, NDUFAB1 is also a carrier of the growing fatty acid chain in mitochondrial fatty acid biosynthesis; assembly factor, proteins that are required for the correct assembly and integration of CI. Error bars s.e.m. (n = 3 biological replicates). (D) Overexpression of Cerox1 results in large increases in the total protein levels of two core subunits for which high quality antibodies exist, normalised to the loading control α-tubulin (TUBA1A). NDUFS1 is one of three (NDUFS1, NDUFV1, NDUFV2) core components of the N-module of Complex I. NDUFS3 is one of four (NDUFS2, NDUFS3, NDUFS7, NDUFS8) core components of the Complex I Q-module. n = 7 biological replicates for control and overexpression. 2-sided t-test; **p<0.01. (E) Overexpression of Cerox1 results in a change in the metabolite profile of N2A cells, with 10 of 66 metabolites measured demonstrating a significant change in the experimental sample after multiple testing correction (q < 0.05; n = 6 biological replicates for pCAG-control and pCAG Cerox1 overexpression). N2A cells overexpressing Cerox1 show an increased GSH:GSSG ratio (figure inset, 2-sided t-test; **p<0.01).
-
Figure 2—source data 1
N2A metabolomics profiling - Figure 2E.
- https://doi.org/10.7554/eLife.45051.007
The mitochondrial electron transport chain (ETC) consists of five multi-subunit complexes encoded by approximately 100 genes of which only 13 are located in the mitochondrial genome. The 15 ETC transcripts that show statistically significant differential expression after Cerox1 overexpression are nuclear encoded (Figure 2B,C) with the greatest changes observed by qPCR for complex I subunit transcripts (Figure 2—figure supplement 1D). Twelve of 35 nuclear encoded complex I subunits or assembly factors transcripts increased substantially and significantly (>40%) following Cerox1 overexpression; we consider these to be gene expression biomarkers for Cerox1 activity in the mouse N2A system (Figure 2C). In the reciprocal Cerox1 knock-down experiment, all 12 were reduced in abundance using sh92, three significantly, with a concordant pattern observed for the less effective shRNA, sh1159 (Figure 2—figure supplement 1E,F). Taken together, these results indicate that Cerox1 positively and co-ordinately regulates the levels of many mitochondrial complex I transcripts.
Increased abundance of OXPHOS subunit transcripts, following Cerox1 overexpression, was found to elevate protein levels. Western blots using reliable antibodies for the key complex I catalytic core proteins NDUFS1 and NDUFS3 showed approximately 2.0-fold protein level increases that surpassed their ~ 1.4 fold transcript level changes (median 2.4 and 1.4-fold increases [p=0.0013 and 0.002], respectively; Figure 2D). Cerox1 transcript abundance is thus coupled positively to OXPHOS transcript levels and to their availability for translation, resulting in an amplification of the amount of protein produced. In summary, protein subunits of the same complex (Complex I) that are sustained at high abundance and with long half-lives (Dörrbaum et al., 2018; Mathieson et al., 2018; Schwanhäusser et al., 2011) (Figure 2—figure supplement 1G), and whose transcripts are stable (Schwanhäusser et al., 2011; Friedel et al., 2009; Sharova et al., 2009; Tani et al., 2012) (Figure 2—figure supplement 1H) and also have very high copy numbers in the cell (Schwanhäusser et al., 2011; Cao et al., 2017), can be increased two-fold, and co-ordinately, by the simple expediency of increasing the level of this single abundant lncRNA.
These large effects on protein and mRNA copy number are associated with both metabolic and cellular phenotypes. Ten metabolites are significantly different in N2A cells overexpressing Cerox1 (Figure 2E). These cells show a significant increase in the reduced glutathione to oxidized glutathione ratio (GSH:GSSG, p=1.3×10⁻³, Figure 2D Inset) indicative of a more favourable cellular redox state. Cerox1-overexpressing cells also exhibited a 43% reduction in cell cycle activity, yet without a change in the proportion of live/dead cells or a deviation from normal cell cycle proportions (Figure 2—figure supplement 1I,J,K). Cerox1 levels thus affect the overall timing of cell division.
Cerox1 can regulate mitochondrial OXPHOS enzymatic activity
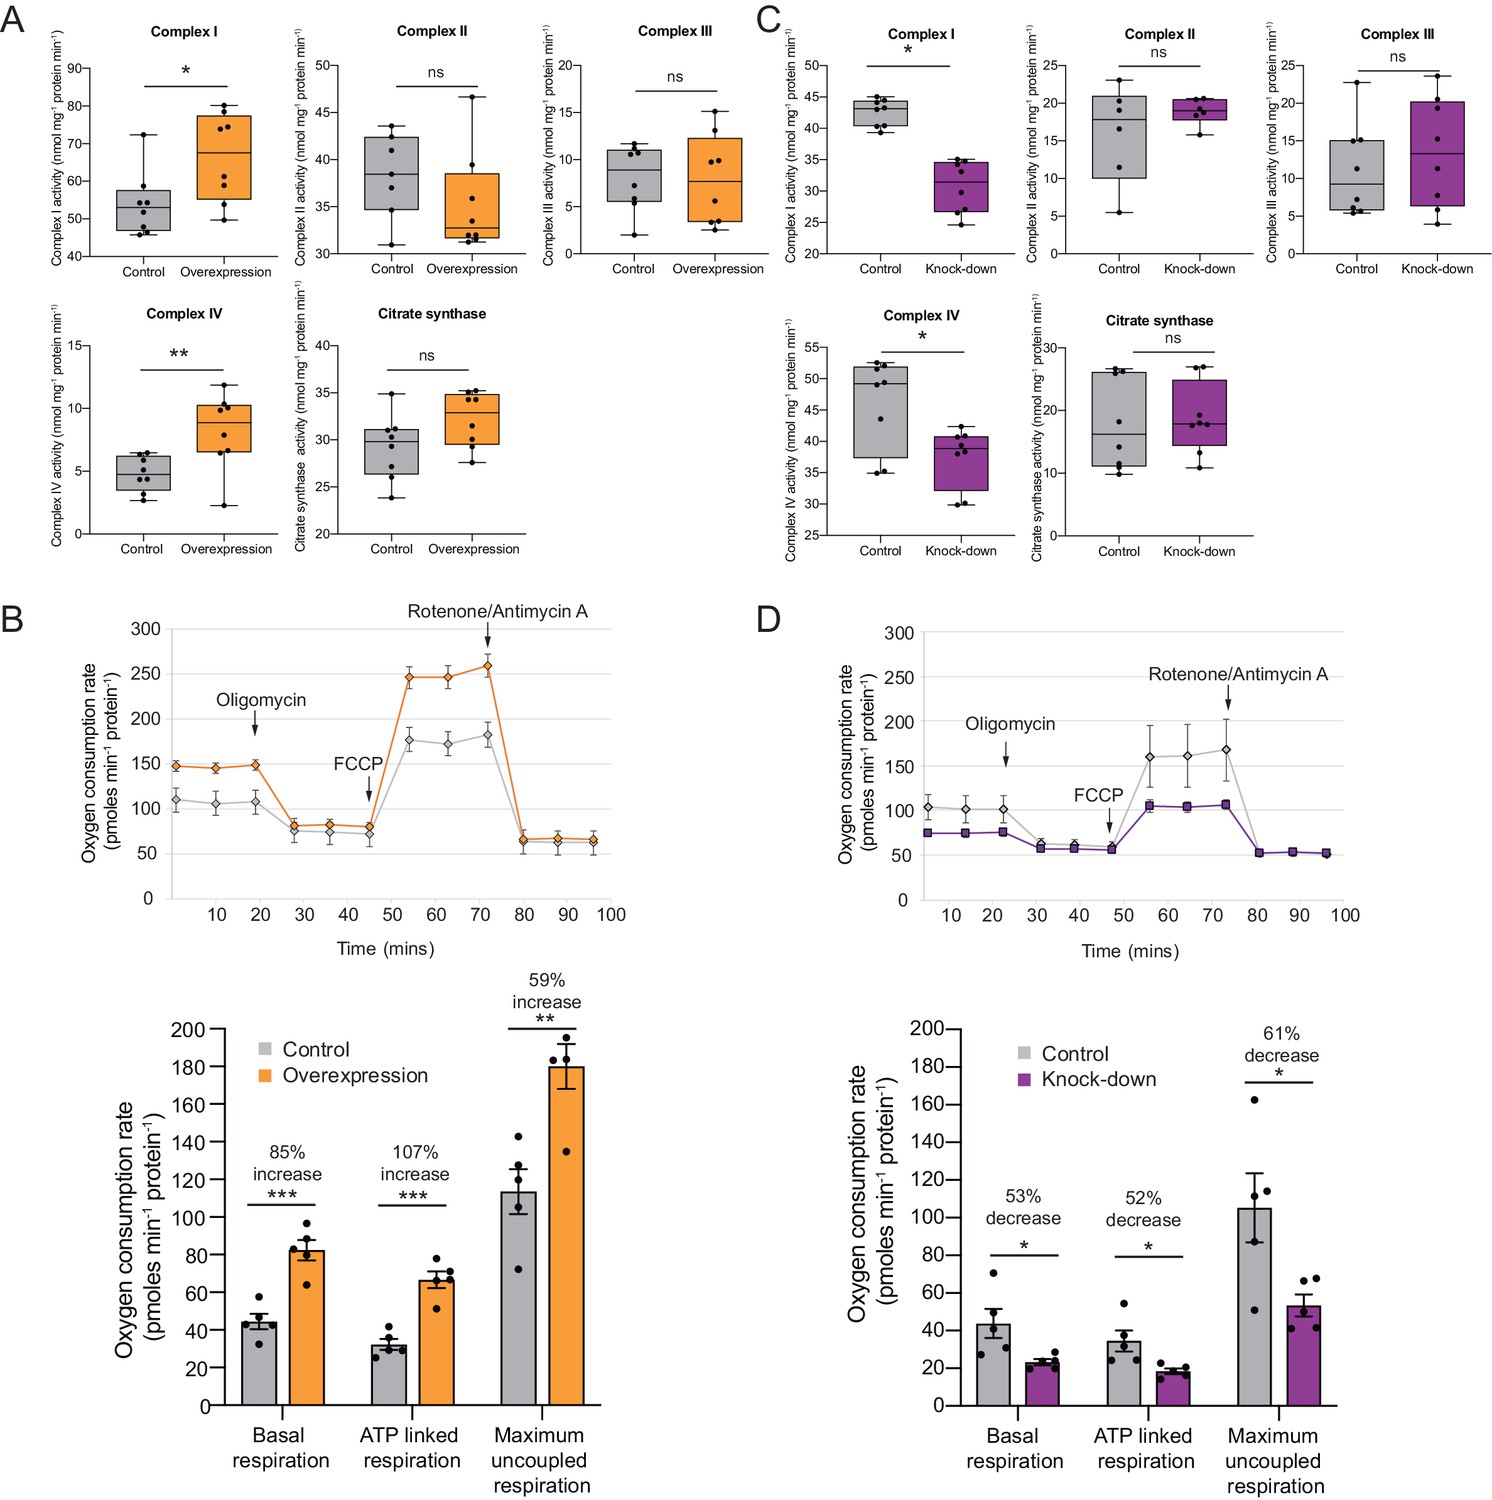
Increased translation of some complex I transcripts leads to increased respiration (Shyh-Chang et al., 2013) and, more specifically, to an increase in the enzymatic activity of complex I (Alvarez-Fischer et al., 2011). To address this hypothesis we used oxidative phosphorylation enzyme assays to investigate whether changes in expression to a subset of subunits lead to a change in enzyme activity and oxygen consumption. Indeed, complex I and complex IV enzymatic activities increased substantially after Cerox1 overexpression (by 22%, p=0.01; by 50%, p=0.003, respectively; 2-tailed Student’s t-test; Figure 3A). Such rate increases for two of the eukaryotic cell’s most abundant and active enzymes were unexpected.
Figure 3 with 1 supplement see all
OXPHOS enzyme activity and oxygen consumption change concordantly and substantially with Cerox1 level alteration.
(A) Enzyme activities in mouse N2A cells 72 hr post-transfection of Cerox1 overexpression construct. Mouse Cerox1 overexpression in N2A cells results in significant increases in the catalytic activities of complexes I (22% increase) and IV (50% increase). Complexes II, III and citrate synthase show no significant change in activity. n = 8 biological replicates for control and overexpression. (B) Oxygen consumption, by N2A cells overexpressing Cerox1. Top: normalised real time oxygen consumption rate in basal conditions and after sequential injections of oligomycin, FCCP and rotenone/antimycin A. Bottom: changes in basal, ATP-linked and maximum uncoupled respiration respectively. Error bars s.e.m. (n = 5 biological replicates). (C) sh92-mediated knockdown of Cerox1 results in significant decreases of Complexes I and IV enzymatic activities 72 hr post transfection; no significant changes were observed for complexes II, III or the citrate synthase control. n = 8 biological replicates for control and knockdown. The less effective shRNA (sh1159) also decreased oxygen consumption yet not significantly relative to the control (data not shown). (D) Oxygen consumption, by Cerox1 knockdown N2A cells. Top: normalised real time oxygen consumption rate in basal conditions and after sequential injections of oligomycin, FCCP and rotenone/antimycin A. Bottom: changes in basal, ATP-linked and maximum uncoupled respiration respectively. Error bars s.e.m. (n = 5 biological replicates). 2-tailed Student’s t-test: ***p<0.001, **p<0.01, *p<0.05, ns not significant.
-
Figure 3—source data 1
N2A Cerox1 overexpression specific enzyme assays - Figure 3A.
- https://doi.org/10.7554/eLife.45051.010
-
Figure 3—source data 2
N2A Cerox1 overexpression seahorse bioanalyzer - Figure 3B.
- https://doi.org/10.7554/eLife.45051.011
-
Figure 3—source data 3
N2A Cerox1 knock down specific enzyme assays - Figure 3C.
- https://doi.org/10.7554/eLife.45051.012
-
Figure 3—source data 4
N2A Cerox1 knock down seahorse bioanalyzer - Figure 3D.
- https://doi.org/10.7554/eLife.45051.013
We next measured oxygen consumption under these conditions using a Seahorse XFe24 Analyzer. These complexes’ more rapid catalytic rates resulted, unexpectedly, in large increases in: (i) overall basal oxygen consumption (by 85%), (ii) ATP-linked oxygen consumption (by 107%) and, (iii) maximum uncoupled respiration (by 59%; p=5×10⁻⁴, p=1×10⁻⁴, p=4×10⁻³, respectively, 2-tailed Student’s t-test; Figure 3B). These increases in enzyme activities and mitochondrial respiration are expected to produce persistent and substantial increases beyond the already very high basal rate of ATP formation (Rich, 2003), due to the long-half lives of the Cerox1 sensitive complex I protein subunits (Dörrbaum et al., 2018; Mathieson et al., 2018; Schwanhäusser et al., 2011).
Conversely, after sh92-mediated Cerox1 knockdown complex I and complex IV enzymatic activities decreased significantly (by 11%, p=0.03% and 19%, p=0.02, respectively; Figure 3C), with concomitant large decreases in basal oxygen consumption (53%), ATP linked oxygen consumption (52%) and maximal uncoupled respiration (61%; p=0.011, p=0.034, p=0.042 respectively, 2-tailed Student’s t-test; Figure 3D).
These observed changes in enzymatic activity were not due to changes in mitochondria number because the enzymatic activities of complexes II, III and citrate synthase (Figure 3A,B), and the mitochondrial-to-nuclear genome ratio (Figure 3—figure supplement 1A,B), each remained unaltered by changes in Cerox1 levels. These data indicate that Cerox1 can specifically and substantially regulate oxygen consumption and catalytic activities of complex I and complex IV in mouse N2A cells.
Cerox1 expression can protect cells from oxidative stress
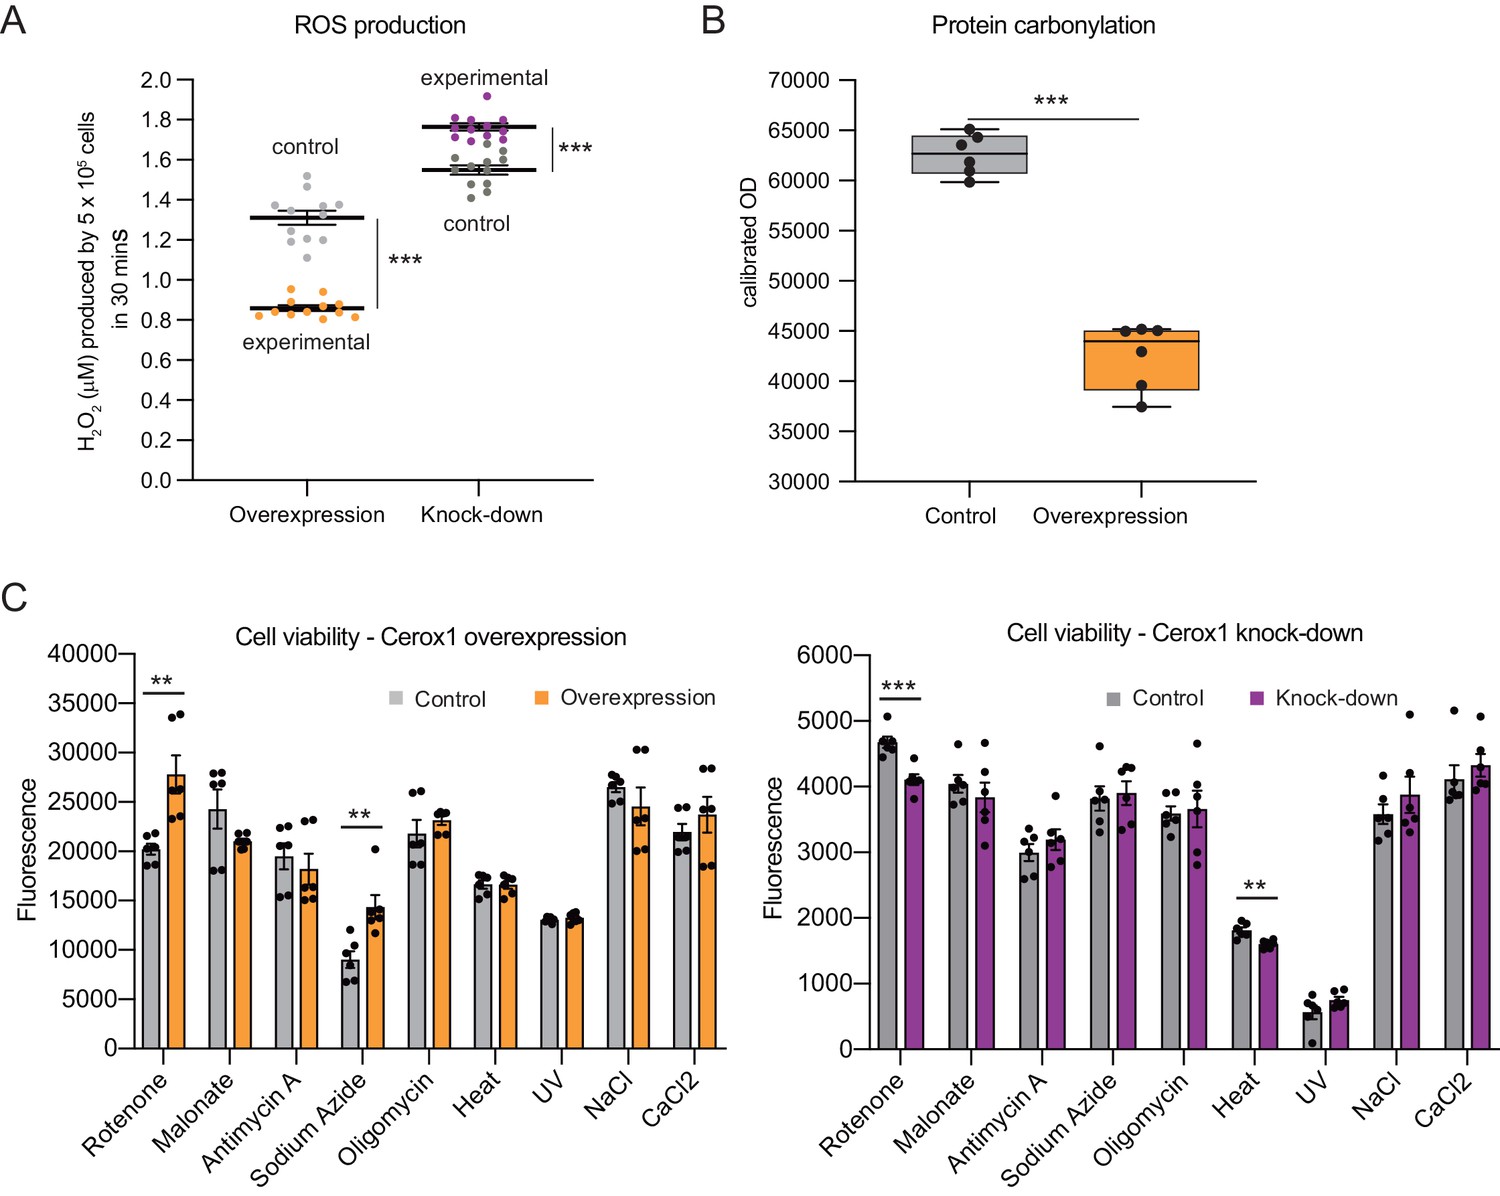
Complex I deficient patient cells experience elevated ROS production (Pitkanen and Robinson, 1996). In Cerox1 knockdown N2A cells ROS levels were increased significantly, by almost 20% (p=4.2×10⁻⁶; Figure 4A). Conversely, in cells overexpressing Cerox1, ROS production was nearly halved (p=3.5×10⁻⁷; Figure 4A), and protein carbonylation, a measure of ROS-induced damage, was reduced by 35% (p=1×10⁻³; Figure 4B). Knock-down of Cerox1 resulted in a 6.6% increase in protein carbonylation compared to the control (p=0.05, data not shown). The observed Cerox1-dependent reduction in ROS levels is of particular interest because mitochondrial complex I is a major producer of ROS which triggers cellular oxidative stress and damage, and an increase in ROS production is a common feature of mitochondrial dysfunction in disease (Murphy, 2009).
Figure 4
Cellular oxidative stress and viability depend on Cerox1 levels.
(A) Cerox1 knockdown increases the production of reactive oxygen species by 20%, whilst Cerox1 overexpression decreases it by 45% (error bars s.e.m., n = 12 biological replicates). (B) Protein oxidative damage also decreases in the overexpression condition compared to the control, as measured by densitometry on western blots against carbonylation of amino acid side chains. n = 6 biological replicates. (C) Viability of Cerox1 overexpressing and knock-down cells when stressed. N2A cells were stressed by addition of electron transport chain (ETC) inhibitors (rotenone, CI inhibitor; malonate, competitive inhibitor of CII; antimycin A, CIII inhibitor; sodium azide, CIV inhibitor; oligomycin, ATP synthase inhibitor), exposure to environmental stress (heat, ultraviolet radiation), or manipulation of extracellular osmolarity (NaCl) or extracellular calcium (CaCl2) concentration, for 1 hr and then the viability of the cells measured using the fluorescent indicator Alamar Blue. Error bars s.e.m. (n = 6 biological replicates for overexpression control, overexpression, knock-down control and knock-down). 2-tailed Student’s t-test: ***p<0.001, **p<0.01.
-
Figure 4—source data 1
N2A Reactive oxygen species production - Figure 4A.
- https://doi.org/10.7554/eLife.45051.015
-
Figure 4—source data 2
N2A Cerox1 overexpression protein carbonylation - Figure 4B.
- https://doi.org/10.7554/eLife.45051.016
-
Figure 4—source data 3
N2A cell viability Cerox1 overexpression and knockdown - Figure 4C.
- https://doi.org/10.7554/eLife.45051.017
We next demonstrated that the increased activities of complex I and complex IV induced by Cerox1 protect cells against the deleterious effects of specific mitochondrial complex inhibitors, specifically rotenone and sodium azide (complex I and complex IV inhibitors, 37% and 58% respectively, p<0.01); conversely, Cerox1-knockdown cells were significantly more sensitive to rotenone and exposure to heat (12%, p<0.001% and 11%, p<0.01 respectively Figure 4C). Cells overexpressing Cerox1 and treated with rotenone, a complex I inhibitor, exhibited no significant difference in protein carbonylation (data not shown). Taken together, these results indicate that elevation of Cerox1 expression leads to decreased ROS production, decreased levels of oxidative damage to proteins and can confer protective effects against complex I and complex IV inhibitors.
Increased OXPHOS enzymatic activity is dependent upon miRNA binding to Cerox1
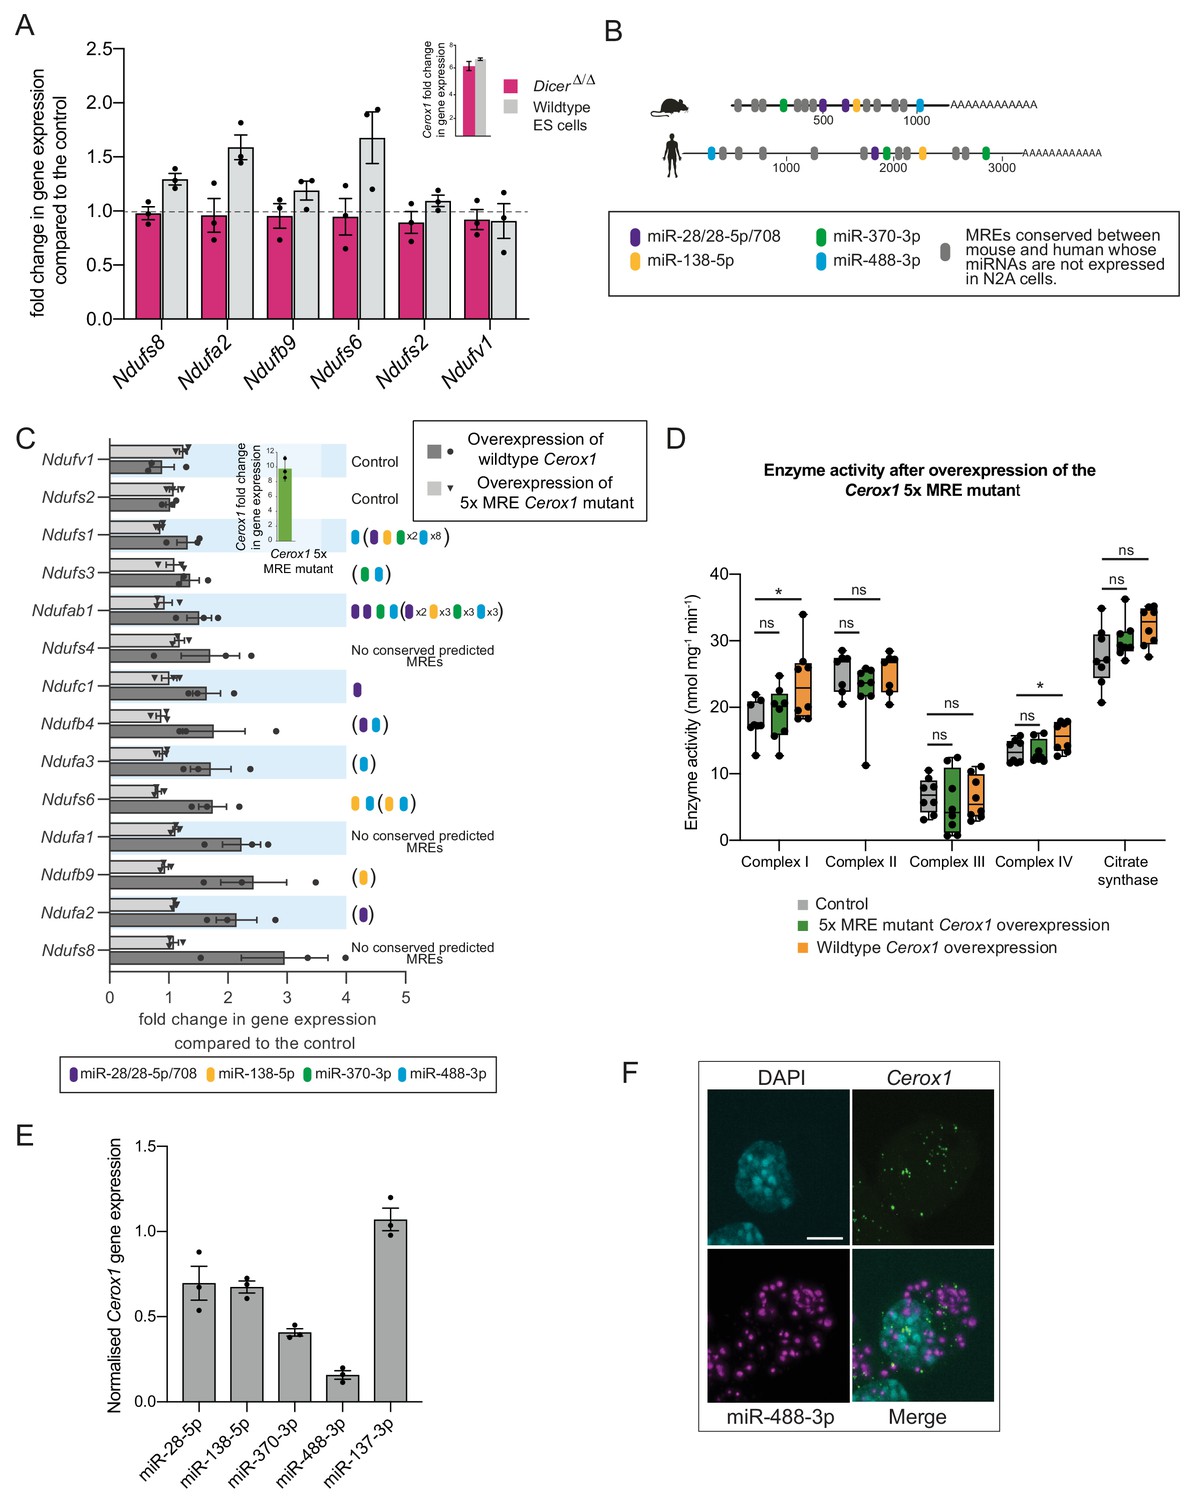
Due to their positive correlation in expression and cytoplasmic localisation we next considered whether Cerox1 regulates complex I transcripts post-transcriptionally by competing with them for the binding of particular miRNAs. To address this hypothesis, we took advantage of mouse Dicer-deficient (DicerΔ/Δ) embryonic stem cells that are deficient in miRNA biogenesis (Nesterova et al., 2008). We first tested Cerox1 overexpression in wildtype mouse ES cells and showed that this, again, led to an increase in transcript levels, specifically of six complex I subunits (Figure 5A), of which four had previously shown significant changes in N2A cells after Cerox1 overexpression (Figure 2C). In contrast, overexpression in DicerΔ/Δ cells failed to increase levels of these transcripts (Figure 5A). These results indicate that Cerox1’s ability to alter mitochondrial metabolism is miRNA-dependent.
Figure 5 with 1 supplement see all
The effect of Cerox1 on complex I transcript levels is miRNA-dependent.
(A) Overexpression of Cerox1 in mouse wildtype and DicerΔ/Δembryonic stem (ES) cells (inset graph). The overexpression of Cerox1 in wildtype mouse embryonic stem cells results in an increase in complex I subunit transcripts, with no observed change in expression of two control subunits (Ndufs2, Ndufv1) that were also unaffected in N2A cells. Overexpression of Cerox1 in DicerΔ/Δembryonic stem cells results in no increase in the expression of any complex I subunit. 2-sided t-test; **p<0.01, *p<0.05, ns = not significant. Error bars s.e.m. n = 3 biological replicates. (B) Predicted MREs whose presence is conserved in both the mouse and human Cerox1. Coloured MREs indicate those MREs whose presence is conserved between mouse and human and whose miRNAs are expressed in N2A cells. miRNA site types are as follows: miR-28–5p, 8mer-A1; miR-138–5p, 6mer; miR-370–3p, 7mer-m8; miR-488–3p, 7mer-m8; miR-708–5p, 7mer-A1. The grey predicted MREs represent those that are conserved, but whose miRNAs are not expressed in N2A cells (miR-125a-3p, miR-199/199–5p, miR-302ac/520f, miR-485/485–5p, miR-486/486–5p, miR-501/501–5p, miR-654–3p, miR-675/675–5p). (C) Overexpression of the 5xMRE mutant failed to alter expression of complex I subunit transcripts that otherwise all increase in abundance following wild-type Cerox1 overexpression. Fold changes of wildtype Cerox1 or the 5xMRE Cerox1 mutant compared to the control are indicated in the inset panel. The numbers of MREs predicted by TargetScan v7.0 (Agarwal et al., 2015) in these transcripts’ 3’UTRs for the four conserved, N2A expressed miRNA families are indicated (see also Supplementary file 3). Due to known widespread noncanonical miRNA binding (Helwak et al., 2013), predictions were also extended across the gene body (bracketed MREs). 2-sided t-test; **p<0.01, *p<0.05, ns = not significant. Error bars s.e.m. n = 3 biological replicates. (D) Overexpression of the 5xMRE mutant failed to alter OXPHOS enzymatic activity compared to the control for any of the complexes measured. A one-way ANOVA was applied to test for differences in activities of the mitochondrial complexes between a control and overexpression of wildtype Cerox1 and the 5xMRE mutant. A post-hoc Dunnett’s test indicated that the overexpression of wildtype Cerox1 resulted, as expected, in significantly increased complex I and IV activities of 30% and 17% respectively (F [2, 21]=4.9, p=0.017; F[2, 20]=4.6, p=0.033), while comparisons for the 5xMRE mutant with the control were not significant. There was no significant difference in the activities of complex II (F[2,19]=3.5, p=0.26), complex III (F[2,19]=0.08, p=0.5) or citrate synthase (F[2,20]=2.6, p=0.42). n = 6 biological replicates. Significance levels, one-way ANOVA, Dunnett’s post hoc test *p<0.05. (E) Four to six fold overexpression of each of four miRNAs with predicted MREs whose presence is conserved in both mouse and human Cerox1 resulted in a decrease in Cerox1 transcript level, with overexpression of miR-488–3p resulting in >90% knock down of Cerox1. This was not observed when the miRNA miR-137–3p, which has no predicted MREs in Cerox1, was similarly overexpressed. Error bars s.e.m. n = 3 biological replicates. (F) Fluorescent in situ hybridisation detection of miR-488–3p (magenta) and Cerox1 (green) in N2A cells. Scale bar = 5 μm. A no probe control (Figure 5—figure supplement 1D) indicated some background Fast Red signal (miRNA detection) localised to the nucleus, but no background for Alexa Fluor-488 (lncRNA detection).
-
Figure 5—source data 1
N2A wildtype and MRE mutant Cerox1 overexpression specific enzyme assays - Figure 5D.
- https://doi.org/10.7554/eLife.45051.020
Four miRNA families (miR-138–5p, miR-28/28–5p/708–5p, miR-370–3p, and miR-488–3p) were selected for further investigation based on the conservation of their predicted binding sites (MREs) in both mouse Cerox1 and human CEROX1 (Figure 5B). All five MREs conserved in mouse Cerox1 and human CEROX1 for N2A-expressed miRNAs (Figure 5B Figure 5—figure supplement 1A) were mutated by inversion of their seed regions. This mutated Cerox1 transcript failed to alter either complex I transcript levels or enzyme activities when overexpressed in mouse N2A cells (Figure 5C,D). This indicates that Cerox1’s molecular effects are mediated by one or more of these MREs.
If so, then the overexpression of these miRNAs in turn would be expected to deplete Cerox1 RNA levels. Indeed, overexpression of each miRNA reduced Cerox1 levels (Figure 5E). Overexpression of the tissue-restricted miRNA miR-488–3p (Figure 5—figure supplement 1B,C; Landgraf et al., 2007; Isakova and Quake, 2018) caused the greatest depletion of the Cerox1 transcript (Figure 5E) indicating that this MRE is likely to be physiologically relevant. Dual fluorescent RNA in situ hybridization of miR-488–3p and Cerox1 indicates the proximity of these non-coding RNAs within the N2A cell (Figure 5F) and that both Cerox1 and miR-488–3p are localised in the cytoplasm (Figures 1F and 5F). CEROX1 transcripts are predominantly (94%) localised to ribosomes (van Heesch et al., 2014), as is the destabilisation by microRNAs of mRNAs as they are being translated (Tat et al., 2016). Together, these observations imply that Cerox1 and mitochondrial protein mRNAs are targets of miR-488–3p on ribosomes within the rough ER that forms a network around mitochondria (Wu et al., 2017; Eskelinen, 2008).
Cerox1 activity is mediated by miR-488–3p
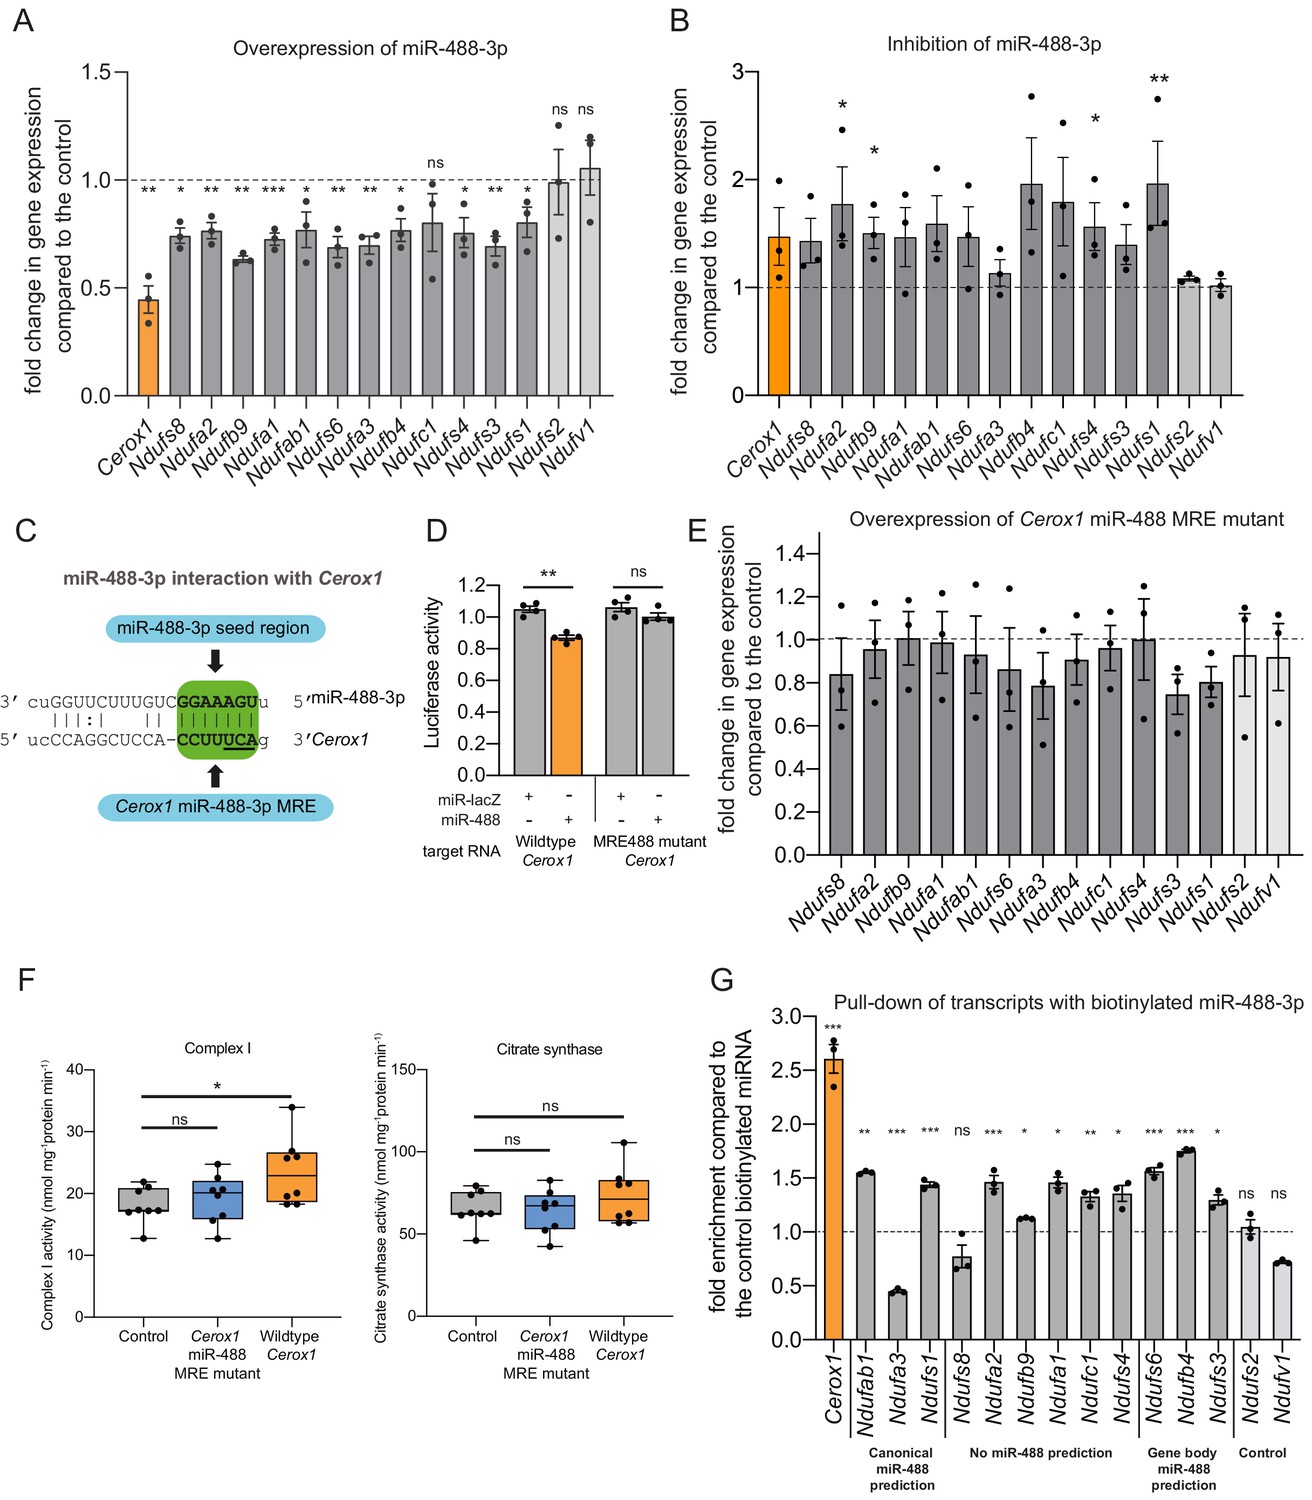
Our previous results showed that Cerox1 abundance modulates complex I activity and transcripts (Figures 2–4) and that miR-488–3p has the greatest effect in decreasing Cerox1 transcript levels (Figure 5E). To determine whether miR-488–3p modulates complex I transcript levels we overexpressed and inhibited miR-488–3p in N2A cells (Figure 6A,B). Results showed that miR-488–3p modulates these transcripts’ levels, with overexpression leading to a significant downregulation of all 12 Cerox1-sensitive complex I transcripts (Figure 6A), whilst, conversely, miR-488–3p inhibition leads to increased expression for 10 of 12 transcripts, of which 4 (Ndufa2, Ndufb9, Ndufs4 and Ndufs1) were significantly increased (Figure 6B).
Figure 6
An intact miR-488–3p response element site is required for the effect of Cerox1 on complex I catalytic activity.
(A) Overexpression of miR-488–3p knocks down all Cerox1-sensitive subunit transcripts. Error bars s.e.m. (n = 3 biological replicates for control and overexpression of miR-488–3p). 2-sided t-test; ***p<0.001, **p<0.01, *p<0.05 (B) Inhibition of miR-488–3p increases the expression of most (10/12) target transcripts compared to the control. Error bars s.e.m. (n = 3 biological replicates for control and inhibition of miR-488–3p). 2-sided t-test; **p<0.01, *p<0.05. (C) Schematic of the predicted miR-488–3p miRNA recognition element in Cerox1. The interaction of miR-488–3p with Cerox1 is predicted to involve a 7mer-8m seed site, with the heptamer sequence of the seed being complementary to nucleotides 2–8 of the miRNA. Underlined residues indicate the location of the Cerox1 miR-488-3p MRE mutation. (D) Luciferase destabilisation assay for both wildtype Cerox1 and Cerox1 mutated within the miR-488–3p MRE. Error bars s.e.m. (n = 4 biological replicates for each condition). 2-sided t-test; **p<0.01. (E, F) Overexpression of Cerox1 mutated within a single miR-488–3p MRE (E) failed to alter expression levels of complex I subunits that increase in expression with wild-type Cerox1 overexpression (error bars s.e.m, n = 3 biological replicates) and (F) failed to recapitulate the increase in complex I catalytic activity observed for the wildtype transcript. Fold change of wildtype Cerox1 compared to the control is indicated on the left of panel E. As expected, wildtype enzymatic activity was significantly different for complex I (F [2, 21]=4.944 P=0.019). A post-hoc Dunnett’s test indicated that the overexpression of wildtype Cerox1 resulted in significantly increased complex I activity, while the comparison of the Cerox1 miR-488–3p MRE mutant with the control was not significant. There was no significant difference in the activity of citrate synthase (F[2,21]=1.4, p=0.28). n = 8 biological replicates. Significance levels, one-way ANOVA, Dunnett’s post hoc test *p<0.05, ns = not significant. (G) Enrichment of 8 Cerox1 sensitive transcripts that do not have predicted canonical 3’UTR miR-488–3p MREs using biotinylated miR-488–3p as bait as compared to the control biotinylated miRNA. Error bars s.e.m. (n = 3 biological replicates). 2-sided t-test; ***p<0.001, **p<0.01, *p<0.05, ns – not significant.
-
Figure 6—source data 1
N2A wildtype and miR-488–3 p mutant Cerox1 overexpression complex I and citrate synthase assays - Figure 6F.
- https://doi.org/10.7554/eLife.45051.022
To determine whether the single predicted miR-488–3p MRE in Cerox1 is required to exert its effects on complex I we created a Cerox1 transcript containing three mutated nucleotides within this MRE (Figure 6C). As expected for a bona fide MRE, these substitutions abrogated the ability of miR-488–3p to destabilise Cerox1 transcript in a luciferase assay (Figure 6D). Importantly, these substitutions also abolished the ability of Cerox1, when overexpressed, to elevate complex I transcript levels (Figure 6E), and to enhance complex I enzymatic activity (Figure 6F). The latter observation is important because not all bona fide miRNA-transcript interactions are physiologically active (Bassett et al., 2014).
Finally, direct physical interaction between Cerox1 and miR-488–3p was confirmed by pulling-down transcripts with biotinylated miR-488–3p (Figure 6G). This experiment also identified 10 of 12 complex I transcripts tested as direct targets of miR-488–3p binding. These included transcripts not predicted as containing a miR-488–3p MRE, as expected from the high false negative rate of MRE prediction algorithms (Mazière and Enright, 2007; Yue et al., 2009; Tabas-Madrid et al., 2014). Also as expected, the two negative control transcripts, which are not responsive to Cerox1 transcript levels and have no predicted MREs for miR-488–3p, failed to bind miR-488–3p.
Considered together, these findings indicate that: (i) Cerox1 can post-transcriptionally regulate OXPHOS enzymatic activity as a miRNA decoy, and (ii) of 12 miR-488–3p:Nduf transcript interactions that were investigated, all 12 are substantiated either by responsiveness to miR-488–3p through miRNA overexpression or inhibition (Figure 6A,B), or by direct interaction with a biotinylated miR-488–3p mimic (Figure 6G). Consequently, our data demonstrates that miR-488–3p directly regulates the transcript levels of Cerox1 and at least 12 nuclear encoded mitochondrial complex I subunit genes (31% of all) and indirectly modulates complex I activity (Figure 6F) in N2A cells.
Cerox1 is an evolutionarily conserved regulator of mitochondrial complex I activity
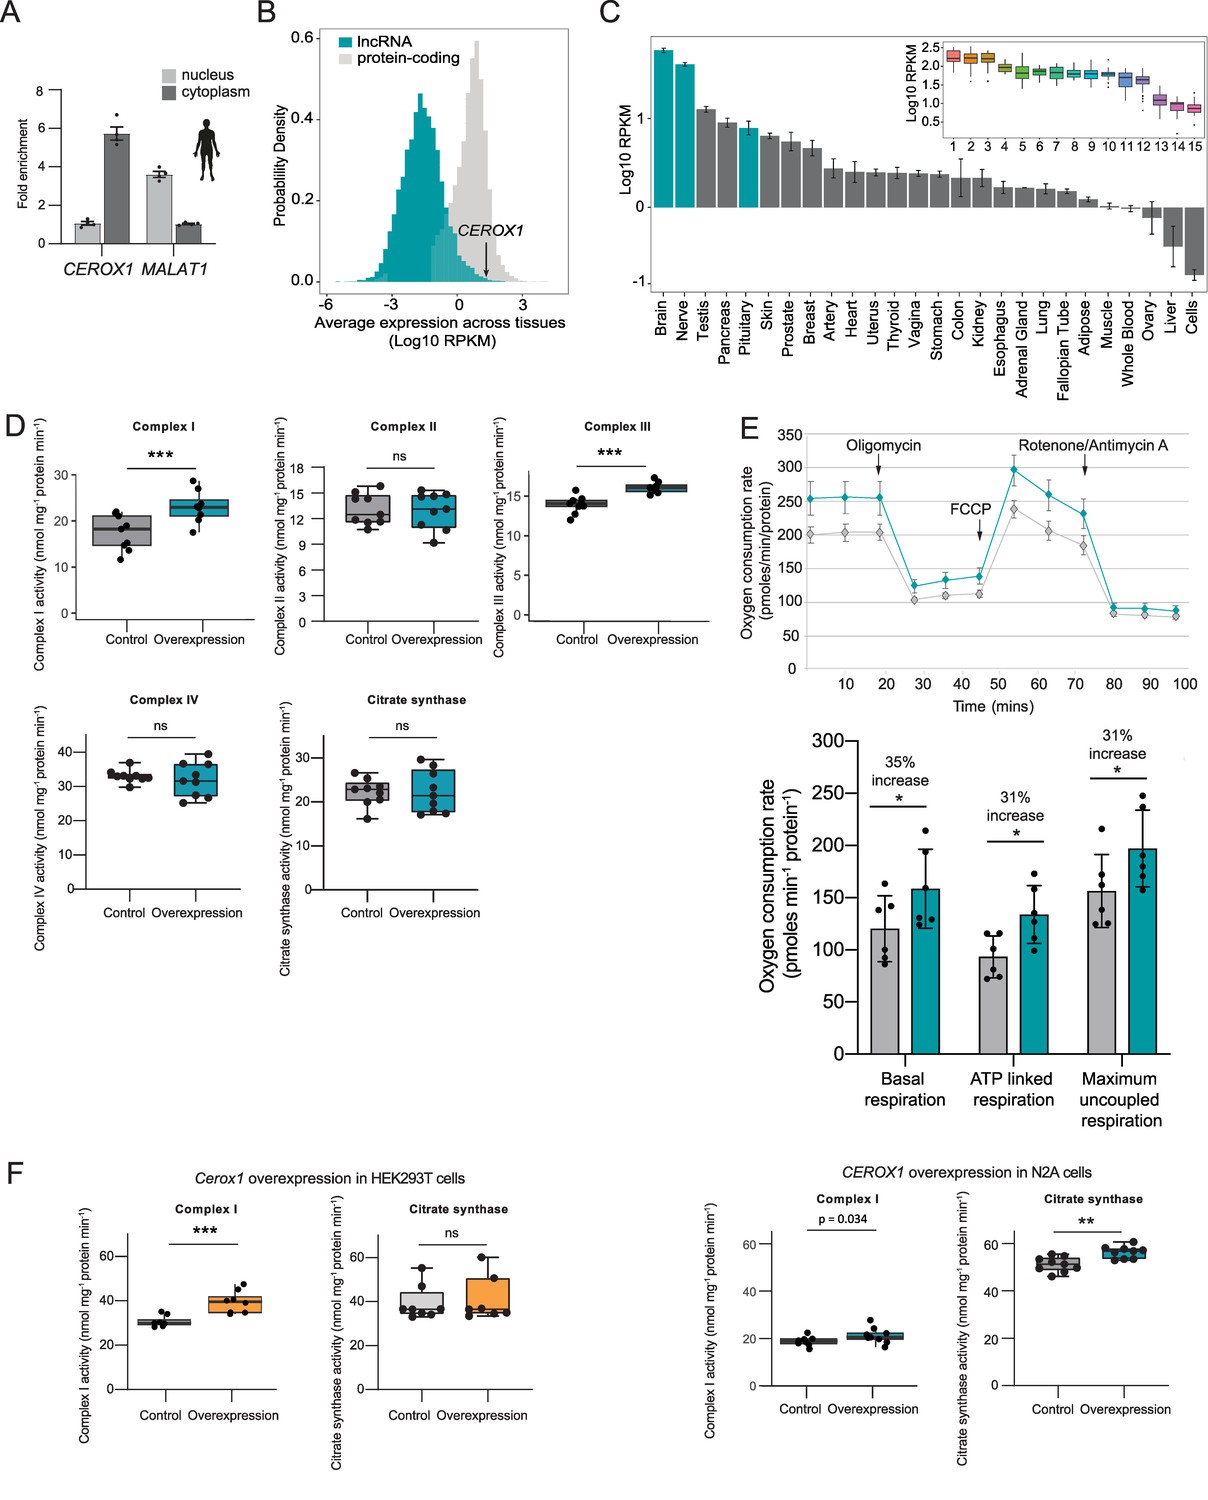
Fewer than 20% of lncRNAs are conserved across mammalian evolution (Necsulea et al., 2014) and even for these functional conservation has rarely been investigated. In our final set of experiments we demonstrated that CEROX1, the orthologous human transcript, is functionally equivalent to mouse Cerox1 in regulating mitochondrial complex I activity. Similar to mouse Cerox1, human CEROX1 is highly expressed in brain tissue, is otherwise ubiquitously expressed (Figure 1—figure supplement 1B), and is enriched in the cytoplasm of human embryonic kidney (HEK293T) cells (Figure 7A). CEROX1 is expressed in human tissues at unusually high levels: it occurs among the top 0.3% of all expressed lncRNAs (Figure 7B) and its average expression is higher than 87.5% of all protein coding genes (GTEx Consortium, 2017). Its expression is highest within brain tissues, particularly within the basal ganglia and cortex (Figure 7C).
Figure 7
Human CEROX1 modulates complex I activity in mouse cells.
(A) CEROX1 is enriched in the cytoplasm. Error bars s.e.m. n = 4 biological replicates. (B) Relative levels of lncRNA (blue) and protein-coding gene (grey) expression across individuals and tissues in human. The black arrow indicates the expression level of CEROX1 in the set of 5161 lncRNAs. RPKM: reads per kilobase per million reads. (C) Average expression levels of CEROX1 in human tissues. Blue bars highlight neurological tissues used to build the inset graph. The inset graphic represents the comparison of gene expression variation among individuals for neurological tissues: 1–Putamen, 2-Caudate nucleus, 3-Nucleus accumbens, 4–Cortex, 5-Substantia nigra, 6–Amygdala, 7–Hippocampus, 8-Spinal cord, 9-Anterior cingulate cortex, 10-Frontal cortex, 11–Hypothalamus, 12-Tibial nerve, 13–Cerebellum, 14–Pituitary gland, 15-Cerebellar hemisphere. (D) OXPHOS enzyme activities in human HEK293T cells after 72 hr of CEROX1 overexpression. Overexpression of CEROX1 results in significant increases in the activities of complexes I (31% increase) and III (18% increase), with no significant change in other enzyme activities. n = 8 biological replicates. 2-sided t-test: p<0.01, ns = not significant. (E) Oxygen consumption, as measured on a Seahorse XFe24 Analyzer, by HEK293T cells overexpressing CEROX1. Top: normalised real time oxygen consumption rate in basal conditions and after sequential injections of oligomycin, FCCP and rotenone/antimycin A. Bottom: changes in basal, ATP-linked and maximum uncoupled respiration respectively. Error bars s.e.m. n = 6 biological replicates. (F) Reciprocal overexpression of mouse Cerox1 in human HEK293T cells or human CEROX1 in mouse N2A cells results in elevated complex I activity. n = 8 biological replicates. 2-sided t-test: ***p<0.001, **p<0.01, ns = not significant.
-
Figure 7—source data 1
HEK293T CEROX1 overexpression specific enzyme assays - Figure 7D.
- https://doi.org/10.7554/eLife.45051.024
-
Figure 7—source data 2
HEK293T CEROX1 overexpression seahorse bioanalyzer - Figure 7E.
- https://doi.org/10.7554/eLife.45051.025
-
Figure 7—source data 3
Reciprocal overexpression, complex I and citrate synthase assay - Figure 7F.
- https://doi.org/10.7554/eLife.45051.026
Importantly, mitochondrial complexes’ I and III activities increased significantly following CEROX1 overexpression in HEK293T cells (Figure 7D). CEROX1 overexpression had a greater effect on complex I activity than the mouse orthologous sequence and also increased the activity of complex III, rather than complex IV activity, in these cells. In addition to these observed increases in enzyme activity, basal respiration increased by 35%, ATP-linked respiration increase by 31% and maximum uncoupled respiration increased by 31% (p=0.02, p=0.04, p=0.01 respectively, 2-tailed Student’s t-test; Figure 7E). The latter distinction could reflect the differences in miRNA pools between mouse and human cell lines and/or the presence of different MREs in the lncRNA and human OXPHOS transcripts.
Strikingly, either reciprocal expression of mouse Cerox1 in human HEK293T cells or human CEROX1 in mouse N2A cells, recapitulates the previously observed increase in complex I activity (Figure 7F). This effect of mouse Cerox1 overexpression in mouse N2A cells is greater than for human CEROX1 overexpression in these cells. The role of both Cerox1 and CEROX1 in modulating the activity of mitochondrial complex I has thus been conserved over 90 million years since the last common ancestor of mouse and human.
Discussion
Cerox1 is the first evolutionarily conserved lncRNA to our knowledge that has been demonstrated experimentally to regulate mitochondrial energy metabolism. Its principal location in N2A cells is in the cytoplasm (Figure 1F) where it post-transcriptionally regulates the levels of mitochondrial OXPHOS subunit transcripts and proteins by decoying for miRNAs (Figure 5—figure supplement 1), most particularly miR-488–3p. This microRNA shares with Cerox1 an early eutherian origin and elevated expression in brain samples (Landgraf et al., 2007), and it previously was shown to alter mitochondrial dynamics in cancer cells (Yang et al., 2017). Changes in Cerox1 abundance in vitro alter mitochondrial OXPHOS subunit transcript levels and, more importantly, elicit larger changes in their protein subunits levels, leading to unexpectedly large changes in mitochondrial complex I catalytic activity. The observed changes in catalytic activity are in line with the degree of change seen in diseases exhibiting mitochondrial dysfunction (Schapira et al., 1990; Ritov et al., 2005; Andreazza et al., 2010). Overexpression of Cerox1 in N2A cells increases oxidative metabolism, halves cellular oxidative stress and enhances protection against the complex I inhibitor rotenone. The effect of Cerox1 on complex I subunit transcript levels can be explained by their sharing MREs with Cerox1, and subsequent competition for miRNA binding, most notably for miR-488–3p, which buffers the OXPHOS transcripts against miRNA-mediated repression.
Multiple RNA transcripts have been experimentally shown to compete with mRNAs for binding to miRNAs, thereby freeing the protein coding mRNA from miRNA-mediated repression (Cesana et al., 2011; Karreth et al., 2011; Sumazin et al., 2011; Tay et al., 2011; Karreth et al., 2015; Tan et al., 2014). It has been experimentally demonstrated that this miRNA:RNA regulatory crosstalk can initiate rapid co-ordinate modulation of transcripts whose proteins participate within the same complex or process (Tan et al., 2014). Physiological relevance of this crosstalk mechanism remains incompletely understood. Furthermore, mathematical modelling (Ala et al., 2013; Figliuzzi et al., 2013; Martirosyan et al., 2016) and experimental investigation (Bosson et al., 2014; Denzler et al., 2014) of the dynamics and mechanism of endogenous transcript competition for miRNA binding have resulted in contrasting conclusions. Current mathematical models do not take full account of miRNA properties, such as the repressive effect not being predictable from its cellular abundance (Mullokandov et al., 2012), intracellular localisation such as at the rough ER (Stalder et al., 2013), loading on the RNA-induced silencing complex (RISC) (Flores et al., 2014), or AGO2’s phosphorylation status within the RISC (Golden et al., 2017). The conclusions of experiments have also assumed that all miRNA target transcripts that contain the same number and affinity of miRNA binding sites are equivalent, that steady-state measurements are relevant to repression dynamics, and that observations for one miRNA in one experimental system are equally applicable to all others (Smillie et al., 2018).
Considered together, our lines of experimental evidence indicate that miRNA-mediated target competition by Cerox1 substantially perturbs a post-transcriptional gene regulatory network that includes at least 12 complex I subunit transcripts. This is consistent with the expression level of miR-488–3p (Kozomara and Griffiths-Jones, 2014) and the high in vivo expression of both Cerox1 and OXPHOS transcripts (Schwanhäusser et al., 2011; Vogel et al., 2010). Human CEROX1 levels, for example, exceed those of all complex I subunit transcripts (those in Figure 6a) in both newly-formed and myelinating oligodendrocytes (Forrest et al., 2014). Cerox1 could maintain OXPHOS homeostasis in cells with sustained high metabolic activity and high energy requirements. Such cells occur in the central nervous system, in which Cerox1 levels are high (Sokoloff, 1977), and in haematopoiesis where depletion of Cerox1 results in B cell depletion or myeloid enrichment (Delás et al., 2019).
Our experiments demonstrate that post-transcriptional regulation of a subset of complex I subunits by Cerox1 leads to elevated oxygen consumption. How consumption increases when there is a higher abundance of only a subset of OXPHOS transcripts remains unclear. However, this phenomenon has been observed previously in mouse dopaminergic neurons (Alvarez-Fischer et al., 2011) and primary mouse embryonic fibroblasts and pinnal tissues (Shyh-Chang et al., 2013). Our observation of increased enzymatic activity may relate to the formation, by the complexes of the respiratory chain, of higher order supercomplexes (Schägger and Pfeiffer, 2000; Genova and Lenaz, 2014). Alternatively, the observed increases in OXPHOS activity may reflect some subunits of the complex I holo-enzyme (including NDUFS3 and NDUFA2) being present as a monomer pool and therefore being available for direct exchange without integration into assembly intermediates (Dieteren et al., 2012). This monomer pool facilitates the rapid swapping out of oxidatively damaged complex I subunits (Dieteren et al., 2012). It is thus possible that Cerox1-mediated expansion of the monomer pool thereby improves complex I catalysis efficiency (Figure 8). However, we note that overexpression of Cerox1 results in the differential expression of 286 genes, most (83%) of which are upregulated. These genes’ transcripts will be both the targets of miR-488–3p decoying by Cerox1 (Figure 6) and those whose upregulation is secondary to Cerox1 (and miR-488–3p) mediated effects, for example relating to the observed changes in cellular metabolism and proliferation (Figure 2—figure supplement 1I,J,K).
Figure 8
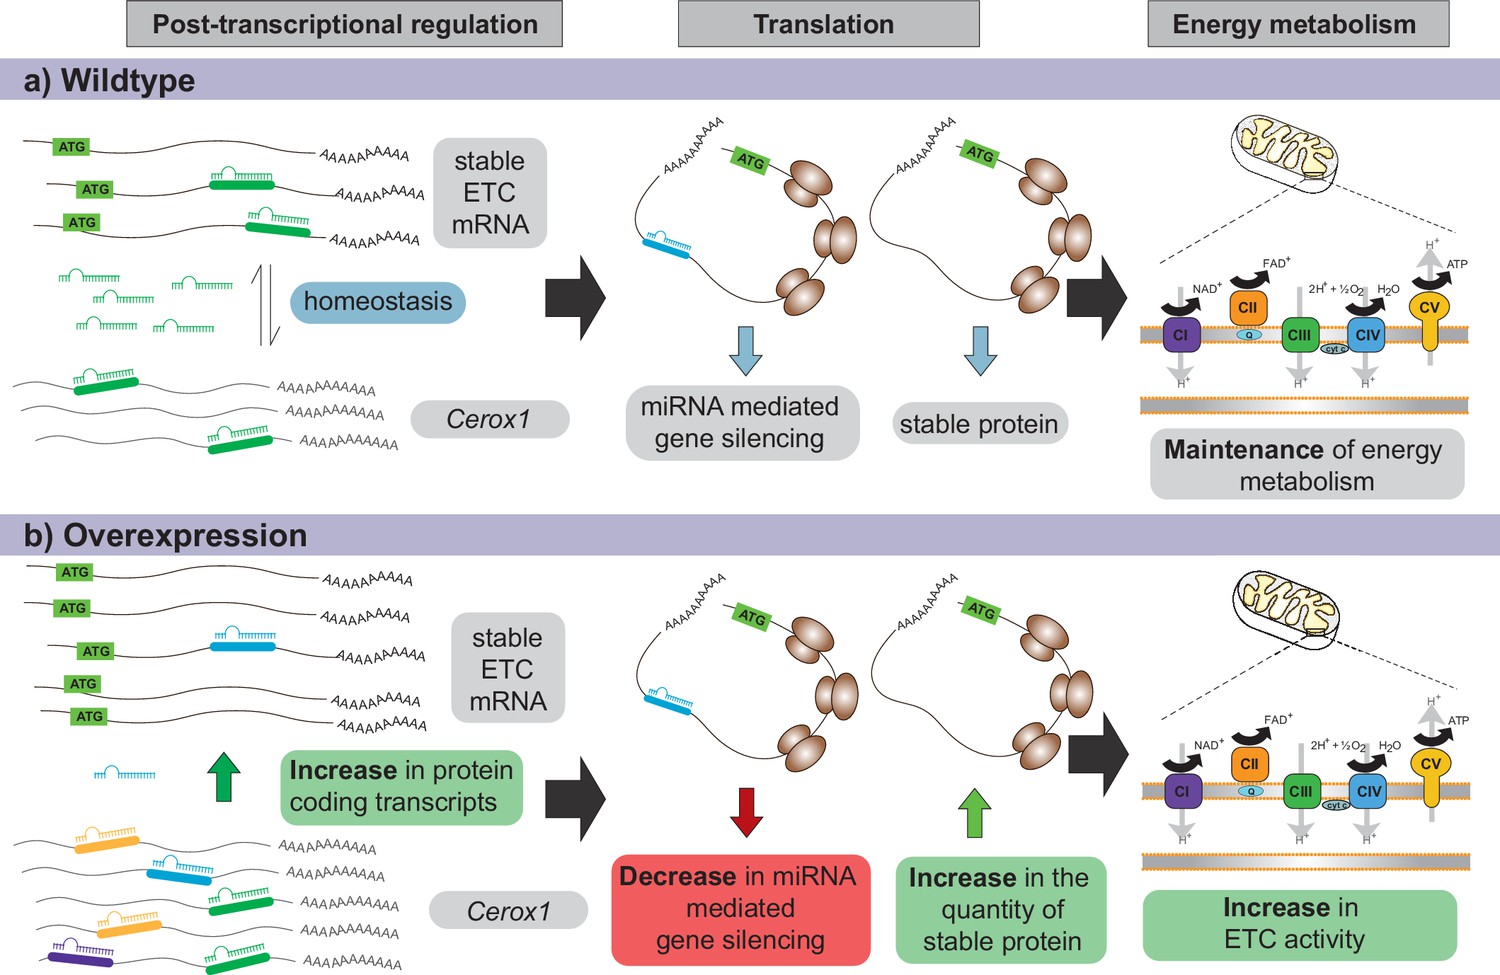
Proposed model for Cerox1 as a post-transcriptional regulator of mitochondrial protein production and energy metabolism.
In this model, Cerox1 (A) post-transcriptionally maintains energy metabolism homeostasis through buffering the stable ETC transcripts against miRNA-mediated gene silencing. Overexpression of Cerox1 (B) leads to a depletion of the pool of miRNAs that bind ETC transcripts, and therefore a decrease in miRNA mediated gene silencing of the ETC protein-coding transcripts. This has two subsequent effects: (1) a further accumulation of ETC protein coding transcripts, and (2) an increase in the overall translation of ETC subunit proteins owing to decreased miRNA binding to ETC transcripts. More rapid replenishment by undamaged subunits in mitochondrial complex I, leads to increased efficiency of complex I activity and hence an increase in overall oxygen consumption of the ETC.
More efficient ETC enzymatic activity might be relevant to mitochondrial dysfunction, a feature of many disorders that often manifests as decreases in the catalytic activities of particular mitochondrial complexes. A decrease in catalytic activity can result in elevated ROS production, leading to oxidative damage of lipids, DNA, and proteins, with OXPHOS complexes themselves being particularly susceptible to such damage (Musatov and Robinson, 2012). Parkinson’s and Alzheimer’s diseases both feature pathophysiology associated with oxidative damage resulting from increased ROS production and a cellular energy deficit associated with decreased complex I and IV activities (a reduction of 30% and 40%, respectively) (Schapira et al., 1990; Keeney et al., 2006; Canevari et al., 1999). A deficiency in complexes II, III and to a lesser extent complex IV, has also been described in Huntington disease (Mochel and Haller, 2011). Currently no effective treatments exist that help to restore mitochondrial function despite demonstration that a 20% increase in complex I activity protects mouse midbrain dopaminergic neurons against MPP+, a complex I inhibitor and a chemical model of Parkinson’s disease (Alvarez-Fischer et al., 2011). We note that the highest expression of CEROX1 occurs primarily in the basal ganglia (Figure 7C inset) regions of which are specifically vulnerable to the progressive neurological disorders Parkinson’s (substantia nigra pars compacta) and Huntington’s diseases (striatum: caudate and putamen). The specific energy demands of these neurons may make them particularly susceptible to damage due to an energy deficit. For instance, the dopaminergic neurons of the substantia nigra, which are especially sensitive to degeneration in Parkinson’s disease, have unusually large axonal arbours that require tight regulation of cellular energy to maintain (Bolam and Pissadaki, 2012). In addition, the medium spiny neurons of the striatum, which preferentially degenerate in Huntington disease, exhibit a high degree of axonal collateralization – a morphological trait which implies high cellular energy consumption for its maintenance (Parent and Parent, 2006) – therefore causing these cells to be vulnerable to decreased cellular ATP production. CEROX1’s ability to increase mitochondrial complex I activity might be recapitulated pharmacologically to restore mitochondrial function, as an exemplar of therapeutic upregulation of gene expression (Wahlestedt, 2013).
Materials and methods
Key resources table
| Reagent type (species) or resource | Designation | Source or reference | Identifiers | Additional information |
|---|---|---|---|---|
| Gene (Mus musculus) | Cerox1 | NA | AK079380; 2810468N07Rik; ENSMUST00000163493 | |
| Gene (Homo sapiens) | CEROX1 | NA | BC098409; RP11-161M6.2; ENST00000562570 | |
| Cell line (Mus musculus) | N2A (mouse neuroblastoma cells) | European Collection of Authenicated Cell Cultures (ECACC) | RRID: CVCL_0470; ECACC: 89121404 | |
| Cell line (Homo sapiens) | HEK293T (human embryonic kidney cells) | European Collection of Authenicated Cell Cultures (ECACC) | RRID: CVCL_0063; ECACC 12022001 | |
| Transfected construct (Mus musculus and Homo sapiens) | pCAG-GFP | https://www.addgene.org/89684/ | RRID:Addgene_89684 | This backbone was modified for overexpression of Cerox1, Cerox1 MRE mutants and CEROX1 |
| Transfected construct (Mus musculus) | BLOCK-it U6 shRNA expression construct | Invitrogen | K494500 | |
| Transfected construct (Mus musculus) | BLOCK-iT Pol II miR RNAi expression vector | Invitrogen | K493600 | |
| Antibody | anti-NDUFS1, rabbit monoclonal | Abcam | RRID: AB_2687932; ab169540 | Overnight, four degrees (1:30,000) |
| anti-NDUFS3, mouse monoclonal | Abcam | RRID:AB_10861972; ab110246 | Overnight, four degrees, 0.15 mg/ml | |
| anti-alpha tubulin, mouse monoclonal | Abcam | RRID:AB_2241126; ab7291 | Overnight, four degrees (1:30,000) | |
| goat anti-rabbit HRP, goat polyclonal | Invitrogen | RRID:AB_2536530; G-21234 | Room temperature,1 hr (1:30,000) | |
| goat anti-mouse HRP, goat polyclonal | Dako | RRID:AB_2617137; P0447 | Room temperature,1 hr (1:3,000) | |
| Recombinant DNA reagent | Fugene6 | Promega | E2691 | |
| Commercial assay or kit | Amplex Red Hydrogen Peroxide/Peroxidase Assay Kit | Thermofisher | A22188 | |
| OxyBlot protein oxidation detetion kit | Merck Millipor | S7150 | ||
| QuantiGene ViewRNA miRNA ISH cell assay kit | Affymetrix | QVCM0001 | ||
| Chemical compound, drug | Rotenone | Sigma Aldrich | R8875-5G | |
| Antimycin A | Sigma Aldrich | A8674-25MG | ||
| Sodium Azide | Sigma Aldrich | S8032-25G | ||
| Oligomycin | Sigma Aldrich | 75351–5 MG | ||
| NADH (reduced) | Sigma Aldrich | N8129-1G | ||
| coenzyme Q | Sigma Aldrich | C7956-2mg | ||
| Fatty acid free albumin | Sigma Aldrich | A8806-1G | ||
| Sodium succinate | Sigma Aldrich | S5047-100G | ||
| Dichlorophenolindophenol (DCPIP) | Sigma Aldrich | 33125–5 G-R | ||
| Decylubiquinone | Sigma Aldrich | D7911-10mg | ||
| cytochrome c | Sigma Aldrich | C7752 | ||
| Carbonyl cyanide 4(trifluoromethoxy)phenylhydrazone | Sigma Aldrich | C2920-10mg | ||
| miRNA inhibitors | Ambion | 4464084 | ||
| miRCURY LNA biotinylated miRNAs | Exiqon | 339178 | ||
| Software, algorithm | TargetScan v7.0 | Agarwal et al., 2015 | DOI: 10.7554/eLife.05005 |
Gene expression profiling
Request a detailed protocolThe lncRNA transcripts were assessed for coding potential using the coding potential calculator (Kong et al., 2007), PhyloCSF (Lin et al., 2011) and by mining proteomics and small open reading frame resources for evidence of translation (Wilhelm et al., 2014; Kim et al., 2014a; Bazzini et al., 2014). A lack of protein-coding potential for human CEROX1 (also known as RP11-161M6.2, LMF1-3) is supported by a variety of computational and proteomic data summarised in LNCipedia (Volders et al., 2015). Expression data from somite-staged mouse embryos were acquired from ArrayExpress (E-ERAD-401 - Strand-specific RNA-seq of somite-staged second generation genotypically wild-type embryos of mixed G0 lineage from the Mouse Genetics Project/DMDD). Genome wide associations were performed on the UK Biobank data as described in Canela-Xandri et al. (2018) using data from up to 452,264 individuals.
Total RNA from twenty normal human tissues (adipose, bladder, brain, cervix, colon, oesophagus, heart, kidney, liver, lung, ovary, placenta, prostate, skeletal muscle, small intestine, spleen, testes, thymus, thyroid and trachea) were obtained from FirstChoice Human Total RNA Survey Panel (Invitrogen). Total RNA from twelve mouse tissues (bladder, brain, colon, heart, kidney, liver, pancreas, skeletal muscle, small intestine, stomach and testis) were obtained from Mouse Tissue Total RNA Panel (Amsbio). RNA from cell lines was extracted using the RNeasy mini kit (Qiagen) according to the manufacturer’s instructions, using the optional on column DNase digest. cDNA synthesis for all samples was performed on 1 μg of total RNA using a QuantiTect Reverse Transcription kit (Qiagen) according to the manufacturer’s instructions. RNA was extracted from samples used for the detection of miRNAs using the miRNeasy mini kit (Qiagen) according to the manufacturer’s instructions (with on column DNase digest). All RNA samples were quantified using the 260/280 nm absorbance ratio, and RNA quality assessed using a Tapestation (Agilent). RNA samples with an RNA integrity number (RIN) >8.5 were reverse transcribed. 1 μg of total RNA from the miRNA samples were reverse transcribed using the NCode VILO miRNA cDNA synthesis kit. Expression levels were determined by real-time quantitative PCR, using SYBR Green Master Mix (Applied Biosystems) and standard cycling parameters (95°C 10 min; 40 cycles 95°C 15 s, 60°C 1 min) followed by a melt curve using a StepOne thermal cycler (Applied Biosystems). All amplification reactions were performed in triplicate using gene specific primers. Multiple reference genes were assessed for lack of variability using geNorm (Vandesompele et al., 2002). Human expression data were normalised to TUBA1A and POLR2A, whilst mouse expression data were normalised to Tbp and Polr2a. Oligonucleotide sequences are provided in Supplementary file 4.
Tissue culture and flow cytometry
Request a detailed protocolMouse Neuro-2a neuroblastoma cells (N2A; RRID: CVCL_0470; ECACC 89121404) and human embryonic kidney (HEK293T; RRID: CVCL_0063; ECACC 12022001) were sourced from the European authenticated cell culture collection. HEK293T cells were confirmed by STR profiling and cell lines were tested monthly for mycoplasma contamination. Cells were grown at 37°C in a humidified incubator supplemented with 5% CO2. Both cell lines were grown in Dulbecco’s modified Eagle medium containing penicillin/streptomycin (100 U/ml, 100 ug/ml respectively) and 10% fetal calf serum. Cells were seeded at the following densities: six well dish, 0.3 × 10⁶; 48 well dish, 0.2 × 10⁴; T75 flask 2.1 × 10⁶. We had three reasons for the choice of HEK293T cells for this experiment. First, they are of neural crest ectodermal origin (Lin et al., 2014) and therefore have a number of neural cell line characteristics in that they express neuronal markers (Shaw et al., 2002). Second, they are in use as a cell culture model for neurodegenerative diseases such as Parkinson’s disease (Falkenburger et al., 2016; Schlachetzki et al., 2013). Third, HEK293T cells are a widely used cell line to interrogate human mitochondrial biochemistry, and exhibit complex I dependent respiration (Kim et al., 2014b). Mouse embryonic stem cells and dicer knock-out embryonic stem cells were maintained as described previously (Nesterova et al., 2008). Cells were counted using standard haemocytometry. For flow cytometry the cells were harvested by trypsinization, washed twice with PBS and fixed in 70% ethanol (filtered, −20°C). The cell suspension was incubated at 4°C for 10 min and the cells pelleted, treated with 40 μg/ml RNase A and propidium iodide (40 μg/ml) for 30 min at room temperature. Cells were analysed using a FACSCalibur (BD-Biosciences) flow cytometer.
Fluorescent in situ hybridization of miRNA and lncRNA, cellular fractionation and RNA turnover
Request a detailed protocolBranched chain DNA probes to Cerox1, Malat1 and mmu-miR-488–3p were sourced from Affymetrix. The protocol was preformed according to the manufacturer’s instructions using the QuantiGene ViewRNA miRNA ISH cell assay kit (QVCM0001) for adherent cells. The following parameters were optimised: cells were fixed in 4% formaldehyde for 45 min and a 1:2000 dilution of the protease was optimal for the N2A cells. Cells were imaged using an Andor Dragonfly confocal inverted microscope, and images acquired using an Andor Zyla 4.2 plus camera.
Cells were fractionated into nuclear and cytoplasmic fractions in order to determine the predominant cellular localization of lncRNA transcripts. Briefly, approximately 2.8 × 10⁶ cells were collected by trypsinization, washed three times in PBS and pelleted at 1000 g for 5 min at 4°C. The cell pellet was resuspended in 5 volumes of lysis buffer (10 mM Tris-HCl, pH 7.5, 3 mM MgCl2, 10 mM NaCl, 5 mM EGTA, 0.05% NP40, and protease inhibitors [Roche, complete mini]) and incubated on ice for 15 min. Lysed cells were then centrifuged at 2000 g for 10 min at 4°C, and the supernatant collected as the cytoplasmic fraction. Nuclei were washed three times in nuclei wash buffer (10 mM HEPES, pH 6.8, 300 mM sucrose, 3 mM MgCl2,25 mM NaCl, 1 mM EGTA), and pelleted by centrifugation at 400 g, 1 min at 4°C. Nuclei were extracted by resuspension of the nuclei pellet in 200 μl of nuclei wash buffer containing 0.5% Triton X-100 and 700 units/ml of DNase I and incubated on ice for 30 mins. Nucleoplasm fractions were collected by centrifugation at 17 000 g for 20 min at 4°C. RNA was extracted as described above, and RNA samples with RIN values > 9.0 used to determine transcript localisation.
To determine the stability of the lncRNA transcripts, cells were cultured to ~50% confluency and then transcription was inhibited by the addition of 10 μg/ml actinomycin D (Sigma) in DMSO. Control cells were treated with equivalent volumes of DMSO. Transcriptional inhibition of the N2A cells was conducted for 16 hr with samples harvested at 0 hr, 30 mins, 1 hr, 2 hr, 4 hr, 8 hr and 16 hr. RNA samples for fractionation and turnover experiments were collected in Trizol (Invitrogen) and RNA purified and DNAse treated using the RNeasy mini kit (Qiagen). Reverse transcription for cellular localisation and turnover experiments was performed as described earlier.
Constructs and biotinylated miRNAs
Request a detailed protocolThe 5’ and 3’ ends of Cerox1 and CEROX1 were identified by 5’ and 3’ RACE using the GeneRacer Kit (Invitrogen) according to manufacturer’s instructions. As an overexpression/transfection control the pCAG-EGFP backbone was used (RRID:Addgene_89684). The EGFP was removed from this backbone, and all full length lncRNAs were cloned into the pCAG backbone. For cloning into the pCAGs vector, PCR primers modified to contain the cloning sites BglII and XhoI sites were used to amplify the full length mouse Cerox1, whilst human CEROX1 and the mouse 5x MRE mutant were synthesized by Biomatik (Cambridge, Ontario), and also contained BglII and XhoI sites at the 5’ and 3’ ends respectively. All other MRE mutants were produced using overlapping PCR site directed mutagenesis to mutate 3 bases of the miRNA seed region. All purified products were ligated into the prepared backbone and then transformed by heat shock into chemically competent DH5α, and plated on selective media. All constructs were confirmed by sequencing. Short hairpin RNAs specific to the transcripts were designed using a combination of the RNAi design tool (Invitrogen) and the siRNA selection program from the Whitehead Institute (Yuan et al., 2004). Twelve pairs of shRNA oligos to the target genes and β-galactosidase control oligos were annealed to create double-stranded oligos and cloned into the BLOCK-iT U6 vector (Invitrogen), according to the manufacturer’s instructions. miRNA expression constructs were generated and cloned into the BLOCK-iT Pol II miR RNAi expression vector (Invitrogen) according to the manufacturer’s instructions. miRNA inhibitors were sourced from Ambion and used according to manufacturer’s instructions.
Transfection efficiency was initially assessed by FACS, and the optimised transfection protocol used for all further assays (6:1 transfection reagent to DNA ratio). One day prior to transfection cells were either seeded in six well dishes (0.3 × 10⁶ cells/well), or in T75 flasks (2.1 × 10⁶ cells/flask). Twenty-four hours later cells in six well dishes were transfected with 1 μg of shRNA, miRNA or overexpression construct and their respective control constructs using FuGENE 6 (Promega) according to the manufacturer’s guidelines. Cells in T75 flasks were transfected with 8 μg of experimental or control constructs. Transfected cells were grown for 48-72 hrs under standard conditions, and then harvested for either gene expression studies or biochemical characterisation. Efficacy of the overexpression and silencing constructs was determined by real-time quantitative PCR.
Transcripts for the luciferase destabilisation assays were cloned into the pmirGLO miRNA target expression vector (Promega) and assayed using the dual-luciferase reporter assay system (Promega). miRCURY LNA biotinylated miRNAs (mmu-miR-488–3p and mmu-negative control 4) were purchased from Exiqon, and direct mRNA-miRNA interactions were detected using a modified version of Orom and Lund (2007) and enrichment of targets was detected by qPCR.
Computational techniques
Request a detailed protocolMREs were predicted using TargetScan v7.0 (Agarwal et al., 2015; RRID: SCR_010845) in either the 3’UTR (longest annotated UTR, ENSEMBL build 70; RRID: SCR_002344) or the full length transcript of protein coding genes, and across the entire transcript for lncRNAs. The average expression across 46 human tissues and individuals according to the Pilot one data from the GTEx Consortium (Lonsdale et al., 2013; RRID:SCR_013042; 98) was computed for both protein-coding genes and intergenic lncRNAs from the Ensembl release 75 annotation (Flicek et al., 2014). We used the normalised number of CAGE tags across 399 mouse cells and tissues from the FANTOM5 Consortium (http://fantom.gsc.riken.jp; Kawaji et al., 2014) as an approximation of expression levels for protein-coding genes and intergenic lncRNAs from the Ensembl release 75 annotation. If multiple promoters were associated with a gene, we selected the promoter with the highest average tag number. Conserved sequence blocks in the lncRNA sequences were identified using LALIGN (Goujon et al., 2010).
Microarray analysis
Request a detailed protocolMicroarray analysis was performed on 16 samples (four overexpression/four overexpression controls; four knock-down/four knock-down controls), and hybridizations were performed by the OXION array facility (University of Oxford). Data were analysed using the web-based Bioconductor interface, CARMAweb (Rainer et al., 2006). Differentially expressed genes (Bonferroni corrected p-value<0.05) were identified between mouse lncRNA overexpression and control cells using Limma from the Bioconductor package between the experimental samples and the respective controls. Microarray data are accessible through ArrayExpress, accession E-MATB-6792.
Extraction of metabolites and liquid chromatography – mass spectrometry (LC-MS)
Request a detailed protocolMetabolites were extracted from 6-well plates by washing individual wells with ice-cold PBS and addition of cold extraction buffer (50% methanol, 30% acetonitrile, 20% water solution at −20°C or lower). Extracts were clarified and stored at −80°C until required. LC-MS was carried out using a 100 mm x 4.6 mm ZIC-pHILIC column (Merck-Millipore) using a Thermo Ultimate 3000 HPLC inline with a Q Exactive mass spectrometer. A 32 min gradient was developed over the column from 10% buffer A (20 mM ammonium carbonate), 90% buffer B (acetonitrile) to 95% buffer A, 5% buffer B. 10 μl of metabolite extract was applied to the column equilibrated in 5% buffer A, 95% buffer B. Q Exactive data were acquired with polarity switching and standard ESI source and spectrometer settings were applied (typical scan range 75–1050). Metabolites were identified based upon m/z values and retention time matching to standards. Quantitation of metabolites was carried out using AssayR (Wills et al., 2017). Data were normalised using levels of 9 essential amino acids (histidine, isoleucine, leucine, lysine, methionine, phenylalanine, threonine, tryptophan, valine), and errors propagated, in order to account for cell count differences.
Western blots
Request a detailed protocolTotal protein was quantified using a BCA protein assay kit (Pierce). 10 μg of protein was loaded per well, and samples were separated on 12% SDS-PAGE gels in Tris-glycine running buffer (25 mM Tris, 192 mM glycine, 0.1% SDS). Proteins were then electroblotted onto PVDF membrane (40V, 3 hr) in transfer buffer (25 mM Tris-HCl, 192 mM glycine, 20% methanol), the membrane blocked in TBS-T (50 mM Tris-HCl, 150 mM NaCl, 0.1% Tween 20) with 5% non–fat milk powder for 1 hr. The membrane was incubated with primary antibodies overnight at 4°C with the following dilutions: anti-NDUFS1 (RRID: AB_2687932; rabbit monoclonal, ab169540, 1:30,000), anti-NDUFS3 (RRID:AB_10861972; mouse monoclonal, 0.15 mg/ml, ab110246), or anti-alpha tubulin loading control (RRID: AB_2241126; mouse monoclonal, ab7291, 1:30,000). Following incubation with the primary antibodies, blots were washed 3 × 5 min, and 2 × 15 mins in TBS-T and incubated with the appropriate secondary antibody for 1 hr at room temperature: goat anti-rabbit HRP (RRID:AB_2536530; Invitrogen G-21234) 1:30,000; goat anti-mouse HRP (RRID:AB_2617137; Dako P0447) 1:3000. After secondary antibody incubations, blots were washed and proteins of interested detected using ECL prime chemiluminescent detection reagent (GE Healthcare) and the blots imaged using an ImageQuant LAS 4000 (GE Healthcare). Signals were normalised to the loading control using ImageJ (Schneider et al., 2012).
Oxidative phosphorylation enzyme assays and oxygen consumption
Request a detailed protocolCell lysates were prepared 48 hr post-transfection, by harvesting cells by trypsinisation, washing three times in ice cold phosphate buffered saline followed by centrifugation to pellet the cells (two mins, 1000 g). Cell pellets were resuspended to homogeneity in KME buffer (100 mM KCl, 50 mM MOPS, 0.5 mM EGTA, pH 7.4) and protein concentrations were determined using a BCA protein assay detection kit (Pierce). Cell lysates were flash frozen in liquid nitrogen, and freeze-thawed three times prior to assay. 300–500 μg of cell lysate was added per assay, and assays were normalised to the total amount of protein added.
All assays were performed using a Shimadzu UV-1800 spectrophotometer, absorbance readings were taken every second and all samples were measured in duplicate. Activity of complex I (CI, NADH:ubiquinone oxidoreductase) was determined by measuring the oxidation of NADH to NAD+ at 340 nm at 30°C in an assay mixture containing 25 mM potassium phosphate buffer (pH 7.2), 5 mM MgCl2,2.5 mg/ml fatty acid free albumin, 0.13 mM NADH, 65 μM coenzyme Q and 2 μg/ml antimycin A. The decrease in absorbance was measured for 3 mins, after which rotenone was added to a final concentration of 10 μM and the absorbance measured for a further 2 mins. The specific complex I rate was calculated as the rotenone-sensitive rate minus the rotenone-insensitive rate. Complex II (CII, succinate dehydrogenase) activity was determined by measuring the oxidation of DCPIP at 600 nm at 30°C. Lysates were added to an assay mixture containing 25 mM potassium phosphate buffer (pH 7.2) and 2 mM sodium succinate and incubated at 30°C for 10 mins, after which the following components were added, 2 μg/ml antimycin A, 2 μg/ml rotenone, 50 μM DCPIP and the decrease in absorbance was measured for 2 mins. Complex III (CIII, Ubiquinol:cytochrome c oxidoreductase) activity was determined by measuring the oxidation of decylubiquinol, with cytochrome c as the electron acceptor at 550 nm. The assay cuvettes contained 25 mM potassium phosphate buffer (pH 7.2), 3 mM sodium azide, 10 mM rotenone and 50 μM oxidized cytochrome c. Decylubiquinol was synthesized by acidifying decylubiquinone (10 mM) with HCl (6M) and reducing the quinine with sodium borohydride. After the addition of 35 μM decylubiquinol, the increase in absorbance was measured for 2 mins. Activity of Complex IV (CIV, cytochrome c oxidase) was measured by monitoring the oxidation of cytochrome c at 550 nm, 30°C for 3 min. A 0.83 mM solution of reduced cytochrome c was prepared by dissolving 100 mg of cytochrome c in 10 ml of potassium phosphate buffer, and adding sodium ascorbate to a final concentration of 5 mM. The resulting solution was added into SnakeSkin dialysis tubing (7 kDa molecular weight cutoff, Thermo Scientific) and dialyzed against potassium phosphate buffer, with three changes, at 4°C for 24 hr. The redox state of the cytochrome c was assessed by evaluating the absorbance spectra from 500 to 600 nm. The assay buffer contained 25 mM potassium phosphate buffer (pH 7.0) and 50 μM reduced cytochrome c. The decrease in absorbance at 550 nm was recorded for 3 mins. As a control the enzymatic activity of the tricarboxylic acid cycle enzyme, citrate synthase (CS) was assayed at 412 nm at 30°C in a buffer containing 100 mM Tris-HCl (pH 8.0), 100 μM DTNB (5,5-dithiobis[2-nitrobenzoic acid]), 50 μM acetyl coenzyme A, 0.1% (w/v) Triton X-100 and 250 μM oxaloacetate. The increase in absorbance was monitored for 2 mins.
The following extinction coefficients were applied: complex I (CI), ε = 6220 M−1 cm−1, CII, ε = 21,000 M−1 cm−1; CIII, ε = 19,100 M−1 cm−1; CIV, ε = 21,840 M−1 cm−1 (the difference between reduced and oxidised cytochrome c at 550 nm); CS, ε = 13,600 mM−1 cm−1.
Cellular oxygen consumption rate was determined using the Seahorse XFe24 Analyzer (Agilent). Cells were plated on poly-L-lysine coated XFe24 microplates at 50,000 cells per well and incubated at 37°C and 5% CO2 for 24 hr. Cells were transfected with an overexpression (pCAG-Cerox1 or pCAG-CEROX1) or the Cerox1 shRNA silencing construct and assayed 24–36 hr later. Cells were washed three times with Seahorse Assay media (Agilent), supplemented with 10 mM glucose and 2 mM pyruvate. After 30 min of pre-incubation in a non-CO2 37°C incubator, cells were entered into the analyser for oxygen consumption rate measurements. After basal respiration measurements, 1 μM of oligomycin was injected to inhibit ATP synthase, then 0.2 μM of carbonyl cyanide 4-(trifluoromethoxy)phenylhydrazone (FCCP) was injected to uncouple respiration. Finally 1 μM each of rotenone and antimycin A were injected to inhibit complex I and complex III respectively. Data was normalised to total cellular protein content using the sulforhodamine B assay (Skehan et al., 1990). Basal respiration, ATP linked respiration and maximum uncoupled respiration were calculated from the normalised data using the Agilent Seahorse XF calculation guidelines. Briefly, basal respiration = measurement 3 (last rate measurement before oligomycin injection) – measurement 10 (minimum respiration after injection of rotenone/antimycin A); ATP-linked respiration = measurement 3 – measurement 4 (minimum rate measurement after oligomycin injection); maximum uncoupled respiration = measurement 7 (maximum rate after FCCP injection) – measurement 10.
Oxidative stress measurements
Request a detailed protocolHydrogen peroxide production was assessed as a marker of reactive oxygen species generation using the fluorescent indicator Amplex Red (10 μM, Invitrogen) in combination with horseradish peroxidise (0.1 units ml−1). Total amount of H2O2 produced was normalised to mg of protein added. Protein carbonylation was assessed using the OxyBlot protein oxidation detection kit (Merck Millipore), and differential carbonylation was assessed by densitometry. The cell stress assay was performed on cells seeded in 48 well plates, and assayed 12 hr later by the addition of (final concentration): rotenone (5 μM), malonate (40 μM), antimycin A (500 μM), oligomycin (500 μM), sodium azide (3 mM), NaCl (300 mM), CaCl2 (5.4 mM) for 1 hr. Cells were heat shocked at 42°C and UV irradiated using a Stratlinker UV Crosslinker for 10 min (2.4 J cm−2). Cell viability was assessed by the addition of Alamar Blue (Invitrogen) according to the manufacturer’s instructions.
Data availability
Microarray data are available through ArrayExpress, accession code E-MATB-6792.
-
ArrayExpressID E-MATB-6792. Investigation of potential gene regulatory or post-transcriptional regulatory function of a long noncoding RNA (Cerox1).
-
GTEx PortalID phs000424.v7.p2. The Genotype-Tissue Expression (GTEx) project.
-
FANTOM ConsortiumComparison of CAGE and RNA-seq transcriptome profiling using clonally amplified and single-molecule next-generation sequencing.
-
GeneATLASAn atlas of genetic associations in the UK Biobank.
References
-
Engrailed protects mouse midbrain dopaminergic neurons against mitochondrial complex I insultsNature Neuroscience 14:1260–1266.https://doi.org/10.1038/nn.2916
-
Regulation of the ESC transcriptome by nuclear long noncoding RNAsGenome Research 25:1336–1346.https://doi.org/10.1101/gr.189027.114
-
Living on the edge with too many mouths to feed: why dopamine neurons dieMovement Disorders 27:1478–1483.https://doi.org/10.1002/mds.25135
-
Subunit-specific incorporation efficiency and kinetics in mitochondrial complex I homeostasisJournal of Biological Chemistry 287:41851–41860.https://doi.org/10.1074/jbc.M112.391151
-
MicroRNAs and metabolism crosstalk in energy homeostasisCell Metabolism 18:312–324.https://doi.org/10.1016/j.cmet.2013.06.004
-
Cellular models for parkinson's diseaseJournal of Neurochemistry 139:121–130.https://doi.org/10.1111/jnc.13618
-
Differential RISC association of endogenous human microRNAs predicts their inhibitory potentialNucleic Acids Research 42:4629–4639.https://doi.org/10.1093/nar/gkt1393
-
Conserved principles of mammalian transcriptional regulation revealed by RNA half-lifeNucleic Acids Research 37:e115.https://doi.org/10.1093/nar/gkp542
-
Functional role of mitochondrial respiratory supercomplexesBiochimica Et Biophysica Acta (BBA) - Bioenergetics 1837:427–443.https://doi.org/10.1016/j.bbabio.2013.11.002
-
A new bioinformatics analysis tools framework at EMBL-EBINucleic Acids Research 38:W695–W699.https://doi.org/10.1093/nar/gkq313
-
Comparative analysis of the mitochondrial physiology of pancreatic β cellsBioenergetics : Open Access 3:110.https://doi.org/10.4172/2167-7662.1000110
-
CPC: assess the protein-coding potential of transcripts using sequence features and support vector machineNucleic Acids Research 35:W345–W349.https://doi.org/10.1093/nar/gkm391
-
miRBase: annotating high confidence microRNAs using deep sequencing dataNucleic Acids Research 42:D68–D73.https://doi.org/10.1093/nar/gkt1181
-
Assembly of mitochondrial complex I and defects in diseaseBiochimica Et Biophysica Acta 2009:78–88.https://doi.org/10.1016/j.bbamcr.2008.04.015
-
Control of mitochondrial activity by miRNAsJournal of Cellular Biochemistry 113:1104–1110.https://doi.org/10.1002/jcb.24004
-
The Genotype-Tissue Expression (GTEx) projectNature Genetics 45:580–585.https://doi.org/10.1038/ng.2653
-
Probing the limits to MicroRNA-Mediated control of gene expressionPLOS Computational Biology 12:e1004715.https://doi.org/10.1371/journal.pcbi.1004715
-
Systematic analysis of protein turnover in primary cellsNature Communications 9:689.https://doi.org/10.1038/s41467-018-03106-1
-
Prediction of microRNA targetsDrug Discovery Today 12:452–458.https://doi.org/10.1016/j.drudis.2007.04.002
-
Energy deficit in Huntington disease: why it mattersJournal of Clinical Investigation 121:493–499.https://doi.org/10.1172/JCI45691
-
How mitochondria produce reactive oxygen speciesBiochemical Journal 417:1–13.https://doi.org/10.1042/BJ20081386
-
Relationship between axonal collateralization and neuronal degeneration in basal gangliaJournal of Neural Transmission. Supplementum 70:85–88.
-
Five entry points of the mitochondrially encoded subunits in mammalian complex I assemblyMolecular and Cellular Biology 30:3038–3047.https://doi.org/10.1128/MCB.00025-10
-
Mitochondrial complex I deficiency leads to increased production of superoxide radicals and induction of superoxide dismutaseJournal of Clinical Investigation 98:345–351.https://doi.org/10.1172/JCI118798
-
CARMAweb: comprehensive R- and bioconductor-based web service for microarray data analysisNucleic Acids Research 34:W498–W503.https://doi.org/10.1093/nar/gkl038
-
Transcriptional integration of mitochondrial biogenesisTrends in Endocrinology & Metabolism 23:459–466.https://doi.org/10.1016/j.tem.2012.06.006
-
Supercomplexes in the respiratory chains of yeast and mammalian mitochondriaThe EMBO Journal 19:1777–1783.https://doi.org/10.1093/emboj/19.8.1777
-
Mitochondrial complex I deficiency in Parkinson's diseaseJournal of Neurochemistry 54:823–827.https://doi.org/10.1111/j.1471-4159.1990.tb02325.x
-
Studying neurodegenerative diseases in culture modelsRevista Brasileira de Psiquiatria 35 Suppl 2:S92–S100.https://doi.org/10.1590/1516-4446-2013-1159
-
NIH Image to ImageJ: 25 years of image analysisNature Methods 9:671–675.https://doi.org/10.1038/nmeth.2089
-
Preferential transformation of human neuronal cells by human adenoviruses and the origin of HEK 293 cellsFASEB Journal : Official Publication of the Federation of American Societies for Experimental Biology 16:869–871.https://doi.org/10.1096/fj.01-0995fje
-
Insights into the post-transcriptional regulation of the mitochondrial electron transport chainBiochemical Society Transactions 44:1491–1498.https://doi.org/10.1042/BST20160100
-
New colorimetric cytotoxicity assay for anticancer-drug screeningJNCI Journal of the National Cancer Institute 82:1107–1112.https://doi.org/10.1093/jnci/82.13.1107
-
Complexities of post-transcriptional regulation and the modeling of ceRNA crosstalkCritical Reviews in Biochemistry and Molecular Biology 53:231–245.https://doi.org/10.1080/10409238.2018.1447542
-
Improving miRNA-mRNA interaction predictionsBMC Genomics 15 Suppl 10:S2.https://doi.org/10.1186/1471-2164-15-S10-S2
-
Cross-talking noncoding RNAs contribute to cell-specific neurodegeneration in SCA7Nature Structural & Molecular Biology 21:955–961.https://doi.org/10.1038/nsmb.2902
-
Non-coding RNAs: the dark side of nuclear-mitochondrial communicationThe EMBO Journal 36:1123–1133.https://doi.org/10.15252/embj.201695546
-
An update on LNCipedia: a database for annotated human lncRNA sequencesNucleic Acids Research 43:D174–D180.https://doi.org/10.1093/nar/gku1060
-
Targeting long non-coding RNA to therapeutically upregulate gene expressionNature Reviews Drug Discovery 12:433–446.https://doi.org/10.1038/nrd4018
-
siRNA Selection Server: an automated siRNA oligonucleotide prediction serverNucleic Acids Research 32:W130–W134.https://doi.org/10.1093/nar/gkh366
-
Survey of Computational Algorithms for MicroRNA Target PredictionCurrent genomics 10:478–492.https://doi.org/10.2174/138920209789208219
Article and author information
Author details
Sebastian Rogatti-Granados

Ana Claudia Marques
Funding
Wellcome (WT106956/Z/15/Z)
- Tamara M Sirey
- Oscar Bedoya-Reina
- Sebastian Rogatti-Granados
- Chris P Ponting
European Research Council (249869)
- Tamara M Sirey
- Kenny Roberts
- Ana Claudia Marques
- Chris P Ponting
Medical Research Council
- Wilfried Haerty
- Chris P Ponting
Oxford University (The Clarendon Fund)
- Jennifer Y Tan
Natural Sciences and Engineering Research Council of Canada
- Jennifer Y Tan
Diabetes UK (11/0004175)
- Lisa C Heather
Wellcome (WT100981/z/13/z)
- Roderick N Carter
- Nicholas M Morton
European Commission (Marie Curie Intra-European Career Development Award)
- Ana Claudia Marques
Oxford University
- Ana Claudia Marques
Royal Society
- Ana Claudia Marques
The funders had no role in study design, data collection and interpretation, or the decision to submit the work for publication.
Acknowledgements
This work was funded by the Wellcome Trust (106956/Z/15/Z; CPP, TMS, OBR, SRG), a European Research Council Advanced Grant (DARCGENs; CPP, ACM, TMS, KR), the Medical Research Council (CPP, WH), a Marie Curie Intra-European Career Development Award (ACM), the University of Oxford (ACM), the Royal Society (ACM), the Clarendon Fund (JYT), the Natural Sciences Engineering Research Council of Canada (JYT), and Diabetes UK (LCH, 11/0004175). RNC was funded by a Wellcome Trust Investigator award (WT100981/z/13/z) to NMM. Microarray hybridizations were performed by the OXION array facility. FISH confocal images were acquired by Matt Pearson (IGMM advanced imaging support team). We would like to thank Ava Khamseh (IGMM) for normalisation of the metabolomics data and Andrew Dodd for critical reading of the manuscript.
Copyright
© 2019, Sirey et al.
This article is distributed under the terms of the Creative Commons Attribution License, which permits unrestricted use and redistribution provided that the original author and source are credited.
Metrics
-
- 5,315
- views
-
- 755
- downloads
-
- 54
- citations
Views, downloads and citations are aggregated across all versions of this paper published by eLife.
Citations by DOI
-
- 54
- citations for umbrella DOI https://doi.org/10.7554/eLife.45051
Download links
A two-part list of links to download the article, or parts of the article, in various formats.
Downloads (link to download the article as PDF)
Open citations (links to open the citations from this article in various online reference manager services)
Cite this article (links to download the citations from this article in formats compatible with various reference manager tools)
The long non-coding RNA Cerox1 is a post transcriptional regulator of mitochondrial complex I catalytic activity
eLife 8:e45051.
https://doi.org/10.7554/eLife.45051


